
Abstract
Aims: The aim of this study was to validate novel software to calculate vessel fractional flow reserve (vFFR) based on 3D-QCA and to assess inter-observer variability in patients who underwent routine preprocedural FFR assessment for intermediate coronary artery stenosis.
Methods and results: In vitro validation was performed in an experimental model. Clinical validation was performed in an observational, retrospective, single-centre cohort study. A total of 100 patients presenting with stable angina or non-ST-segment elevation myocardial infarction and an indication to perform FFR between January 2016 and October 2016 were included. vFFR was calculated based on the aortic root pressure along with two angiographic projections and validated against pressure wire-derived FFR. Mean FFR and vFFR were 0.82±0.08 and 0.84±0.07, respectively. A good linear correlation was found between FFR and vFFR (r=0.89; p<0.001). Assessment of vFFR had a low inter-observer variability (r=0.95; p<0.001). The diagnostic accuracy of vFFR in identifying lesions with an FFR ≤0.80 was higher as compared with 3D-QCA: AUC 0.93 (95% CI: 0.88-0.97) vs 0.66 (95% CI: 0.55-0.77), respectively.
Conclusions: The 3D-QCA-derived vFFR has a high linear correlation to invasively measured FFR, a high diagnostic accuracy to detect FFR ≤0.80 and a low inter-observer variability.
Introduction
Invasive coronary angiography has served as the cornerstone for the diagnosis of patients with known or suspected coronary artery disease (CAD). Unfortunately, the technique is limited in its ability to assess the haemodynamic impact of intermediate coronary artery stenosis resulting in underestimation or overestimation of disease severity1. In order to overcome this limitation, fractional flow reserve (FFR) has emerged as the mainstay of functional haemodynamic lesion assessment and is presently regarded as the gold standard for identifying stenoses that cause myocardial ischaemia2,3,4,5. Despite indisputable evidence supporting the benefit of FFR to guide clinical decision making, adoption into daily practice has been limited. FFR assessment requires the use of a (costly) pressure wire or microcatheter along with the administration of a hyperaemic agent associated with temporary patient discomfort6. Although non-hyperaemic pressure ratios (NHPR) such as instantaneous wave-free ratio (iFR), resting full-cycle ratio (RFR) and diastolic pressure ratio (dPR) have emerged as adenosine-free faster and easier methods to achieve physiologic assessment, the need for a costly pressure wire remains a fact7,8,9.
The Fast Assessment of STenosis severity (FAST) study aimed to validate a new three-dimensional quantitative coronary angiography (3D-QCA)-based software to calculate vessel FFR (vFFR) using phantom models. In addition, we correlated this index with pressure wire-derived FFR in a consecutive series of patients and studied inter-observer variability.
Methods
IN VITRO EXPERIMENTAL MODEL
An in vitro experimental model was developed for technical validation of the calculation method performed by the CAAS Workstation 8 (Pie Medical Imaging, Maastricht, the Netherlands) in phantoms. The experimental set-up consists of a chamber, a water-driven systemic circulation and coronary circulation10. The chamber mimics the left ventricle and artificial valves mimic the mitral and aortic valves of the heart (Figure 1). The piston is powered by a computer-controlled linear motor (ETB32; Parker Hannifin Corp., Wadsworth, OH, USA) creating pulsatile flow at 75 beats per minute. For non-pulsatile flow, a constant flow pump (2035; Verder Liquids, Vleuten, the Netherlands) fills a higher placed reservoir, with overflow function; the output of the reservoir connects to the mitral valve. A polyurethane tube models the aorta, and input impedance characterises the systemic circulation behaviour. Flow through the aorta was set at approximately 5 l/min and measured using an ultrasound flow probe (Transonic 28PAU, with TS 410 flowmeter; Transonic, Ithaca, NY, USA). The distal systemic compliance is modelled using the Windkessel principle, resulting in physiological pressure conditions.
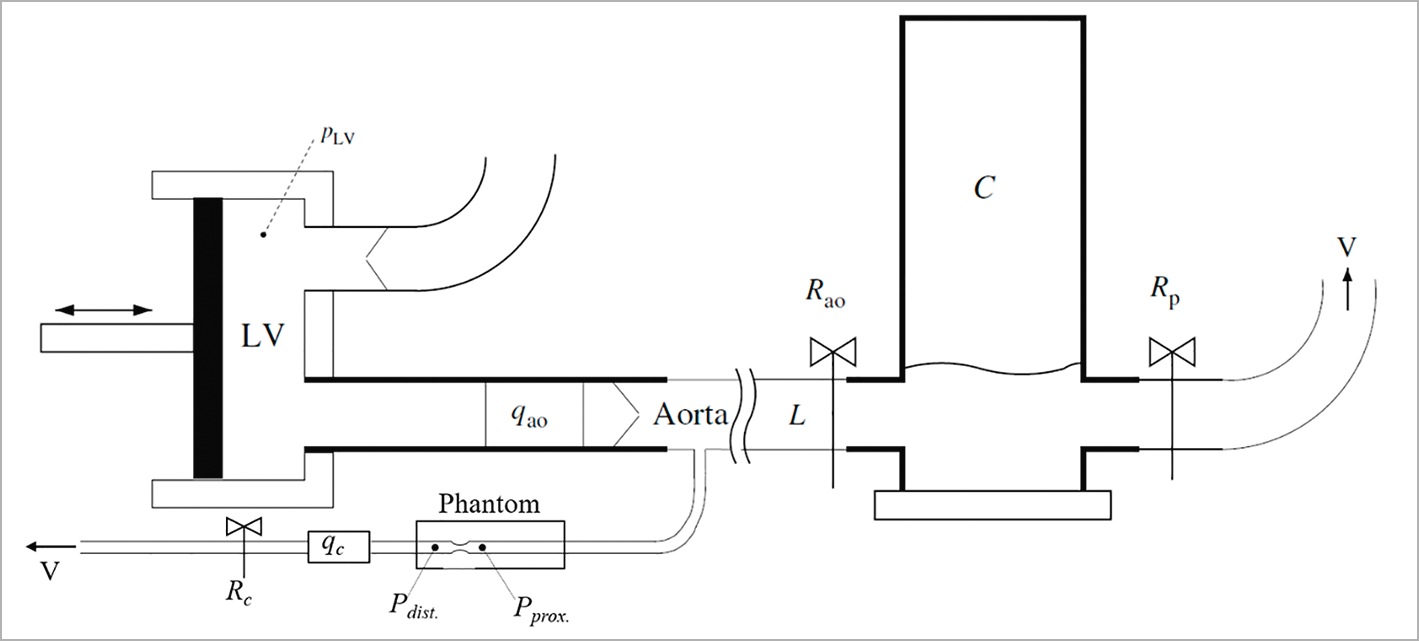
Figure 1. Schematic of the in vitro experimental model. The LV chamber pumps water through the aortic flow probe (qao) and the artificial valve into the aorta and from the aorta into the systemic Windkesssel components (Rao, L, C and Rp). A tube, representing the coronary artery, branches off the aorta, passes the phantom and the coronary flow probe (qc) towards a venous outlet (V). The pressure sensors are positioned proximal (Pprox.) and distal (Pdist.) to the lesion in the phantom, and the flow (qc) is measured at the outflow tract of the phantom. The flow through the phantom is controlled by the resistance (Rc) in the outflow tract.
CORONARY CIRCULATION
The in vitro coronary circulation comprised a tube (8 mm diameter) connected to the ostium of the aorta with a phantom attached at the end of this tube. The phantom consisted of an 8 mm tube with a 75% sinusoidal diameter stenosis (Model: QA-STV; Simutec, London, ON, Canada). A resistance was placed at the outflow tract of the phantom to control the amount of flow through the phantom. The diameters of the tubes in the phantom are relatively large compared to human coronary artery dimensions11. To simulate significant pressure drop along the lesion, the average flow through the phantom was set higher as compared to physiological coronary flow, i.e., to an average of 100, 200, 300 and 400 ml/min for both pulsatile flow and constant flow12 with Reynolds numbers of 1061, 2122, 3183 and 4244 for the stenotic segments and 265, 531, 796 and 1061 for healthy segments, respectively. The proximal and distal pressures to the lesion were measured simultaneously with two pressure wires (Certus™ 12006; St. Jude Medical, [now Abbott Vascular], St. Paul, MN, USA). The flow rate through the phantom was registered by an electromagnetic flow probe. The pressure drop was based on the difference between the measured pressures distal and proximal to the lesion. Measurements were averaged over four cycles during pulsatile flow, and the same period was used for averaging during constant flow.
PRESSURE DROP COMPUTATION METHODS
The pressure drop over the phantom lesions was computed using two different approaches: 1) computational fluid dynamics (CFD) being considered a reference standard in blood flow simulations13, and 2) by using CAAS Workstation 8.0. A 3D surface mesh, corresponding to the geometry between the locations of the two pressure wires, was used for calculating the pressure drop by both approaches. Viscosity differences of water against blood were taken into consideration. The CFD approach uses a tetrahedron mesh with a mesh resolution adapted to specific vessel geometry and wall irregularities, resulting in tetrahedron edge lengths varying between 0.05 and 0.8 mm. Furthermore, three boundary layers were introduced to capture the blood flow close to the wall. The thickness of the boundary layers was calculated based on flow, viscosity, density and Reynolds number. Using the mesh, the CFD approach modelled flow using Navier-Stokes equations (Kratos; Multiphysics 5, version 20). The following boundary conditions were applied: a constant parabolic flow profile at the inlet and a stress-free outlet (zero pressure)14. Further, rigid-wall, non-slip conditions, and a Newtonian fluid approximation were used.
The CAAS Workstation 8.0 used for the experimental model was adapted to allow importing a 3D geometry of the phantom. A single flow was applied (fixed flow value over time) to both computational approaches, to eliminate time variation in flow profile and pressure drop. In total, four experiments with different flow values were performed. The experiment showed that the average pressure drop using the pulsatile flow cycle provides similar results to when using constant flow (which equals the average of the pulsatile flow cycle). This observation justified the application of a single flow value for the computation approaches. The pressure drops obtained by both pulsatile and constant flow for the different flow values were compared to the computed pressure drop values of both the CFD approach and CAAS Workstation vFFR (Figure 2).
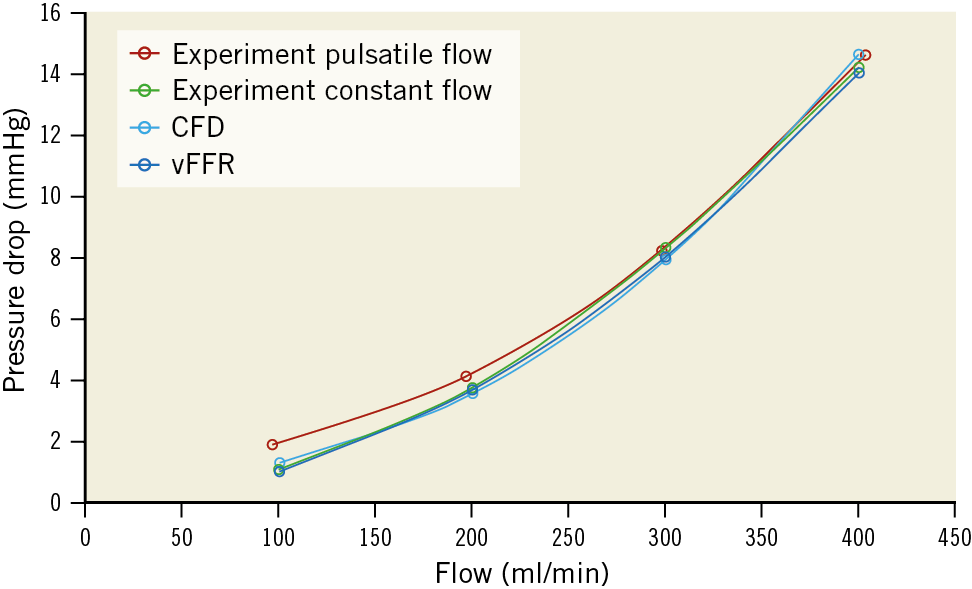
Figure 2. Pressure drop resulting from pressure measurements during pulsatile flow (red line) and constant flow (green line) as well as the computed pressure drop by the computational fluid dynamics (CFD) (light blue) and CAAS Workstation vFFR (dark blue).
CLINICAL VALIDATION STUDY
STUDY DESIGN AND PATIENT POPULATION
The FAST (Fast Assessment of STenosis severity) study is an observational, retrospective, single-centre cohort study in which offline computation of vFFR as compared with conventional invasive FFR (Aeris™; St. Jude Medical) was studied. From January 2016 to October 2016, patients ≥18 years of age presenting with stable coronary artery disease or non-ST-elevation acute coronary syndrome (ACS) who underwent pre-PCI FFR assessment were eligible. The angiographic inclusion criterion was at least one intermediate stenosis in one of the epicardial coronary arteries (diameter stenosis of 30-70% by visual assessment). Exclusion criteria were FFR measurements with damped pressure curves, patients with ST-elevation myocardial infarction (STEMI) or lesions containing thrombus, left main lesions, grafts, arteries with collaterals, cardiogenic shock or severe haemodynamic instability and adenosine intolerance.
PROCEDURE PROTOCOL
Procedures were performed according to standard local clinical practice. Angiographic lesion severity was assessed by two monoplane angiographic projections (at least 30 degrees apart, preferably orthogonal) after a bolus of 200 mcg nitroglycerine. Hyperaemia during FFR measurement was achieved by continuous infusion of adenosine at a rate of 140 μg/kg/min through an antecubital vein for at least two minutes. Angiograms and pressure waveforms were stored as DICOM images for offline analysis. Aortic root pressure was constantly recorded. The last blood pressure measurement taken before the start of the FFR measurement was used as input in the CAAS/vFFR software.
PATIENT SELECTION, 3D CORONARY RECONSTRUCTION AND COMPUTATION OF vFFR
Figure 3 represents a flow chart showing all included and excluded patients.
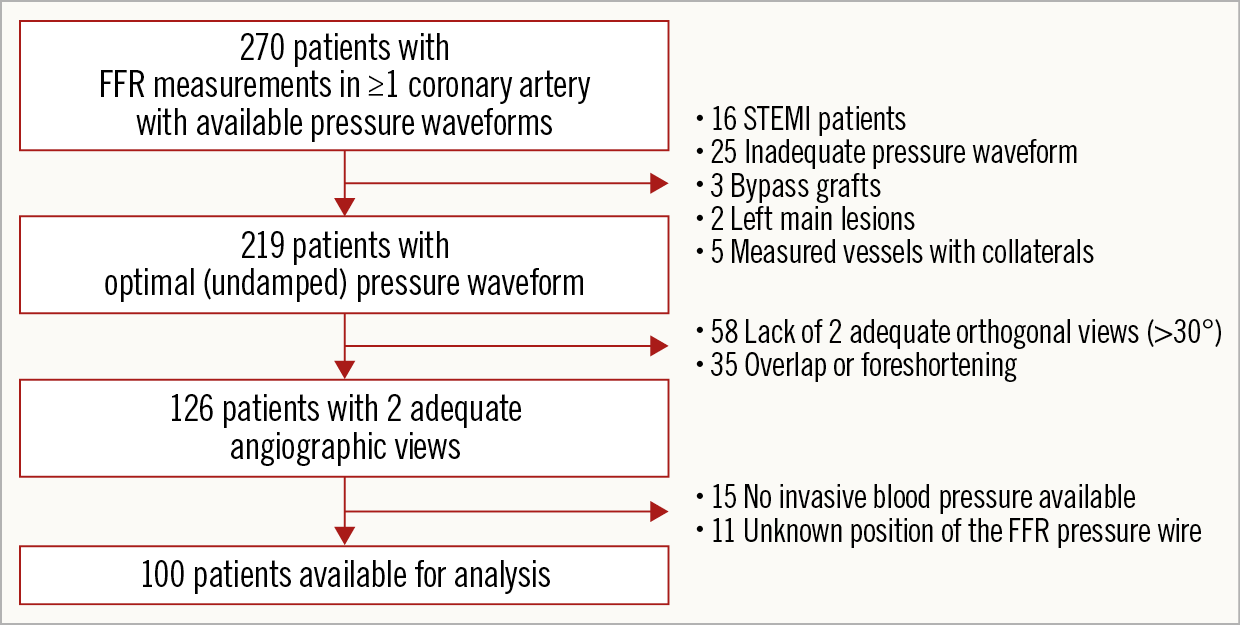
Figure 3. Flow chart of all included and excluded patients.
Computation of vFFR was performed offline and assessed in a blinded fashion by two independent observers to assess inter-observer variability (K. Masdjedi, M.M. Balbi). A total of three two-dimensional images were exported to the CAAS Workstation 8.0: two views with at least 30° differences in rotation/angulation to create a 3D reconstruction of the coronary artery and one view to ascertain the position of the FFR pressure wire. Angiograms were recorded visualising the entire vessel, taking into account overlapping and foreshortening to create a 3D reconstruction of the coronary artery as accurately as possible. The two independent observers used the same cine images for the calculation of vFFR. Although temporal alignment of the cardiac cycle between the two angiograms was performed automatically by ECG triggering, manual frame selection was allowed. Contour detecting was performed semi-automatically, delineating the vessel contour from the ostium to the position at which the pressure wire sensor was positioned (3 cm from the tip). As such, both final frame selection and contour corrections were left to the discretion of the observer. The percent diameter stenosis (DS), minimal lumen diameter (MLD), reference lumen diameter, minimal lumen area and lesion length were measured from the same 3D model as that on which the vFFR was determined. The lesion segment was defined as proximal, mid or distal. vFFR was calculated automatically, incorporating the invasively measured aortic root pressure and automatically generated 3D-QCA values and vFFR along the entire vessel instantaneously (Figure 4).
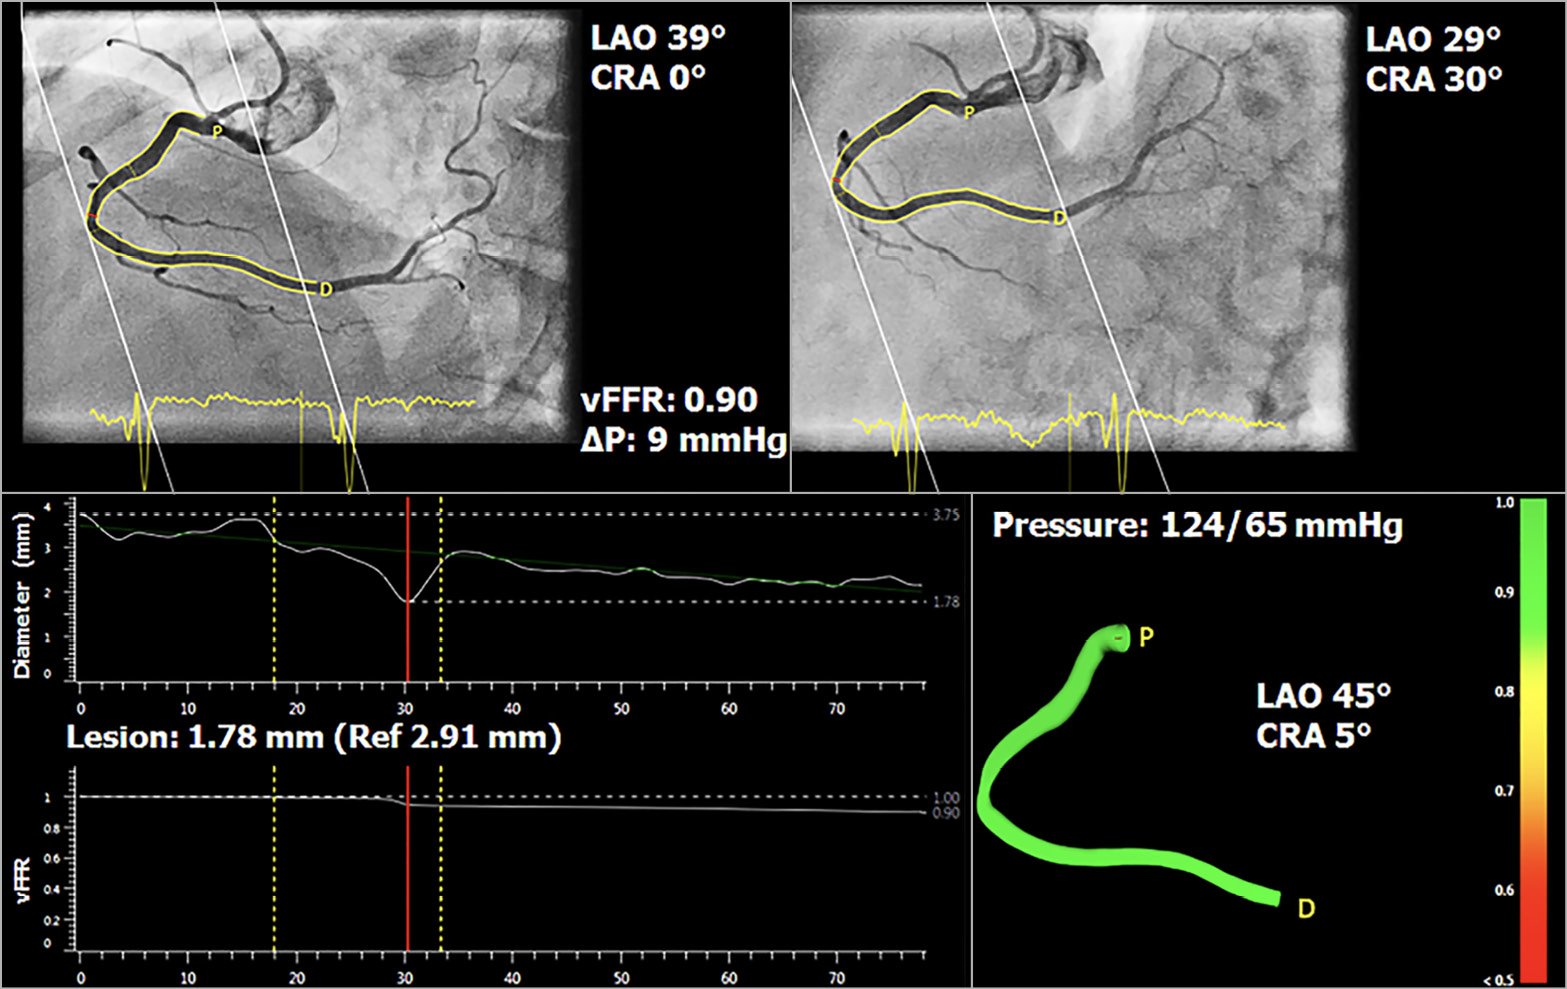
Figure 4. Three-dimensional reconstruction of coronary artery and computation of vessel FFR, using two angiographic projections at least 30 degrees apart and invasively measured aortic root pressure.
Within the CAAS Workstation vFFR, the pressure drop is calculated instantaneously by applying physical laws including viscous resistance and separation loss effects present in coronary flow behaviour, as described by Gould et al and Kirkeeide15,16. The methods, however, are based on a single angiographic projection. Within CAAS vFFR, the geometry of the coronary artery is derived from well-validated 3D reconstructions17,18, which reduces the effects of foreshortening, out-of-plane magnification and non-symmetric coronary lesions. Furthermore, the pressure drop calculation by CAAS vFFR includes patient-specific aortic pressure, as measured during the catheterisation procedure. Maximum hyperaemic blood flow was empirically determined from clinical data and we assumed that proximal coronary velocity is preserved along the coronary of interest which is adapted based on the patient-specific aortic rest pressure and the 3D geometry of the coronary artery.
STATISTICAL ANALYSIS
Continuous variables are presented as mean±standard deviation. All continuous variables were normally distributed. Categorical variables are expressed as counts and percentages. All statistical tests were two-tailed. Pearson’s correlation coefficient (r) was used to assess the relationship between FFR and vFFR and to assess inter-observer variability. Agreement between the indices and the inter-observer reliability were assessed by Bland-Altman plots with corresponding 95% limits of agreement. Receiver operating characteristic (ROC) area under the curve (AUC) analysis was used to estimate the diagnostic performance of vFFR as compared to the wire-based FFR threshold of ≤0.80. Statistical analysis was carried out using the SPSS statistical package, Version 24 (IBM Corp., Armonk, NY, USA).
Results
PRECLINICAL DATA
Pulsatile flow-based pressure measurements corresponded well with pressure drops obtained by constant flow (0.36±0.37 mmHg, r>0.99; p=0.002) (Figure 2). This supported the assumption of applying a single flow value for the computational approaches. The CFD pressure drop results showed excellent agreement with the experimental pulsatile and constant flow (-0.36±0.28 mmHg and 0.01±0.38 mmHg, respectively, r>0.99; p<0.002), as well as the CAAS Workstation vFFR pressure drop results (0.52±0.28 mmHg and -0.16±0.11 mmHg, respectively, r>0.99; p<0.002). The difference between CFD and vFFR was -0.17±0.34 mmHg with excellent agreement (r>0.99; p<0.002).
CLINICAL DATA
PATIENT DEMOGRAPHICS AND PROCEDURAL DATA
One hundred patients were included. Mean age was 64±11 years, 67% were male and 26% had diabetes. The majority of the FFR measurements were performed in the left anterior descending artery (60%). The circumflex artery and right coronary artery were involved in 13% and 27% of the cases, respectively. Mean angiographic percent DS, lesion length and MLD, measured from 3D-QCA, were 37±13%, 20±13 mm and 1.7±0.3 mm, respectively (Table 1).
CORRELATION AND AGREEMENT BETWEEN FFR AND vFFR
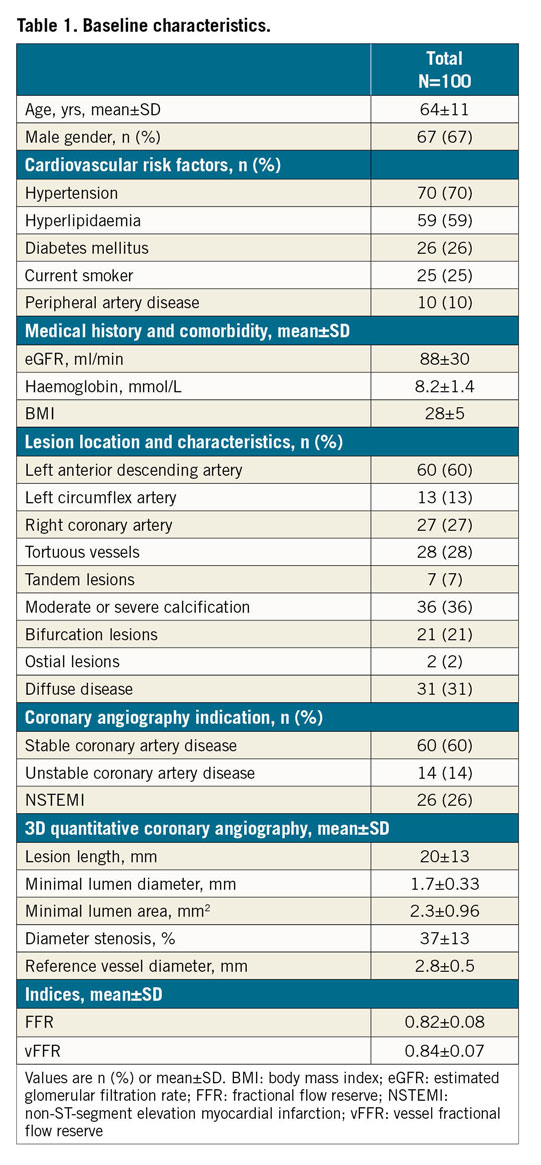
Mean FFR and vFFR were 0.82±0.08 and 0.84±0.07, respectively. A good linear correlation was found between FFR and vFFR (r=0.89; p<001). Sensitivity analysis of patients presenting with ACS versus stable patients showed no differences in correlation between FFR and vFFR (r=0.89 vs 0.89, respectively). Assessment of vFFR had a low inter-observer variability (r=0.95; p<0.001) (Figure 5). vFFR had a good accuracy in the identification of patients with significant FFR values ≤0.80 (AUC of 0.93 [95% CI: 0.88-0.97]) (Figure 6). The diagnostic accuracy of 3D-QCA, based on percentage DS, was lower as compared to the diagnostic accuracy of vFFR (AUC of 0.66 [95% CI: 0.55-0.77]).
Figure 5. Scatter plots showing the relationship between vFFR versus wire-based FFR (A) and inter-observer variability (B) and Bland-Altman plots of differences against the means. The mean bias is represented by the solid red line and the 95% confidence interval is represented by the dashed lines.
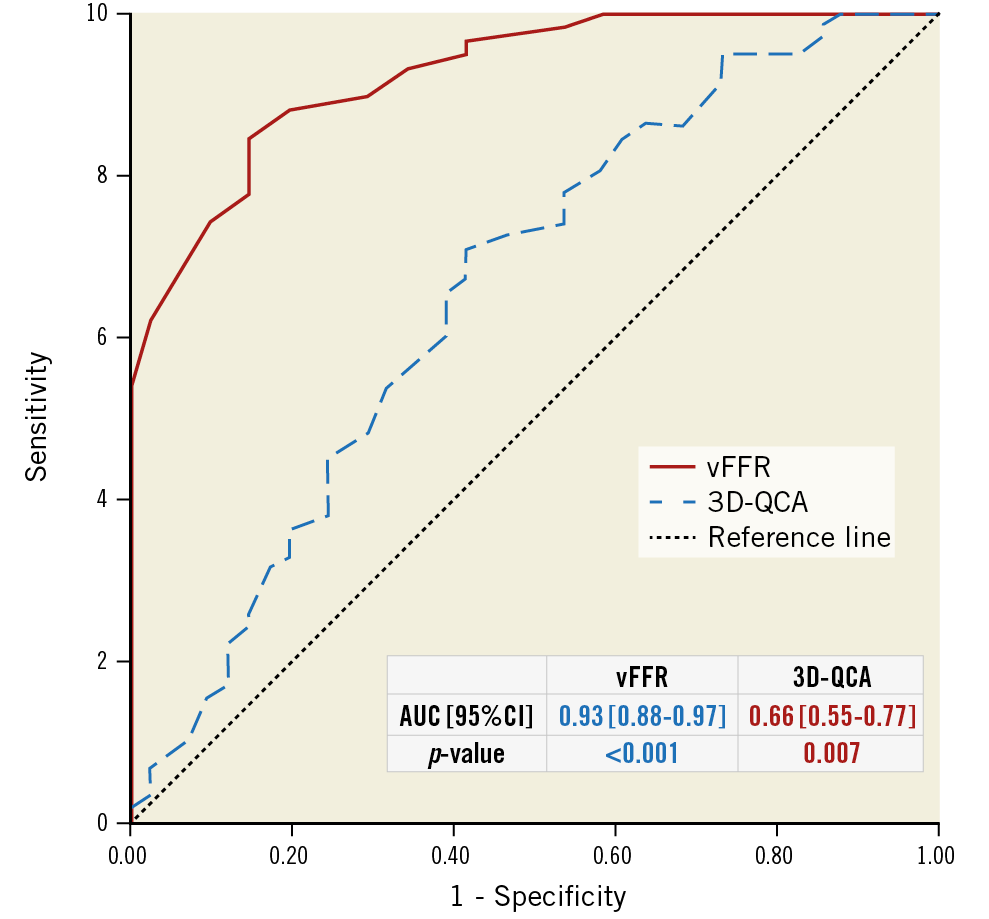
Figure 6. ROC curves for vFFR and 3D-QCA. Comparison is made with a wire-based FFR at a cut point of 0.80.
Discussion
The FAST study confirmed the feasibility of novel 3D-QCA-based software to calculate FFR without the use of a pressure wire or microcatheter. In the preclinical technical validation model, vFFR proved to have a strong correlation with CFD and measured flow parameters. In our clinical validation study, we confirmed a good agreement and high diagnostic accuracy of vFFR as compared to invasively measured FFR. Finally, we showed that vFFR had a low inter-observer variability.
In the past decade, a wealth of data has become available demonstrating the superiority of FFR-guided PCI as compared to angiography-guided PCI4,5,19. FFR subsequently received strong recommendations in the current revascularisation guidelines3,20. Even though the use of FFR proved to be contrast-saving, cost-effective and associated with improved quality of life, FFR is still not being performed in the vast majority of cases3,5,19,20. This has been hypothesised to be due to the need (in some countries) for expensive hyperaemic agents with known adverse events such as dyspnoea and arrhythmias and/or intolerance due to pulmonary disease and the use of a costly pressure wire6. More recently, the advent of adenosine-free non-hyperaemic pressure ratios proved to be a valuable alternative to FFR. The need for a dedicated pressure wire, however, still remains. For these reasons, the search for cheaper, faster and more patient-friendly methods to assess coronary physiology remains imperative.
One of the first studies assessing the potential of angiography-based functional lesion assessment was published by Papafaklis et al, in which the CAAS 3D-QCA was used to calculate a virtual functional assessment index (vFAI)21 by following the concepts as introduced by Gould et al, reporting that pressure drop was linked to flow using linear and quadratic terms (ΔP=fvQ + fsQ²)22. In order to compute the vFAI, the authors first solved the fv and fs parameters from the artery-specific quadratic equation by performing two separate CFD simulations using the geometry based on 3D-QCA. In both CFD simulations, the arterial wall was considered to be rigid and no-slip conditions were applied at the vessel wall, while a reference pressure of 100 mmHg was imposed as a boundary condition at the inlet and steady flow (fully developed laminar, and incompressible blood flow) was imposed at the outlet. One CFD simulation was performed with a steady flow of 1 ml/sec (corresponding to the average flow at rest) and one CFD simulation was performed with a steady flow of 3 ml/sec (corresponding to the average flow during hyperaemia). After solving fv and fs parameters, the vFAI was computed as the ratio of the area under the curve (Pd/Pa=1−ƒv Q/Pa−ƒs Q2/Pa) for a flow range from 0 to 4 ml/sec. The vFAI estimates the overall behaviour of the artery/stenosis-specific Pd/Pa versus flow relationship and is not identical to FFR. This approach bypasses the need to derive a patient-specific blood flow within the coronary of interest. CAAS vFFR calculates the true pressure drop using patient-specific aortic pressure and estimates a single patient-specific coronary blood flow used for each pressure drop calculation.
Several recent studies have assessed the potential value of 3D-QCA-based FFR23,24,25. In the VIRTU-1 study24, Morris et al developed a computer model that accurately predicted virtual FFR from angiographic images alone assuming 3D reconstruction, using a Philips workstation. A good correlation (r=0.84) of virtual FFR was found with invasive FFR. However, the technology used lengthy CFD analysis, hampering direct clinical applicability.
More recent studies have validated easier methods using contrast flow models to calculate 3D-QCA-based FFR by using frame counting25,26. The FAVOR Pilot Study assessed the diagnostic accuracy of quantitative flow ratio (QFR) as measured offline in three different ways, based on the different mean hyperaemic flow velocities26. The authors observed a good agreement with FFR and a high diagnostic accuracy for identifying a positive FFR (FFR <0.80). Comparable results were recently found in the FAVOR II China Study, in which online QFR had a high feasibility and accuracy in identifying haemodynamically significant coronary artery stenosis25. In both studies, QFR was performed using a prototype software package (QAngio XA 3D prototype; Medis Medical Imaging Systems, Leiden, the Netherlands). However, the contrast flow models by QAngio have several limitations.
Coronary flow velocity is a highly sensitive variable which is influenced by clinical and haemodynamic parameters such as heart rate, blood pressure, left ventricular end-diastolic pressure, left and/or right ventricular hypertrophy and systemic diseases such as diabetes mellitus, large vessel disease, etc.27,28. It is well known that coronary perfusion occurs mainly during diastole. This implies that coronary velocity is not constant during the entire cardiac cycle and therefore passage of contrast agent might be different in systole and diastole. In addition, there are phasic changes in resistance. The perfusion of the left coronary artery (LCA) is predominantly diastolic while the perfusion of the right coronary artery (RCA) is both systolic and diastolic, due to lower pressure in the right ventricle as compared with the left ventricle. Therefore, one could assume differences while using frame count methods to obtain pressure gradients in the left versus the right coronary artery. Unfortunately, no inter-observer or inter-study variability was reported in both FAVOR studies. In contrast, in the present study, we demonstrated an excellent inter-observer variability (r=0.95; p<0.001).
The mean QCA-based DS in the FAVOR II China Study was 46.5% and about 34% of the measured lesions had an FFR ≤0.80. A discrepancy could be appreciated between the relatively low mean QCA-based DS (37%) and the percentage of vFFR values ≤0.80. Part of the discrepancy can be explained by the fact that the presented QCA figures and percentage diameter stenoses were based on 3D assessment which is per definition lower than the conventional 2D percentages29. Additionally, there have been several reports about the discordance between anatomical and functional assessment of coronary lesions being far from rare30,31,32.
Despite the relatively low % DS in the present study, 42% of the patients had an FFR ≤0.80 which was comparable to the results of the FFRangio Accuracy versus Standard FFR (FAST-FFR) study (43% of FFR values were ≤0.80)23. The FAST-FFR study was a prospective, multicentre, international trial demonstrating that the FFRangio™ System (CathWorks, Kfar-Saba, Israel) had a high sensitivity, specificity and accuracy in providing functional angiographical mapping of the entire coronary tree as compared with the pressure wire-based FFR.
The FAST study is the first validation study of CAAS vFFR with a limited sample size and offline assessment of vFFR. Clinical outcome studies should be obtained to assess the value of vFFR measured by CAAS Workstation for the haemodynamic assessment of lesion severity in daily clinical practice.
Limitations
Our study has several limitations. First, it is a single-centre experience in which we restricted our analyses to those recordings with undamped pressure waveforms. Previous work showed the high prevalence of suboptimal FFR curves in clinical practice (up to 30%), suggesting an additional benefit when using techniques based on angiography and simplified flow models33. Second, the software’s accuracy in complex vessels, e.g., bifurcations and diffusely diseased vessels, remains to be determined in larger patient cohorts. Furthermore, as mentioned in the Methods section, contour detection was performed semi-automatically. Finally, although vFFR calculation was performed by two independent observers, there was no independent core laboratory involved. Independent core laboratory adjudication of vFFR will be performed in the ongoing international multicentre FAST II study.
Conclusions
vFFR based on 3D-QCA as determined using novel software has a high linear correlation to invasively measured FFR, a high diagnostic accuracy to detect FFR ≤0.80 along with a low inter-observer variability.
|
Impact on daily practice There is a clear need to simplify the use of coronary physiology in order to increase its uptake in daily clinical practice. Once vFFR technology becomes more widely available, it might fundamentally change the way both diagnostic coronary angiography and PCI are performed. |
Funding
Institutional research support from Pie Medical Imaging.
Conflict of interest statement
K. Masdjedi reports institutional research grant support from ACIST Medical. L.J.C. van Zandvoort reports institutional research grant support from ACIST Medical. J. Daemen reports institutional research support from ACIST Medical, Boston Scientific, Abbott Vascular and Medtronic, and consultancy fees from PulseCath, Medtronic, ACIST Medical, and ReCor Medical. N. Van Mieghem reports research grant support from Edwards, Medtronic, Abbott, Boston Scientific, PulseCath, ACIST Medical and Essential Medical. The other authors have no conflicts of interest to declare.
Supplementary data
To read the full content of this article, please download the PDF.