Abstract
Aims: Randomised controlled trials have reported instantaneous wave-free ratio (iFR) to be non-inferior to fractional flow reserve (FFR) for major adverse cardiovascular events at one year; however, iFR is limited by sensitive landmarking of the pressure waveform, and the assumption that maximal flow and minimal resistance occur during a fixed period of diastole. We sought to validate the resting full-cycle ratio (RFR), a novel non-hyperaemic index of coronary stenosis severity based on unbiased identification of the lowest distal coronary pressure to aortic pressure ratio (Pd/Pa), independent of the ECG, landmark identification, and timing within the cardiac cycle.
Methods and results: VALIDATE-RFR was a retrospective study designed to derive and validate the RFR. The primary endpoint was the agreement between RFR and iFR. RFR was retrospectively determined in 651 waveforms in which iFR was measured using a proprietary Philips/Volcano wire. RFR was highly correlated to iFR (R2=0.99, p<0.001), with a mean bias of –0.002 (95% limits of agreement –0.023 to 0.020). The diagnostic performance of RFR versus iFR was diagnostic accuracy 97.4%, sensitivity 98.2%, specificity 96.9%, positive predictive value 94.5%, negative predictive value 99.0%, area under the receiver operating characteristic curve of 0.996, and diagnostically equivalent within 1% (mean difference –0.002; 95% CI: –0.009 to 0.006, p=0.03). The RFR was detected outside diastole in 12.2% (341/2,790) of all cardiac cycles and 32.4% (167/516) of cardiac cycles in the right coronary artery where the sensitivity of iFR compared to FFR was lowest (40.6%).
Conclusions: RFR is diagnostically equivalent to iFR but unbiased in its ability to detect the lowest Pd/Pa during the full cardiac cycle, potentially unmasking physiologically significant coronary stenoses that would be missed by assessment dedicated to specific segments of the cardiac cycle.
Abbreviations
DA: diagnostic accuracy
DPR: diastolic pressure ratio
ECG: electrocardiogram
FFR: fractional flow reserve
iFR: instantaneous wave-free ratio
MACE: major adverse cardiovascular events
NPV: negative predictive value
Pa: aortic pressure
PCI: percutaneous coronary intervention
Pd: diastolic pressure
Pd/Pa: distal coronary pressure to aortic pressure ratio
PPV: positive predictive value
RCA: right coronary artery
RFR: resting full-cycle ratio
ROC: receiver operating characteristic
Sn: sensitivity
Sp: specificity
Introduction
Fractional flow reserve (FFR) measurement under hyperaemic conditions has been the gold standard for invasively determining the physiologic significance of coronary artery disease1. FFR has been validated in several clinical outcome studies as a way of optimising case selection for percutaneous coronary intervention (PCI)1,2. Recently, two large-scale randomised controlled trials using a non-hyperaemic resting measurement for physiological assessment of moderate coronary stenoses, the instantaneous wave-free ratio (iFR), reported non-inferiority for major adverse cardiovascular events (MACE) comparing iFR to FFR at one-year follow-up3,4. These studies demonstrated a statistically significant reduction in patient discomfort and in cost by avoiding adenosine. However, iFR has a number of inherent limitations including sensitive automated landmarking of components of the pressure waveform and the assumption that maximal flow and minimal resistance during resting conditions occur during a precise period within diastole, which previous evidence contests5-7.
Here we aimed to validate a novel hyperaemia-free resting measure of pressure at the point of absolute lowest resting diastolic pressure (Pd) to aortic pressure (Pa) ratio (Pd/Pa) during the cardiac cycle, the resting full-cycle ratio (RFR). The RFR represents the maximal relative pressure difference in the cardiac cycle completely independent of the ECG and irrespective of systole or diastole, thus being an unbiased physiological assessment of coronary artery stenosis.
Methods
STUDY DESIGN
VALIDATE-RFR was a post hoc analysis of individual subject data. First, the optimal cut-off for RFR versus FFR (≤0.80) was derived using 633 waveforms from the VERification of Instantaneous Wave-Free Ratio and Fractional Flow Reserve for the Assessment of Coronary Artery Stenosis Severity in EverydaY Practice (VERIFY)8 and Can Contrast Injection Better Approximate FFR Compared to Pure Resting Physiology? (CONTRAST)9 studies. Second, RFR agreement with iFR (≤0.89) was validated using 651 waveforms from the Comparative Study of Resting Coronary Pressure Gradient, Instantaneous Wave-Free Ratio and Fractional Flow Reserve in an Unselected Population Referred for Invasive Angiography (VERIFY 2) study10 and the Interventional Cardiology Research Incooperation Society Fractional Flow Reserve (IRIS-FFR) registry11. The institutional review board of each participating centre approved the respective study protocols; all subjects provided written informed consent.
PARTICIPANTS
Patients with one or more intermediate coronary lesions in which FFR measurement and/or iFR measurements were performed with a 0.014-inch pressure sensor guidewire were included. In the derivation cohort, 427 patients from CONTRAST and 206 patients from VERIFY with both resting measurement of Pd/Pa and hyperaemic FFR (PressureWire™ Certus™; St. Jude Medical, St. Paul, MN, USA) were included in the study. In the validation cohort, 395 measurements from the IRIS-FFR registry and 256 measurements from the VERIFY 2 study with both iFR and hyperaemic FFR (PrimeWire Prestige® or Verrata®; Philips Volcano, Rancho Cordova, CA, USA) were included. In the validation cohort, iFR measurements were performed exclusively using commercial devices from Philips Volcano and the RFR measured retrospectively on waveforms acquired from the Philips Volcano system. Inclusion and exclusion criteria of the individual studies are included in Supplementary Appendix 1.
DATA ANALYSIS
RFR methodology was co-developed by Abbott Vascular (Santa Clara, CA, USA) and Coroventis Research AB (Uppsala, Sweden). The pressure waveform tracings were reviewed and quality controlled in their original studies according to the criteria described in the individual studies and are summarised in Supplementary Appendix 2. All pressure waveform recordings from the respective study cohorts were anonymised, and RFR was calculated from each individual waveform using a fully automated off-line software algorithm (CoroLab; Coroventis Research AB, Uppsala, Sweden) following standardisation of the pressure sampling rate to 100 Hz.
To calculate RFR, instantaneous Pd/Pa was measured continuously throughout the cardiac cycle. A minimum of four, but preferentially five, consecutive heart cycles were needed to determine the RFR. To eliminate signal artefacts inherent to subcycle measurement, a low-pass filter was applied to the phasic Pd/Pa. The RFR was defined as the point at which the ratio of Pd and Pa was lowest during the entire cardiac cycle (Figure 1).
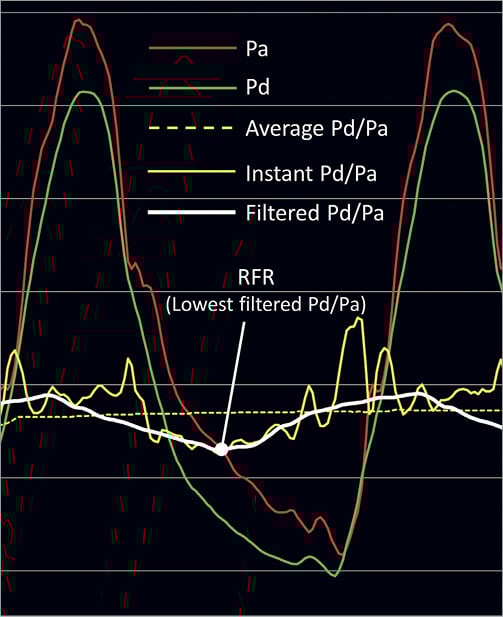
Figure 1. Resting full-cycle ratio. To calculate resting full-cycle ratio (RFR), Pd/Pa is measured continuously throughout the cardiac cycle. To eliminate signal artefacts inherent to sub-cycle measurement, a low-pass filter is applied to the phasic Pd/Pa. The RFR is defined as the point at which the relative difference in the diastolic pressure (Pd) and the aortic pressure (Pa) is greatest (lowest Pd/Pa ratio) during the entire cardiac cycle.
The optimal binary cut-off for RFR was determined using the receiver operating characteristic (ROC) curve and diagnostic accuracy (DA), sensitivity (Sn), and specificity (Sp) of RFR versus FFR in the derivation cohort. The FFR threshold to detect clinical significance was ≤0.80 and Pd/Pa ≤0.91. The primary endpoint was the agreement of RFR and iFR in the validation cohort, using the optimal binary RFR cut-off value previously determined. Secondary endpoints included correlations of RFR, iFR and basal Pd/Pa as well as comparisons of DA, Sn, Sp, positive predictive value (PPV), and negative predictive value (NPV).
STATISTICAL ANALYSIS
Categorical variables are presented as counts and percentages. Continuous patient and procedural characteristics are presented as mean and standard deviation. Distributions of physiological assessments are reported by median and interquartile range. Correlations are summarised by linear regression models and the coefficient of determination (R2). Systematic differences are assessed by Bland-Altman analysis. ROC analysis was performed to examine the agreement of RFR using FFR ≤0.80, iFR ≤0.89 and Pd/Pa ≤0.91 as reference standards and an optimal cut-off was determined using Youden’s index. Diagnostic agreement between RFR and iFR was tested by Cohen’s kappa statistic, and equivalence testing between RFR and FFR was performed using a two-one-sided test (TOST) with a 1% margin for error. A p-value <0.05 was considered statistically significant. Statistical analyses were performed with R, version 3.4.2 (R Foundation for Statistical Computing, Vienna, Austria)12.
Results
RFR DERIVATIONS
The derivation cohort consisted of 633 waveform measurements from 633 patients. The median FFR was 0.78 (interquartile range [IQR] 0.70–0.84) and the median RFR was 0.87 (IQR 0.80–0.92) (Supplementary Figure 1). Using a ROC curve analysis (area under the curve [AUC] 0.86; 95% confidence interval [CI]: 0.83-0.89, p<0.001), the optimal binary cut-off for RFR compared to FFR was 0.89 (Figure 2A). Comparison of diagnostic accuracy, sensitivity and specificity for a range of cut-off values confirmed 0.89 as the optimal cut-off, where the diagnostic accuracy was 0.78, sensitivity 0.84, and specificity 0.69 (Figure 2B).
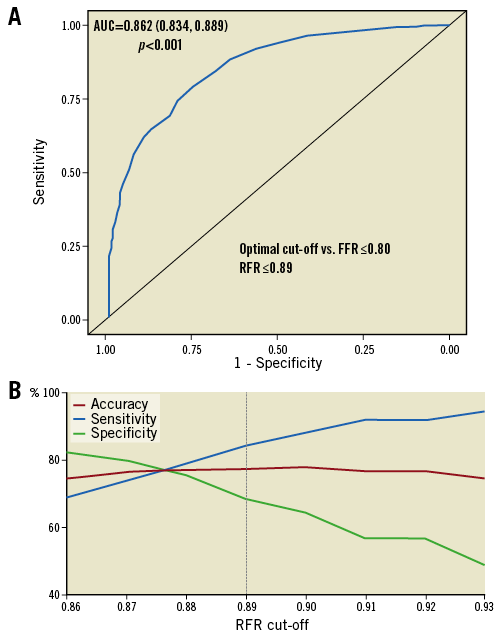
Figure 2. Diagnostic characteristics of resting full-cycle ratio. A) Receiver operating characteristic (ROC) curves were calculated using fractional flow reserve (FFR) as the reference gold standard. The threshold cut-off for FFR was ≤0.80. The ROC was found to have an area under the curve (AUC) of 86%, suggesting high accuracy of resting full-cycle ratio (RFR) as a diagnostic test. The optimal cut-off to detect clinical significance compared to the FFR threshold (≤0.80) was ≤0.89. B) Diagnostic accuracy, sensitivity and specificity were plotted against a range of RFR cut-off values, in comparison with FFR ≤0.80. The results confirmed the ROC analysis with RFR cut-off ≤0.89 favouring marginally higher sensitivity over specificity.
RFR VALIDATION
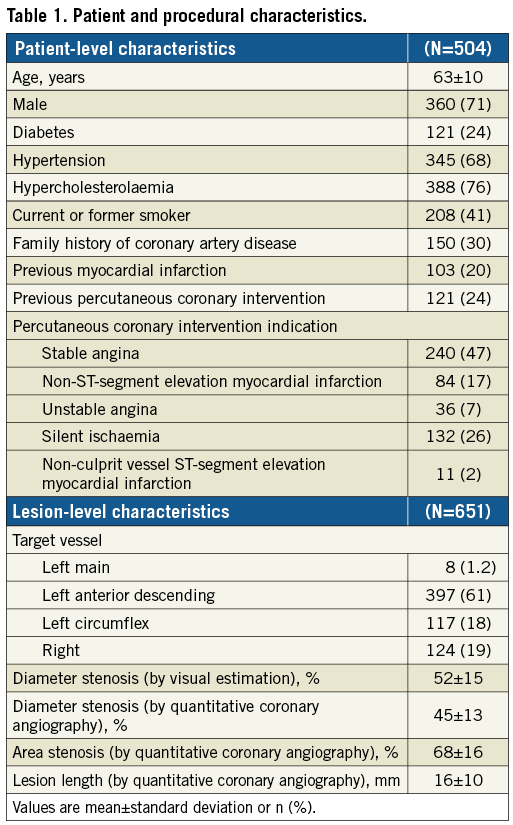
A total of 672 pressure waveforms from 504 patients were available for the validation cohort. Of these, 21 pressure tracings were excluded (13 phase differences in Pd versus Pa, 6 pressure disturbance within the tracing, 2 insufficient number of cardiac cycles for analysis), leaving 651 with analysable data. RFR was calculated on 4.3±0.5 cycles per sample with a standard deviation of 0.0036 units (95% CI: 0.0032-0.0041). Table 1 provides the baseline characteristics of the validation cohort. The median FFR was 0.82 (IQR 0.75–0.87), median iFR was 0.92 (IQR 0.87–0.96), and median RFR was 0.91 (IQR 0.87–0.96) (Supplementary Figure 2).
COMPARISON WITH FFR AND Pd/Pa
Overall, RFR, iFR and basal Pd/Pa were correlated with FFR (Figure 3A-Figure 3C). The DA, Sn, Sp, PPV, NPV, and AUC were nearly identical for both RFR and iFR compared to FFR (Figure 3D, Figure 3E). While DA for basal Pd/Pa was similar to RFR and iFR, sensitivity and NPV were higher but Sp and PPV lower (Figure 3D, Figure 3E). The sensitivity of RFR, iFR and basal Pd/Pa against FFR was lower in the right coronary artery (RCA) compared with the left coronary artery (Supplementary Figure 3).
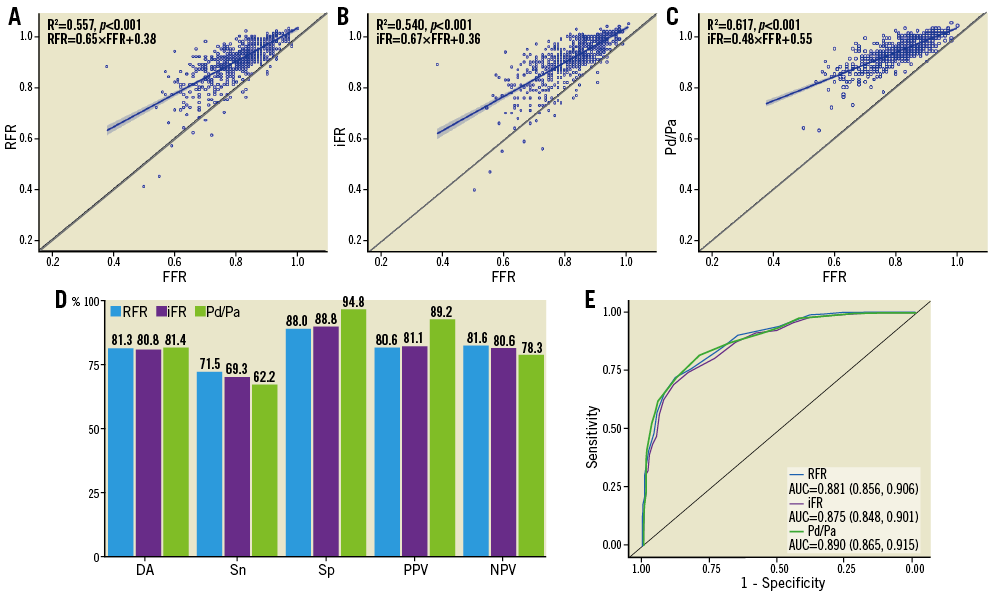
Figure 3. Comparison of resting full-cycle ratio, instantaneous wave-free ratio and basal Pd/Pa to fractional flow reserve. The correlations between resting full-cycle ratio (RFR) (A), instantaneous wave-free ratio (iFR) (B) and basal Pd/Pa (C) compared to fractional flow reserve (FFR) were similar. D) The diagnostic accuracy (DA), sensitivity (Sn), specificity (Sp), positive predictive value (PPV), and negative predictive value (NPV) of RFR versus FFR and iFR versus FFR are nearly identical, while basal Pd/Pa had similar DA but higher Sn and NPV but lower Sp and PPV. E) Receiver operating characteristic curves comparing RFR, iFR and basal Pd/Pa versus FFR are nearly overlapped. AUC: area under the curve
COMPARISON WITH iFR
RFR and iFR were highly correlated, with R2=0.985 (RFR=0.94×iFR+0.05, p<0.001) (Figure 4A). Bland-Altman analysis did not identify systematic differences between RFR and iFR, with a mean difference of –0.002±0.011 (95% limits of agreement –0.023 to 0.020) (Figure 4B). Using the binary cut-off of iFR ≤0.89 as a reference standard, RFR showed near identical agreement according to ROC curve analysis (AUC: 0.996, 95% CI: 0.993-0.998, p<0.001) (Figure 4C). Compared to iFR, RFR showed excellent DA (97.4%), Sn (98.2%), Sp (96.9%), PPV (94.5%), and NPV (99.0%) (Figure 4D). iFR and RFR were highly concordant (kappa 0.94, 95% CI: 0.92-0.97, p<0.001) with statistical testing for equivalence, within a margin of 1% error, confirming that RFR and iFR were diagnostically equivalent (mean difference –0.002, 95% CI: –0.009-0.006, p=0.03) (Figure 4E).
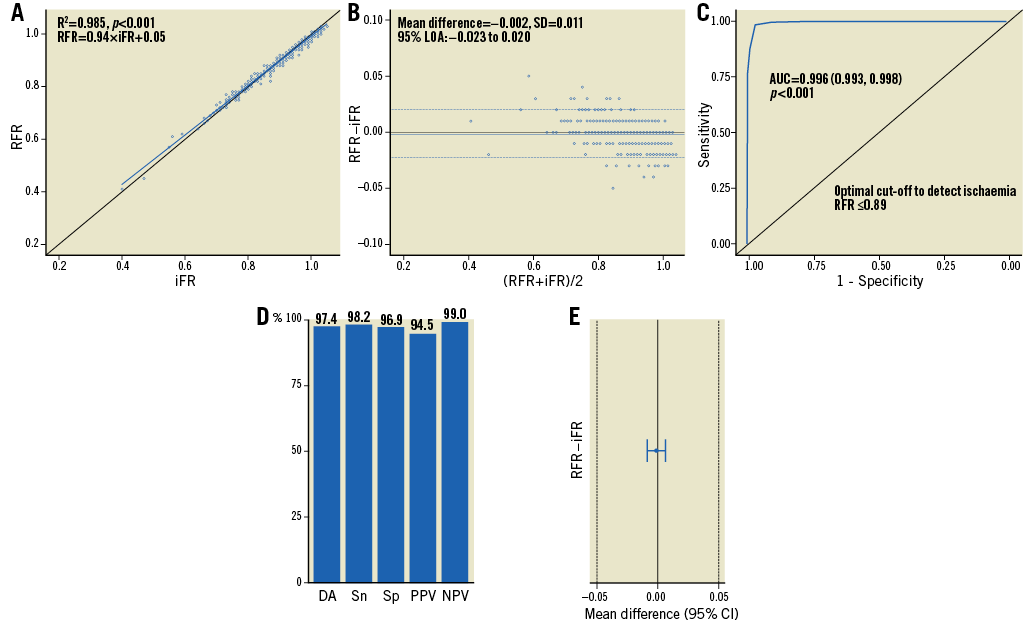
Figure 4. Comparison of resting full-cycle ratio to instantaneous wave-free ratio. A) Resting full-cycle ratio (RFR) and instantaneous wave-free ratio (iFR) are well correlated across the entire range of stenosis severity. B) Bland-Altman plot demonstrates excellent agreement without systematic differences comparing RFR to iFR. C) Receiver operating characteristic curves for RFR and iFR are overlapped. D) The diagnostic accuracy (DA), sensitivity (Sn), specificity (Sp), positive predictive value (PPV), and negative predictive value (NPV) show high diagnostic agreement between RFR and iFR. E) RFR and iFR are statistically equivalent. AUC: area under the curve; CI: confidence interval; LOA: limits of agreement; SD: standard deviation
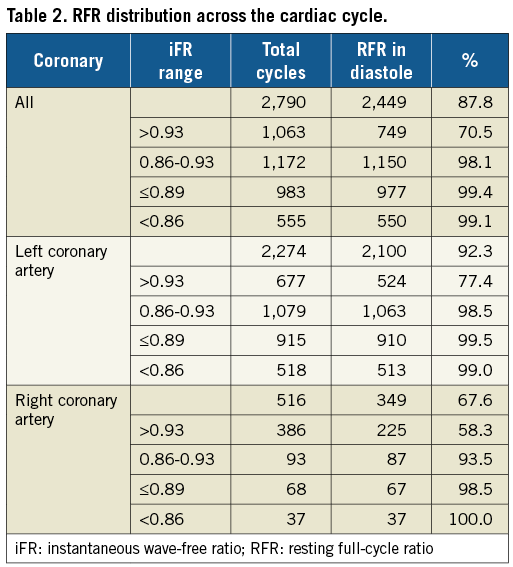
RFR LOCALISATION WITHIN THE CARDIAC CYCLE
As the unique feature of RFR compared with iFR is its unbiased nature regarding where the lowest Pd/Pa is within the cardiac cycle, we determined the frequency of the RFR localisation in systole versus diastole. Overall, RFR was found outside of diastole in 12.2% of waveforms. The largest discrepancy occurred when the iFR was >0.93, with the frequency of discrepancy decreasing with lower iFR values (Table 2). While the discrepancy in the left coronary artery was small within and below the iFR “grey zone”, in the RCA we detected the RFR outside of diastole in 6.5% of cycles when the iFR was between 0.86 and 0.93. However, this discrepancy was only 1.5% when the iFR was ≤0.89. There was no instance within the data set where iFR was ≤0.89 and RFR >0.89 in the RCA.
Discussion
VALIDATE-RFR describes the derivation and validation of a novel non-hyperaemic resting physiological index for coronary artery stenosis severity. We report a number of clinically relevant findings. First, using ROC, DA, Sn, and Sp analyses in the derivation cohort comparing RFR to the clinically significant cut-off FFR of ≤0.80, the optimal cut-off value for RFR was ≤0.89, identical to the threshold used for iFR in clinical practice. Second, the DA, Sn, Sp, PPV, and NPV of RFR and iFR were nearly identical when compared with FFR, confirming not only the similarity between RFR and iFR but also the ability of RFR to detect clinically significant stenosis at an acceptable level when compared with FFR. Third, when compared directly, iFR and RFR are highly concordant and statistically diagnostically equivalent. Finally, the RFR detected the lowest Pd/Pa to be outside of diastole in 12% of all cardiac cycles, suggesting that RFR may detect clinically significant lesions that would be missed by assessments dedicated to a specific segment of the cardiac cycle, specifically lesions in the RCA within the iFR grey zone.
The iFR is a non-hyperemic index of coronary artery stenosis based on the resting coronary pressure during the “wave-free period” (WFP) of diastole. Two large randomised controlled trials have reported non-inferiority of iFR compared to FFR in preventing MACE at one year in patients with intermediate coronary stenoses3,4. By avoiding use of adenosine, these studies demonstrated a statistically significant reduction in patient discomfort as well as cost savings. However, iFR also has some limitations including the need for sensitive landmarking of components of the pressure waveform, and the assumption that resting maximal flow and minimal microcirculatory resistance occur during the WFP. Here we show that the RFR eliminates these limitations, being independent of the ECG, landmarking, and bias within the cardiac cycle. Whether these differences translate into superior clinical utility merits further research.
We found the RFR to be outside of diastole in 12.2% of all cardiac cycles assessed. While a discrepancy between RFR and iFR is of little clinical impact when ischaemia is clearly absent (iFR >0.93), within or below the grey zone (iFR 0.86-0.93) this discrepancy may be of potential significance. We detected the RFR outside of diastole in 1.5% of all waveforms with an iFR between 0.86 and 0.93 but in 6.5% of waveforms in the RCA, where we found the sensitivity of resting indices to be lowest compared to FFR. Previous studies have shown that peak flow in the RCA may occur during systole5,7 or very early in diastole6. The differences in flow profiles between the left and right coronary arteries may be explained by the perfusion bed pressure, whereby in the left coronary artery during systole large intramural pressures are generated by the thick left ventricular wall overcoming perfusion pressure. On the other hand, in the RCA perfusion bed, intramural pressure in the right ventricular wall is considerably lower during systole. In instances of RFR and iFR discrepancy, peak coronary flow could occur outside the WFP, either in systole or early diastole, and thus lesions of potential significance might be missed by iFR. The RFR is unbiased and thus has the potential to identify pressure-based stenosis severity independent of timing within the cardiac cycle, such as shown in the representative example of discrepancy within the validation cohort between RFR and iFR in Supplementary Figure 4. Nonetheless, due to the low incidence of discrepancy, and the absence of other non-invasive assessments to confirm or refute ischaemia, these findings should only be considered hypothesis-generating and the basis for future research.
Alternative non-hyperaemic indices to iFR include the resting Pd/Pa and, more recently, the diastolic pressure ratio (dPR). Multiple studies have shown that Pd/Pa and iFR are similar in their diagnostic utility9,13-15, similar to the current analysis, while another recent study shows that the dPR is diagnostically and numerically equivalent16. While Pd/Pa and dPR share the same advantages as iFR, including shorter procedural times, reduced symptoms, and lower cost compared to FFR, the broad applicability of Pd/Pa and dPR in their ability to be measured by any coronary pressure wire may be an advantage over iFR. Nonetheless, while dPR is still commercially unavailable, Pd/Pa adoption for clinical decision making has been limited, potentially due to lack of outcome data3,4, reduced sensitivity15, and the inability to perform angiographic co-registration or automated pressure pullback17. The RFR dynamic range is similar to iFR and thus has the potential for pressure pullback recordings at rest (Supplementary Figure 5) with similar clinical utility to iFR.
While we show that the concordance between RFR versus FFR and iFR versus FFR is present in 81% of cases and that RFR and iFR are diagnostically equivalent, specific mention of differences between resting and hyperaemic indices is warranted. First, 15-year follow-up data confirming the safety of deferring PCI based on an FFR-guided strategy are available18. Second, randomised clinical trials have shown the superiority in reducing death and myocardial infarction of an FFR-guided revascularisation strategy compared with angiographic guidance1. Third, randomised clinical trials have shown superiority in reducing the need for urgent revascularisation by an FFR-guided revascularisation strategy compared to medical therapy2. Fourth, while non-inferiority claims of iFR to FFR for one-year MACE in intermediate lesions clearly exist3,4, this should be clearly distinguished from equivalence. The event rates in FAME1 were nearly double those reported in DEFINE-FLAIR3 and SWEDEHEART4 (13.2% versus 6.5%), a reflection of the higher SYNTAX score (15-28 versus <15), lower mean FFR (0.71 versus 0.83), greater proportion of multivessel disease (100% versus 40%), and overall higher PCI risk. Fifth, in proximal stenoses in large coronary arteries (left main, proximal left anterior descending), iFR is discordant with FFR in up to 30% of patients19. While recent reports suggest that this discordance may be due to differences in hyperaemic coronary flow velocity whereby resting coronary flow reserve is normal in these arteries20, these data are discrepant from the high event rates found in these patients consistent with the ischaemic continuum. Sixth, for specific lesion subsets such as the left main21 or bifurcation22, evidence for the utility of physiological assessment exists only for FFR. Finally, the benefit of post-PCI physiological assessment exists only for FFR23,24 as submaximal hyperaemia may potentially persist following PCI, limiting the utility of resting indices.
Study limitations
Our study has some limitations. First, this was a retrospective post hoc analysis of previously published reports. Nevertheless, we used individual subject data and tracings for all analyses, providing scientific validity to our findings. Second, use of a core laboratory to eliminate artefacts and signal noise may impact on real-world agreement. Third, while finding RFR outside of diastole is hypothesis-generating, with the potential for improved utility to detect clinically relevant coronary artery stenoses, the impact of this discovery is unclear and requires validation. Indeed, the detection of RFR outside of the WFP needs to be correlated to ischaemia using non-invasive modalities. Finally, the benefits of RFR over dPR have not been investigated, the latter having many of the same benefits as RFR and iFR.
Conclusions
RFR is diagnostically equivalent to iFR but unbiased in its ability to detect the lowest Pd/Pa during the full cardiac cycle, potentially unmasking significant coronary stenoses that would be missed by assessment dedicated to specific segments of the cardiac cycle.
| Impact on daily practice The resting full-cycle ratio (RFR) may be used as an alternative to resting distal coronary pressure to aortic pressure ratio (Pd/Pa) and instantaneous wave-free ratio (iFR) as a non-hyperaemic index to assess coronary artery stenosis severity. Unlike iFR, RFR is not limited by sensitive landmarking of components of the pressure waveform or specific to the wave-free period, and thus may have greater clinical utility as a result of its versatility. Nonetheless, RFR is diagnostically equivalent to iFR, justifying its extension to all guidelines and clinical recommendations for iFR. |
Conflict of interest statement
J. Svanerud reports personal fees from Abbott Vascular and Coroventis Research AB during the conduct of the study, and personal fees from Coroventis Research AB, and St. Jude Medical, outside the submitted work. In addition, he has a patent on RFR technology pending. A. Jeremias reports grants and personal fees from Abbott Vascular and personal fees from Philips Volcano and Opsens outside the submitted work. M. van ‘t Veer reports personal fees from Abbott, outside the submitted work. A. Maehara reports grants from Abbott Vascular and Boston Scientific outside the submitted work. N. Pijls reports grants from Abbott, personal fees from Abbott and from Opsens, other from Philips and other from HeartFlow, outside the submitted work. B. De Bruyne reports grants from Abbott and from Opsens during the conduct of the study. N. Johnson reports an institutional grant from Abbott/St. Jude Medical during the conduct of the CONTRAST study, an institutional grant from Philips/Volcano and an institutional licensing agreement with Boston Scientific outside the submitted work. B. Hennigan reports personal fees from Philips Volcano outside the submitted work. C. Berry reports other from Abbott Vascular, other from Coroventis, other from Philips, other from Opsens, outside the submitted work. K. Oldroyd reports personal fees and non-financial support from Abbott Vascular, and grants, personal fees and non-financial support from Boston Scientific outside the submitted work. Z. Ali reports grants from St. Jude Medical and Cardiovascular Systems Inc. outside the submitted work, and personal fees from St Jude Medical (now Abbott), ACIST Medical, Boston Scientific, Cardiovascular Systems Inc., Siemens, Opsens and Canon USA, outside the submitted work. The other authors have no conflicts of interest to declare.
Supplementary data
Supplementary Appendix 1. Study methods.
Supplementary Appendix 2. Study data analysis.
Supplementary Figure 1. Distribution of the fractional flow reserve and resting full-cycle ratio.
Supplementary Figure 2. Distribution of fractional flow reserve, instantaneous wave-free ratio, and resting full-cycle ratio.
Supplementary Figure 3. Diagnostic characteristics of resting full-cycle ratio, instantaneous wave-free ratio and basal Pd/Pa versus fractional flow reserve in the left and right coronary arteries.
Supplementary Figure 4. Representative example of resting full-cycle ratio versus instantaneous wave-free ratio discrepancy.
Supplementary Figure 5. Representative example of resting full-cycle ratio and instantaneous wave-free ratio pullback.
To read the full content of this article, please download the PDF.