

Summary
We present a method to compare functional brain activity recorded during a naturalistic task using fNIRS with activity recorded during fMRI.
Abstract
We present a method to compare brain activity recorded with near-infrared spectroscopy (fNIRS) in a dance video game task to that recorded in a reduced version of the task using fMRI (functional magnetic resonance imaging). Recently, it has been shown that fNIRS can accurately record functional brain activities equivalent to those concurrently recorded with functional magnetic resonance imaging for classic psychophysical tasks and simple finger tapping paradigms. However, an often quoted benefit of fNIRS is that the technique allows for studying neural mechanisms of complex, naturalistic behaviors that are not possible using the constrained environment of fMRI. Our goal was to extend the findings of previous studies that have shown high correlation between concurrently recorded fNIRS and fMRI signals to compare neural recordings obtained in fMRI procedures to those separately obtained in naturalistic fNIRS experiments. Specifically, we developed a modified version of the dance video game Dance Dance Revolution (DDR) to be compatible with both fMRI and fNIRS imaging procedures. In this methodology we explain the modifications to the software and hardware for compatibility with each technique as well as the scanning and calibration procedures used to obtain representative results. The results of the study show a task-related increase in oxyhemoglobin in both modalities and demonstrate that it is possible to replicate the findings of fMRI using fNIRS in a naturalistic task. This technique represents a methodology to compare fMRI imaging paradigms which utilize a reduced-world environment to fNIRS in closer approximation to naturalistic, full-body activities and behaviors. Further development of this technique may apply to neurodegenerative diseases, such as Parkinson’s disease, late states of dementia, or those with magnetic susceptibility which are contraindicated for fMRI scanning.
Introduction
The goal of the methods described here was to develop a working protocol to compare fMRI (functional magnetic resonance imaging) and fNIRS (functional near-infrared spectroscopy) signals in similar multi-modal tasks. Specifically we aimed to develop a functional imaging procedure for use with individuals contraindicated for traditional fMRI scans due to tremor, dyskinesia, or multiple implanted devices. While many effective training and rehabilitation programs exist for individuals at risk for falling, there is no confirmation of the neural mechanisms underlying efficacy of these programs. Often, individuals participating in these training programs are contra-indicated for the reasons cited. Our rationale for this study was to determine the efficacy of functional near-infrared spectroscopy (fNIRS) to determine patterns of brain activity associated with a naturalistic motor task involving whole body movements. Long-term goals include development of a tool to study not only motor learning paradigms but also serve to confirm the appropriateness of fNIRS for a wider variety of tasks that are not possible to perform in a naturalistic fashion using traditional methods.
fNIRS activity has previously been shown to be highly correlated (r = 0.77-0.94) for homologous regions with fMRI BOLD (blood oxygen level dependent) signal recordings in limited studies which measured concurrent fNIRS and fMRI functional activity using classic psychological and simple finger tapping paradigms1-3. The results of these studies confirm fNIRS is valid and reliable to determine cortical activity associated with a reduced environmental task compatible with fMRI. However, fNIRS has numerous advantages over fMRI as a neuroimaging method. fNIRS, importantly, is much less sensitive to motion artifact than fMRI and allows subjects to behave as they would in a naturalistic environment as opposed to fMRI studies which restrict motor paradigms4. The temporal accuracy associated with fNIRS allows for determination of changes in neural response functions with increased granularity due to the increased sampling frequency. Finally, the cost of fNIRS is lower than fMRI scanning and allows for studies to be conducted at less cost. However, there are disadvantages of fNIRS compared to fMRI including limited depth of penetration, limited spatial resolution, and more recently it has been shown that certain physiologic phenomena such as blood pressure, heart rate, and scalp blood flow effects can introduce false positives to the cortical hemodynamic signal5-9. While a number of methodologies and hardware developments specific to NIRS, including signal processing, hardware to provide high-density optode gradients are currently being developed, it is still important to develop mixed methodologies that allow fMRI and fNIRS procedures to complement each other.
This study serves to test a method of fNIRS for determining neural mechanisms engaged during a naturalistic dance video game task. The aim of the study was to compare activity in an integration center of the brain (the superior and middle temporal gyrus) between a group of individuals imaged using fMRI to another group of subjects using a naturalistic version of the task imaged using fNIRS. Our group has previously investigated this area using similar interactive game paradigms and has shown activity in the temporal lobe responds to both oxy- and de-oxyHb chromophores in accordance with cortical activations10. We have also previously attempted to control for systemic artifacts previously by showing responses in this area are modulated in amplitude with respect to the cortical load of the task and not systemic responses related to the activity itself11. The superior and middle temporal gyrus has known activity associated with integration of multi-modal sensory stimuli and we have previously shown this area to be active in Dance Dance Revolution (DDR) game play in pilot fMRI studies in addition to our fNIRS publications10-12. Our hypothesis for the current study was that functional activity in this area as recorded using fNIRS would be significantly correlated with functional activity recorded using fMRI in a similar but limited dance game protocol.
The protocol described here includes how to modify a dance video game to be used as a neuroimaging paradigm in both fNIRS and fMRI protocols. However the overall procedure is not specific to the paradigm of video game play and could be appropriate for any number of tasks which are not possible to perform in the constraints of an fMRI protocol, including language and locomotor tasks. This protocol further outlines the procedure to use the anatomical specificity of fMRI to develop specific regions of interest (ROI) which can be further studied during real-real world tasks using fNIRS.
Protocol
Prior to participation, all subjects provide informed consent in accordance with institutional guidelines. In this case, the protocol was approved by the institutional human protection program from Meiji University (Kanagawa, Japan), Columbia University Medical Center (transferred to Yale School of Medicine for data analysis), and Long Island University, Brooklyn Campus for this study.
1. Software and Hardware Modification and Development for Functional Neuroimaging (fMRI and fNIRS)
- Modify the game Dance Dance Revolution (DDR) by editing the details of the configuration files (.sm) using the open source clone of DDR, Stepmania, to change timing, graphics and music for the region of interest studies using fMRI prior to fNIRS imaging.
- In the .sm file specify the variables: background, music, offset (start music at scan time), samplestart, samplelength, bpms, and bgchanges. Specify the arrow patterns for each measure in the .sm file by defining arrows per measure as a value of “1”, “0”, or “M”. Define left, up, down, or right button presses for each measure. Use “1” for an arrow, use “0” for blank, and use “M” for a mine in the rest epochs.
- Using the game-song “Butterfly” (originally performed by Smile.dk and available on the original Dance Dance Revolution 3rd Mix game CD for Sony PlayStation), allow subjects to play using an alternating block design built into the game mechanics as modified in the .sm configuration file. Alternate 30 sec game times with 30 sec rest periods with background graphics indicating to the player when to play (green) and when to relax (red; Figure 1).
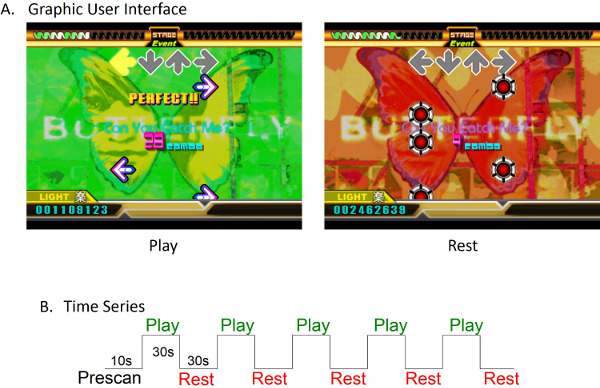
Figure 1: Paradigm Design. (A) DDR Graphic User Interface. Arrows at the bottom of the screen moved towards the top of the screen. These arrows indicated to subjects which button to press. When the arrows reached the top action area (gray arrows at the top of the screen), subjects responded by pressing the correct button. Play time was indicated with a green background. Rest time was indicated by a red background. During the rest time, arrows were replaced with “bomb” animations. These had no function with respect to gameplay or score, but were used to serve as a place holder during rest epochs. (B) The block design used for scanning consisted of a total of 5 min of play and rest epochs. The pre-scan was 10 sec in length, followed by alternating 30 sec play and rest blocks. Please click here to view a larger version of this figure.
- Repeat the alternating interval five times per run to assure specificity in contrast between rest and active periods.
- In the case of fMRI data collection, restrict movements to left and right arrow button presses in fMRI recordings using foot buttons. The overall number of button presses should remain equal for both tasks (Figure 2).
- Prior to the scanning procedure, explain the rudiments of the game to subjects and allow subjects a few practice runs prior to imaging. Instruct subjects to press the corresponding arrow button with their foot as close to the perfect time outlined at the top of the path of the moving arrow, but to minimize head movement as much as possible.

Figure 2: Experimental setup for fMRI. (A) Subjects lay in the MRI scanner while observing the projected interactive environment using a mirror mounted to the head coil above the subject. Figure 2B. A modified foot platform consisting of two buttons allowed subjects to respond with left or right toe taps in real time during gameplay. Please click here to view a larger version of this figure.
2. fMRI Testing and Analysis
- Obtain a structural image for each subject prior to gameplay with a 3D spoiled gradient echo sequence (SPGR) (124 slices, 256 x 256, field of view = 220 mm), with a total scan time of 10 min 38 sec.
- Obtain functional magnetic resonance images during scanning using the following settings for echo planar (EPI) T2*-weighted gradient echo sequence: echo time = 51 msec, repetition time = 3 sec, flip angle= 83°. Acquire 27 consecutive axial slice images of the brain with the following dimensions: 192 x 192 mm field of view with a 128 x 128 grid for a total resolution of 1.56 x 1.56 mm and a z-axis resolution of 4.5 mm.
- Instruct subjects to play game using the paradigm above but using only left and right arrows to reduce motion artifact.
- Perform fMRI BOLD signal analyses using SPM85, implemented in MATLAB 7.0.
- Discard the first 10 sec of the EPI series to minimize the T2* relaxation artifact, functional data are motion corrected via a least squares 6-parameter ‘rigid body’ spatial transformation.
- Normalize the realigned EPI scans to MNI (Montreal Neurological Institute) template which has a 2 mm3 resolution followed by spatial smoothing with Gaussian kernel of 8 mm full width at half maximum (FWHM).
- Perform subject-level statistical analyses using the general linear model (GLM) to create statistical parametric maps for comparing the active condition (DDR) compared against the rest condition.
- Perform group analysis with individual results using standard statistical parametric mapping (SPM) second-level random effects approach. Obtain region of interest based on group analysis results with a threshold of p <0.01 and cluster size threshold of 100 voxels.
- Define the region of interest as the conjunction between the functional cluster and the anatomical mask of superior and middle temporal gyrus, obtained from WFU PickAtlas tool13,14
3. fNIRS Setup and Data Acquisition
- Use a 22-channel fNIRS topography system to record data from optodes arranged into a 3 x 5 array. The inter-optode distance for each source-detector pair is 3 cm (Figure 3A, B).
- Orient the elastic cap containing the array of optical sensors so that it is lined up from the left prefrontal cortex to the left temporal lobe (Figure 3A, B). Assure the optode in the lowest row at the most anterior position is centered on Fpz of the international 10-10 system15. Align the inferior row of optodes in parallel with the line between anatomical landmarks Fpz and T7.
- Tighten the optical probe array to the head of the subject and assure it is securely attached using the straps and the chin-strap. Attention should be paid to the displacement of optodes from the head surface so that source-detector pairs are tight to the head but not uncomfortable to the subject (Figure 3C).
- Sample raw analog optode source-detector pair light data into the computer at 7.9 Hz using the computer graphic user interface.

Figure 3: Optode setup for NIRS recordings. (A) The cap consists of an elastic sheet fitted with bendable plastic coupled to and holding 3 cm spaced optode holders. Straps are fitted to the cap to allow it to be tightly fitted to the head. The cap is larger and allows for more optodes than the 3 x 5 array (shown in yellow) used in this study, but is necessary to secure it securely to the heads of subjects. (B) The optode cap and positioned over the left prefrontal to the temporal lobes. Example of the optode cap on the head of the subject providing coverage of 3 x 5 array over the left prefrontal area to the left temporal lobe. (C) Optode placement in cap showing cap secured to head with tightening straps and chinstrap. Please click here to view a larger version of this figure.
- Test calibration and signal strength and signal to noise ratio using the system control software provided by the manufacturer prior to recording. In the case of high noise being detected, remove optodes and any interfering hair from the channel using an LED illuminated plastic rod (Figure 4).

Figure 4: Optimization of optode signals. Hair was moved from each channel using an illuminated plastic tool to displace hair from the channel center to assure optimal signal quality. Please click here to view a larger version of this figure.
- Use a 3D digitizing pen to determine spatial values of the source and detector optode locations in each channel of the elastic cap. Use the digitizer to identify the spatial coordinates of nasion, inion, auricles and Cz of each subject immediately before data collection and game play (Figure 5). Save text files with source and detector locations to others.txt and anatomical coordinates to origin.txt files.

Figure 5: Calibration of optode position. A magnetic digitizing tool was used to determine placement of 10-20 landmarks on the head and position of the optode channels. Please click here to view a larger version of this figure.
- Process the captured 3D coordinates using the registration option in NIRS-SPM16,17 within MATLAB 7.0 (Figure 6). From the main menu of SPM, pick stand-alone spatial registration. On the next screen, select “With 3D Digitizer” and choose the previously saved others and origin text files using the corresponding dialog. From the software dialog, choose the “Registration (use the NFRI function)” to determine spatial representation

Figure 6: Sample output of NIRS calibration data. Digitizer data was used to determine the probability of each channel in specific regions of the brain. Channel 22 in this subject showed a probability of 0.4129 in the Middle Temporal Gyrus, and 0.47419 in the Superior Temporal Gyrus. The channel is defined by the area between emitter and detector pairs. The circle around channel 22 in the figure represents an approximation of the area contributing to the signal recorded from the optode pairs in this subject. Please click here to view a larger version of this figure.
- When all optode channel positions are digitized and each channel provides sufficient signal strength as indicated in the GUI of the software interface provided by the manufacturer, ask subjects to stand and prepare for DDR testing (Figure 7A, B).

Figure 7: fNIRS data collection during dance game play. (A) Subjects stand to play the game using the block paradigm on a standard dance game mat while being tethered to the NIRS machine. (B) Alternative view of data collection showing raw data on background screen collected in real time from subject. Please click here to view a larger version of this figure.
4. fNIRS Data Collection
- Prior to setting up the fNIRS recording optodes, provide subjects with a brief introduction to gameplay and allow practice for familiarity with the game as in fMRI testing.
- For fNIRS testing, use an identical paradigm to that of fMRI testing with the addition of the up/down arrows compared to only left and right arrows used for fMRI. Ensure that the total number of arrow presses are identical between fMRI and fNIRS tasks and that only the pattern differs.
- Use a standard 4 button floor mat button response system for gameplay during fNIRS testing (Figure 7A).
- Once comfortable in the basics of gameplay, instruct subjects to play 30 sec game times with 30 sec rest periods as in step 1.2. Repeat this 5 min game twice with each subjects.
- Instruct subjects specifically to not touch their face or nose and particularly their hair or head near the optodes. Instruct subjects to minimize rotation, yawl or pitch movements of their head during game play.
5. fNIRS Data Analysis
- Use a modified Beer–Lambert approach18 to calculate relative signals reflecting the oxygenated hemoglobin (oxy-Hb), deoxygenated hemoglobin (deoxy-Hb), and total hemoglobin (total-Hb) concentration changes as ΔoxyHb, ΔdeoxyHb, and ΔtotalHb respectively in an arbitrary unit (μM cm) using the following equations:
ΔoxyHb = -1.4887 × Δabs780 + 0.5970 × Δabs805 + 1.4847 × Δabs830
ΔdeoxyHb = 1.8545 × Δabs780 + (-0.2394) × Δabs805 + (-1.0947) × Δabs830
ΔtotalHb = ΔoxyHb + ΔdeoxyHb;
where Δabs indicates changes in light absorption at the corresponding wavelength. - Low-pass filter raw data of hemodynamic signals from individual through a 25th order Savitzky–Golay filter and average19.
- Apply baseline correction to the averaged data with the onset set to zero.
- Normalize hemodynamic signal amplitude by dividing the averaged values by the standard deviation of the signal recorded 10 sec prior to the task.
- Choose channels to be analyzed based on 3D digitizer information. Here, use a channel to utilize for analysis that has a registration probability of 80% or more in the Middle and Superior Temporal Gyrus) according to the output of the registration process.
6. Comparison of fMRI and fNIRS Signals
- Use the results function in SPM8 to determine super-threshold voxels at T >2.6 or a corresponding P value <0.01. Determine the region of interest (ROI) using overlapping super-threshold voxels to define a cluster inside of an anatomical region.
- In this case, define the superior and middle temporal gyrus using the AAL atlas included in the WFU Pick Atlas. In this case, the resulting cluster has 572 2 x 2 x 2 mm voxels located in the middle temporal gyrus with a peak voxel at coordinate (-66, -24, 0) and peak T = 5.73 fNIRS.
- Determine the channel of interest from fNIRS data using 3D digitized coordinates which are converted to MNI coordinates using NIRS-SPM in step 3.5.1 above. In this case, channel 22 in most subjects had the highest probability of activity in the ROI defined in step 6.1.
- Determine the averaged, event-triggered response in the ROI for fMRI and corresponding channel in fNIRS for the duration of the 60 sec block (active and rest, combined).
- For each subject, average the blood oxygen level dependent (BOLD) raw signals for the voxels within the cluster to generate fMRI event triggered average data.
- Compare fMRI and fNIRS by scaling fMRI data to optimally match the fNIRS data using a linear regression using fNIRS = b* fMRI, where the regression method obtains the b value so that the root mean square value of fNIRS -b* fMRI is minimized.
- Compare fNIRS and fMRI signals by correlation of the two groups.
Representative Results
The results of the experiment indicate activity obtained from integration centers in the superior and middle temporal gyri using functional magnetic resonance imaging (fMRI) have a high correlation to functional near-infrared spectroscopy (fNIRS) signals form the same area in naturalistic version of the task. Figure 8 shows the normalized and averaged raw data from 16 subjects from the fMRI scanning procedure (blue trace) and the 26 subjects from the fNIRS protocol (red trace). The data were pinned at time 0 and the active phase of game interaction took place in the first 30 sec of the graph (labelled task). The vertical dashed line indicates the transition of the green to red background in the task and the start of the rest phase (indicated as rest) Both data sets show increases in responses in the active phase and decline in the rest phase with increased variability seen in the fMRI signal. Comparisons were made between the traces by first regressing the fMRI signal to minimize the root mean square difference between the two traces. The resultant correlation coefficient between the two signals was 0.78 and p value for the correlation was 0.03.
Figure 9 represents a brain rendering with superimposed channel locations from a single subject. Averaged traces from channels 1 and 22 are shown with solid lines representing oxyhemoglobin signals and dashed lines representing deoxyhemoglobin signals. Red and blue traces represent two variations on gameplay, music and non-music, respectively. Signals from channel 1 serve as a control example to compare with the region of interest. Signals in these two regions differ with respect to task-response.

Figure 8: Correlation between fNIRS and fMRI signals from Middle Temporal Gyrus. The fNIRS (red) and fMRI (blue) signals are shown for each group ± SEM represented by shaded edges. The regression coefficient between the two is 0.78; p = 0.03. The insert shows a rendering of the ROI determined from the activity in fMRI with peak activity at MNI coordinate (-66, -24, 0) with a cluster size = 571, peak t = 5.73. Please click here to view a larger version of this figure.

Figure 9: Differences in Signals in the Temporal and Frontal Lobes. Time-course of ΔoxyHb (solid line) and ΔdeoxyHb (dotted line) responses of a single subject from two single trials of the dance game showing two conditions “with music (red)” and “no music (blue)” conditions. This figure has been modified from Ono et al.10.
Discussion
fNIRS is a functional brain imaging technique that has the promise of allowing the study of the neural correlates of natural activities. Development of those techniques is an active research direction. We outline here a methodology that has been effective for recording functional brain activity in a single region of interest associated with participation in a dance video game.
The number of publications investigating motor learning paradigms with fNIRS have increased rapidly in recent years with the introduction of multi-channel fNIRS units from Hitachi and Shimadzu (as well as others) capable of recording functional activities in multiple regions of the brain concurrently20,21. We have shown previously that it is possible to determine anatomical specificity of fNIRS signals as well as to use the signals to determine how variations in timing and amplitude of the signals contribute to behavioral performance of motor tasks11. A recent special issue of the journal Neuroimage focused on current applications of NIRS technology and included a number of studies specific to motor learning22. Even with this snowballing interest in NIRS technology, few studies have focused on neural mechanisms of naturalistic behaviors validated by fMRI. While this special issue and numerous other publications23-26 clearly outline the future role of fNIRS in studying motor behaviors, the protocol described here was developed to validate a uniform methodology for comparing fMRI and fNIRS data from naturalistic behaviors.
The results indicate a high correlation between groups for fNIRS and fMRI signals in an integration area of the temporal lobe and the correlation between the signals is in-line with that shown before in concurrent fMRI/fNIRS studies3. Figure 9 indicates that fNIRS activity in the temporal lobe is not only cortical in nature with differential oxy- and deoxyHb chromofore absorbance, but also that activity in the temporal lobe is quite different from that seen in the frontal lobe does not correlate with fMRI activity in the temporal lobe. We stress a few critical aspects of the study that allow data to be compared between the two techniques. First, the calibration of the optode locations was outlined as a key strategy in confirming cortical anatomy and interpretation of the results. The modifications we made to software and hardware allowed us to synchronize our paradigm with a block design protocol optimized to yield strong cortical responses in both procedures. We also outline key strategies to assure high signal to noise ratio (hair removal from optode surface) and reduction of artifacts including motion and facial stimulation (subjects were specifically instructed not to touch their head or face).
These results and the results of previous studies investigating concurrent fNIRS/fMRI imaging procedures confirm a high correlation between the signals as theoretically predicted1-3. One limitation to the interpretation of the data presented here is that we were unable to utilize newer techniques in optimization of NIRS recording that show it is possible to increase the resolution of the individual channel data using high density recordings. This high density technique has also been used to separate superficial components from the cortical NIRS signals27 in addition to other techniques that remove artifacts from blood pressure, heart rate and other systemic variables6,7,28. It has also been shown that probe placement and chromaphore choice can be used to control for false positives29 and adaptive filtering of NIRS signals can be used effectively in the case of high signal to noise ratio. The task that we have employed here and previously using commercial NIRS systems with paradigms presented in block design10,11 has produced data with large signals and has not required further analysis techniques or hardware to show similarities between signals. However, it is possible that the data presented here could be improved further through the use of these and other techniques in NIRS signal processing.
Current methodologies in functional NIRS will not replace the need for fMRI scanning; rather, as we suggest here, the two imaging procedures (in addition to EEG and others) can be used to complement each other. In the case of a group of individuals that are contraindicated for fMRI scanning, fNIRS may prove the only viable technique to ascertain the benefits of a training program such as fall risk prevention programs for individuals with Parkinson’s disease. Further, fNIRS has a number of future directions that can also be used to add information to the anatomical detail provided through MR scanning. High density optode placement and increased optodes will yield higher temporal resolution that can be used for connectivity and principle component analysis as well as increased accuracy of BOLD signal modeling.
Disclosures
Publication fees for this article are sponsored by Shimadzu.
Acknowledgments
This research was supported in part by the following funding sources: JSPS Grant-in-Aid for Scientific Research (C) 25350642 (AT), a research grant from Hayao Nakayama Foundation for Science & Technology and Culture (SS & YO), and a Health Games Research grant from The Robert Wood Johnson Foundation (Grant #66729) (SB & JAN).
Materials
| Name | Company | Catalog Number | Comments |
| Equipment | |||
| Shimadzu OMM-3000 |  Shimadzu Shimadzu |
The OMM-3000 used in this study has been replaced by the LABNIRS | |
| Polhemus Patriot 3D Digitizer | Polhemus |
||
| GE Twin-Speed 1.5T MRI scanner | General Electric |
The Twin-Speed 1.5 T scanner has been retired. A number of new scanners are available to replicate this procedure | |
| Software | |||
| Stepmania | Stepmania |
||
| Matlab | MathWorks |
||
| NIRS-SPM | BISPL |
||
| WFU Pick Atlas | ANSIR |
||
References
- Heinzel, S., et al. Variability of (functional) hemodynamics as measured with simultaneous fNIRS and fMRI during intertemporal choice. NeuroImage. 71, 125-134 (2013).
- Cui, X., Bray, S., Bryant, D. M., Glover, G. H., Reiss, A. L. A quantitative comparison of NIRS and fMRI across multiple cognitive tasks. Neuroimage. 54, 2808-2821 (2011).
- Sato, H., et al. A NIRS–fMRI investigation of prefrontal cortex activity during a working memory task. Neuroimage. 83, 158-173 (2013).
- Piper, S. K., et al. A wearable multi-channel fNIRS system for brain imaging in freely moving subjects. NeuroImage. 85 (Part 1), 64-71 (2014).
- Funane, T., et al. Quantitative evaluation of deep and shallow tissue layers' contribution to fNIRS signal using multi-distance optodes and independent component analysis). NeuroImage. 85 (Part 1), 150-165 (2014).
- Tachtsidis, I., et al. Ch. 46. Oxygen Transport to Tissue XXX Vol. 645 Advances in Experimental Medicine and Biology. Liss, P., Hansell, P., Bruley, D. F., Harrison, D. K. , Springer. New York, NY. 307-314 (2009).
- Scholkmann, F., et al. A review on continuous wave functional near-infrared spectroscopy and imaging instrumentation and methodology. NeuroImage. 85 (Part 1), 6-27 (2014).
- Saager, R., Berger, A. Measurement of layer-like hemodynamic trends in scalp and cortex: implications for physiological baseline suppression in functional near-infrared spectroscopy). Journal Of Biomedical Optics. 13 (3), 034017-034017 (2008).
- Takahashi, T., et al. Influence of skin blood flow on near-infrared spectroscopy signals measured on the forehead during a verbal fluency task. Neuroimage. 57, 991-1002 (2011).
- Ono, Y., et al. Frontotemporal oxyhemoglobin dynamics predict performance accuracy of dance simulation gameplay: Temporal characteristics of top-down and bottom-up cortical activities. NeuroImage. 85, 461-470 (2014).
- Tachibana, A., Noah, J. A., Bronner, S., Ono, Y., Onozuka, M. Parietal and temporal activity during a multimodal dance video game: an fNIRS study. Neuroscience Letters. 503 (2), 125-130 (2011).
- Annual Society for Neuroscience Conference. Noah, J., Tachibana, A., Bronner, S. 2010 Nov 13-17, San Diego, CA, , (2010).
- Maldjian, J. A., Laurienti, P. J., Burdette, J. H. Precentral gyrus discrepancy in electronic versions of the Talairach atlas. Neuroimage. 21, 450-455 (2004).
- Maldjian, J. A., Laurienti, P. J., Kraft, R. A., Burdette, J. H. An automated method for neuroanatomic and cytoarchitectonic atlas-based interrogation of fMRI data sets. Neuroimage. 19, 1233-1239 (2003).
- Chatrian, G. E., Lettich, E., Nelson, P. L. Ten percent electrode system for topographic studies of spontaneous and evoked EEG activity. Am J EEG Technol. 25, 83-92 (1985).
- Okamoto, M., Dan, I. Automated cortical projection of head-surface locations for transcranial functional brain mapping. Neuroimage. 26, 18-28 (2005).
- Ye, J. C., Tak, S., Jang, K. E., Jung, J., Jang, J. NIRS-SPM statistical parametric mapping for near-infrared spectroscopy. Neuroimage. 44, 428-447 (2009).
- Cope, M., Delpy, D. System for long-term measurement of cerebral blood and tissue oxygenation on newborn infants by near infra-red transillumination. Medical and Biological Engineering and Computing. 26 (3), 289-294 (1988).
- Savitzky, A., Golay, M. J. Smoothing and differentiation of data by simplified least squares procedures. Analytical Chemistry. 36 (8), 1627-1639 (1964).
- Okamoto, M., et al. Multimodal assessment of cortical activation during apple peeling by NIRS and fMRI. NeuroImage. 21, 1275-1288 (2004).
- Suzuki, M., et al. Prefrontal and premotor cortices are involved in adapting walking and running speed on the treadmill: an optical imaging study. Neuroimage. 23, 1020-1026 (2004).
- Boas, D. A., Elwell, C. E., Ferrari, M., Taga, G. Twenty years of functional near-infrared spectroscopy: introduction for the special issue. NeuroImage. 85, 1-5 (2014).
- Holtzer, R., et al. fNIRS study of walking and walking while talking in young and old individuals. The Journals of Gerontology Series A: Biological Sciences and Medical Sciences. 66 (8), 879-887 (2011).
- Suzuki, M., Miyai, I., Ono, T., Kubota, K. Activities in the frontal cortex and gait performance are modulated by preparation. An fNIRS study. Neuroimage. 39, 600-607 (2008).
- Shimada, S., Hiraki, K., Oda, I. The parietal role in the sense of self-ownership with temporal discrepancy between visual and proprioceptive feedbacks. Neuroimage. 24, 1225-1232 (2005).
- Matsuda, G., Hiraki, K. Sustained decrease in oxygenated hemoglobin during video games in the dorsal prefrontal cortex: a NIRS study of children. Neuroimage. 29, 706-711 (2006).
- Gregg, N. M., White, B. R., Zeff, B. W., Berger, A. J., Culver, J. P. Brain specificity of diffuse optical imaging: improvements from superficial signal regression and tomography. Frontiers in Neuroenergetics. 2, 14 (2010).
- Kirilina, E., et al. The physiological origin of task-evoked systemic artefacts in functional near infrared spectroscopy. Neuroimage. 61, 70-81 (2012).
- Strangman, G., Franceschini, M. A., Boas, D. A. Factors affecting the accuracy of near-infrared spectroscopy concentration calculations for focal changes in oxygenation parameters. NeuroImage. 18, 865-879 (2003).
