
Abstract
Single-case experimental designs (SCEDs) have become a popular research methodology in educational science, psychology, and beyond. The growing popularity has been accompanied by the development of specific guidelines for the conduct and analysis of SCEDs. In this paper, we examine recent practices in the conduct and analysis of SCEDs by systematically reviewing applied SCEDs published over a period of three years (2016–2018). Specifically, we were interested in which designs are most frequently used and how common randomization in the study design is, which data aspects applied single-case researchers analyze, and which analytical methods are used. The systematic review of 423 studies suggests that the multiple baseline design continues to be the most widely used design and that the difference in central tendency level is by far most popular in SCED effect evaluation. Visual analysis paired with descriptive statistics is the most frequently used method of data analysis. However, inferential statistical methods and the inclusion of randomization in the study design are not uncommon. We discuss these results in light of the findings of earlier systematic reviews and suggest future directions for the development of SCED methodology.
Introduction
In single-case experimental designs (SCEDs) a single entity (e.g., a classroom) is measured repeatedly over time under different manipulations of at least one independent variable (Barlow et al., 2009; Kazdin, 2011; Ledford & Gast, 2018). Experimental control in SCEDs is demonstrated by observing changes in the dependent variable(s) over time under the different manipulations of the independent variable(s). Over the past few decades, the popularity of SCEDs has risen continuously as reflected in the number of published SCED studies (Shadish & Sullivan, 2011; Smith, 2012; Tanious et al., 2020), the development of domain-specific reporting guidelines (e.g., Tate et al., 2016a, 2016b; Vohra et al., 2016), and guidelines on the quality of conduct and analysis of SCEDs (Horner, et al., 2005; Kratochwill et al., 2010, 2013).
The What Works Clearinghouse guidelines
In educational science in particular, the US Department of Education has released a highly influential policy document through its What Works Clearinghouse (WWC) panel (Kratochwill et al., 2010)Footnote 1. The WWC guidelines contain recommendations for the conduct and visual analysis of SCEDs. The panel recommended visually analyzing six data aspects of SCEDs: level, trend, variability, overlap, immediacy of the effect, and consistency of data patterns. However, given the subjective nature of visual analysis (e.g., Harrington, 2013; Heyvaert & Onghena, 2014; Ottenbacher, 1990), Kratochwill and Levin (2014) later called the formation of a panel for recommendations on the statistical analysis of SCEDs “the highest imminent priority” (p. 232, emphasis in original) on the agenda of SCED methodologists. Furthermore, Kratochwill and Levin—both members of the original panel—contended that advocating for design-specific randomization schemes in line with the recommendations by Edgington (1975, 1980) and Levin (1994) would constitute an important contribution to the development of updated guidelines.
Developments outside the WWC guidelines
Prior to the publication of updated guidelines, important progress had already been made in the development of SCED-specific statistical analyses and design-specific randomization schemes not summarized in the 2010 version of the WWC guidelines. Specifically, three interrelated areas can be distinguished: effect size calculation, inferential statistics, and randomization procedures. Note that this list includes effect size calculation even though the 2010 WWC guidelines include some recommendations for effect size calculation, but with the reference that further research is “badly needed” (p. 23) to develop novel effect size measures comparable to those used in group studies. In the following paragraphs, we give a brief overview of the developments in each area.
Effect size measures
The effect size measures mentioned in the 2010 version of the WWC guidelines mainly concern the data aspect overlap: percentage of non-overlapping data (Scruggs, Mastropieri, & Casto, 1987), percentage of all non-overlapping data (Parker et al., 2007), and percentage of data points exceeding the median (Ma, 2006). Other overlap-based effect size measures are discussed in Parker et al. (2011). Furthermore, the 2010 guidelines discuss multilevel models, regression models, and a standardized effect size measure proposed by Shadish et al. (2008) for comparing results between participants in SCEDs. In later years, this measure has been further developed for other designs and meta-analyses (Hedges et al., 2012; Hedges et al., 2013; Shadish et al., 2014) Without mentioning any specific measures, the guidelines further mention effect sizes that compare the different conditions within a single unit and standardize by dividing by the within-phase variance. These effect size measures quantify the data aspect level. Beretvas and Chung (2008) proposed for example to subtract the mean of the baseline phase from the mean of the intervention phase, and subsequently divide by the pooled within-case standard deviation. Other proposals for quantifying the data aspect level include the slope and level change procedure which corrects for baseline trend (Solanas et al., 2010), and the mean baseline reduction which is calculated by subtracting the mean of treatment observations from the mean of baseline observations and subsequently dividing by the mean of the baseline phase (O’Brien & Repp, 1990). Efforts have also been made to quantify the other four data aspects. For an overview of the available effect size measures per data aspect, the interested reader is referred to Tanious et al. (2020). Examples of quantifications for the data aspect trend include the split-middle technique (Kazdin, 1982) and ordinary least squares (Kromrey & Foster-Johnson, 1996), but many more proposals exist (see e.g., Manolov, 2018, for an overview and discussion of different trend techniques). Fewer proposals exist for variability, immediacy, and consistency. The WWC guidelines recommend using the standard deviation for within-phase variability. Another option is the use of stability envelopes as suggested by Lane and Gast (2014). It should be noted, however, that neither of these methods is an effect size measure because they are assessed within a single phase. For the assessment of between-phase variability changes, Kromrey and Foster-Johnson (1996) recommend using variance ratios. More recently, Levin et al. (2020) recommended the median absolute deviation for the assessment of variability changes. The WWC guidelines recommend subtracting the mean of the last three baseline data points from the first three intervention data points to assess immediacy. Michiels et al. (2017) proposed the immediate treatment effect index extending this logic to ABA and ABAB designs. For consistency of data patterns, only one measure currently exists, based on the Manhattan distance between data points from experimentally similar phases (Tanious et al., 2019).
Inferential statistics
Inferential statistics are not summarized in the 2010 version of the WWC guidelines. However, inferential statistics do have a long and rich history in debates surrounding the methodology and data analysis of SCEDs. Excellent review articles detailing and explaining the available methods for analyzing data from SCEDs are available in Manolov and Moeyaert (2017) and Manolov and Solanas (2018). In situations in which results are compared across participants within or between studies, multilevel models have been proposed. The 2010 guidelines do mention multilevel models, but with the indication that more thorough investigation was needed before their use could be recommended. With few exceptions, such as the pioneering work by Van den Noortgate and Onghena (2003, 2008), specific proposals for multilevel analysis of SCEDs had long been lacking. Not surprisingly, the 2010 WWC guidelines gave new impetus for the development of multilevel models for meta-analyzing SCEDs. For example, Moeyaert, Ugille, et al. (2014b) and Moeyaert, Ferron, et al. (2014a) discuss two-level and three-level models for combining results across single cases. Baek et al. (2016) suggested a visual analytical approach for refining multilevel models for SCEDs. Multilevel models can be used descriptively (i.e., to find an overall treatment effect size), inferentially (i.e., to obtain a p value or confidence interval), or a mix of both.
Randomization
One concept that is closely linked to inferential statistics is randomization. In the context of SCEDs, randomization refers to the random assignment of measurements to treatment levels (Onghena & Edgington, 2005). Randomization, when ethically and practically feasible, can reduce the risk of bias in SCEDs and strengthen the internal validity of the study (Tate et al., 2013). To incorporate randomization into the design, specific randomization schemes are needed, as previously stated (Kratochwill & Levin, 2014). In alternation designs, randomization can be introduced by randomly alternating the sequence of conditions, either unrestricted or restricted (e.g., maximum of two consecutive measurements under the same condition) (Onghena & Edgington, 1994). In phase designs (e.g., ABAB), multiple baseline designs, and changing criterion designs, where no rapid alternation of treatments takes place, it is possible to randomize the moment of phase change after a minimum number of measurements has taken place in each phase (Marascuilo & Busk, 1988; Onghena, 1992). In multiple baseline designs, it is also possible to predetermine different baseline phase lengths for each tier and then randomly allocate participants to different baseline phase lengths (Wampold & Worsham, 1986). Randomization tests use the randomization actually present in the design for quantifying the probability of the observed effect occurring by chance. These tests are among the earliest data analysis techniques specifically proposed for SCEDs (Edgington, 1967, 1975, 1980).
Main goal
The main aim of the present paper is to systematically review the methodological characteristics of recently published SCEDs with an emphasis on the data aspects put forth in the WWC guidelines. Specific research questions are:
-
What is the frequency of the various single-case design options?
-
How common is randomization in the study design?
-
Which data aspects do applied researchers include in their analysis?
-
What is the frequency of visual and statistical data analysis techniques?
For systematic reviews of SCEDs predating the publication of the WWC guidelines, the interested reader is referred to Hammond and Gast (2010), Shadish and Sullivan (2011), and Smith (2012).
Justification for publication period selection
The present systematic review deals with applied SCED studies published in the period from 2016 to 2018. The reasons for the selection of this period are threefold: relevance, sufficiency, and feasibility. In terms of relevance, there is a noticeable lack of recent systematic reviews dealing with the methodological characteristics of SCEDs in spite of important developments in the field. Apart from the previously mentioned reviews predating the publication of the 2010 WWC guidelines, only two reviews can be mentioned that were published after the WWC guidelines. Solomon (2014) reviewed indicators of violations of normality and independence in school-based SCED studies until 2012. More recently, Woo et al. (2016) performed a content analysis of SCED studies published in American Counseling Association journals between 2003 and 2014. However, neither of these reviews deals with published SCEDs in relation to specific guidelines such as WWC. In terms of sufficiency, a three-year period can give sufficient insight into recent trends in applied SCEDs. In addition, it seems reasonable to assume a delay between the publication of guidelines such as WWC and their impact in the field. For example, several discussion articles regarding the WWC guidelines were published in 2013. Wolery (2013) and Maggin et al. (2013) pointed out perceived weaknesses in the WWC guidelines, which in turn prompted a reply by the original authors (Hitchcock et al., 2014). Discussions like these can help increase the exposure of the guidelines among applied researchers. In terms of feasibility, it is important to note that we did not set any specification on the field of study for inclusion. Therefore, the period of publication had to remain feasible and manageable to read and code all included publications across all different study fields (education, healthcare, counseling, etc.).
Method
Data sources
We performed a broad search of the English-language SCED literature using PubMed and Web of Science. The choice for these two search engines was based on Gusenbauer and Haddaway (2019), who assessed the eligibility of 26 search engines for systematic reviews. Gusenbauer and Haddaway came to the conclusion that PubMed and Web of Science could be used as primary search engines in systematic reviews, as they fulfilled all necessary requirements such as functionality of Boolean operators and reproducibility of search results in different locations and at different times. We selected only these two of all eligible search engines to keep the size of the project manageable and to prevent excessive overlap between the results. Table 1 gives an overview of the search terms we used and the number of hits per search query. This list does not exclude duplicates between the search terms and between the two search engines. For all designs containing the term “randomized” (e.g., randomized block design) we added the Boolean operator AND specified that the search results must also contain either the term “single-case” or “single-subject”. An initial search for randomized designs without these specifications yielded well over 1000 results per search query.
Study selection
We specifically searched for studies published between 2016 and 2018. We used the date of first online publication to determine whether an article met this criterion (i.e., articles that were published online during this period, even if not yet published in print). Initially, the abstracts and article information of all search results were scanned for general exclusion criteria. In a first step, all articles that fell outside the date range of interest were excluded, as well as articles for which the full text was not available or only available against payment. We only included articles written in English. In a second step, all duplicate articles were deleted. From the remaining unique search results, all articles that did not use any form of single-case experimentation were excluded. Such studies include for example non-experimental forms of case studies. Lastly, all articles not reporting any primary empirical data were excluded from the final sample. Thus, purely methodological articles were discarded. Methodological articles were defined as articles that were within the realm of SCEDs but did not report any empirical data or reported only secondary empirical data. Generally, these articles propose new methods for analyzing SCEDs or perform simulation studies to test existing methods. Similarly, commentaries, systematic reviews, and meta-analyses were excluded from the final sample, as such articles do not contain primary empirical data. In line with systematic review guidelines (Staples & Niazi, 2007), the second author verified the accuracy of the selection process. Ten articles were randomly selected from an initial list of all search results for a joint discussion between the authors, and no disagreements about the selection emerged. Figure 1 presents the study attrition diagram.
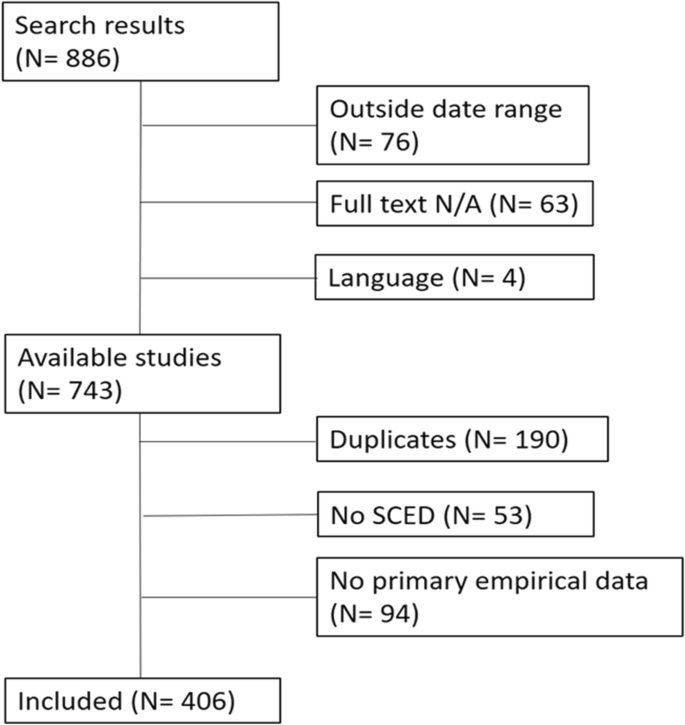
Study attrition diagram
Coding criteria
Design
For all studies, the basic design was coded first. For coding the design, we followed the typology presented in Onghena and Edgington (2005) and Tate et al. (2016a) with four overarching categories: phase designs, alternation designs, multiple baseline designs, and changing criterion designs. For each of these categories, different design options exist. Common variants of phase designs include for example AB and ABAB, but other forms also exist, such as ABC. Within the alternation designs category the main variants are the completely randomized design, the alternating treatments designs, and the randomized block design. Multiple baseline designs can be conducted across participants, behaviors, or settings. They can be either concurrent, meaning that all participants start the study at the same time, or non-concurrent. Changing criterion designs can employ either a single-value criterion or a range-bound criterion. In addition to these four overarching categories, we added a design category called hybridFootnote 2. The hybrid category consists of studies using several design strategies combined, for example a multiple baseline study with an integrated alternating treatments design. For articles reporting more than one study, each study was coded separately. For coding the basic design, we followed the authors’ original description of the study.
Randomization
Randomization was coded as a dichotomous variable, i.e., either present or not present. In order to be coded as present, some form of randomization had to be present in the design itself, as previously defined in the randomization section. Studies with a fixed order of treatments or phase change moments with randomized stimulus presentation, for example, were coded as randomization not present.
Data aspect
A major contribution of the WWC guidelines was the establishment of six data aspects for the analysis of SCEDs: level, trend, variability, overlap, immediacy, and consistency. Following the guidelines, these data aspects can be defined operationally as follows. Level is the mean score within a phase. The straight line best fitting the data within a phase refers to the trend. The standard deviation or range in a phase represents the data aspect variability. The proportion of data points overlapping between adjacent phases is the data aspect overlap. The immediacy of an effect is assessed by a comparison of the last three data points of an intervention with the first three data points of the subsequent intervention. Finally, consistencyFootnote 3 is assessed by comparing data patterns from experimentally similar interventions. In multiple baseline designs, consistency can be assessed horizontally (within series) when more than one phase change is present, and vertically (across series) by comparing experimentally similar phases across participants, behaviors, or settings. It was of course possible that studies reported more than one data aspect or none at all. For studies reporting more than one data aspect, each data aspect was coded separately.
Data analysis
The data analysis methods were coded directly from the authors’ description in the “data analysis” section. If no such section was present, the data analysis methods were coded according to the presentation of the results. Generally, two main forms of data analysis for SCEDs can be distinguished: visual and statistical analysis. In the visual analytical approach, a time series graph of the dependent variable under the different experimental conditions is analyzed to determine treatment effectiveness. The statistical analytical approach can be roughly divided into two categories: descriptive and inferential statistics. Descriptive statistics summarize the data without quantifying the uncertainty in the description. Examples of descriptive statistics include means, standard deviations, and effect sizes. Inferential statistics imply an inference from the observed results to unknown parameter values and quantify the uncertainty for doing so, for example, by providing p values and confidence intervals.
Number of participants
Finally, for each study we coded the number of participants, counting only participants who appeared in the results section. Participants who dropped out prematurely and whose data were not analyzed, were not counted.
Results
General results
For each coding category, the interrater agreement was calculated with the formula \( \frac{\mathrm{no}.\kern0.5em \mathrm{of}\ \mathrm{agreements}}{\mathrm{no}.\kern0.5em \mathrm{of}\ \mathrm{agreements}+\mathrm{no}.\kern0.5em \mathrm{of}\ \mathrm{disagreements}} \) based on ten randomly selected articles. The interrater agreement was as follow: design (90%), analysis (60%), data aspect (80%), randomization (100%), number of participants (80%). Given the initial moderate agreement for analysis, the two authors discussed discrepancies and then reanalyzed a new sample of ten randomly selected articles. The interrater reliability for analysis then increased to 90%.
In total, 406 articles were included in the final sample, which represented 423 studies. One hundred thirty-eight of the 406 articles (34.00%) were published in 2016, 150 articles (36.95%) were published in 2017, and 118 articles (29.06%) were published in 2018. Out of the 423 studies, the most widely used form of SCEDs was the multiple baseline design, which accounted for 49.65% (N = 210) of the studies included in the final sample. Across all studies and designs, the median number of participants was three (IQR = 3). The most popular data analysis technique across all studies was visual analysis paired with descriptive statistics, which was used in 48.94% (N = 207) of the studies. The average number of data aspects analyzed per study was 2.61 (SD = 1.63). The most popular data aspect across all designs and studies was level (83.45%, N = 353). Overall, 22.46% (N = 95) of the 423 studies included randomization in the design. However, these results vary between the different designs. In the following sections, we therefore present a summary of the results per design. A detailed overview of all the results per design can be found in Table 2.
Results per design
Phase designs
Phase designs accounted for 25.53% (N = 108) of the studies included in the systematic review. The median number of participants for phase designs was three (IQR = 4). Visual analysis paired with descriptive statistics was the most popular data analysis method for phase designs (40.74%, N = 44), and the majority of studies analyzed several data aspects (54.62%, N = 59); 20.37% (N = 22) did not report any of the six data aspects. The average number of data aspects analyzed in phase designs was 2.02 (SD = 2.07). Level was the most frequently analyzed data aspect for phase designs (73.15%, N = 79). Randomization was very uncommon in phase designs and was included in only 5.56% (N = 6) of the studies.
Alternation designs
Alternation designs accounted for 14.42% (N = 61) of the studies included in the systematic review. The median number of participants for alternation designs was three (IQR = 1). More than half of the alternation design studies used visual analysis paired with descriptive statistics (57.38%, N = 35). The majority of alternation design studies analyzed several data aspects (75.41%, N = 46), while 11.48% (N = 7) did not report which data aspect was the focus of analysis. The average number of data aspects analyzed in alternation designs was 2.38 (SD = 2.06). The most frequently analyzed data aspect for alternation designs was level (85.25%, N = 52). Randomization was used in the majority of alternation designs (59.02%, N = 36).
Multiple baseline designs
Multiple baseline designs, by a large margin the most prevalent design, accounted for nearly half of all studies (49.65%, N = 210) included in the systematic review. The median number of participants for multiple baseline designs was four (IQR = 4). A total of 49.52% (N = 104) of multiple baseline studies were analyzed using visual analysis paired with descriptive statistics, and the vast majority (80.95%, N = 170) analyzed several data aspects, while only 7.14% (N = 15) did not report any of the six data aspects. The average number of data aspects analyzed in multiple baseline designs was 3.01 (SD = 1.61). The most popular data aspect was level, which was analyzed in 87.62% (N = 184) of all multiple baseline designs. Randomization was not uncommon in multiple baseline designs (20.00%, N = 42).
Changing criterion design
Changing criterion designs accounted for 1.42% (N = 6) of the studies included in the systematic review. The median number of participants for changing criterion designs was three (IQR = 0); 66.67% (N = 4) of changing criterion designs were analyzed using visual analysis paired with descriptive statistics. Half of the changing criterion designs analyzed several data aspects (N = 3), and one study (16.67%) did not report any data aspect. The average number of data aspects analyzed in changing criterion designs was 1.83 (SD = 1.39). The most popular data aspect was level (83.33%, N = 5). None of the changing criterion design studies included randomization in the design.
Hybrid designs
Hybrid designs accounted for 8.98% (N = 38) of the studies included in the systematic review. The median number of participants for hybrid designs was three (IQR = 2). A total of 52.63% (N = 20) of hybrid designs were analyzed with visual analysis paired with descriptive statistics, and the majority of studies analyzed several data aspects (73.68%, N = 28); 10.53% (N = 4) did not report any of the six data aspects. The average number of data aspects considered for analysis was 2.55 (SD = 2.02). The most popular data aspect was level (86.84%, N = 33). Hybrid designs showed the second highest proportion of studies including randomization in the study design (28.95%, N = 11).
Results per data aspect
Out of the 423 studies included in the systematic review, 72.34% (N = 306) analyzed several data aspects, 16.08% (N = 68) analyzed one data aspect, and 11.58% (N = 49) did not report any of the six data aspects.
Level
Across all designs, level was by far the most frequently analyzed data aspect (83.45%, N = 353). Remarkably, nearly all studies that analyzed more than one data aspect included the data aspect level (96.73%, N = 296). Similarly, for studies analyzing only one data aspect, there was a strong prevalence of level (83.82%, N = 57). For studies that only analyzed level, the most common form of analysis was visual analysis paired with descriptive statistics (54.39%, N = 31).
Trend
Trend was the third most popular data aspect. It was analyzed in 45.39% (N = 192) of all studies included in the systematic review. There were no studies in which trend was the only data aspect analyzed, meaning that trend was always analyzed alongside other data aspects, making it difficult to isolate the analytical methods specifically used to analyze trend.
Variability
The data aspect variability was analyzed in 59.10% (N = 250) of the studies, making it the second most prominent data aspect. A total of 80.72% (N = 247) of all studies analyzing several data aspects included variability. However, variability was very rarely the only data aspect analyzed. Only 3.3% (N = 3) of the studies analyzing only one data aspect focused on variability. All three studies that analyzed only variability did so using visual analysis.
Overlap
The data aspect overlap was analyzed in 35.70% (N = 151) of all studies and was thus the fourth most analyzed data aspect. Nearly half of all studies analyzing several data aspects included overlap (47.08%, N = 144). For studies analyzing only one data aspect, overlap was the second most common data aspect after level (10.29%, N = 7). The most common mode of analysis for these studies was descriptive statistics paired with inferential statistics (57.14%, N = 4).
Immediacy
The immediacy of the effect was assessed in 28.61% (N = 121) of the studies, making it the second least analyzed data aspect; 39.22% (N = 120) of the studies analyzing several data aspects included immediacy. Only one study analyzed immediacy as the sole data aspect, and this study used visual analysis.
Consistency
Consistency was analyzed in 9.46% (N = 40) of the studies and was thus by far the least analyzed data aspect. It was analyzed in 13.07% (N = 40) of the studies analyzing several data aspects and was never the focus of analysis for studies analyzing only one data aspect.
Several
As stated previously, 72.34% (N = 306) of all studies analyzed several data aspects. For these studies, the average number of data aspects analyzed was 3.39 (SD = 1.18). The most popular data analysis technique for several data aspects was visual analysis paired with descriptive statistics (56.54%, N = 173).
Not reported
As mentioned previously, 11.58% (N = 49) did not report any of the six data aspects. For these studies, the most prominent analytical technique was visual analysis alone (61.22%, N = 30). Of all studies not reporting any of the six data aspects, the highest proportion was phase designs (44.90%, N = 22).
Results per analytical method
Visual
Visual analysis, without the use of any descriptive or inferential statistics, was the analytical method used in 16.78% (N = 71) of all included studies. Of all studies using visual analysis, the majority were multiple baseline design studies (45.07%, N = 32). The majority of studies using visual analysis did not report any data aspect (42.25%, N = 30), closely followed by several data aspects (40.85%, N = 29). Randomization was present in 20.53% (N = 16) of all studies using visual analysis.
Descriptive statistics
Descriptive statistics, without the use of visual analysis, was the analytical method used in 3.78% (N = 16) of all included studies. The most common designs for studies using descriptive statistics were phase designs and multiple baseline designs (both 43.75%, N = 7). Half of the studies using descriptive statistics (50.00%, N = 8) analyzed the data aspect level, and 37.5% (N = 6) analyzed several data aspects. One study (6.25%) using descriptive statistics included randomization.
Inferential statistics
Inferential statistics, without the use of visual analysis, was the analytical method used in 2.84% (N = 12) of all included studies. The majority of studies using inferential statistics were phase designs (58.33%, N = 7) and did not report any of the six data aspects (58.33%, N = 7). Of the remaining studies, three (25.00%) reported several data aspects, and two (16.67%) analyzed the data aspect level. Two studies (16.67) using inferential statistical analysis included randomization.
Descriptive and inferential statistics
Descriptive statistics combined with inferential statistics, but without the use of visual analysis, accounted for 5.67% (N = 24) of all included studies. The majority of studies using this combination of analytical methods were multiple baseline designs (62.5%, N = 15), followed by phase designs (33.33%, N = 8). There were no alternation or hybrid designs using descriptive and inferential statistics. Most of the studies using descriptive and inferential statistics analyzed several data aspects (41.67%, N = 10), followed by the data aspect level (29.17%, N = 7); 16.67% (N = 4) of the studies using descriptive and inferential statistics included randomization.
Visual and descriptive statistics
As mentioned previously, visual analysis paired with descriptive statistics was the most popular analytical method. This method was used in nearly half (48.94%, N = 207) of all included studies. The majority of these studies were multiple baseline designs (50.24%, N = 104), followed by phase designs (21.25%, N = 44). This method of analysis was prevalent across all designs. Nearly all of the studies using this combination of analytical methods analyzed either several data aspects (83.57%, N = 173) or level only (14.98%, N = 31). Randomization was present in 19.81% (N = 41) of all studies using visual and descriptive analysis.
Visual and inferential statistics
Visual analysis paired with inferential statistics accounted for 2.60% (N = 11) of the included studies. The largest proportion of these studies were phase designs (45.45%, N = 5), followed by multiple baseline designs and hybrid designs (both 27.27%, N = 3). This combination of analytical methods was thus not used in alternation or changing criterion designs. The majority of studies using visual analysis and inferential statistics analyzed several data aspects (72.73%, N = 8), while 18.18% (N = 2) did not report any data aspect. One study (9.10%) included randomization.
Visual, descriptive, and inferential statistics
A combination of visual analysis, descriptive statistics, and inferential statistics was used in 18.44% (N = 78) of all included studies. The majority of the studies using this combination of analytical methods were multiple baseline designs (56.41%, N = 44), followed by phase designs (23.08%, N = 18). This analytical approach was used in all designs except changing criterion designs. Nearly all studies using a combination of these three analytical methods analyzed several data aspects (97.44%, N = 76). These studies also showed the highest proportion of randomization (38.46%, N = 30).
None of the above
A small proportion of studies did not use any of the above analytical methods (0.95%, N = 4). Three of these studies (75%) were phase designs and did not report any data aspect. One study (25%) was a multiple baseline design that analyzed several data aspects. Randomization was not used in any of these studies.
Discussion
To our knowledge, the present article is the first systematic review of SCEDs specifically looking at the frequency of the six data aspects in applied research. The systematic review has shown that level is by a large margin the most widely analyzed data aspect in recently published SCEDs. The second most popular data aspect from the WWC guidelines was variability, which was usually assessed alongside level (e.g., a combination of mean and standard deviation or range). The fact that these two data aspects are routinely assessed in group studies may be indicative of a lack of familiarity with SCED-specific analytical methods by applied researchers, but this remains speculative. Phase designs showed the highest proportion of studies not reporting any of the six data aspects and the second lowest number of data aspects analyzed on average, only second to changing criterion designs. This was an unexpected finding given that the WWC guidelines were developed specifically in the context of (and with examples of) phase designs. The multiple baseline design showed the highest number of data aspects analyzed and at the same time the lowest proportion of studies not analyzing any of the six data aspects.
These findings regarding the analysis and reporting of the six data aspects need more contextualization. The selection of data aspects for the analysis depends on the research questions and expected data pattern. For example, if the aim of the intervention is a gradual change over time, then trend becomes more important. If the aim of the intervention is a change in level, then it is import to also assess trend (to verify that the change in level is not just a continuation of a baseline trend) and variability (to assess whether the change in level is caused by excessive variability). In addition, assessing consistency can add information on whether the change in level is consistent over several repetitions of experimental conditions (e.g., in phase designs). Similarly, if an abrupt change in level of target behavior is expected after changing experimental conditions, then immediacy becomes a more relevant data aspect in addition to trend, variability, and level. The important point here is that oftentimes the research team has an idea of the expected data pattern and should choose the analysis of data aspects accordingly. The strong prevalence of level found in the present review could be indicative of a failure to assess other data aspects that may be relevant to demonstrate experimental control over an independent variable.
In line with the findings of earlier systematic reviews (Hammond & Gast, 2010; Shadish & Sullivan, 2011; Smith, 2012), the multiple baseline design continues to be the most frequently used design, and despite the advancement of sophisticated statistical methods for the analysis of SCEDs, two thirds of all studies still relied on visual analysis alone or visual analysis paired with descriptive statistics. A comparison to the findings of Shadish and Sullivan further reveals that the number of participants included in SCEDs has remained steady over the past decade at around three to four participants. The relatively small number of changing criterion designs in the present findings is partly due to the fact that changing criterion designs were often combined with other designs and thus coded in the hybrid category, even though we did not formally quantify that. This finding is supported by the results of Shadish and Sullivan, who found that changing criterion designs are more often used as part of hybrid designs than as a standalone design. Hammond and Gast even excluded changing criterion design from their review due to its low prevalence. They found a total of six changing criterion designs published over a period of 35 years. It should be noted, however, that the low prevalence of changing criterion designs is not indicative of the value of this design.
Regarding randomization, the results cannot be interpreted against earlier benchmarks, as neither Smith nor Shadish and Sullivan or Hammond and Gast quantified the proportion of randomized SCEDs. Overall, randomization in the study design was not uncommon. However, the proportion of randomized SCEDs differed greatly between different designs. The results showed that alternating treatments designs have the highest proportion of studies including randomization. This result was to be expected given that alternating treatments designs are particularly suited to incorporate randomization. In fact, when Barlow and Hayes (1979) first introduced the alternating treatments design, they emphasized randomization as an important part of the design: “Among other considerations, each design controls for sequential confounding by randomizing the order of treatment […]” (p. 208). Besides that, alternating treatments designs could work with already existing randomization procedures, such as the randomized block procedure proposed by Edgington (1967). The different design options for alternating treatments designs (e.g., randomized block design) and accompanying randomization procedures are discussed in detail in Manolov and Onghena (2018). For multiple baseline designs, a staggered introduction of the intervention is needed. Proposals to randomize the order of the introduction of the intervention have been around since the 1980s (Marascuilo & Busk, 1988; Wampold & Worsham, 1986). These randomization procedures have their counterparts in group studies where particpants are randomdly assigned to treatments or different blocks of treatments. Other randomization procedures for multiple baseline designs are discussed in Levin et al. (2018). These include the restricted Marascuilo–Busk procedure proposed by Koehler and Levin and the randomization test procedure proposed by Revusky. For phase designs and changing criterion designs, the incorporation of randomization is less evident. For phase designs, Onghena (1992) proposed a method to randomly determine the moment of phase change between two succesive phases. However, this method is rather uncommon and has no counterpart in group studies. Specific randomization schemes for changing criterion designs have only very recently been proposed (Ferron et al., 2019; Manolov et al., 2020; Onghena et al., 2019), and it remains to be seen how common they will become in applied SCEDs.
Implications for SCED research
The results of the systematic review have several implications for SCED research regarding methodology and analyses. An important finding of the present study is that the frequency of use of randomization differs greatly between different designs. For example, while phase designs were found to be the second most popular design, randomization is used very infrequently for this design type. Multiple baseline designs, as the most frequently used design, showed a higher percentage of randomized studies, but only every fifth study used randomization. Given that randomization in the study design increases the internal and statistical conclusion validity irrespective of the design, it seems paramount to further stress the importance of the inclusion of randomization beyond alternating treatments designs. Another implication concerns the analysis of specific data aspects. While level was by a large margin the most popular data aspect, it is important to stress that conclusions based on only one data aspect may be misleading. This seems particularly relevant for phase designs, which were found to contain the highest proportion of studies not reporting any of the six data aspects and the lowest proportion of studies analyzing several data aspects (apart from changing criterion designs, which only accounted for a very small proportion of the included studies). A final implication concerns the use of analytical methods, in particular triangulation of different methods. Half of the included studies used visual analysis paired with descriptive statistics. These methods should of course not be discarded, as they generate important information about the data, but they cannot make statements regarding the uncertainty of a possible intervention effect. Therefore, triangulation of visual analysis, descriptive statistics, and inferential statistics should form an important part of future guidelines on SCED analysis.
Reflections on updated WWC guidelines
Updated WWC guidelines were recently published, after the present systematic review had been conducted (What Works Clearinghouse, 2020a, 2020c). Two major changes in the updated guidelines are of direct relevance to the present systematic review: (a) the removal of visual analysis for demonstrating intervention effectiveness and (b) recommendation for a design comparable effect size measure for demonstrating intervention effects (D-CES, Pustejovsky et al., 2014; Shadish et al., 2014). This highlights a clear shift away from visual analysis towards statistical analysis of SCED data, especially compared to the 2010 guidelines. These changes in the guidelines have prompted responses from the public, to which What Works Clearinghouse (2020b) published a statement addressing the concerns. Several concerns relate to the removal of visual analysis. In response to a concern that visual analysis should be reinstated, the panel clearly states that “visual analysis will not be used to characterize study findings” (p. 3). Another point from the public concerned the analysis of studies where no effect size can be calculated (e.g., due to unavailability of raw data). Even in these instances, the panel does not recommend visual analysis. Rather, “the WWC will extract raw data from those graphs for use in effect size computation” (p. 4). In light of the present findings, these statements are particularly noteworthy. Given that the present review found a strong continued reliance on visual analysis, it remains to be seen if and how the updated WWC guidelines impact the analyses conducted by applied SCED researchers.
Another update of relevance in the recent guidelines concerns the use of design categories. While the 2010 guidelines were demonstrated with the example of a phase design, the updated guidelines include quality rating criteria for each major design option. Given that the present results indicate a very low prevalence of the changing criterion design in applied studies, the inclusion of this design in the updated guidelines may increase the prominence of the changing criterion design. For changing criterion designs, the updated guidelines recommend that “the reversal or withdrawal (AB) design standards should be applied to changing criterion designs” (What Works Clearinghouse, 2020c, p. 80). With phase designs being the second most popular design choice, this could further facilitate the use of the changing criterion design.
While other guidelines on conduct and analysis (e.g., Tate et al., 2013), as well as members of the 2010 What Works Clearinghouse panel (Kratochwill & Levin, 2014), have clearly highlighted the added value of randomization in the design, the updated guidelines do not include randomization procedures for SCEDs. Regarding changes between experimental conditions, the updated guidelines state that “the independent variable is systematically manipulated, with the researcher determining when and how the independent variable conditions change” (What Works Clearinghouse, 2020c, p. 82). While the frequency of use of randomization differs considerably between different designs, the present review has shown that overall randomization is not uncommon. The inclusion of randomization in the updated guidelines may therefore have offered guidance to applied researchers wishing to incorporate randomization into their SCEDs, and may have further contributed to the popularity of randomization.
Limitations and future research
One limitation of the current study concerns the used databases. SCEDs that were published in journals that are not indexed in these databases may not have been included in our sample. A similar limitation concerns the search terms used in the systematic search. In this systematic review, we focused on the common names “single-case” and “single-subject.” However, as Shadish and Sullivan (2011) note, SCEDs go by many names. They list several less common alternative terms: instrasubject replication design (Gentile et al., 1972), n-of-1 design (Center et al., 1985-86), intrasubject experimental design (White et al., 1989), one-subject experiment (Edgington, 1980), and individual organism research (Michael, 1974). Even though these terms date back to the 1970s and 1980s, a few authors may still use them to describe their SCED studies. Studies using these terms may not have come up during the systematic search. It should furthermore be noted that we followed the original description provided by the authors for the coding of the design and analysis to reduce bias. We therefore made no judgments regarding the correctness or accuracy of the authors’ naming of the design and analysis techniques.
The systematic review offers several avenues for future research. The first avenue may be to explore more in depth the reasons for the unequal distribution of data aspects. As the systematic review has shown, level is assessed far more often than the other five data aspects. While level is an important data aspect, failing to assess it alongside other data aspects can lead to erroneous conclusions. Gaining an understanding of the reasons for the prevalence of level, for example through author interviews or questionnaires, may help to improve the quality of data analysis in applied SCEDs.
In a similar vein, a second avenue of future research may explore why randomization is much more prevalent in some designs. Apart from the aforementioned differences in randomization procedures between designs, it may be of interest to gain a better understanding of the reasons that applied researchers see for randomizing their SCEDs. As the incorporation of randomization enhances the internal validity of the study design, promoting the inclusion of randomization for designs other than alternation designs will help in advancing the credibility of SCEDs in the scientific community. Searching the methodological sections of the articles that used randomization may be a first step to gain a better understanding of why applied researchers use randomization. Such a text search may reveal how the authors discuss randomization and which reasons they name for randomizing. A related question is how the randomization was actually carried out. For example, was the randomization carried out a priori or in a restricted way taking into account the evolving data pattern? A deeper understanding of the reasons for randomizing and the mechanisms of randomization may be gained by author interviews or questionnaires.
A third avenue of future research may explore in detail the specifics of inferential analytical methods used to analyze SCED data. Within the scope of the present review, we only distinguished between visual, descriptive and inferential statistics. However, deeper insight into the inferential analysis methods and their application to SCED data may help to understand the viewpoint of applied researchers. This may be achieved through a literature review of articles that use inferential analysis. Research questions for such a review may include: Which inferential methods do applied SCED researchers use and what is the frequency of these methods? Are these methods adapted to SCED methodology? And how do applied researchers justify their choice for an inferential method? Similar questions may also be answered for effect size measures understood as descriptive statistics. For example, why do applied researchers choose a particular effect size measure over a competing one? Are these effect size measures adapted to SCED research?
Finally, future research may go into greater detail about the descriptive statistics used in SCEDs. In the present review, we distinguished between two major categories: descriptive and inferential statistics. Effect sizes that were not accompanied by a standard error, confidence limits, or by the result of a significance test were coded in the descriptive statistics category. Effect sizes do however go beyond merely summarizing the data by quantifying the treatment effect between different experimental conditions, contrary to within phase quantifications such as the mean and standard deviation. Therefore, future research may examine in greater detail the use of effect sizes separately from other descriptive statistics such the mean and standard deviation. Such research could focus in depth on the exact methods used to quantify each data aspect in the form of either a quantification (e.g., mean or range) or an effect size measure (e.g., standardized mean difference or variance ratios).
Notes
As holds true for most single-case designs, the same design is often described with different terms. For example, Ledford and Gast (2018) call these designs combination designs, and Moeyaert et al. (2020) call them combined designs. Given that this is a purely terminological question, it is hard to argue in favor of one term over the other. We do, however, prefer the term hybrid, given that it emphasizes that neither of the designs remains in its pure form. For example, a multiple baseline design with alternating treatments is not just a combination of a multiple baseline design and an alternating treatments design. It is rather a hybrid of the two. This term is also found in recent literature (e.g., Pustejovski & Ferron, 2017; Swan et al., 2020).
For the present systematic review, we strictly followed the data aspects as outlined in the 2010 What Works Clearinghouse guidelines. While the assessment of consistency of effects is an important data aspect, this data aspect is not described in the guidelines. Therefore, we did not code it in the present review.
References
Baek, E. K., Petit-Bois, M., Van den Noortgate, W., Beretvas, S. N., & Ferron, J. M. (2016). Using visual analysis to evaluate and refine multilevel models of single-case studies. The Journal of Special Education, 50, 18-26. https://doi.org/10.1177/0022466914565367.
Barlow, D. H., & Hayes, S. C. (1979). Alternating Treatments Design: One Strategy for Comparing the Effects of Two Treatments in a Single Subject. Journal of Applied Behavior Analysis, 12, 199-210. https://doi.org/10.1901/jaba.1979.12-199.
Barlow, D. H., Nock, M. K., & Hersen, M. (2009). Single case experimental designs: Strategies for studying behavior change (3rd). Pearson.
Beretvas, S. N., & Chung, H. (2008). A review of meta-analyses of single-subject experimental designs: Methodological issues and practice. Evidence-Based Communication Assessment and Intervention, 2, 129-141. https://doi.org/10.1080/17489530802446302.
Center, B. A., Skiba, R. J., & Casey, A. (1985-86). A Methodology for the Quantitative Synthesis of Intra-Subject Design research. Journal of Special Education, 19, 387–400. https://doi.org/10.1177/002246698501900404.
Edgington, E. S. (1967). Statistical inference from N=1 experiments. The Journal of Psychology, 65, 195-199. https://doi.org/10.1080/00223980.1967.10544864.
Edgington, E. S. (1975). Randomization tests for one-subject operant experiments. The Journal of Psychology, 90, 57-68. https://doi.org/10.1080/00223980.1975.9923926.
Edgington, E. S. (1980). Random assignment and statistical tests for one-subject experiments. Journal of Educational Statistics, 5, 235-251.
Ferron, J., Rohrer, L. L., & Levin, J. R. (2019). Randomization procedures for changing criterion designs. Behavior Modification https://doi.org/10.1177/0145445519847627.
Gentile, J. R., Roden, A. H., & Klein, R. D. (1972). An analysis-of-variance model for the intrasubject replication design. Journal of Applied Behavior Analysis, 5, 193-198. https://doi.org/10.1901/jaba.1972.5-193.
Gusenbauer, M., & Haddaway, N. R. (2019). Which academic search systems are suitable for systematic Reviews or meta-analyses? Evaluating retrieval qualities of Google Scholar, PubMed and 26 other Resources. Research Synthesis Methods https://doi.org/10.1002/jrsm.1378.
Hammond, D., & Gast, D. L. (2010). Descriptive analysis of single subject research designs: 1983—2007. Education and Training in Autism and Developmental Disabilities, 45, 187-202.
Harrington, M. A. (2013). Comparing visual and statistical analysis in single-subject studies. Open Access Dissertations, Retrieved from http://digitalcommons.uri.edu/oa_diss.
Hedges, L. V., Pustejovsky, J. E., & Shadish, W. R. (2012). A standardized mean difference effect size for single case designs. Research Synthesis Methods, 3, 224-239. https://doi.org/10.1002/jrsm.1052.
Hedges, L. V., Pustejovsky, J. E., & Shadish, W. R. (2013). A standardized mean difference effect size for multiple baseline designs across individuals. Research Synthesis Methods, 4, 324-341. https://doi.org/10.1002/jrsm.1086.
Heyvaert, M., & Onghena, P. (2014). Analysis of single-case data: Randomization tests for measures of effect size. Neuropsychological Rehabilitation, 24, 507-527. https://doi.org/10.1080/09602011.2013.818564.
Hitchcock, J. H., Horner, R. H., Kratochwill, T. R., Levin, J. R., Odom, S. L., Rindskopf, D. M., & Shadish, W. R. (2014). The What Works Clearinghouse single-case design pilot standards: Who will guard the guards? Remedial and Special Education, 35, 145-152. https://doi.org/10.1177/0741932513518979.
Horner, R. H., Carr, E. G., Halle, J., McGee, G., Odom, S., & Wolery, M. (2005). The use of single-subject research to identify evidence-based practice in special education. Exceptional Children, 71, 165-179. https://doi.org/10.1177/001440290507100203.
Kazdin, A. E. (1982). Single-case research designs: Methods for clinical and applied settings. Oxford University Press.
Kazdin, A. E. (2011). Single-case research designs: Methods for clinical and applied settings (2nd). Oxford University Press.
Kratochwill, T. R., Hitchcock, J., Horner, R. H., Levin, J. R., Odom, S. L., Rindskopf, D. M., & Shadish, W. R. (2010). Single-case designs technical documentation. Retrieved from What Works Clearinghouse: https://files.eric.ed.gov/fulltext/ED510743.pdf
Kratochwill, T. R., Hitchcock, J., Horner, R. H., Levin, J. R., Odom, S. L., Rindskopf, D. M., & Shadish, W. R. (2013). Single-case intervention research design standards. Remedial and Special Education, 34, 26-38. https://doi.org/10.1177/0741932512452794.
Kratochwill, T. R., & Levin, J. R. (2014). Meta- and statistical analysis of single-case intervention research data: Quantitative gifts and a wish list. Journal of School Psychology, 52, 231-235. https://doi.org/10.1016/j.jsp.2014.01.003.
Kromrey, J. D., & Foster-Johnson, L. (1996). Determining the efficacy of intervention: The use of effect sizes for data analysis in single-subject research. The Journal of Experimental Education, 65, 73-93. https://doi.org/10.1080/00220973.1996.9943464.
Lane, J. D., & Gast, D. L. (2014). Visual analysis in single case experimental design studies: Brief review and guidelines. Neuropsychological Rehabilitation, 24, 445-463. https://doi.org/10.1080/09602011.2013.815636.
Ledford, J. R., & Gast, D. L. (Eds.) (2018). Single case research methodology: Applications in special education and behavioral sciences (3rd). Routledge.
Levin, J. R. (1994). Crafting educational intervention research that's both credible and creditable. Educational Psychology Review, 6, 231-243. https://doi.org/10.1007/BF02213185.
Levin, J. R., Ferron, J. M., & Gafurov, B. S. (2018). Comparison of randomization-test procedures for single-case multiple-baseline designs. Developmental Neurorehabilitation, 21, 290-311. https://doi.org/10.1080/17518423.2016.1197708.
Levin, J. R., Ferron, J. M., & Gafurov, B. S. (2020). Investigation of single-case multiple-baseline randomization tests of trend and variability. Educational Psychology Review. https://doi.org/10.1007/s10648-020-09549-7.
Ma, H.-H. (2006). Quantitative synthesis of single-subject researches: Percentage of data points exceeding the median. Behavior Modification, 30, 598-617. https://doi.org/10.1177/0145445504272974.
Maggin, D. M., Briesch, A. M., & Chafouleas, S. M. (2013). An application of the What Works Clearinghouse standards for evaluating single-subject research: Synthesis of the self-management literature base. Remedial and Special Education, 34, 44-58. https://doi.org/10.1177/0741932511435176.
Manolov, R. (2018). Linear trend in single-case visual and quantitative analyses. Behavior Modification, 42, 684-706. https://doi.org/10.1177/0145445517726301.
Manolov, R., & Moeyaert, M. (2017). Recommendations for choosing single-case data analytical techniques. Behavior Therapy, 48, 97-114. https://doi.org/10.1016/j.beth.2016.04.008.
Manolov, R., & Onghena, P. (2018). Analyzing data from single-case alternating treatments designs. Psychological Methods, 23, 480-504. https://doi.org/10.1037/met0000133.
Manolov, R., & Solanas, A. (2018). Analytical options for single-case experimental designs: Review and application to brain impairment. Brain Impairment, 19, 18-32. https://doi.org/10.1017/BrImp.2017.17.
Manolov, R., Solanas, A., & Sierra, V. (2020). Changing Criterion Designs: Integrating Methodological and Data Analysis Recommendations. The Journal of Experimental Education, 88, 335-350. https://doi.org/10.1080/00220973.2018.1553838.
Marascuilo, L., & Busk, P. (1988). Combining statistics for multiple-baseline AB and replicated ABAB designs across subjects. Behavioral Assessment, 10, 1-28.
Michael, J. (1974). Statistical inference for individual organism research: Mixed blessing or curse? Journal of Applied Behavior Analysis, 7, 647-653. https://doi.org/10.1901/jaba.1974.7-647.
Michiels, B., Heyvaert, M., Meulders, A., & Onghena, P. (2017). Confidence intervals for single-case effect size measures based on randomization test inversion. Behavior Research Methods, 49, 363-381. https://doi.org/10.3758/s13428-016-0714-4.
Moeyaert, M., Akhmedjanova, D., Ferron, J. M., Beretvas, S. N., & Van den Noortgate, W. (2020). Effect size estimation for combined single-case experimental designs. Evidence-Based Communication Assessment and Intervention, 14, 28-51. https://doi.org/10.1080/17489539.2020.1747146.
Moeyaert, M., Ferron, J. M., Beretvas, S. N., & Van den Noortgate, W. (2014a). From a single-level analysis to a multilevel analysis of single-case experimental designs. Journal of School Psychology, 52, 191-211. https://doi.org/10.1016/j.jsp.2013.11.003.
Moeyaert, M., Ugille, M., Ferron, J. M., Beretvas, S. N., & Van den Noortgate, W. (2014b). Three-level analysis of single-case experimental data: Empirical validation. The Journal of Experimental Education, 82, 1-21. https://doi.org/10.1080/00220973.2012.745470.
O’Brien, S., & Repp, A. C. (1990). Reinforcement-based reductive procedures: A review of 20 years of their use with persons with severe or profound retardation. Journal of the Association for Persons with Severe Handicaps, 15, 148–159. https://doi.org/10.1177/154079699001500307.
Onghena, P. (1992). Randomization tests for extensions and variations of ABAB single-case experimental designs: A rejoinder. Behavioral Assessment, 14, 153-172.
Onghena, P., & Edgington, E. S. (1994). Randomization tests for restricted alternating treatment designs. Behaviour Research and Therapy, 32, 783-786. https://doi.org/10.1016/0005-7967(94)90036-1.
Onghena, P., & Edgington, E. S. (2005). Customization of pain treatments: Single-case design and analysis. The Clinical Journal of Pain, 21, 56-68. https://doi.org/10.1097/00002508-200501000-00007.
Onghena, P., Tanious, R., De, T. K., & Michiels, B. (2019). Randomization tests for changing criterion designs. Behaviour Research and Therapy, 117, 18-27. https://doi.org/10.1016/j.brat.2019.01.005.
Ottenbacher, K. J. (1990). When is a picture worth a thousand p values? A comparison of visual and quantitative methods to analyze single subject data. The Journal of Special Education, 23, 436-449. https://doi.org/10.1177/002246699002300407.
Parker, R. I., Hagan-Burke, S., & Vannest, K. (2007). Percentage of all non-overlapping data (PAND): An alternative to PND. The Journal of Special Education, 40, 194-204. https://doi.org/10.1177/00224669070400040101.
Parker, R. I., Vannest, K. J., & Davis, J. L. (2011). Effect Size in Single-Case Research: A Review of Nine Nonoverlap Techniques. Behavior Modification, 35, 303-322. https://doi.org/10.1177/0145445511399147.
Pustejovski, J. E., & Ferron, J. M. (2017). Research synthesis and meta-analysis of single-case designs. In J. M. Kaufmann, D. P. Hallahan, & P. C. Pullen, Handbook of Special Education (pp. 168-185). New York: Routledge.
Pustejovsky, J. E., Hedges, L. V., & Shadish, W. R. (2014). Design-comparable effect sizes in multiple baseline designs: A general modeling framework. Journal of Educational and Behavioral Statistics, 39, 368-393. https://doi.org/10.3102/1076998614547577.
Scruggs, T. E., Mastropieri, M. A., & Casto, G. (1987). The quantitative synthesis of single-subject research: Methodology and validation. Remedial and Special Education, 8, 24-33. https://doi.org/10.1177/074193258700800206.
Shadish, W. R., Hedges, L. V., & Pustejovsky, J. E. (2014). Analysis and meta-analysis of single-case designs with a standardized mean difference statistic: A primer and applications. Journal of School Psychology, 52, 123–147. https://doi.org/10.1016/j.jsp.2013.11.005.
Shadish, W. R., Rindskopf, D. M., & Hedges, L. V. (2008). The state of the science in the meta-analysis of single-case experimental designs. Evidence-Based Communication Assessment and Intervention, 2, 188-196. https://doi.org/10.1080/17489530802581603.
Shadish, W. R., & Sullivan, K. J. (2011). Characteristics of single-case designs used to assess intervention effects in 2008. Behavior Research Methods, 43, 971-980. https://doi.org/10.3758/s13428-011-0111-y.
Smith, J. D. (2012). Single-case experimental designs: A systematic review of published research and current standards. Psychological Methods, 17, 510-550. https://doi.org/10.1037/a0029312.
Solanas, A., Manolov, R., & Onghena, P. (2010). Estimating slope and level change in N=1 designs. Behavior Modification, 34, 195-218. https://doi.org/10.1177/0145445510363306.
Solomon, B. G. (2014). Violations of school-based single-case data: Implications for the selection and interpretation of effect sizes. Behavior Modification, 38, 477-496. https://doi.org/10.1177/0145445513510931.
Staples, M., & Niazi, M. (2007). Experiences using systematic review guidelines. The Journal of Systems and Software, 80, 1425-1437. https://doi.org/10.1016/j.jss.2006.09.046.
Swan, D. M., Pustejovsky, J. E., & Beretvas, S. N. (2020). The impact of response-guided designs on count outcomes in single-case experimental design baselines. Evidence-Based Communication Assessment and Intervention, 14, 82-107. https://doi.org/10.1080/17489539.2020.1739048.
Tanious, R., De, T. K., Michiels, B., Van den Noortgate, W., & Onghena, P. (2019). Consistency in single-case ABAB phase designs: A systematic review. Behavior Modification https://doi.org/10.1177/0145445519853793.
Tanious, R., De, T. K., Michiels, B., Van den Noortgate, W., & Onghena, P. (2020). Assessing consistency in single-case A-B-A-B phase designs. Behavior Modification, 44, 518-551. https://doi.org/10.1177/0145445519837726.
Tate, R. L., Perdices, M., Rosenkoetter, U., McDonald, S., Togher, L., Shadish, W. R., … Vohra, S. (2016b). The Single-Case Reporting guideline In BEhavioural Interventions (SCRIBE) 2016: Explanation and Elaboration. Archives of Scientific Psychology, 4, 1-9. https://doi.org/10.1037/arc0000026.
Tate, R. L., Perdices, M., Rosenkoetter, U., Shadish, W. R., Vohra, S., Barlow, D. H., … Wilson, B. (2016a). The Single-Case Reporting guideline In BEhavioural interventions (SCRIBE) 2016 statement. Aphasiology, 30, 862-876. https://doi.org/10.1080/02687038.2016.1178022.
Tate, R. L., Perdices, M., Rosenkoetter, U., Wakim, D., Godbee, K., Togher, L., & McDonald, S. (2013). Revision of a method quality rating scale for single-case experimental designs and n-of-1 trials: The 15-item Risk of Bias in N-of-1 Trials (RoBiNT) Scale. Neuropsychological Rehabilitation, 23, 619-638. https://doi.org/10.1080/09602011.2013.824383.
Van den Noortgate, W., & Onghena, P. (2003). Hierarchical linear models for the quantitative integration of effect sizes in single-case research. Behavior Research Methods, Instruments, & Computers, 35, 1-10. https://doi.org/10.3758/bf03195492.
Van den Noortgate, W., & Onghena, P. (2008). A multilevel meta-analysis of single-subject experimental design studies. Evidence-Based Communication Assessment and Intervention, 2, 142-151. https://doi.org/10.1080/17489530802505362.
Vohra, S., Shamseer, L., Sampson, M., Bukutu, C., Schmid, C. H., Tate, R., … Group, TC (2016). CONSORT extension for reporting N-of-1 trials (CENT) 2015 statement. Journal of Clinical Epidemiology, 76, 9–17. https://doi.org/10.1016/j.jclinepi.2015.05.004.
Wampold, B., & Worsham, N. (1986). Randomization tests for multiple-baseline designs. Behavioral Assessment, 8, 135-143.
What Works Clearinghouse. (2020a). Procedures Handbook (Version 4.1). Retrieved from Institute of Education Sciences: https://ies.ed.gov/ncee/wwc/Docs/referenceresources/WWC-Procedures-Handbook-v4-1-508.pdf
What Works Clearinghouse. (2020b). Responses to comments from the public on updated version 4.1 of the WWC Procedures Handbook and WWC Standards Handbook. Retrieved from Institute of Education Sciences: https://ies.ed.gov/ncee/wwc/Docs/referenceresources/SumResponsePublicComments-v4-1-508.pdf
What Works Clearinghouse. (2020c). Standards Handbook, version 4.1. Retrieved from Institute of Education Sciences: https://ies.ed.gov/ncee/wwc/Docs/referenceresources/WWC-Standards-Handbook-v4-1-508.pdf
White, D. M., Rusch, F. R., Kazdin, A. E., & Hartmann, D. P. (1989). Applications of meta-analysis in individual-subject research. Behavioral Assessment, 11, 281-296.
Wolery, M. (2013). A commentary: Single-case design technical document of the What Works Clearinghouse. Remedial and Special Education, 39-43. https://doi.org/10.1177/0741932512468038.
Woo, H., Lu, J., Kuo, P., & Choi, N. (2016). A content analysis of articles focusing on single-case research design: ACA journals between 2003 and 2014. Asia Pacific Journal of Counselling and Psychotherapy, 7, 118-132. https://doi.org/10.1080/21507686.2016.1199439.
Author information
Authors and Affiliations
Corresponding author
Additional information
Publisher’s note
Springer Nature remains neutral with regard to jurisdictional claims in published maps and institutional affiliations.
Electronic supplementary material
ESM 1
(DOCX 110 kb)
Rights and permissions
About this article

Cite this article
Tanious, R., Onghena, P. A systematic review of applied single-case research published between 2016 and 2018: Study designs, randomization, data aspects, and data analysis. Behav Res 53, 1371–1384 (2021). https://doi.org/10.3758/s13428-020-01502-4
Accepted:
Published:
Issue Date:
DOI: https://doi.org/10.3758/s13428-020-01502-4