
Abstract
We present word prevalence data for 61,858 English words. Word prevalence refers to the number of people who know the word. The measure was obtained on the basis of an online crowdsourcing study involving over 220,000 people. Word prevalence data are useful for gauging the difficulty of words and, as such, for matching stimulus materials in experimental conditions or selecting stimulus materials for vocabulary tests. Word prevalence also predicts word processing times, over and above the effects of word frequency, word length, similarity to other words, and age of acquisition, in line with previous findings in the Dutch language.
Researchers working with word stimuli are taught to select words primarily on the basis of word frequency, word length, similarity to other words, and age of acquisition (e.g., Brysbaert et al., 2011). For instance, a researcher investigating the effect of emotional valence (negative, neutral, positive) on word processing efficiency would be expected to match the stimuli on those four variables.
In our work we have gradually discovered that the set of variables above does not fully cover differences in word knowledge. This is particularly true for low-frequency words. Some of these words are generally known (such as toolbar, screenshot, soulmate, uppercase, hoodie), whereas others are hardly known by anyone (e.g., scourage, thunk, whicker, or caudle). Furthermore, none of the other word variables that have been collected so far seem to fully catch the differences in word knowledge.
For a long time, we hoped that improved word frequency measures would solve the problem, but so far this anticipation has not been met: Some words are much better known than we would expect from the frequency with which they are used in the corpora we have at our disposal to calculate word frequency measures. Subjective word familiarity ratings may be an alternative (Gernsbacher, 1984), but so far they have not been collected for most of the words. In addition, such ratings can be criticized, because they are collected from a small number of people (who may be more or less familiar with some words for idiosyncratic reasons). In addition, there is a difference between how many people know a word and how familiar they are with the word. Some words score low on familiarity but are known to nearly everyone (such as basilisk, obelisk, oxymoron, debacle, emporium, and armadillo).
The variable that currently seems to best capture differences in word knowledge is age of acquisition (AoA): Words that are not known to raters get high AoA scores. Indeed, some researchers in natural language processing have started using AoA values as a proxy for word difficulty, in addition to word frequency. However, this is not the common understanding of AoA, which is considered to be the order in which known words were acquired.
To solve the issue of differences in word knowledge that are unrelated to word frequency, we decided to directly ask people which words they knew. This was first done in Dutch (Brysbaert, Stevens, Mandera, & Keuleers, 2016b; Keuleers, Stevens, Mandera, & Brysbaert, 2015) and gave rise to a new word characteristic, which we called word prevalence. This variable refers to the percentage of people who indicate that they know the word (in practice, the percentages are transformed to z values; see below for more details). Word prevalence explained an additional 6% of variance in Dutch word processing times as measured with the lexical decision task. Even at the high end it had an effect, since we observed a 20-ms difference in response times between words known to all participants and words known to only 99% of the participants (Brysbaert et al., 2016b).
The present article introduces the word prevalence measure for English and presents some initial analyses.
Method
Stimulus materials
The stimuli consisted of a list of 61,858 English words, collected over the years at the Center for Reading Research, Ghent University. The list is based largely on the SUBTLEX word frequencies we collected, combined with word lists from psycholinguistic experiments and from freely available spelling checkers and dictionaries. The nonwords consisted of a list of 329,851 pseudowords generated by Wuggy (Keuleers & Brysbaert, 2010).
Participants and the vocabulary test used
For each vocabulary test, a random sample of 67 words and 33 nonwords was selected. For each letter string, participants had to indicate whether or not they knew the stimulus. At the end of the test, participants received information about their performance, in the form of a vocabulary score based on the percentage of correctly identified words minus the percentage of nonwords identified as words. For instance, a participant who responded “yes” to 55 of the 67 words and to 2 of the 33 nonwords received feedback that they knew 55/67 – 2/33 = 76% of the English vocabulary. Participants could do the test multiple times and always got a different sample of words and nonwords. The test was made available on a dedicated website (http://vocabulary.ugent.be/). Access to the test was unlimited. Participants were asked whether English was their native language, what their age and gender were, which country they came from, and their level of education (see also Brysbaert, Stevens, Mandera, & Keuleers, 2016a; Keuleers et al., 2015). For the present purposes, we limited the analyses to the first three tests taken by native speakers of English from the USA and the UK.Footnote 1 All in all, we analyzed the data of 221,268 individuals who completed 265,346 sessions. Of these, 56% were completed by female participants and 44% by male participants.
Results
In the dataset we selected, each word was judged on average by 388 participants (282 from the USA and 106 from the UK). The percentages of people indicating they knew the word ranged from 2% (for stotinka, adyta, kahikatea, gomuti, arseniuret, alsike, . . .) to 100% (. . . , you, young, yourself, zone, zoned). Figure 1 shows the distribution of percentages known. The vast majority of words were known to 90% or more of the participants.
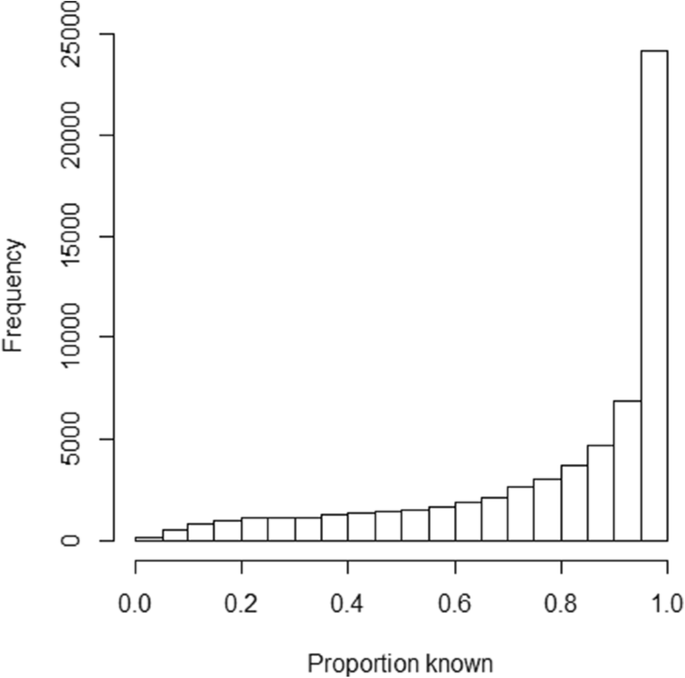
Distribution of percentages of words known, showing that most words were known to 90% and more of the participants (see the rightmost two columns of the graph).
Because the distribution of percentages known was very right-skewed and did not differentiate much between well-known words, it was useful to apply a probit transformation to the percentages (Brysbaert et al., 2016b). The probit function translates percentages known to z values on the basis of the cumulative normal distribution. That is, a word known by 2.5% of the participants would have a word prevalence of – 1.96; a word known by 97.5% of the participants would have a prevalence of + 1.96. Because a word known by 0% of participants would return a prevalence score of – ∞ and a percentage known of 100% would return a prevalence score of + ∞, the range was reduced to percentages known from 0.5% (prevalence = – 2.576) to 99.5% (prevalence = + 2.576).Footnote 2 Figure 2 shows the distribution of prevalence scores for the total list of words.
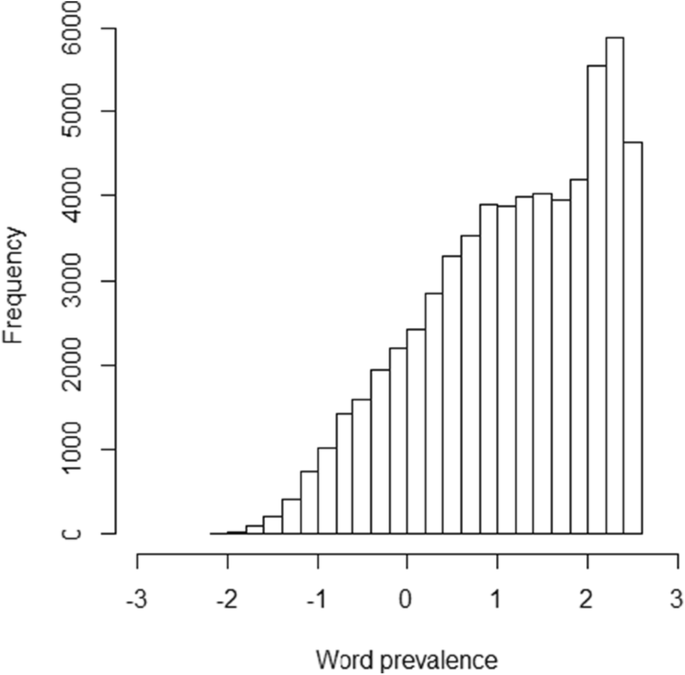
Distribution of word prevalence scores.
Word prevalence has negative values for words known by less than 50% of participants. This may be confusing at first sight, but it is rather informative. All words with negative prevalence scores are uninteresting for experiments with RTs (because these words are not known well enough), but they are interesting for word-learning experiments and experiments capitalizing on differences in accuracy.
Although the US word prevalence and the UK prevalence scores correlated r = .93 with each other, a few words did differ in prevalence between the two countries, due to cultural differences. Table 1 gives a list of the extreme cases. If researchers want to collect or analyze data from one country only, it will be useful to exclude the deviating words or to use country-specific word prevalence data.
Similarly, although the word prevalence scores correlate r = .97 between men and women, some words also deviate here, as can be seen in Table 2. These deviations tend to follow gender differences in interests (games, weapons, and technical matters for males; food, clothing, and flowers for females). The high correlations between the US and the UK measures and between males and females indicate that the reliability of the prevalence measure is very high (with .93 as the lower limit).
Uses of the word prevalence measure
Word prevalence as a predictor variable
By its nature, word prevalence will be a good predictor of word difficulty. Experimenters interested in word processing times naturally want to avoid stimuli that are unknown to many of the participants. This can now be achieved easily, by only using words with a percentage known of 95% or more (a prevalence of 1.60 or more). Similarly, word prevalence can be used as an estimate of word difficulty for vocabulary tests. By ordering the words according to word prevalence (and word frequency), it is possible to delineate word difficulty bands, which can be used when selecting stimuli.
Word prevalence is also likely to be of interest to natural language processing researchers writing algorithms to gauge the difficulty of texts. At present, word frequency is used as a proxy of word difficulty (e.g., Benjamin, 2012; De Clercq & Hoste, 2016; Hancke, Vajjala, & Meurers, 2012). Word prevalence is likely to be a better measure, given that it does not completely reduce to differences in word frequency.
Finally, word prevalence can be used to predict differences in word processing efficiency. In recent years, researchers have started to collect reaction times (RTs) to thousands of words and have tried to predict RTs on the basis of word characteristics. Table 3 gives an overview of the word characteristics included in analyses, as well as references to some of the articles involved.
Although many variables have been examined, most of them account for less than 1% of the variance in word processing time, once the effects of word frequency, word length (letters), similarity to other words (OLD20), and AoA are partialed out. Brysbaert et al. (2011), for example, analyzed the lexical decision times provided by the English Lexicon Project (ELP; Balota et al., 2007), using the 20+ word characteristics included in ELP as predictors. The three most important variables (word frequency, similarity to other words, and word length) together accounted for 40.5% of the variance. The remaining variables together accounted for only 2% additional variance. Indeed, our work over the last few years has shown that the objective of explaining as much variance as possible in word processing times is served better by looking for improved word frequency measures than by searching for new variables or interactions between variables. At the same time, we do not yet appear to have found all possible sources of variation (see also Adelman, Marquis, Sabatos-DeVito, & Estes, 2013). The systematic variance to be accounted for in megastudies is typically greater than 80% (as estimated on the basis of the reliability of the scores).
To examine whether word prevalence is a variable that substantially increases the percentage of variance explained in word processing times, we repeated the Brysbaert et al.’s (2011) analysis on the ELP lexical decision times and, additionally, included AoA and word prevalence as predictors. The variables we included were:
-
Word frequency based on the SUBTLEX-US corpus (Brysbaert & New, 2009), expressed as Zipf scores (Brysbaert, Mandera, & Keuleers, 2018; van Heuven, Mandera, Keuleers, & Brysbaert, 2014). The Zipf score is a standardized log-transformed measure of word frequency that is easy to understand (words with Zipf scores of 1–3 can be considered low-frequency words; words with Zipf scores of 4–7 can be considered high-frequency).
-
Word length in number of letters.
-
Number of orthographic neighbors (words formed by changing one letter; information obtained from ELP).
-
Number of phonological neighbors (words formed by changing one phoneme; from ELP).
-
Orthographic Levenshtein distance (from ELP).
-
Phonological Levenshtein distance (from ELP).
-
Number of phonemes (from ELP).
-
Number of syllables (from ELP).
-
Number of morphemes (from ELP).
-
AoA (from Kuperman et al., 2012; lemma values are applied to inflected forms).
-
Word prevalence.
We took the prevalence of an inflected form to be the same as that of its lemma if the inflected form was not in the database. Because we were interested in RTs, only words with 75% accuracy or more in the ELP lexical decision task were included. In our analyses, we used the z scores of participants’ RTs, rather than the absolute RTs, which eliminates variance in RTs due to participants being faster or slower than average. The percentage of variance in RTs that can be accounted for is substantially higher for z scores than for raw RTs (as will be shown below, where the percentages of variance accounted for are substantially higher than the 43% reported by Brysbaert et al., 2011). In total, we had complete data for 25,661 words. We analyzed both the ELP lexical decision times and the ELP naming latencies. Table 4 shows the correlations between the variables.
Table 4 illustrates the high correlations observed between the different word characteristics. In this respect word prevalence comes out well, because it is rather unrelated to the variables associated with word length. In addition, the correlation with frequency is rather limited (r = .487). This is higher than the value observed in the Dutch analyses by Brysbaert et al. (2016b), probably because the words from ELP were selected on the basis of a word frequency list. This means that known words with a frequency of 0 in the corpus were excluded.
One way to find the relevant predictors for the word processing times is to run a hierarchical regression analysis. Since we were particularly interested in the added value of word prevalence, we first entered all the other variables, and then word prevalence. To take into account nonlinearities, the regression analysis included polynomials of the second degree for word frequency, word length, AoA, and prevalence. Because the number of phonological neighbors and the number of phonemes were highly correlated with other variables and did not alter the picture, they were left out of the analysis.
When we entered all variables except for prevalence, we explained 66.2% of the variance in the z values of lexical decision times (Table 5). When prevalence was added, we explained 69.8% of the variance. Figure 3 shows the effects of the various variables.

Effects of different variables on standardized ELP lexical decision times. The first row shows the effects of word frequency and length in letters; the second shows number of syllables and number of morphemes; the third shows orthographic and phonological similarity to other words; and the last row shows age of acquisition and word prevalence.
The results agree with what we found for Dutch. High-frequency words are processed faster than low-frequency words. Interestingly, when prevalence is added, the relation becomes linear, whereas before there had been a floor effect for high-frequency words. Words with six to eight letters are responded to fastest. In addition, response times increase when the words contain more syllables, but they tend to decrease for morphologically complex words when all the other variables are taken into account. Words that are similar in sound and spelling to many other words (i.e., words with low OLD and PLD values) are responded to faster. Words were responded to more slowly when they were acquired late. Finally, there is a robust effect of word prevalence. Interestingly, the effect is strongest at the high end when all other variables have been accounted for. The effect is rather flat for words with a prevalence rate below 1.2 (which equates to a percentage known of 89%).
Table 5 and Fig. 4 show that the effects were very similar for word naming, but that the contribution of word prevalence was smaller than with lexical decision times (though still highly significant).

Effects of different variables on standardized ELP word-naming times. The first row shows the effects of word frequency and length in letters; the second shows number of syllables and number of morphemes; the third shows orthographic and phonological similarity to other words; and the last row shows age of acquisition and word prevalence.
Relation to other word characteristics
Kuperman, Stadthagen-Gonzalez, and Brysbaert (2012) used a dataset from Clark and Paivio (2004) to gauge the relationship of AoA to 30+ other word features. We used the same dataset and added word prevalence to it, together with the values from ELP; the concreteness ratings of Brysbaert, Warriner, and Kuperman (2014); and the estimates of word valence, dominance, and arousal collected by Hollis, Westbury, and Lefsrud (2017). Kuperman et al. (2012) found that an eight-factor solution best fit the data. We used the same structure, but in addition allowed the factors to intercorrelate [using the fa() function from the R package psych; Revelle, 2018]. This resulted in a solution that was more straightforward to interpret. There were 907 words for which we had all measures. Table 6 shows the outcome.
Word prevalence loads on the same factor as word accuracy in ELP and various ratings of familiarity. A second factor, Word Frequency, is correlated r = .66 with the first factor. The other factors refer to Concreteness, the Similarity to Other Words, Word Length, affect (Valence and Arousal), and the Gender-Ladenness of words. The Word Frequency factor correlates with the factors Similarity to Other Words (r = .41), Length (r = – .34), and Valence (r = .30). Similarity to Other Words also correlates with Length (r = – .45). Valence also correlates with Gender-Ladenness (r = .40). All other correlations are below r = .3 (absolute values).
All in all, when we analyzed the word attributes collected by Clark and Paivio (2004) and added other attributes collected since, the features reduced to eight main word characteristics. Word prevalence loaded on a factor together with other measures of word familiarity. The factor was correlated with Word Frequency, as has been observed in various corpora. The word processing measures from ELP also loaded on the prevalence/familiarity factor, in line with the impact of prevalence on word processing times that we saw above. On the other hand, the fact that the accuracy data from the ELP lexical decision experiment had the highest load raises the question of the extent to which this factor measures word knowledge or the decision element in the yes/no vocabulary task. If word prevalence is related to the decision component, one would expect it to correlate only with lexical decision times and not with word processing times in other tasks (e.g., eye movements in reading). To some extent, this worry is contradicted by the ELP naming data (Fig. 4), but more research will clearly be needed in order to establish the extent to which word prevalence is a true word feature (independent variable) or a word processing characteristic (dependent variable). Notice that a similar question has been raised about word frequency: whether it should be considered an independent or a dependent variable (Baayen, Milin, & Ramscar, 2016). Other evidence that word prevalence is related to word knowledge (i.e., is an independent variable) can be found in the country and gender differences (Tables 1 and 2) and in the age differences observed (Brysbaert et al., 2016a; Keuleers et al., 2015). These seem to be more related to differences in word knowledge than in decision processes.
Word prevalence as a matching variable
In many studies, a new word attribute is the variable of interest. In such studies, the stimuli in the various conditions must be matched on word frequency, word length, orthographic similarity to other words, and AoA. Even with this set of criteria, there is evidence that researchers still can select stimuli in such a way that they increase the chances of observing the hypothesized effect (i.e., they show experimenter bias; Forster, 2000; Kuperman, 2015). We think word prevalence will be an important variable to use in correcting for this bias. Table 7 shows words with different percentages known that are matched on frequency (Zipf = 1.59, meaning the words were observed only once in the SUBTLEX-US corpus of 51 million words). The various words clearly illustrate the danger of experimenter bias when word prevalence is not taken into account.
As can be seen in Figs. 3 and 4, matching words on prevalence is not only needed for words with very divergent prevalence scores, but also for words with high prevalence scores, something that cannot be achieved without the present dataset.
Word prevalence as a dependent variable
A final set of studies for which word prevalence will be interesting relates to the question of what causes differences in prevalence rates. As we have seen above, familiarity and word frequency are important variables, but they are not the only important ones. Which other variables are involved?
The best way to answer this question is to examine the divergences between word prevalence and word frequency. Which words are more widely known than expected on the basis of their frequency, and which words are less well known than expected on the basis of their frequency? As to the former question, it is striking that many well-known words with low frequencies are morphologically complex words. The best known very low-frequency words, with a frequency of Zipf = 1.59, are binocular, distinctively, reusable, gingerly, preconditioned, legalization, distinctiveness, inaccurately, localize, resize, pitfall, unsweetened, unsaturated, undersize, compulsiveness, all words derived from simpler stems. Another set of words with frequencies lower than predicted are words mainly used at a young age, such as grandma (AoA = 2.6 years; prevalence = 2.4, frequency = 4.7), potty (AoA = 2.7 years; prevalence = 1.9, frequency = 3.2), yummy (AoA = 2.9 years; prevalence = 2.1, frequency = 3.7), nap (AoA = 3.0 years; prevalence = 2.3, frequency = 4.1), or unicorn (AoA = 4.8 years; prevalence = 2.6, frequency = 3.4). Words that denote utensils are also often known more widely than would be expected on the basis of their frequency, such a hinge (AoA = 8.6 years; prevalence = 2.2, frequency = 2.2), sanitizer (AoA = 10.9 years; prevalence = 2.1, frequency = 1.6), or wiper (AoA = 8.4 years; prevalence = 2.3, frequency = 2.8).
Finally, the prevalence measure itself is likely to be of interest. One may want to investigate, for instance, to what extent prevalence scores depend on the way in which they are defined. Goulden, Nation, and Read (1990) presented students with 250 lemmas taken at random from a dictionary and tested them in the same way as we did (i.e., students had to indicate which they knew). Students selected on average 80 words. Milton and Treffers-Daller (2013) used the same words but asked participants to give a synonym or explanation for each word they knew. Now students were correct on 45 words only. Two questions are important: (1) How strong is the correlation between both estimates of word knowledge, and (2) Which measure best captures “word knowledge”?
As to the first question, Paul, Stallman, and O’Rourke (1990) reported high correlations between the yes/no test and tests involving interviews and multiple-choice questions. Surprisingly, no other studies on this topic could be found with native speakers (there are more studies with second language speakers, which largely—but not always—confirmed the finding that the yes/no test correlates well with other test formats). In addition, all studies looked only at correlations across participants and not at correlations across items (given that the interest was in assessing the language proficiency of participants, not knowledge of individual words). To obtain more information, we presented three existing English multiple-choice vocabulary tests to 248 first-year psychology students at a British University.Footnote 3 The three tests were the Mill Hill Form 2 (Raven, 1958; 34 words), the Shipley test (Shipley, 1940; 40 words), and a TOEFL test (Landauer & Dumais, 1997; 80 words). When we correlated the scores on the items with the word prevalence measure, we obtained a correlation of r = .69 (N = 154), which is shown in Fig. 5.

Correlations between word prevalence and probability correct on a multiple-choice vocabulary test.
Because the correlation is lower than hoped for, we had a look at the outliers. The upper left outlier (correct on MC test = .04, prevalence = 1.98) is the word sultry, an item from the Mill Hill test. According to our test, 98% of people claimed to know the word, whereas the Mill Hill test suggests that no one really knows the meaning. If we look in a dictionary, sultry has two meanings: (1) hot and humid, and (2) displaying or arousing sexual desire. If we look at semantic vectors (Mandera, Keuleers, & Brysbaert, 2017), the closest synonyms are breathy, steamy, songstress, hot, sexy, alluring, and languid. The first associates given by humans are sexy, hot, humid, steamy, woman, warm, and seductive (De Deyne, Navarro, Perfors, & Storms, 2016). However, none of these words are among the options available in the Mill Hill: Participants have to choose between instinctive, sulky, trivial, solid, severe, and muggy. No surprise, then, that no one knows the intended meaning. Another word in the upper left corner comes from the Shipley test: pristine (correct on MC test = .24, prevalence = 2.3). The alternatives given in the Shipley test are vain, sound, first, and level, rather than one of the expected associates clean, pure, or perfect. On the right side of Fig. 5, we find the word easygoing from the TOEFL test (correct on MC test = .97, prevalence = 1.7). In all likelihood, the low prevalence score for this word reflects the fact that many people do not consider easygoing a correct English spelling (they arguably prefer the two-word expression easy going). A similar reasoning explains why the word impostor is doing worse on word prevalence (1.5) than on the Shipley test (0.9). Currently, the preferred spelling of the word is imposter (which has a prevalence score of 2.2).
The deviations between the multiple-choice scores and word prevalence bring us to the second question: Which measure best captures “word knowledge”? As we have seen, answers to multiple-choice questions (the most frequent way of testing vocabulary) depend not only on knowledge of the target word but also on the alternatives presented. If they test a rare (or outdated) meaning of a word, they can easily lead to low scores for that word (remember that test makers are not interested in the scores on individual items; they are interested in the average scores of individuals). On the other hand, word prevalence scores are affected by the spelling of the word and only give information about the most familiar meaning. Which is the “best” way of testing word knowledge? Although one might be tempted to think that deeper knowledge is better, it may be that hazy knowledge is what we use most of the time when we are reading text or hearing discourse. Indeed, it might be argued that no person, except for specialized lexicographers, knows the full meaning of each word used (Anderson & Freebody, 1981). Still, it would be good to have more information on the relationship between results based on the yes/no format used here and other test formats. In particular, correlations over items will be important.
Availability
We made an Excel file with the Pknown and Prevalence values for the 61,858 words tested. Most of the words are lemmas (i.e., without inflections). An exception was made for common irregular forms (e.g., lice, went, wept, were) and nouns that have a different meaning in plural than in singular (glasses, aliens). The file also includes the SUBTLEX-US word frequencies, expressed as Zipf scores. Figure 6 gives a screenshot of the file.

Screenshot of the data file for word prevalences, available as supplementary materials or at https.//osf.io/g4xrt/.
The file further contains sheets with the differences between UK and US respondents and between male and female respondents, so that readers can make use of this information if they wish to.
Finally, we make the databases available that were used for the various analyses reported in the present article, so that readers can check them and, if desired, improve on them. These files are available as supplementary materials and can also be found at https://osf.io/g4xrt/.
Notes
Other countries with English as a native language have not (yet) produced enough observations to allow for making reliable word prevalence estimates for them.
The specific formula we used in Microsoft Excel was =NORM.INV(0.005+Pknown*0.99;0;1).
We are grateful to Joe Levy for his help with designing and running the experiments.
References
Adelman, J. S., & Brown, G. D. A. (2007). Phonographic neighbors, not orthographic neighbors, determine word naming latencies. Psychonomic Bulletin & Review, 14, 455–459. doi:https://doi.org/10.3758/BF03194088
Adelman, J. S., Brown, G. D. A., & Quesada, J. F. (2006). Contextual diversity, not word frequency, determines word-naming and lexical decision times. Psychological Science, 17, 814–823. doi:https://doi.org/10.1111/j.1467-9280.2006.01787.x
Adelman, J. S., Marquis, S. J., Sabatos-DeVito, M. G., & Estes, Z. (2013). The unexplained nature of reading. Journal of Experimental Psychology: Learning, Memory, and Cognition, 39, 1037–1053. doi:https://doi.org/10.1037/a0031829
Anderson, R. C., & Freebody, P. (1981). Vocabulary knowledge. In J. Guthrie (Ed.), Reading comprehension and education (pp. 77–117). Newark, DE: International Reading Association.
Baayen, R. H., Milin, P., & Ramscar, M. (2016). Frequency in lexical processing. Aphasiology, 30, 1174–1220.
Balota, D. A., Yap, M. J., Cortese, M. J., Hutchison, K. A., Kessler, B., Loftis, B., . . . Treiman, R. (2007). The English Lexicon Project. Behavior Research Methods, 39, 445–459. doi:https://doi.org/10.3758/BF03193014
Benjamin, R. G. (2012). Reconstructing readability: Recent developments and recommendations in the analysis of text difficulty. Educational Psychology Review, 24, 63–88.
Brysbaert, M., Buchmeier, M., Conrad, M., Jacobs, A. M., Bölte, J., & Böhl, A. (2011). The word frequency effect: A review of recent developments and implications for the choice of frequency estimates in German. Experimental Psychology, 58, 412–424. doi:https://doi.org/10.1027/1618-3169/a000123
Brysbaert, M., Mandera, P., & Keuleers, E. (2018). The word frequency effect in word processing: An updated review. Current Directions in Psychological Science, 27, 45–50. doi:https://doi.org/10.1177/0963721417727521
Brysbaert, M., & New, B. (2009). Moving beyond Kučera and Francis: A critical evaluation of current word frequency norms and the introduction of a new and improved word frequency measure for American English. Behavior Research Methods, 41, 977–990. doi:https://doi.org/10.3758/BRM.41.4.977
Brysbaert, M., New, B., & Keuleers, E. (2012). Adding part-of-speech information to the SUBTLEX-US word frequencies. Behavior Research Methods, 44, 991–997. doi:https://doi.org/10.3758/s13428-012-0190-4
Brysbaert, M., Stevens, M., Mandera, P., & Keuleers, E. (2016a) How many words do we know? Practical estimates of vocabulary size dependent on word definition, the degree of language input and the participant’s age. Frontiers in Psychology 7, 1116. doi:https://doi.org/10.3389/fpsyg.2016.01116
Brysbaert, M., Stevens, M., Mandera, P., & Keuleers, E. (2016b). The impact of word prevalence on lexical decision times: Evidence from the Dutch Lexicon Project 2. Journal of Experimental Psychology: Human Perception and Performance, 42, 441–458. doi:https://doi.org/10.1037/xhp0000159
Brysbaert, M., Warriner, A. B., & Kuperman, V. (2014). Concreteness ratings for 40 thousand generally known English word lemmas. Behavior Research Methods, 46, 904–911. doi:https://doi.org/10.3758/s13428-013-0403-5
Clark, J. M., & Paivio, A. (2004). Extensions of the Paivio, Yuille, and Madigan (1968) norms. Behavior Research Methods, Instruments, & Computers, 36, 371–383. doi:https://doi.org/10.3758/BF03195584
Connell, L., & Lynott, D. (2012). Strength of perceptual experience predicts word processing performance better than concreteness or imageability. Cognition, 125, 452–465. doi:https://doi.org/10.1016/j.cognition.2012.07.010
Cortese, M. J., Hacker, S., Schock, J., & Santo, J. B. (2015). Is reading-aloud performance in megastudies systematically influenced by the list context? Quarterly Journal of Experimental Psychology, 68, 1711–1722.
Cortese, M. J., Yates, M., Schock, J., & Vilks, L. (2018). Examining word processing via a megastudy of conditional reading aloud. Quarterly Journal of Experimental Psychology. Advance online publication. doi:https://doi.org/10.1177/1747021817741269
De Clercq, O., & Hoste, V. (2016). All mixed up? finding the optimal feature set for general readability prediction and its application to English and Dutch. Computational Linguistics, 42, 457–490.
De Deyne, S., Navarro, D. J., Perfors, A., & Storms, G. (2016). Structure at every scale: A semantic network account of the similarities between unrelated concepts. Journal of Experimental Psychology: General, 145, 1228.
Dufau, S., Grainger, J., Midgley, K. J., & Holcomb, P. J. (2015). A thousand words are worth a picture: Snapshots of printed-word processing in an event-related potential megastudy. Psychological Science, 26, 1887–1897.
Ernestus, M., & Cutler, A. (2015). BALDEY: A database of auditory lexical decisions. Quarterly Journal of Experimental Psychology, 68, 1469–1488. doi:https://doi.org/10.1080/17470218.2014.984730
Ferrand, L., Brysbaert, M., Keuleers, E., New, B., Bonin, P., Méot, A., . . . Pallier, C. (2011). Comparing word processing times in naming, lexical decision, and progressive demasking: Evidence from Chronolex. Frontiers in Psychology, 2, 306. doi:https://doi.org/10.3389/fpsyg.2011.00306
Ferrand, L., Méot, A., Spinelli, E., New, B., Pallier, C., Bonin, P., . . . Grainger, J. (2018). MEGALEX: A megastudy of visual and auditory word recognition. Behavior Research Methods, 50, 1285–1307. doi:https://doi.org/10.3758/s13428-017-0943-1
Forster, K. I. (2000). The potential for experimenter bias effects in word recognition experiments. Memory & Cognition, 28, 1109–1115. doi:https://doi.org/10.3758/BF03211812
Gernsbacher, M. A. (1984). Resolving 20 years of inconsistent interactions between lexical familiarity and orthography, concreteness, and polysemy. Journal of Experimental Psychology: General, 113, 256–281. doi:https://doi.org/10.1037/0096-3445.113.2.256
Goulden, R., Nation, P., & Read, J. (1990). How large can a receptive vocabulary be? Applied Linguistics, 11, 341–363.
Hancke, J., Vajjala, S., & Meurers, D. (2012). Readability classification for German using lexical, syntactic, and morphological features. In Proceedings of COLING 2012 (pp. 1063–1080).
Hollis, G., Westbury, C., & Lefsrud, L. (2017). Extrapolating human judgments from skip-gram vector representations of word meaning. Quarterly Journal of Experimental Psychology, 70, 1603–1619. doi:https://doi.org/10.1080/17470218.2016.1195417
Juhasz, B. J., & Yap, M. J. (2013). Sensory experience ratings for over 5,000 mono- and disyllabic words. Behavior Research Methods, 45, 160–168. doi:https://doi.org/10.3758/s13428-012-0242-9
Keuleers, E., & Brysbaert, M. (2010). Wuggy: A multilingual pseudoword generator. Behavior Research Methods, 42, 627–633. doi:https://doi.org/10.3758/BRM.42.3.627
Keuleers, E., Stevens, M., Mandera, P., & Brysbaert, M. (2015). Word knowledge in the crowd: Measuring vocabulary size and word prevalence in a massive online experiment. Quarterly Journal of Experimental Psychology, 68, 1665–1692. doi:https://doi.org/10.1080/17470218.2015.1022560
Kuperman, V. (2015). Virtual experiments in megastudies: A case study of language and emotion. Quarterly Journal of Experimental Psychology, 68, 1693–1710.
Kuperman, V., Estes, Z., Brysbaert, M., & Warriner, A. B. (2014). Emotion and language: valence and arousal affect word recognition. Journal of Experimental Psychology: General, 143, 1065–1081. doi:https://doi.org/10.1037/a0035669
Kuperman, V., Stadthagen-Gonzalez, H., & Brysbaert, M. (2012). Age-of-acquisition ratings for 30 thousand English words. Behavior Research Methods, 44, 978–990.
Landauer, T. K., & Dumais, S. T. (1997). A solution to Plato’s problem: The latent semantic analysis theory of acquisition, induction, and representation of knowledge. Psychological Review, 104, 211–240. doi:https://doi.org/10.1037/0033-295X.104.2.211
Liu, Y., Shu, H., & Li, P. (2007). Word naming and psycholinguistic norms: Chinese. Behavior Research Methods, 39, 192–198. doi:https://doi.org/10.3758/BF03193147
Mandera, P., Keuleers, E., & Brysbaert, M. (2017). Explaining human performance in psycholinguistic tasks with models of semantic similarity based on prediction and counting: A review and empirical validation. Journal of Memory and Language, 92, 57–78. doi:https://doi.org/10.1016/j.jml.2016.04.001
Milton, J., & Treffers-Daller, J. (2013). Vocabulary size revisited: the link between vocabulary size and academic achievement. Applied Linguistics Review, 4, 151–172.
Paul, P. V., Stallman, A. C., & O’Rourke, J. P. (1990). Using three test formats to assess good and poor readers’ word knowledge (Technical Report No. 509). Urbana, IL: Center for the Study of Reading, University of Illinois.
Raven, J. C. (1958). Guide to using the Mill Hill Vocabulary Scale with the Progressive Matrices Scales. Oxford, England: H. K. Lewis & Co.
Revelle, W. (2018). Package “psych.” Available on May 29, 2018, at https://cran.r-project.org/web/packages/psych/psych.pdf
Schröter, P., & Schroeder, S. (2017). The Developmental Lexicon Project: A behavioral database to investigate visual word recognition across the lifespan. Behavior Research Methods, 49, 2183–2203. doi:https://doi.org/10.3758/s13428-016-0851-9
Shipley, W. C. (1940). A self-administering scale for measuring intellectual impairment and deterioration. Journal of Psychology: Interdisciplinary and Applied, 9, 371–377. doi:https://doi.org/10.1080/00223980.1940.9917704
Sze, W. P., Yap, M. J., & Rickard Liow, S. J. (2015). The role of lexical variables in the visual recognition of Chinese characters: A megastudy analysis. Quarterly Journal of Experimental Psychology, 68, 1541–1570.
Tsang, Y.-K., Huang, J., Lui, M., Xue, M., Chan, Y.-W. F., Wang, S., & Chen, H.-C. (2018). MELD-SCH: A megastudy of lexical decision in simplified Chinese. Behavior Research Methods. Advance online publication. doi:https://doi.org/10.3758/s13428-017-0944-0
Tse, C.-S., & Yap, M. J. (2018). The role of lexical variables in the visual recognition of two-character Chinese compound words: A megastudy analysis. Quarterly Journal of Experimental Psychology. Advance online publication. doi:https://doi.org/10.1177/1747021817738965
Tse, C.-S., Yap, M. J., Chan, Y.-L., Sze, W. P., Shaoul, C., & Lin, D. (2017). The Chinese Lexicon Project: A megastudy of lexical decision performance for 25,000+ traditional Chinese two-character compound words. Behavior Research Methods, 49, 1503–1519. doi:https://doi.org/10.3758/s13428-016-0810-5
van Heuven, W. J. B., Mandera, P., Keuleers, E., & Brysbaert, M. (2014). SUBTLEX-UK: A new and improved word frequency database for British English. Quarterly Journal of Experimental Psychology, 67, 1176–1190. doi:https://doi.org/10.1080/17470218.2013.850521
Yap, M. J., & Balota, D. A. (2009). Visual word recognition of multisyllabic words. Journal of Memory and Language, 60, 502–529. doi:https://doi.org/10.1016/j.jml.2009.02.001
Yap, M. J., Tan, S. E., Pexman, P. M., & Hargreaves, I. S. (2011). Is more always better? Effects of semantic richness on lexical decision, speeded pronunciation, and semantic classification. Psychonomic Bulletin & Review, 18, 742–750. doi:https://doi.org/10.3758/s13423-011-0092-y
Author information
Authors and Affiliations
Corresponding author
Rights and permissions
About this article

Cite this article
Brysbaert, M., Mandera, P., McCormick, S.F. et al. Word prevalence norms for 62,000 English lemmas. Behav Res 51, 467–479 (2019). https://doi.org/10.3758/s13428-018-1077-9
Published:
Issue Date:
DOI: https://doi.org/10.3758/s13428-018-1077-9