
Abstract
Most research in statistical learning (SL) has focused on the mean success rates of participants in detecting statistical contingencies at a group level. In recent years, however, researchers have shown increased interest in individual abilities in SL, either to predict other cognitive capacities or as a tool for understanding the mechanism underlying SL. Most if not all of this research enterprise has employed SL tasks that were originally designed for group-level studies. We argue that from an individual difference perspective, such tasks are psychometrically weak, and sometimes even flawed. In particular, the existing SL tasks have three major shortcomings: (1) the number of trials in the test phase is often too small (or, there is extensive repetition of the same targets throughout the test); (2) a large proportion of the sample performs at chance level, so that most of the data points reflect noise; and (3) the test items following familiarization are all of the same type and an identical level of difficulty. These factors lead to high measurement error, inevitably resulting in low reliability, and thereby doubtful validity. Here we present a novel method specifically designed for the measurement of individual differences in visual SL. The novel task we offer displays substantially superior psychometric properties. We report data regarding the reliability of the task and discuss the importance of the implementation of such tasks in future research.
Statistical learning (SL), the ability to extract the distributional properties of sensory input across time and space, is taken to be the main mechanism by which cognitive systems discover the underlying regularities of their environments. Starting from the seminal work of Saffran and her colleagues (Saffran, Aslin, & Newport, 1996), a large number of studies have unequivocally demonstrated a remarkable ability of humans to detect subtle differences in the transitional probabilities embedded in a continuous input, whether it is auditory (Endress & Mehler, 2009) or visual (Kirkham, Slemmer, & Johnson, 2002), verbal (Pelucchi, Hay, & Saffran, 2009) or nonverbal (Gebhart, Newport, & Aslin, 2009), comprising adjacent or nonadjacent contingencies (Gómez, 2002; Newport & Aslin, 2004), without overt attention (Evans, Saffran, & Robe-Torres, 2009), and from a very early age (as young as 1- to 3-day-old newborns; Bulf, Johnson, & Valenza, 2011). The common aim of all of these important studies has been to show that the often complex distributional properties of a given input can indeed be extracted and learned, shaping behavior (see Erickson & Thiessen, 2015; Thiessen, Kronstein, & Hufnagle, 2013, for reviews). From an operational perspective, this end was achieved by demonstrating that the mean success rate of the sampled participants in detecting a variety of statistical contingencies is significantly above chance.
In recent years, however, there has been substantial theoretical interest in individual capacities of SL. In general, researchers have focused on individual rather than group-level performance to achieve one of two goals. The first is to use SL ability to predict a range of related cognitive capacities (most notably, linguistic functions), thereby demonstrating a theoretical link between SL and these functions. In this vein, performance in implicit artificial grammar learning (AGL) tasks was shown to predict sentence comprehension (Misyak & Christiansen, 2012), the processing of relative-clause sentences with long-distance dependencies (Misyak, Christiansen, & Tomblin, 2010), and speech perception abilities (Conway, Bauernschmidt, Huang, & Pisoni, 2010; Conway, Karpicke, & Pisoni, 2007). Similarly, visual SL has been demonstrated to predict reading abilities in one’s first language (L1; Arciuli & Simpson, 2012), as well as literacy acquisition in a second language (L2; Frost, Siegelman, Narkiss, & Afek, 2013), and auditory SL was found to predict lexical and oral language skills in the L1 (Mainela-Arnold & Evans, 2014; Singh, Steven Reznick, & Xuehua, 2012; Spencer, Kaschak, Jones, & Lonigan, 2014). A second approach to the study of individual differences stems from the assumption that understanding the source of such differences in SL holds the promise of revealing critical insight regarding the cognitive operations underlying its mechanisms, leading to deeper comprehension of what SL capacity could predict and why (see Frost, Armstrong, Siegelman, & Christiansen, 2015, for a theoretical discussion). For example, researchers have recently investigated individual performance in SL to examine the roles of explicit versus implicit knowledge (Batterink, Reber, Neville, & Paller, 2015; Bertels, Boursain, Destrebecqz, & Gaillard, 2014; Bertels, Franco, & Destrebecqz, 2012; Kim, Seitz, Feenstra, & Shams, 2009), the relation between different types of computations in SL (Romberg & Saffran, 2013), and the impact of input modality (Siegelman & Frost, 2015), as well as to pinpoint the neurocircuitry involved in the detection of regularities (Karuza et al., 2013; Turk-Browne, Scholl, Chun, & Johnson, 2009).
Although these studies have targeted individual differences as their main interest, they have all employed the original tasks that were designed for group-level explorations, with little to no modification (but see Bertels et al., 2014, and Bertels et al., 2012, for task modifications). Note that this same trend has been revealed across other types of implicit-learning paradigms, so that tasks designed to show learning at the group level are used to probe individual capacities (i.e., AGL, Conway et al., 2010; a serial reaction time task, Kaufman et al., 2010; or Hebbian repetition learning, Mosse & Jarrold, 2008). Here we raise a critical methodological concern: Although all of the tasks reported here have advanced us considerably in understanding the promise of SL as a theoretical construct, they are not suited to study and measure individual differences, because they are psychometrically weak, and from this perspective they are sometimes even flawed. The concern we raise is not simply methodological; rather, it is deeply theoretical. Psychometric considerations require any task to display a series of important criteria. These include (among others), a large enough variance of the output scores, split-half reliability, test–retest reliability, and internal validity. If these criteria are not met, the task cannot reliably predict other capacities, and this raises doubts regarding its predictive validity. In a nutshell, if a task does not reliably tap the theoretical construct it is supposed to tap (in our case, a postulated individual capacity in SL), its explanatory adequacy remains empty.
To explicate these concerns in detail, in the following sections we will focus on the popular visual statistical learning (VSL) task that has served many recent individual differences studies, including our own (Frost et al., 2013). This task is taken, however, simply as a token example to make a more general point, common to many other experimental tasks recently employed for the study of individual differences.
The visual statistical learning task (VSL): A test case
A popular test of SL performance in the visual modality has employed a sequential stream of meaningless shapes with adjacent contingencies to demonstrate the general ability of picking up regularities in the visual modality (e.g., Emberson, Conway, & Christiansen, 2011; Glicksohn & Cohen, 2013; Kirkham et al., 2002; Turk-Browne, Junge, & Scholl, 2005). Similar to most SL tasks, the VSL task includes a familiarization phase that is immediately followed by a test phase. In the common variant of the VSL task (e.g., Frost et al., 2013), familiarization includes 24 abstract shapes (but some have used 12 shapes only), such as those presented in Fig. 1. Unbeknownst to participants, the shapes are organized into eight triplets, all with transitional probabilities (TPs) of 1. These triplets are then repeatedly presented during familiarization, which usually spans about 10 min (with the constraint that the same triplet cannot be immediately repeated). Since the input appears as a continuous stream, the only source of information regarding its triplet composition lies in the statistical properties of the shapes in the sequence (TPs of the shapes within a triplet are 1, whereas the TPs of shapes between triplets are 1/7). Following familiarization, the test phase begins. It consists of a series of two-alternative forced choice (2AFC) trials, each contrasting one of the triplets presented during learning and one “foil”—a group of three shapes that never appeared together in the familiarization phase (TPs = 0). In each trial of the test, one foil and one triplet are presented, and participants are asked to decide which group of shapes appears more familiar, given the stream they have seen.

Example shapes for standard visual statistical learning (VSL) tasks
In recent years, this popular task was borrowed with little modification to serve as an individual measure of one’s visual SL ability, mainly to predict other cognitive functions such L1 literacy (Arciuli & Simpson, 2012), L2 literacy (Frost et al., 2013), implicit RT-based measures (Bertels et al., 2014; Bertels et al., 2012), auditory SL abilities (Siegelman & Frost, 2015), and so forth. Given these objectives, we will now consider this task from a psychometric perspective and outline its critical shortcomings for studying individual differences.
Psychometric shortcomings
-
a.
Number of trials in the test phase The first dimension to consider is the number of trials employed in the test phase to assess individual learning following familiarization. Given memory constraints, the number of triplets in the familiarization phase of SL tasks is relatively small, usually set to eight triplets (but sometimes even to four; e.g., Arciuli & Simpson, 2012). Hence, unless triplets are repeated, the test phase would involve four to eight binary decisions. However, psychometrical considerations in individual differences studies require a significantly larger number of trials, to increase the resolution of the measure and to allow for larger variance within the sample, thereby reducing measurement error. Figure 2 presents a simulation of two individuals, A and B, who differ in their sensitivities to TPs (see Frost et al., 2015, for discussion). The probability of individual A in detecting a triplet in the stream is set to .6, whereas that of individual B is set to .8. The figure demonstrates the extent of separability of the distributions of correct responses, that belonging to individual A and that belonging to individual B, when the test phase comprises 4, 8, 16, or 32 2AFC trials (k = 1,000 samples). It is evident that the number of 2AFC trials in the test phase is critical for discerning the two individuals. For example, if the obtained test score of individual B (who has a .8 chance to answer correctly on each question) is, say, 75 % correct responses, the probability of correctly identifying him/her by his/her score in a test comprising eight trials is p = .58 [i.e., P(B) / {P(B) + P(A)} = 314/542], whereas the probability of falsely identifying individual A is p = .42 (228/542). However, if the same two individuals are tested with 32 2AFC trials, the chances of correctly identifying individual B increase to .87, whereas the chances of falsely identifying individual A decrease to .13. Perhaps unaware of this problem, researchers in some recent studies have used as few as four test trials (e.g., Spencer et al., 2014) to predict individual abilities. Our simple simulation demonstrates that correlations obtained in such studies are most probably spurious, reflecting noise. Consequently, the theoretical conclusion that success in the task is related to a given cognitive ability is simply unwarranted.
Fig. 2 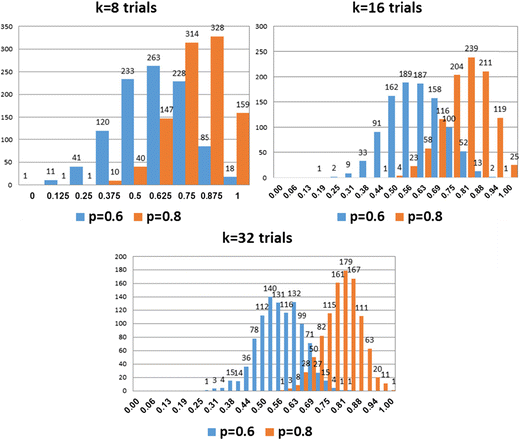
Distributions of scores for two individuals that differ in their probabilities to identify triplets in the test phase (p = .6 and p = .8), in tests with 8, 16, and 32 trials, over a simulation of 1,000 iterations. As the number of trials increases, the overlap between the distributions decreases, and the test better discriminates between the two individuals
A possible solution for this problem is to introduce into the test phase several repeated, 2AFC trials in which the same triplet is contrasted with different or repeated foils. Indeed, this is the solution that most individual differences studies in SL have used to date. Table 1 presents the number of patterns, number of repetitions, and number of trials employed in some recent studies. As can be seen, most studies have extensively repeated the same triplets in multiple trials during test, with as many as 16 repetitions of only four triplets, aiming for a test with 64 items (Arciuli & Simpson, 2012). This solution, however, does not come without a cost. With extensive repetitions, performance in the test intermixes the learning of the initial stream with memory of items reappearing again and again in the test phase, introducing other sources of noise in the measurement. With extensive repetitions it is not evident whether the score obtained in the test phase reflects learning of the original stream or episodic memory of the previous responses that were given to the same triplet during the test. This leads us, then, to our first conclusion: A good test of individual differences must have a large number of trials, but a minimal number of repetitions.
Table 1 Numbers of triplets, trials, and repetitions of each triplet at test in recent SL individual differences studies -
b.
Chance-level performance for most of the sample Another critical shortcoming of the VSL task (and even more so in other current SL tasks) is that a large proportion of the sample performs at chance level. This problem is underemphasized, since most studies of SL report the mean group performance, showing that it is significantly above chance, without reporting the individual scatterplots. However, from an individual differences perspective, if many participants in the sample perform at chance, even if the mean group performance is above chance, a large proportion of data points in the sample reflect simple noise in terms of their predictive validity. Figure 3 presents an individual performance histogram in the VSL task with a relatively large sample of participants (n = 76, 32 trials in the test) from a recent study (Siegelman & Frost, 2015). The mean performance of the sample is 67 %, significantly better than chance (50 %) at the group level [t(75) = 8.84, p < .001], replicating many studies that have used this task (e.g., Arciuli, von Koss Torkildsen, Stevens, & Simpson, 2014; Glicksohn & Cohen, 2013; Turk-Browne et al., 2005; Turk-Browne et al., 2009). Note that this statistical test is based on a comparison of the mean values of the whole sample to the hypothetical group-level chance of 50 % (in the case of a 2AFC test). However, considering central tendency measures at the group level might be very misleading when it comes to individual performance. Indeed, examining the level of performance of each individual in the sample reveals that most individuals did not exhibit learning that is significantly above chance. In order to examine whether the score of a particular individual is significantly above chance, we can look at the binomial distribution and calculate on how many trials an individual would need to answer correctly in order to reject the null hypothesis of performance based on random guessing. Since the test is based on 32 2AFC trials, according to the binomial distribution, significant above-chance performance for an individual is set to 22 correct responses or more (p < .05). The red line in Fig. 3 presents this threshold, separating individuals below this line and those above. As can be seen, 43 out of the 76 participants (57 %) performed below this threshold, thus not showing significant evidence of learning. Table 2 presents data taken from the few studies that have reported individual performance in addition to mean group performance in a variety of SL tasks. The table reveals that in all of these studies, most of the sample did not perform significantly above chance at the individual level.
Fig. 3 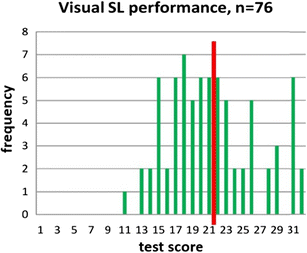
Performance histogram of n = 76 participants in a VSL task, from Siegelman and Frost (2015). The red line depicts the individual chance-level threshold—that is, the number of correct trials needed for a given individual to show learning
Table 2 Numbers of participants significantly above chance at the individual level in published studies that have reported individual performance. As can be seen, most participants do not display evidence of learning This analysis outlines a major concern. If most of the sample does not show significant evidence of learning, the variance in performance of this part of the sample may be driven by random guess, leading to spurious correlations with the cognitive measures that SL is supposed to predict. In other words, the existing tasks provide reliable information for the higher (and smaller) part of the distribution of individuals’ performance, whereas the lower (and larger) part of the distribution most likely reflects noise. This leads us to our second conclusion: SL tasks must be designed so they provide information for larger portions of the sample to enable reliable measurements of performance.
-
c.
All test items are of the same type and same level of difficulty The test phases in most existing SL tasks include a few dozen 2AFC trials (but see, for example, Bertels et al., 2014, and Bertels et al., 2012, for tests with 4AFC trials only), each contrasting a “real” triplet from the learning phase (TPs of shapes typically set to 1.0) and a foil (TPs of shapes typically set to 0.0). Thus, the test phase comprises multiple items measuring the same type of knowledge, with the same level of difficulty. This leads to two psychometric problems, one that is theoretical, and one that is statistical.


From a theoretical perspective, repeating items of the same type constrains the test to tap only a small part of the measured ability. To best exemplify this problem, we draw on facet theory (a systematic approach to theory construction and data collection for complex, multifaceted constructs; see, e.g., Shye, Elizur, & Hoffman, 1994) and phrase the following mapping sentence to describe the range of measurement of the current VSL task: The VSL task measures the ability to recognize sequences of triplets, of TP = 1, from foils of TP = 0 , without violation of positions. This mapping sentence highlights the limited range of computations that are assessed by the existing VSL task. Visual SL as a theoretical construct naturally involves a wide scope of potential computations (e.g., production as well as recognition, contingencies of sequences of different lengths rather than triplets only, sensitivity to a range of quasiregularities rather than sensitivity to full regularity, graded sensitivity to violations of positions in the foils, etc.). Consequently, the test should be able to tap a large portion of the ability range, and this can be done only by including items that will expand the mapping sentence. For example, a comprehensive VSL task should have in its test phase items that involve the production of learned patterns (rather than recognition only), with both pairs and triplets as targets (instead of just triplets), with a range of TPs of the triplets and foils (instead of a set value across all items), with and without violation of positions in the foils, and so forth. This leads us to our third criterion: SL tests must be designed so they provide better coverage of the measured ability.
The statistical concern of using a test that comprises items with the same properties and level of difficulty stems from item response theory (IRT; e.g., Embretson & Reise, 2000). In IRT, each test item is characterized by its item response function. Figure 4 presents an example of such a theoretical curve. The figure depicts the expected probability to answer correctly for a given item i, as a function of the theoretical construct that is measured by the test. The most common model in IRT is the three-parametric logistic model, first developed by Birnbaum (1968), in which the item response function is derived from three parameters: (1) the discrimination index of the item (the maximal slope of the function), (2) the item difficulty (the point on the x-axis with the maximal function slope), and (3) chance-level performance (the intercept; i.e., the probability of answering correctly with minimal ability in the construct). According to IRT, a given item provides information about performance only in areas of the distribution where the slope is larger than zero. For example, the item in Fig. 4 does not provide any information for individual performance in areas less than or more than 1.5 standard deviations from the population mean performance, and it cannot discriminate between participants in these ranges of ability.

Item response function for a hypothetical item. The x-axis represents the ability in the measured construct, and the y-axis depicts the expected probability to answer correctly on this specific item. The center square highlights the region where the item is informative and discriminative, whereas the adjacent rectangles marks the regions of the distribution in which the item is not informative
Since all items in current SL tasks share the same properties and the same level of difficulty, they all provide information regarding the same area of the distribution. This leaves the upper and lower parts of the distribution to reflect mostly noise: Low-level statistical learners cannot answer any of the items correctly (aside from chance success), and therefore are indistinguishable from one another. Similarly, high-level statistical learners can answer all items correctly, and are again indistinguishable from one another. This noise inevitably increases measurement error and reduces the task’s reliability. Note that current SL tasks stand in contrast to most standard cognitive tests, such as IQ or working memory, in which the test items are specifically set to represent a wide range of difficulty, thereby maximizing discrimination between individuals and increasing the test’s reliability. This leads us to our fourth criterion: A good task should provide information across most parts of the distribution. This can be achieved only by varying the levels of difficulty of the items in the test.
In a recent investigation, Siegelman and Frost (2015) examined the test–retest reliability of the VSL task (as well as of other tasks routinely employed in SL literature), reporting relatively mediocre scores (r = .58 for VSL, r = .6 for auditory SL, whereas reliability coefficients in psychological measurement are typically about r = .8: Nunnally & Bernstein, 1994). Although this provides preliminary evidence that SL is a stable and reliable capacity of an individual, the tasks clearly leave a lot to be desired in terms of their psychometric properties. Further analysis of the VSL task reveals a split-half reliability of .64 (.76, Spearman–Brown corrected), and a Cronbach’s alpha coefficient of .75, which is yet again below standards (e.g., Raven’s Advanced Progressive Matrices have a test–retest reliability of .91 and an alpha of .86; Raven, Court, & Raven, 1992). The other SL tasks examined in this study did not fare better. Given our theoretical discussion so far, this should not come as a surprise.
This brings us to the initial discussion of SL as a theoretical construct. SL is taken to underlie a wide range of sensory, motor, and cognitive abilities, and it plays key roles in segmentation, discrimination, prediction, and categorization. Unsurprisingly, since these are fundamental functions, SL is currently attracting much attention, similar to the g factor decades ago. Mapping SL as an individual capacity is becoming, then, a major theoretical challenge for cognitive and educational science. However, success in this research enterprise requires an infrastructure of psychometrically valid and reliable SL tasks. This is the goal of the present research.
Toward better measurement of individual differences in SL: Blueprints for new SL tasks
In this study, we aimed to develop a new, better, and more reliable SL task. We did so by dealing directly with the psychometric shortcomings described above. To preview our findings, we show that we can reduce noise and maximize task sensitivity by increasing the number of items in the test while minimizing the number of repeated items across trials. Second, we show that by including items of different difficulties and of different types, we can improve discrimination between participants and cover a wider range of SL abilities. Third, by “pushing” more of the population above chance-level performance, we demonstrate how information regarding a larger part of the distribution can be obtained.
The new VSL
The new visual SL task includes 16 complex visual shapes (taken from Fiser & Aslin, 2001; see Appendix A). As in current SL tasks, the task includes two parts: a familiarization phase followed by a test phase.
Prior to familiarization, the 16 shapes (hereinafter labeled with the numbers 1 to 16) are randomly organized for each participant into eight triplets. In contrast to current SL tasks, the eight triplets are not all similar in terms of their TPs, but rather are of two subtypes: (1) four triplets with TPs = .33 (made from four shapes: 1–2–3, 2–1–4, 4–3–1, and 3–4–2) and (2) four triplets with TPs of 1 between the shapes (made from the remaining 12 shapes: 5–6–7, 8–9–10, 11–12–13, and 14–15–16). During familiarization, the eight triplets appear immediately one after the other in a random order to create a 10-min familiarization stream in which each triplet appears 24 times (randomized separately in each run, with a constraint that the same triplet cannot be repeated twice in a row). Each shape appears on the screen for 800 ms, with a 200-ms break between shapes.Footnote 1 Before familiarization, participants are instructed to watch the stream of shapes, as they will later be tested. No cover task is performed during familiarization.
Following familiarization, a 42-item test phase begins. The targets and foils, and the characteristics of each item, are presented in the left portion of Table 3. As can be seen, in contrast to standard SL tasks, the 42 test items differ from one another in various properties. First, the items differ in their required responses: Participants are asked either to pick the familiar pattern (“pattern recognition” trials) or to complete a missing shape in a pattern (“pattern completion” trials). Second, the items differ in whether they include pairs or triplets. Third, they differ in the TPs of the target (low TPs of .33 or high TPs of 1). Fourth, the items differ in the mean TPs of the foils (ranging from 0 to .5). Fifth, the numbers of distractors are different across items (either two, three, or four forced-choice questions). Finally, the items differ in the amounts of position violations in the foils. This creates a wide range of levels of difficulty across the 42 test items.
The test begins with a block of 34 “pattern recognition” items and ends in a block of eight “pattern completion” items. In each block, the order of the items is randomized for each participant (in each run). In each test trial, all of the options appear together on the screen (with the internal positions of the target and foils randomized for each item), and participants are asked to choose the correct answer using the keyboard (see the examples in Fig. 5). The total score on the task ranges from 0 to 42, based on the number of correct responses in the test.

Example of three trials from the test (left to right): (1) a four-forced-choice pattern recognition trial with triplets; (2) a two-forced-choice pattern recognition trial with pairs; and (3) a pattern completion trial for a triplet. The instructions were originally presented in Hebrew
Note that the foils are manipulated in two dimensions. First, and most importantly, they differ in the TPs between shapes (i.e., the mean expected TPs between the shapes within the foil). In addition, we manipulated the degree of position violations in the foils—that is, whether the shapes appear in the foils in the same internal position as in the original triplets. Position violations ranged from 0 to 1 for each foil: A value of 0 means that the shapes kept the internal order within the foils, as in the original triplets (e.g., from the triplets 1–2–3, 4–5–6, and 7–8–9, the foil 1–5–9 contains no position violations, since all shapes in the foil appear in the same internal position as in the triplets). The maximal position violation of 1 means that all shapes appeared in different internal positions. Values between 0 and 1 stand for different degrees of violations (e.g., from the triplets 1–2–3, 4–5–6, and 7–8–9, the foil 1–6–9 contains .33 position violations, because one shape—shape 6—appears in a different position than in the triplets).
Also note that despite the relatively large number of trials in the test (42), the number of repeated targets and foils does not exceed that in current SL tasks. In the pattern recognition trials, each triplet-target and triplet-foil appears three times only (except for one foil that appears four times, due to the overall number of foils required), and each pair-target and pair-foil appears only once (the frequencies of the foils and targets are matched in order to ensure that transitional statistics provide the only cues for choosing targets over foils; see, e.g., Aslin, Saffran, & Newport, 1998). In addition, four triplets and four pairs also appear as targets in the pattern completion trials. Overall, this follows the blueprint for the development of the test described in the introduction, of maximizing the number of items at test, while minimizing the number of repeated targets and foils.
The study
Participants
Sixty-two adults (49 females, 13 males), all students at the Hebrew University, participated for course credit or payment. Their ages ranged from 20 to 31 (mean 23.7). The participants were all Hebrew native speakers, with no reported history of ADD, ADHD, or reading disabilities.
General procedure
All 62 participants took part in a first session in which they were tested with the new VSL task described above. Three months after the first session, the participants were contacted and asked to undergo another testing session—a retest of the same task. Forty-three of the participants agreed to come back for the second session. This sample of participants had characteristics similar to the initial sample, both in their demographics (age: 20–27, mean = 23.1; 35 females, eight males) and in their VSL performance (see the Results section below).
Results
First session: Group- and individual-level performance
The distribution of scores in the first session is shown in Fig. 6. On average, participants answered correctly on 26.35 of the 42 items (SD = 8.17). According to the binomial distribution (aggregating the different probabilities of correct responses for the different test items), chance-level performance was 16.67 correct trials. Hence, at the group level the task indeed produced significant learning [t(61) = 9.3, p < .0001]. However, as we noted above, from a psychometric perspective, a critical measure is the number of participants who perform above chance, not the mean performance of the sample. We therefore calculated the individual chance level, which is the number of trials on which a given participant would need to answer correctly in order to show above-chance performance at an individual level. We calculated this individual threshold using a computer simulation of 10,000 iterationsFootnote 2 and found that correct responses on 23 trials or more would present significant evidence of learning with an alpha of 5 % (i.e., fewer than 5 % of the iterations had a score of 23 or more). As is shown in Fig. 6, 37 out of the 62 participants (60 %) performed above this threshold. This represents an important increase in the participants who performed significantly above chance (about 40 % only in the original VSL task, as reported by Siegelman & Frost, 2015).

Distribution of scores in the first session. The black dashed line shows the group chance level (success on 16.67 trials), and the solid red line shows the individual chance level (success on 23 trials or more)
Reliability and internal consistency
To examine the internal reliability and consistency of the obtained scores, we calculated the split-half and Cronbach’s alpha coefficients. Our results show increases in both measures as compared to the old VSL task: Cronbach’s alpha = .88 (95 % CI [.84, .92]; as compared to .75, 95 % CI [.67, .83] in the old VSL task), split half reliability (Spearman–Brown corrected) = .83 (95 % CI [.72, .9]; as compared to .76, 95 % CI [.65, .86], in the old VSL task). These indices suggest that the new task is indeed better in terms of the degree to which all items in the task tap the underlying construct, probably due to less noise in the measurement. Note that the presently observed coefficient of the new VSL task reaches the values of standard psychometric tests (with recommended values of Cronbach’s alpha typically ranging from .8 to .95; see Streiner, 2003). The high Cronbach’s alpha value also suggests that the test taps into a single latent variable. This is also supported by a confirmatory factor analysis with one underlying SL factor (comparative fit index = .987, Tucker–Lewis index = .978, root mean squared error = .062; all values represent a good model fit—see Hu & Bentler, 1999).
Item analysis
To further examine the psychometric properties of the new task, we conducted an item analysis in which we calculated the discrimination index (d) for each item, by computing the correlation between the success with the item and the overall success rate in the test minus the success with the item (i.e., item by total-minus-item correlations; e.g., Everitt & Skrondal, 2010). This index reflects how well each item discriminates between participants with low and high visual SL ability. The discrimination indexes of the items ranged from .14 to .6 (see Table 3 above for the observed ds for all items), with a mean of .36. This constitutes a significant improvement relative to the old VSL task, in which the mean discrimination index was .26 [two-sample t(72) = 4.05, p < .001].
In addition, to validate our manipulation of levels of difficulty across items, and to see whether indeed the TPs of the targets and foils influenced performance, we conducted a mixed-effect logistic regression model (using the lme4 package in R; Bates, Maechler, Bolker, & Walker, 2015). The dependent measure of this analysis was correctness (correct/incorrect) on each experimental trial, with the TP of the target, the mean TPs of the foils, and the mean position violations in the foils as fixed effects, and chance level for the item (1 divided by the number of options for the item) and mean-centered trial number as control variables. The model also included a by-item random intercept and by-subject random slopes for the TP of the target and the mean TPs of the foils (the maximal random-effect structure justified by the data that converged; see Barr, Levy, Scheepers, & Tily, 2013). Collinearity in the model was small (correlations between the fixed effects were smaller than .25). Theoretically, we predicted that performance would improve with higher TPs of the targets, lower mean TPs of the foils, and more position violations. The results of the model, shown in Table 4, confirmed the TP manipulation: We found a significant positive effect for TP of the target (B = 0.72, SE = 0.25, p < .01) and a significant negative effect for the TPs of the foils (B = −1.32, SE = 0.51, p = .01). No significant effect of position violations was found (B = 0.03, SE = 0.16, p = .86), suggesting that position violations in foils may not influence performance. This, however, will require additional investigation.
Second session: Test–retest reliability
As we noted above, three months following the first administration of the task, all participants were contacted and invited to return for another testing session, in which a retest of the task was conducted. Forty-three of the participants returned for the retest. Their mean score in the first administration of the task did not differ significantly from the score of those who did not came back for the retest [27.14 vs. 24.7 correct items, t(60) = 1.09, p = .28]. The mean score of the second session (i.e., the retest) was 26.3 correct trials (SD = 7.51), showing no overall improvement from the first administration of the task at the group level [t(42) = −0.78, p = .44]. This conforms to previous findings showing no improvement in performance in multiple testing sessions (Siegelman & Frost, 2015). Most importantly, the second administration of the test enabled us to estimate the task’s test–retest reliability: Figure 7 shows the test–retest scatterplot of observed scores in the two sessions. The observed test–retest reliability coefficient was .68 (95 % CI [.48, .81]), an increased value as compared to the previous VSL task reported in Siegelman and Frost (2015), which had a test–retest reliability of .58 (95 % CI [.4, .71]).

Test–retest reliabilities for the new VSL task
Discussion
In the present article, we have outlined the pitfalls of existing SL tasks for measuring individual differences in SL ability, and offer blueprints for novel tasks specifically designed to measure individual performance in visual SL. Specifically, current SL tasks, which were originally designed for group-level investigations, have three major limitations: (1) an insufficient number of trials in the test phase (or repeated testing of the same targets), (2) chance-level performance for most of the sample, and (3) equal levels of difficulty across all of the test items. This led us to develop a visual SL task with a maximal number of trials and a minimal number of repeated patterns, which presents above-chance performance for a larger portion of the population,Footnote 3 and includes items that vary in difficulty to cover a wider range of the measured ability. Following the implementation of these modifications, the new VSL task indeed displays superior and improved psychometric properties, as compared with previous tasks.
However, in addition to the improved psychometric properties, from a theoretical perspective, the new VSL task has an important advantage. Current SL tasks are limited in their coverage of the scope of VSL ability, because they measure only one kind of response (mostly, selecting a familiar pattern), applied only to sequences of three elements, with targets and foils with only a single TP structure (typically, 1 and 0), and no manipulation of position violations. As we noted in the introduction, in line with facet theory, this can be formalized by comparing the complexities of the respective mapping sentences that describe the current and new tasks: Whereas the current VSL task measures the ability to recognize sequences of triplets, of TP = 1 , from foils of TP = 0 , without violation of positions, the new VSL task measures the ability to \( \left(\begin{array}{c}\hfill \boldsymbol{recognize}\hfill \\ {}\hfill \boldsymbol{complete}\hfill \end{array}\right) \) sequences of \( \left(\begin{array}{c}\hfill \boldsymbol{triplets}\hfill \\ {}\hfill \boldsymbol{pairs}\hfill \end{array}\right) \), of \( \left(\begin{array}{c}\hfill \boldsymbol{T}\boldsymbol{P}=1\hfill \\ {}\hfill \boldsymbol{T}\boldsymbol{P}=.33\hfill \end{array}\right) \), from foils of, \( \left(\begin{array}{c}\hfill \boldsymbol{ranging}\;\boldsymbol{from}\hfill \\ {}\hfill 0\;\boldsymbol{t}\boldsymbol{o}\;.5\hfill \end{array}\right) \), \( \left(\begin{array}{c}\hfill \boldsymbol{with}\;\boldsymbol{different}\hfill \\ {}\hfill \boldsymbol{degree}\;\boldsymbol{of}\hfill \end{array}\right) \) violation of positions. The latter mapping sentence shows the better conceptual coverage of the scope of the measured ability (i.e., visual SL) in the new VSL task. In addition, it also provides the blueprints for further expanding the coverage of the ability, by possibly adding other parameters to the facets (e.g., by including more values of TPs for the targets, by including additional types of responses, etc.), which can be implemented in future, improved versions of the task.
Developing adequate SL tasks to study individual differences has important theoretical implications. If SL is taken to predict a cognitive measure (such as, for example, linguistic capacity), the predictive validity of the task is constrained by its reliability: The correlation between the score obtained in the SL task (x) and the measured cognitive capacity (y) is upper-bounded by the square root of the product of the measures’ reliabilities \( \left({\rho}_{xy}\le \sqrt{\rho_{xx}*{\rho}_{yy}}\right) \). Current SL tasks, having relatively mediocre reliability, are then limited in the extent of the correlations they can display with various cognitive measures. The new SL task, therefore, has the potential of better predicting linguistic abilities (see, e.g., Arciuli & Simpson, 2012; Frost et al., 2013) or providing more accurate estimations of the interrelations between different SL tasks (e.g., Romberg & Saffran, 2013; Siegelman & Frost, 2015). In addition, it can serve as a better measure for behavioral SL performance that can then be correlated with neural activation during the process of identifying the neurocircuitry underlying SL (e.g., Karuza et al., 2013; Turk-Browne et al., 2009).
We should emphasize that the advantage of using more reliable tasks is not limited to studies of individual differences. The use of more reliable SL measures also has the promise of increasing the statistical power of group-level investigations, simply by decreasing the error variance. For example, two recent studies investigating the role of awareness in SL (Arciuli et al., 2014; Batterink et al., 2015) independently reported better, albeit nonsignificant, performance in an intentional-learning condition relative to an unintentional one (an advantage of 5.4 % in the Arciuli et al., 2014, study, and an advantage of 4.7 % in the Batterink et al., 2015, study). This converging pattern of “null results” may hint, however, that a real advantage of intentional learning was simply masked by the extensive noise related to the tasks’ low reliability. Using psychometrically improved tasks in group-level investigations could then reduce possible Type II errors.
Current limitations and future research
Although the present investigation goes some way toward the development of better SL tasks for measuring individual differences, it is clear that there is still room for improvement in terms of reliability and discriminative power. In this section, we outline directions that can guide future development of such tasks.
In the new task, 60 % of the sample exhibited learning, suggesting that the novel task still does not provide reliable information about the SL abilities of a relatively large proportion of the sample. A possible avenue to further improve the ratio of participants who show above-chance-level performance, thereby increasing the test’s reliability, would be to reduce the difficulty level of some of the items (through altering target and foil similarity). Improved reliability could also be obtained by using only 4AFC-format test items, which would reduce baseline chance-level performance and decrease the error variance that stems from random guesses.
Another option to further increase the discriminative power of the task would be to use a weighted scoring method, in which correct responses on more difficult items (i.e., with lower TPs of the targets, higher TPs of the foils, and a higher number of foils) or with higher discriminative power (i.e., with a higher discrimination index) would credit the participants with more test points. As can be seen in Table 3, the items in the present task vary across all of these dimensions, and our data suggest that performance is indeed influenced by these factors. Future research could take these factors as weights for the scores in a new, independent sample and examine, as a cross-validation, whether this scoring procedure improves the reliability of the scores and their predictive power. Similarly, an adaptive testing procedure, in which each participant is presented with items of a certain level of difficulty based on his or her performance on the preceding items, could result in a maximally precise test score (while using even fewer items). However, the development of adaptive tests is a complex process that requires precise knowledge of what the factors are that influence SL performance, and their relative degrees of impact. We believe the present investigation may serve as a first step in this direction.
Note also that the factors contributing to SL performance are important not only from a methodological perspective, but also from a theoretical one. Specifically, empirical evidence regarding the relevant factors that determine performance may serve as important constraints for computational models of SL, specifying the computations involved in extracting regularities from the input. Although not the main focus of the present investigation, the results from the novel task already provide some preliminary insights regarding SL computations. For example, we found that although the TPs of the targets and foils affected performance, violations of position did not. This finding suggests that participants are not sensitive to the locations of shapes within patterns. Another interesting theoretical issue stemming from the present data is that, although the stream of shapes was made of chunks of triplets, pairs (i.e., “part-chunks” of the triplets) were learned just as well (mean performance index for triplet items = .384, mean performance for pair items = .381).Footnote 4 Future research can build upon these preliminary findings to investigate the effects of these factors (and others) in order to accurately predict SL performance.
Future research also requires us to examine whether similar modifications to SL tasks in other modalities (e.g., auditory SL) and with different types of stimuli (e.g., verbal) would have the same positive effect on the tasks’ psychometric characteristics. However, some of the proposed modifications might present challenges for tasks in the auditory modality; for example, the auditory presentation of four alternatives in the same test item might exceed the working memory capacities of some individuals. A possible issue in using the same procedure with verbal materials could stem from interference with existing linguistic knowledge, due to the large number of different foils. Despite these challenges, we believe that task construction across different modalities and materials is a crucial step toward the understanding of how both modality-specific and domain-general processes result in a given individual’s performance in a given SL task (for a discussion, see Frost et al., 2015).
Conclusions
To summarize, the present article reports a novel method for assessing individual differences in SL. The development of such tasks is crucial, in light of the growing interest in individual differences in SL, both as a predictor of other capacities and as a tool for understanding the mechanisms underlying SL. The measures reported here with the new task demonstrate its superior psychometric properties, and thus can serve as guidelines for future studies in this important line of research.
Notes
Note that these parameters are identical to those of the common procedure employed in the VSL task (e.g., Siegelman & Frost, 2015).
In contrast to the computation of group-level chance, or to a calculation of the individual chance level in a test in which all items have the same number of trials, the calculation of the individual chance level in a test with items with different numbers of options is not straightforward. This was the reason for using a computer simulation for this calculation instead of analytical calculation. In each iteration, the computer randomly selected a series of 42 responses (for all test trials), and the total score for this iteration was calculated. Following 10,000 iterations, we calculated the value for which fewer than 5 % of the iterations resulted in higher scores. Hence, scores above the obtained threshold (of 23 correct responses) have a p < .05 probability of resulting from a Type I error under the null hypothesis of random guessing.
Note that more participants performing above chance level may actually decrease variance, since in the binomial distribution the variance is dependent on the performance level, \( SD=\sqrt{npq} \), so that chance-level decisions (p = q = .5) yield the highest value. However, the variance around chance is not reliable, because it is derived from random guesses.
To control for the different chance-level in different items, we calculated the mean performance on pair and triplet items according to the formula \( \frac{p_o-{p}_e}{1-{p}_e} \), where p o stands for the percent of participants who answered correctly on the item, and p e is the chance level.
References
Arciuli, J., & Simpson, I. C. (2012). Statistical learning is related to reading ability in children and adults. Cognitive Science, 36, 286–304. doi:10.1111/j.1551-6709.2011.01200.x
Arciuli, J., von Koss Torkildsen, J., Stevens, D. J., & Simpson, I. C. (2014). Statistical learning under incidental versus intentional conditions. Frontiers in Psychology, 5, 747. doi:10.3389/fpsyg.2014.00747
Aslin, R. N., Saffran, J. R., & Newport, E. L. (1998). Computation of conditional probability statistics by 8-month-old infants. Psychological Science, 9, 321–324. doi:10.1111/1467-9280.00063
Barr, D. J., Levy, R., Scheepers, C., & Tily, H. J. (2013). Random effects structure for confirmatory hypothesis testing: Keep it maximal. Journal of Memory and Language, 68, 255–278. doi:10.1016/j.jml.2012.11.001
Bates, D., Maechler, M., Bolker, B., & Walker, S. (2015). lme4: Linear mixed-effects models using Eigen and S4 (R package version 1.1-8). Retrieved from cran.r-project.org/package=lme4
Batterink, L. J., Reber, P. J., Neville, H. J., & Paller, K. A. (2015). Implicit and explicit contributions to statistical learning. Journal of Memory and Language, 83, 62–78. doi:10.1016/j.jml.2015.04.004
Bertels, J., Boursain, E., Destrebecqz, A., & Gaillard, V. (2014). Visual statistical learning in children and young adults: How implicit? Frontiers in Psychology, 5, 1541. doi:10.3389/fpsyg.2014.01541
Bertels, J., Franco, A., & Destrebecqz, A. (2012). How implicit is visual statistical learning? Journal of Experimental Psychology. Learning, Memory, and Cognition, 38, 1425–1431. doi:10.1037/a0027210
Birnbaum, A. (1968). Some latent trait models and their use in inferring an examinee’s ability. In F. M. Lord & M. R. Novick (Eds.), Statistical theories of mental test scores (pp. 397–472). Reading: Addison-Wesley.
Bulf, H., Johnson, S. P., & Valenza, E. (2011). Visual statistical learning in the newborn infant. Cognition, 121, 127–132. doi:10.1016/j.cognition.2011.06.010
Conway, C. M., Bauernschmidt, A., Huang, S. S., & Pisoni, D. B. (2010). Implicit statistical learning in language processing: Word predictability is the key. Cognition, 114, 356–371. doi:10.1016/j.cognition.2009.10.009
Conway, C. M., Karpicke, J., & Pisoni, D. B. (2007). Contribution of implicit sequence learning to spoken language processing: Some preliminary findings with hearing adults. Journal of Deaf Studies and Deaf Education, 12, 317–334. doi:10.1093/deafed/enm019
Emberson, L. L., Conway, C. M., & Christiansen, M. H. (2011). Timing is everything: Changes in presentation rate have opposite effects on auditory and visual implicit statistical learning. Quarterly Journal of Experimental Psychology, 64, 1021–1040. doi:10.1080/17470218.2010.538972
Embretson, S. E., & Reise, S. P. (2000). Item response theory for psychologists. Mahwah: Erlbaum.
Endress, A. D., & Mehler, J. (2009). The surprising power of statistical learning: When fragment knowledge leads to false memories of unheard words. Journal of Memory and Language, 60, 351–367. doi:10.1016/j.jml.2008.10.003
Erickson, L. C., & Thiessen, E. D. (2015). Statistical learning of language: Theory, validity, and predictions of a statistical learning account of language acquisition. Developmental Review, 37, 66–108. doi:10.1016/j.dr.2015.05.002
Evans, J., Saffran, J., & Robe-Torres, K. (2009). Statistical learning in children with specific language impairment. Journal of Speech, Language, and Hearing Research, 52, 321–335. doi:10.1044/1092-4388(2009/07-0189)
Everitt, B. S., & Skrondal, A. (2010). Cambridge dictionary of statistics. Cambridge: Cambridge University Press.
Fiser, J., & Aslin, R. N. (2001). Unsupervised statistical learning of higher-order spatial structures from visual scenes. Psychological Science, 12, 499–504. doi:10.1111/1467-9280.00392
Frost, R., Armstrong, B. C., Siegelman, N., & Christiansen, M. H. (2015). Domain generality versus modality specificity: The paradox of statistical learning. Trends in Cognitive Sciences, 19, 117–125. doi:10.1016/j.tics.2014.12.010
Frost, R., Siegelman, N., Narkiss, A., & Afek, L. (2013). What predicts successful literacy acquisition in a second language? Psychological Science, 24, 1243–1252. doi:10.1177/0956797612472207
Gebhart, A. L., Newport, E. L., & Aslin, R. N. (2009). Statistical learning of adjacent and nonadjacent dependencies among nonlinguistic sounds. Psychonomic Bulletin & Review, 16, 486–490. doi:10.3758/PBR.16.3.486
Glicksohn, A., & Cohen, A. (2013). The role of cross-modal associations in statistical learning. Psychonomic Bulletin & Review, 20, 1161–1169. doi:10.3758/s13423-013-0458-4
Gómez, R. L. (2002). Variability and detection of invariant structure. Psychological Science, 13, 431–436. doi:10.1111/1467-9280.00476
Hu, L., & Bentler, P. M. (1999). Cutoff criteria for fit indexes in covariance structure analysis: Conventional criteria versus new alternatives. Structural Equation Modeling: A Multidisciplinary Journal, 6, 1–55. doi:10.1080/10705519909540118
Karuza, E. A., Newport, E. L., Aslin, R. N., Starling, S. J., Tivarus, M. E., & Bavelier, D. (2013). The neural correlates of statistical learning in a word segmentation task: An fMRI study. Brain and Language, 127, 46–54. doi:10.1016/j.bandl.2012.11.007
Kaufman, S. B., DeYoung, C. G., Gray, J. R., Jiménez, L., Brown, J., & Mackintosh, N. (2010). Implicit learning as an ability. Cognition, 116, 321–340. doi:10.1016/j.cognition.2010.05.011
Kim, R., Seitz, A., Feenstra, H., & Shams, L. (2009). Testing assumptions of statistical learning: Is it long-term and implicit? Neuroscience Letters, 461, 145–149. doi:10.1016/j.neulet.2009.06.030
Kirkham, N. Z., Slemmer, J. A., & Johnson, S. P. (2002). Visual statistical learning in infancy: Evidence for a domain general learning mechanism. Cognition, 83, B35–B42. doi:10.1016/S0010-0277(02)00004-5
Mainela-Arnold, E., & Evans, J. L. (2014). Do statistical segmentation abilities predict lexical-phonological and lexical-semantic abilities in children with and without SLI? Journal of Child Language, 41, 327–51. doi:10.1017/S0305000912000736
Misyak, J. B., & Christiansen, M. H. (2012). Statistical learning and language: An individual differences study. Language Learning, 62, 302–331. doi:10.1111/j.1467-9922.2010.00626.x
Misyak, J. B., Christiansen, M. H., & Tomblin, J. B. (2010). On-line individual differences in statistical learning predict language processing. Frontiers in Psychology, 1, 31. doi:10.3389/fpsyg.2010.00031
Mosse, E. K., & Jarrold, C. (2008). Hebb learning, verbal short-term memory, and the acquisition of phonological forms in children. Quarterly Journal of Experimental Psychology, 61, 505–514. doi:10.1080/17470210701680779
Newport, E. L., & Aslin, R. N. (2004). Learning at a distance I. Statistical learning of non-adjacent dependencies. Cognitive Psychology, 48, 127–162. doi:10.1016/S0010-0285(03)00128-2
Nunnally, J., & Bernstein, I. (1994). Psychometric theory (3rd ed.). New York: McGraw-Hill.
Pelucchi, B., Hay, J. F., & Saffran, J. R. (2009). Statistical learning in a natural language by 8-month-old infants. Child Development, 80, 674–685. doi:10.1111/j.1467-8624.2009.01290.x
Raven, J. C., Court, J. H., & Raven, J. (1992). Manual for Raven’s progressive matrices and vocabulary scales. Oxford: Oxford Psychologist Press.
Romberg, A. R., & Saffran, J. R. (2013). All together now: Concurrent learning of multiple structures in an artificial language. Cognitive Science, 37, 1290–1320. doi:10.1111/cogs.12050
Saffran, J. R., Aslin, R. N., & Newport, E. L. (1996). Statistical learning by 8-month-old infants. Science, 274, 1926–1928. doi:10.1126/science.274.5294.1926
Saffran, J. R., Johnson, E. K., Aslin, R. N., & Newport, E. L. (1999). Statistical learning of tone sequences by human infants and adults. Cognition, 70, 27–52. doi:10.1016/S0010-0277(98)00075-4
Saffran, J. R., Newport, E. L., Aslin, R. N., Tunick, R. A., & Barrueco, S. (1997). Incidental language learning: Listening (and learning) out of the corner of your ear. Psychological Science, 8, 101–105. doi:10.1111/j.1467-9280.1997.tb00690.x
Shye, S., Elizur, D., & Hoffman, M. (1994). Introduction to facet theory: Content design and intrinsic data analysis in behavioral research. Thousand Oaks: Sage Publishing.
Siegelman, N., & Frost, R. (2015). Statistical learning as an individual ability: Theoretical perspectives and empirical evidence. Journal of Memory and Language, 81, 105–120. doi:10.1016/j.jml.2015.02.001
Singh, L., Steven Reznick, J., & Xuehua, L. (2012). Infant word segmentation and childhood vocabulary development: A longitudinal analysis. Developmental Science, 15, 482–495. doi:10.1111/j.1467-7687.2012.01141.x
Spencer, M., Kaschak, M. P., Jones, J. L., & Lonigan, C. J. (2014). Statistical learning is related to early literacy-related skills. Reading and Writing, 28, 467–490. doi:10.1007/s11145-014-9533-0
Streiner, D. L. (2003). Starting at the beginning: an introduction to coefficient alpha and internal consistency. Journal of Personality Assessment, 80, 99–103. doi:10.1207/S15327752JPA8001_18
Thiessen, E. D., Kronstein, A. T., & Hufnagle, D. G. (2013). The extraction and integration framework: A two-process account of statistical learning. Psychological Bulletin, 139, 792–814. doi:10.1037/a0030801
Turk-Browne, N. B., Junge, J. A., & Scholl, B. J. (2005). The automaticity of visual statistical learning. Journal of Experimental Psychology. General, 134, 552–564. doi:10.1037/0096-3445.134.4.552
Turk-Browne, N. B., Scholl, B. J., Chun, M. M., & Johnson, M. K. (2009). Neural evidence of statistical learning: Efficient detection of visual regularities without awareness. Journal of Cognitive Neuroscience, 21, 1934–1945. doi:10.1162/jocn.2009.21131
Author note
This article was supported by the Israel Science Foundation (ISF Grant No. 217/14 awarded to R.F.), and by the NICHD (Grant No. RO1 HD 067364 awarded to Ken Pugh and R.F., and Grant No. PO1-HD 01994 awarded to Haskins Laboratories).
Author information
Authors and Affiliations
Corresponding author
Appendix A
Appendix A

The 16 shapes used in the new VSL task
Rights and permissions
About this article

Cite this article
Siegelman, N., Bogaerts, L. & Frost, R. Measuring individual differences in statistical learning: Current pitfalls and possible solutions. Behav Res 49, 418–432 (2017). https://doi.org/10.3758/s13428-016-0719-z
Published:
Issue Date:
DOI: https://doi.org/10.3758/s13428-016-0719-z