Which Side Looks Better? Cultural Differences in Preference for Left- or Right-Facing Objects


Graduate School of Human Sciences, Osaka University, Osaka 565-0871, Japan
*
Author to whom correspondence should be addressed.
Symmetry 2020, 12(10), 1658; https://doi.org/10.3390/sym12101658
Submission received: 18 September 2020
/
Revised: 26 September 2020
/
Accepted: 5 October 2020
/
Published: 10 October 2020
(This article belongs to the Special Issue Biological Psychology: Brain Asymmetry and Behavioral Brain)
Abstract
:An oblique view of three-dimensional objects is preferred over a frontal or lateral view, partly because it is more familiar and easily recognizable. However, which side of a symmetric object looks better remains unsolved. Reading direction, handedness, and the functionality of objects have been suggested as the potential sources of directional bias. In this study, participants of three online surveys (total N = 1082) were asked to choose one item that looked better or was more aesthetically pleasing; the test was performed between 100 pairs of left- and right-facing mirror-images. The results showed that Japanese participants (both vertical and left-to-right readers) and Israeli participants (right-to-left readers) preferred left-facing images over right-facing images, whereas American participants (left-to-right readers) preferred right-facing images over left-facing images. Weak effects of handedness and object functionality were also found: Left-handers tended to choose right-facing images more than right-handers, and the view of objects with a handle that is graspable by the dominant hand was more likely to be chosen over the opposite side view, regardless of culture. Although previous studies have emphasized the role of reading direction, a close look at the results suggests that it cannot fully account for the preferred facing direction of oblique objects.
1. Introduction
Imagine that you are taking a picture of a product you want to promote on a brochure or on a website for advertising. From which angle should a picture be taken to give the best impression of the three-dimensional object?
Previous studies on the relationship between the object angle and goodness of view have shown that an oblique view (or a three-quarter view) has more advantages over a straight frontal or lateral view. Blanz et al. [1] used interactive three-dimensional computer graphics and asked participants to choose the viewpoint from which they would take a photograph of common objects for a brochure to give the best possible impression (Experiment 1) or to choose the viewpoint from which they spontaneously formed mental images of the objects (Experiment 2). The results showed that most of the participants (all German residents) preferred oblique views to the straight front or side views, particularly in the photography task. Niimi and Yokosawa [2] asked 10 Japanese participants to rate the view goodness of 18 common symmetrical objects rotated by 10 different angles from the straight front; they found that the three-quarter views, such as rotated by 27° and 45°, were rated better than other views. Nonose et al. [3] further reported that although oblique views were generally rated better than the front and side views, different objects had different best viewing angles, and the objects could be classified into three clusters based on view goodness rating patterns across viewing angles: front-preferred, oblique-preferred, and side-preferred objects. Three-dimensionality ratings and recognition performance were the highest for oblique views for all clusters. Therefore, Nonose et al. suggested that familiarity, rather than recognition efficiency, was a major determinant of view goodness, although the most familiar views did not necessarily equal the best view.
Given that oblique views have advantages over other views, in which direction is an object to be rotated to obtain a better view? Intuitively, it does not matter which side of an object is presented to the viewer if the object is symmetric because both images contain exactly the same amount of information (i.e., mirror-images). However, research has repeatedly demonstrated that an object facing one direction is preferred over the same object facing the opposite direction. Most interestingly, the preferred direction varies considerably across cultures [4] (see for a recent review). In particular, participants’ native reading and writing directions have attracted attention [5,6]. Typically, in most studies, participants are presented with an object’s image and its mirror reversal and asked to decide which member looks better or is more aesthetically pleasing. In one of the earliest studies, Nachson et al. [7] used 29 pairs of the left and right profiles of human faces and bodies, presented side by side, and asked 45 Arabic, 62 Hebrew, and 31 Russian readers to choose the member of a pair that looked more beautiful. The results showed that participants whose native language was Hebrew (a right-to-left script) preferred profiles that turned to the left, while participants whose native language was Russian (a left-to-right script) preferred profiles that turned to the right. Participants whose native language was Arabic (a right-to-left script) showed a nonsignificant leftward preference. These findings were regarded as evidence that aesthetic preference was affected by habitual reading direction. Chokron and De Agostini [8] presented 30 mirror-image pairs of drawings located one above the other. They asked 81 French and 81 Israeli participants to indicate which stimulus was more aesthetically pleasing or interesting to look at. All the participants were right-handed. For static objects (10 pairs), French participants (left-to-right readers) preferred pictures facing to the right over its mirror-image, whereas Israeli participants, who read Hebrew from right to left, preferred pictures facing to the left over its counterpart. French readers’ rightward bias was replicated in a subsequent study [9]. Ishii et al. [10] conducted a similar survey with 50 Japanese and 50 Australian individuals. The results showed that Japanese people preferred left-facing objects, whereas Australian people preferred right-facing objects. It is noteworthy that the effect size (calculated by the current authors as the absolute deviation from no bias) was larger for the Japanese (d = −0.82, from zero to leftward) than for the Australian (d = +0.39, from zero to rightward) population.
The cultural differences in preferred object orientation have been attributed to reading habits, in that people prefer object pictures possessing the same directionality as their reading habits [4,5,6,7,8,9,10]. However, there are several difficulties in this account of the preferred facing direction of single static objects. First, the Japanese language does not have the right-to-left reading direction in the same sense as the Hebrew and Arabic languages. The Japanese language can be read and written both horizontally and vertically. When writing vertically, the first line starts from the upper right of the page, and next lines follow to the left. These days, however, Japanese people are much more accustomed to the horizontal reading and writing direction, for instance, on computers and smartphones. The Japanese government has strongly encouraged the use of horizontal writing in public documents since 1952 [11]. Therefore, the finding that Japanese individuals showed a strong leftward bias, which is the direct opposite to the rightward bias of English and French readers, cannot be explained by reading habits alone. If there were no other factors than reading habits on preference for the facing direction of static objects, Japanese people should have shown no or a weaker bias than English and French readers. In reality, Japanese people showed a larger leftward bias. The preference for left-facing object drawings was obtained for Taiwanese people, who also used horizontal and vertical reading systems [12].
Besides the direction that the objects are facing, people often find that one view looks better or more “right” than its mirror-reversed view. This disposition is called “directionality” [4,13]. Directionality appears in several domains, including movement direction and spatial compositions, and it has been proposed to be influenced not only by cultural factors, but also by biological factors. Biological factors include cerebral laterality (hemispheric asymmetry), which is associated with handedness. Because the spatial processing of pictures involves right hemisphere activation, attention tends to move to the left, and the processing of stimuli in the left hemifield, or the left side of a stimulus, is facilitated [14,15,16].
The present study aimed to confirm the cultural differences in the preferred facing direction of centrally presented, static objects. In three online surveys, 100 pairs of symmetric objects and their mirror-images were presented. The participants were asked to choose the member that looked better or aesthetically pleasing. Survey 1 (a pilot survey) was conducted with Japanese university students (n = 41) to replicate the leftward bias reported in Ishii et al. [10]. Survey 2 (the main survey) recruited both American (n = 492) and Japanese (n = 505) participants and examined whether the opposite directional biases in English and Japanese readers were replicated with 10 times larger sample size than the original study [10]. Survey 3 (a supplementary survey) asked a small group of Israeli participants (n = 44) to answer the same questionnaire, here aiming to confirm the leftward bias in Hebrew readers [7,8].
Moreover, using the large-sample data of the main survey (Survey 2), the effects of handedness and object type were also examined. Previous research on the relationship between handedness and preferred facing direction has produced inconsistent results. Nachson et al. [7] reported that non-right-handed subjects showed more rightward preference than right-handed subjects for at least some types of stimuli, whereas De Agostini et al. [9] reported the opposite. The preferred facing direction may also depend on the functionality of the object. For instance, an object with a handle may look better when it is displayed at the angle in which the handle is directed toward the observer’s dominant hand than at the opposite angle in which the handle is not easy to grasp. This tendency has been reported in a production task where participants were asked to draw a picture of objects freely; they tended to draw an object in the direction with its handle facing toward their dominant hand [17]. Finally, a correlation between the preference indexes of Japanese and American participants was calculated at the object level. If their preferences were formed symmetrically (i.e., an object with a stronger leftward bias in one country had a stronger rightward bias in the other country), a negative correlation would be expected across objects. In contrast, if there was a base leftward or rightward preference in each country and relative differences among objects were determined by other factors, such as object functionality, a positive correlation would be expected.
2. Materials and Methods
2.1. Overview
Three surveys were conducted on different groups of people: Japanese, Americans and Japanese, and Israelis. Table 1 summarizes the number of participants included in the analysis. In each survey, the participants were asked to choose one member of a pair that looked better or more aesthetically pleasing (i.e., two-alternative forced-choice task). The mean preference index was calculated by averaging the response score (i.e., the choice of left-facing or right-facing image was scored as −1 or +1, respectively), thus ranging from −1 (all left-facing) to +1 (all right-facing). The handedness was measured by the Flinders Handedness survey (FLANDERS) questionnaire in each language: English [18], Japanese [19], and Hebrew (the last author’s translation). This questionnaire asked the participants about which hand they used for 10 common actions (e.g., writing, drawing). According to the sum of all answers (−1: left, 0: either, and +1: right), the participants were classified into three categories: left-handed (from −10 to −5), mixed-handed (from −4 to +4), and right-handed (from +5 to +10). Informed consent was obtained from each participant. The survey content and protocol were approved by the Behavioral Research Ethics Committee of the Osaka University School of Human Sciences (HB30-102 for Survey 1 and HB020-017-R for Surveys 2 and 3).
2.2. Stimulus Images
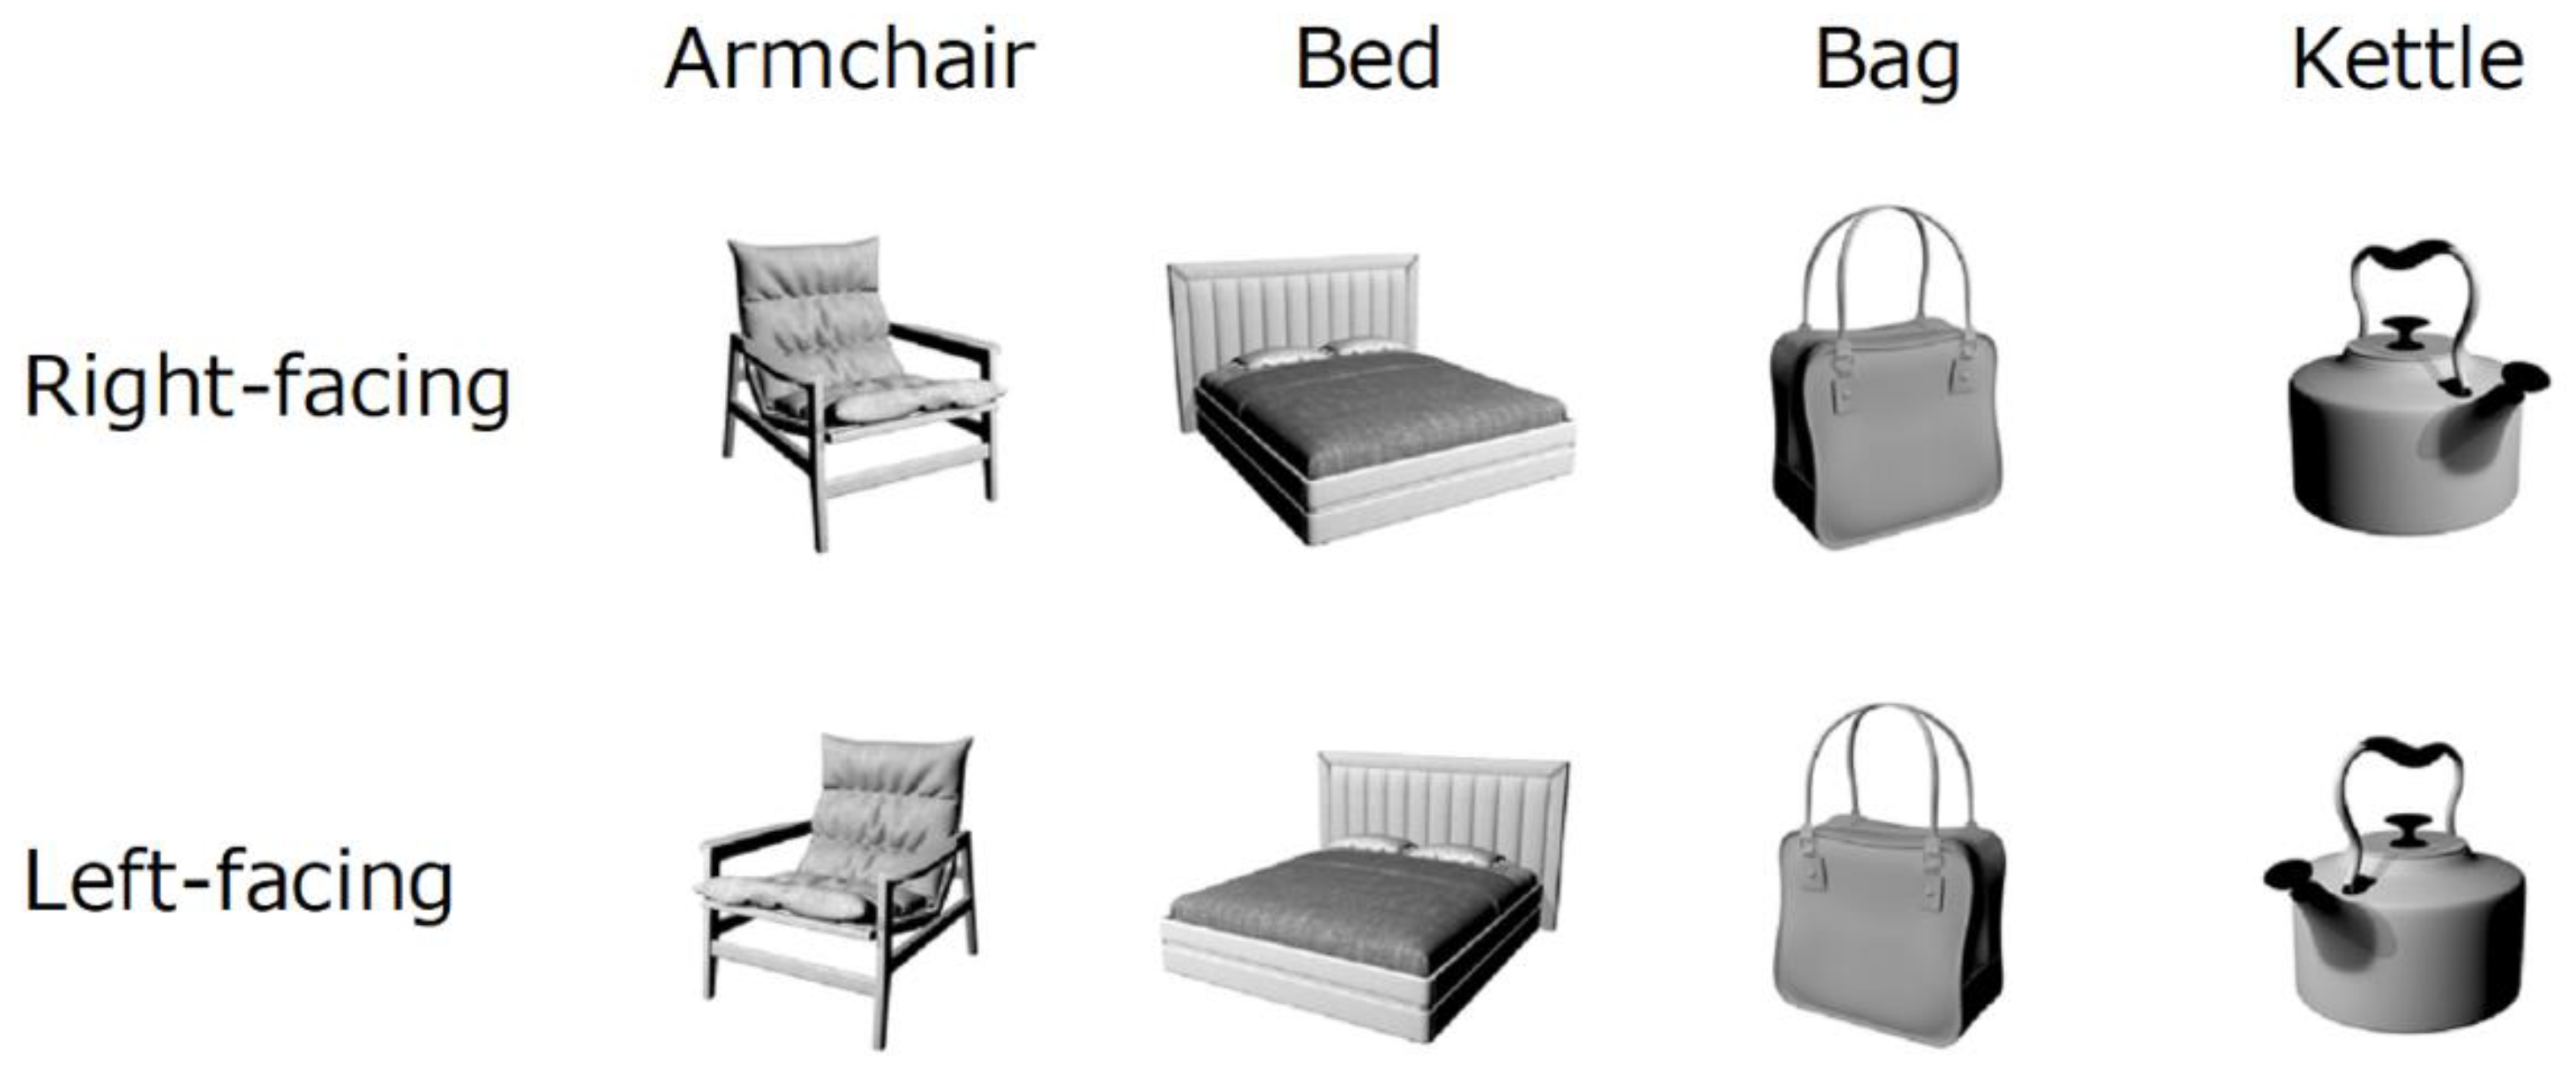
Figure 1 shows examples of the stimulus pairs used in the present study. The stimuli were black-and-white images that were newly created from three-dimensional digital models available at the Free 3D Models and Objects Archive (https://archive3d.net). One hundred common objects were selected to meet the following conditions: (1) Human-made artifacts, (2) objects with an orientation axis, and (3) objects that are symmetric when viewed from the front. The stimulus set consisted of twelve armchairs, four bags, eight beds, twelve chairs, four pairs of glasses, two headphones, four kettles, four lamps, ten lockers, four saucepans, two scooters, twelve sofas, two pairs of sunglasses, twelve tables, four teapots, and four vases. The digital models were rotated by 30 degrees to the left or the right from the front using a computer graphics program, Cheetah3D (https://www.cheetah3d.com/). The light source was located in front of the object’s center (i.e., from the left for left-facing objects and from the right for right-facing objects). To eliminate any artifacts because of digital image processing, 50 left-facing and 50 right-facing original images were created first. That is, the object models of each category were divided into two groups: One was used for creating left-facing images, whereas the other was used for creating right-facing images. Then, mirrored images were created from the original images. Therefore, the left- and right-facing images were regarded as an equivalent; both consisted of 50 original and 50 mirrored images. Images were displayed in 512 × 512 pixels (Survey 1) or in 256 × 256 pixels (Surveys 2 and 3). The whole stimulus set and raw data are available at https://osf.io/x9652/.
2.3. Specific Details of Each Survey
2.3.1. Survey 1
Forty-one Japanese university students (19–23 years old, M = 21.4 years) were recruited through the second author’s personal connection. This sample size was determined by a prior power analysis; a medium effect size (d = 0.5 from zero; cf. d = −0.82 in Ishii et al. [10]) could be detected with a power of 0.80 by a two-tailed t-test (a minimal of 34). The survey was conducted from 1–11 February 2019. No participants were excluded from the analysis. Because this survey was conducted as a preliminary survey of another experiment, the questionnaire structure differed from that of the following surveys. Qualtrics (https://www.qualtrics.com/) was used as the online survey platform. The image pairs were presented horizontally side by side. The order and position of the images were randomized across participants. After choosing one image from a pair, they were asked to rate the attractiveness, usability, and graspability of the object (regardless of viewpoint) on 7-point scales (1: not at all–7: very much), which are not reported here. Also, they were asked to write the name of the object in Japanese. All participants were able to name all the objects without ambiguity. They received an electronic cash voucher of 300 Japanese yen as compensation. The median completion time was 36.0 min.
2.3.2. Survey 2
SurveyMonkey (https://surveymonkey.com) was used as the online survey platform. The survey periods were 27–30 July and 7 August 2020 for the American and Japanese surveys, respectively. Stimulus images were presented vertically, one on top of the other. The surveys were conducted in English and in Japanese, both of which were written horizontally from left to right. Americans, from the United States whose native language was English, were recruited through Amazon Mechanical Turk (https://www.mturk.com) with a compensation of 1.5 US dollars. Japanese people whose native language was Japanese were recruited by a crowdsourcing company, CrowdWorks, Inc. (https://crowdworks.jp), with a compensation of 150 Japanese yen. About 500 participants were recruited in each survey to make the number of left-handers equivalent to the sample size of Survey 1, given the fact that about 5–10% of the population is left-handed [18,19]. Nevertheless, the obtained number of Japanese left-handers was lower than anticipated (n = 26). The participants were asked about their age and gender twice at the beginning and end of the survey. Those who answered differently to these questions were considered careless or uncooperative participants and were excluded from the analysis (14 Americans and 9 Japanese). The mean age (range) of the final samples was 41.0 (21–76) and 37.5 (18–72) years old for the Americans and Japanese, respectively. The median times for completion were 7.5 and 6.8 min for the Americans and Japanese, respectively. The participants in Surveys 2 and 3 were asked to declare their experience in other languages.
2.3.3. Survey 3
Survey 3 was conducted supplementarily with a small sample size. The survey was translated into Hebrew and written horizontally from right to left. Israeli individuals whose native language was Hebrew were recruited through the last author’s personal connection. The participants were unpaid volunteers. The survey period was 1–9 August 2020. Because of technical errors, 21 people were unable to complete the survey. The remaining 44 people answered their age and gender consistently at the beginning and end of the survey, and thus, were included in the analysis. The mean age (range) of the final samples was 40.4 (22–83) years old. The median time for completion was 8.7 min.
2.4. Statistical Analysis
The three surveys were analyzed separately because they had different sample sizes and collection methods. First, the mean preference index (−1: all left-facing, +1: all right-facing) of each group was tested against zero by calculating the 95% confidence interval (CI). If the CI does not contain zero, the mean value is significantly biased. The effect size was shown in Cohen’s d, which was the mean preference index divided by the standard deviation.
Second, an individual-level analysis was conducted. If a participant had no preference for left- or right-facing objects, their preference index should be zero (i.e., about 50 right-facing objects of the 100 pairs were chosen). According to a binominal distribution, a participant was regarded as having a significant bias in preference if they chose 39 or less (≤−0.22) or 61 or more (≥+0.22) right-facing objects (two-tailed p < 0.05). Using these criteria, the participants were classified into three clusters: Individuals with a leftward bias, no bias, or rightward bias. The relative proportions of the three clusters were compared between groups using a chi-squire test.
Three additional analyses were conducted for Survey 2. First, the effects of handedness on the mean preference index and the proportions of the three clusters were examined. The mean preference index was submitted to an analysis of variance (ANOVA) with factors of nationality and handedness. The proportions of the clusters were compared between left-handed and right-handed participants using a chi-square test. Second, the interaction effect between handedness and object type was examined. Specifically, four bags and four kettles were used for this analysis. As shown in Figure 1, right-facing bags would be easy to grasp using the right hand, whereas right-facing kettles would be easy to grasp using the left hand. The preference index for these selected items was submitted to an ANOVA with factors of nationality, handedness, and item (bags vs. kettles). The effect size was shown in η2, which was the sum of squares for the effect of interest divided by the total sum of squares for all data variance. Finally, an object-level analysis was conducted. The mean preference index was calculated for each of the 100 objects separately for the American and Japanese participants. A Pearson correlation coefficient between the two groups was calculated to determine whether their preferences were formed symmetrically or not.
3. Results
First, the mean preference index was compared between the male and female participants in each survey (transgender individuals were not included in this analysis). Because no significant gender differences were found, ps > 0.25, the data of all participants will be pooled, regardless of gender, including transgender individuals.
3.1. Overall Analysis
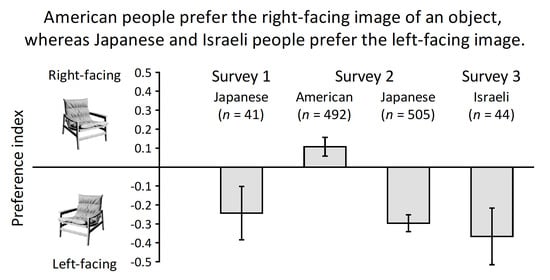
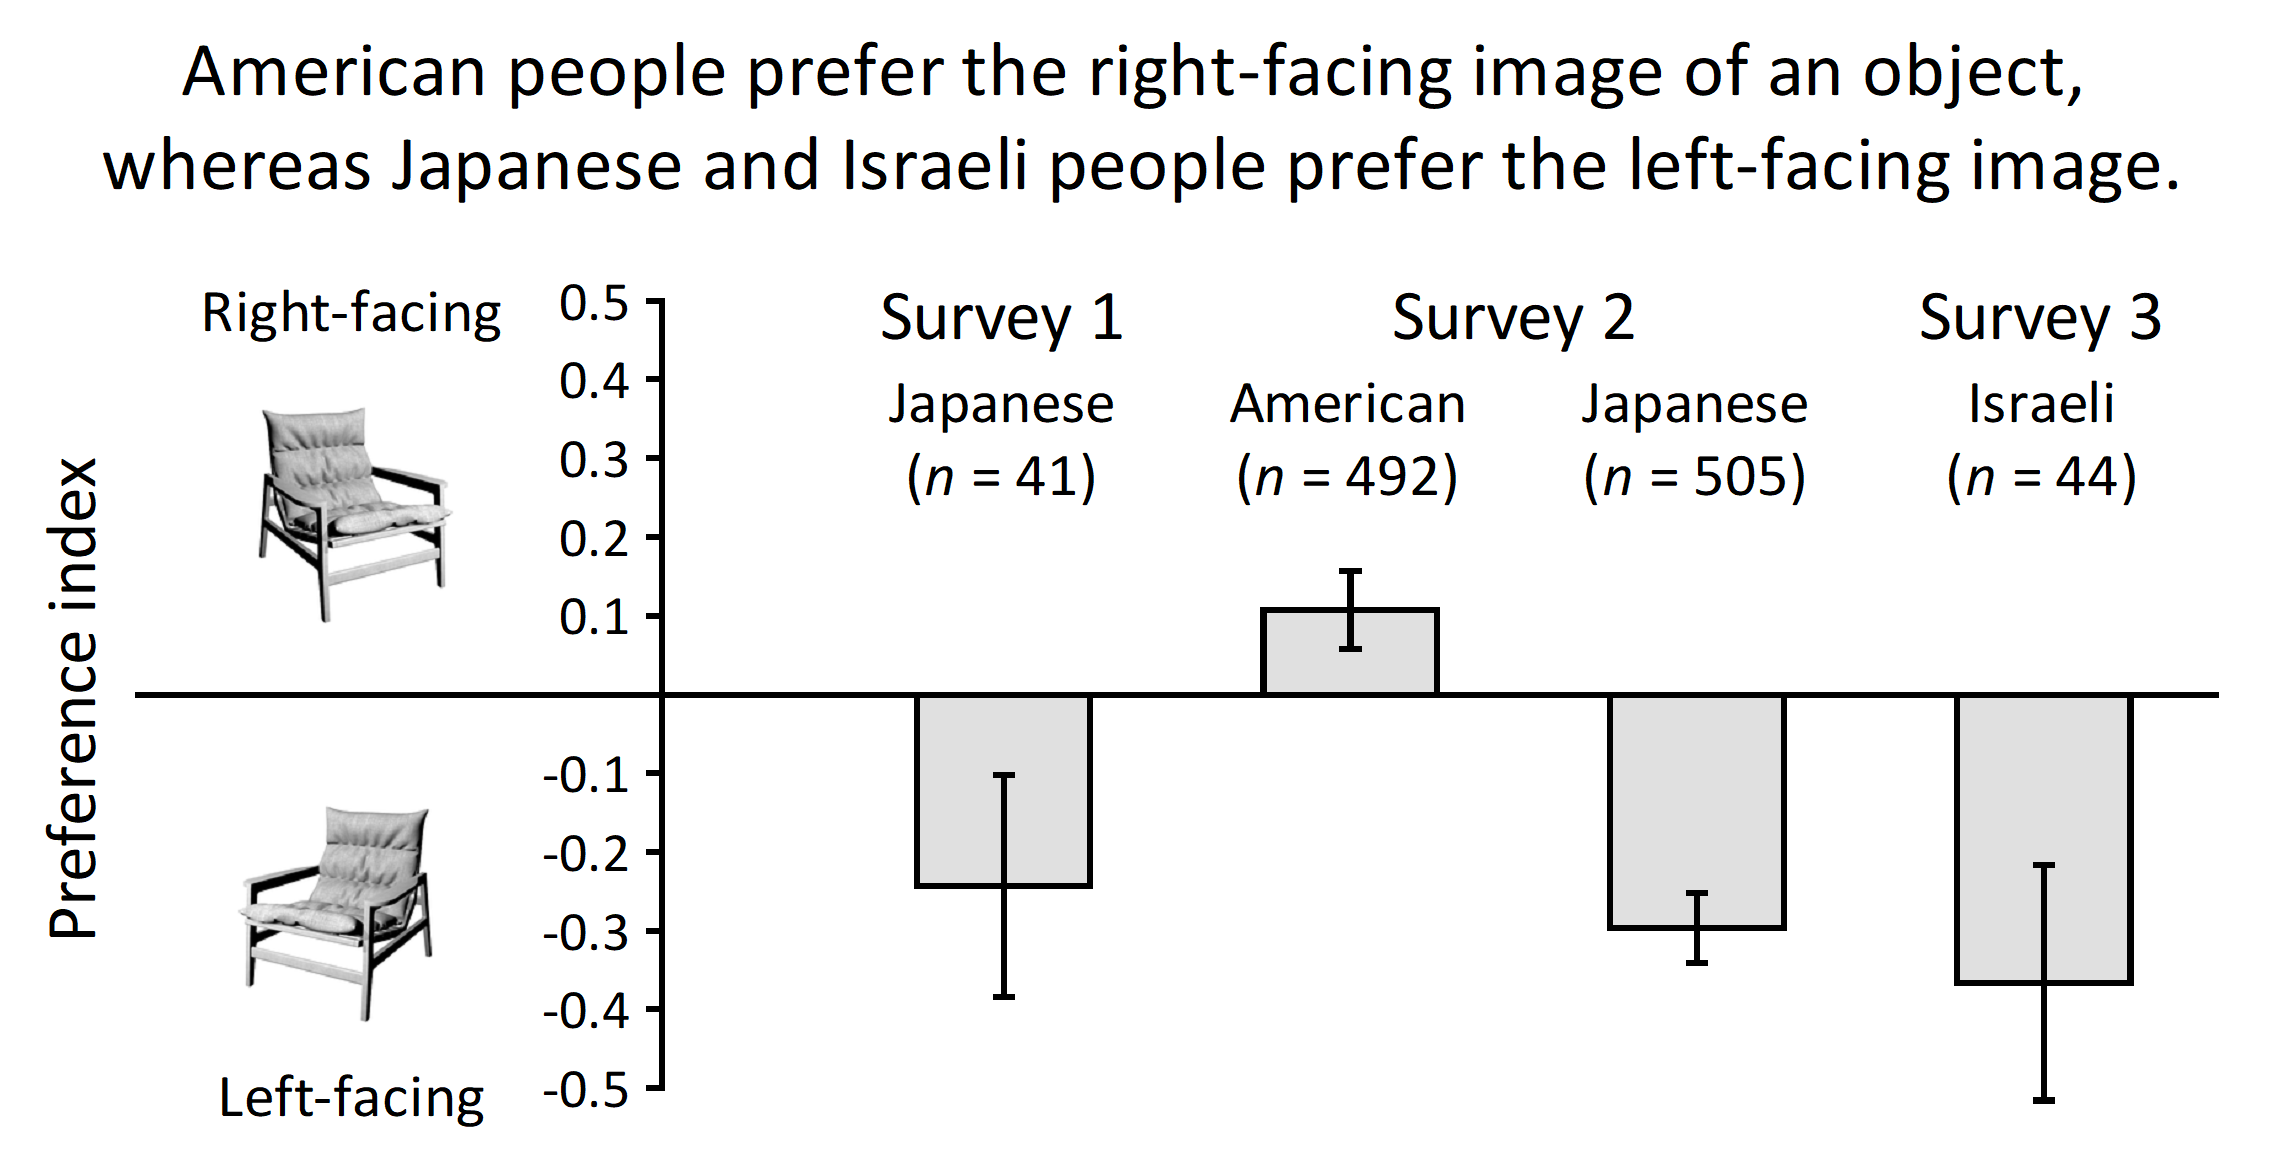
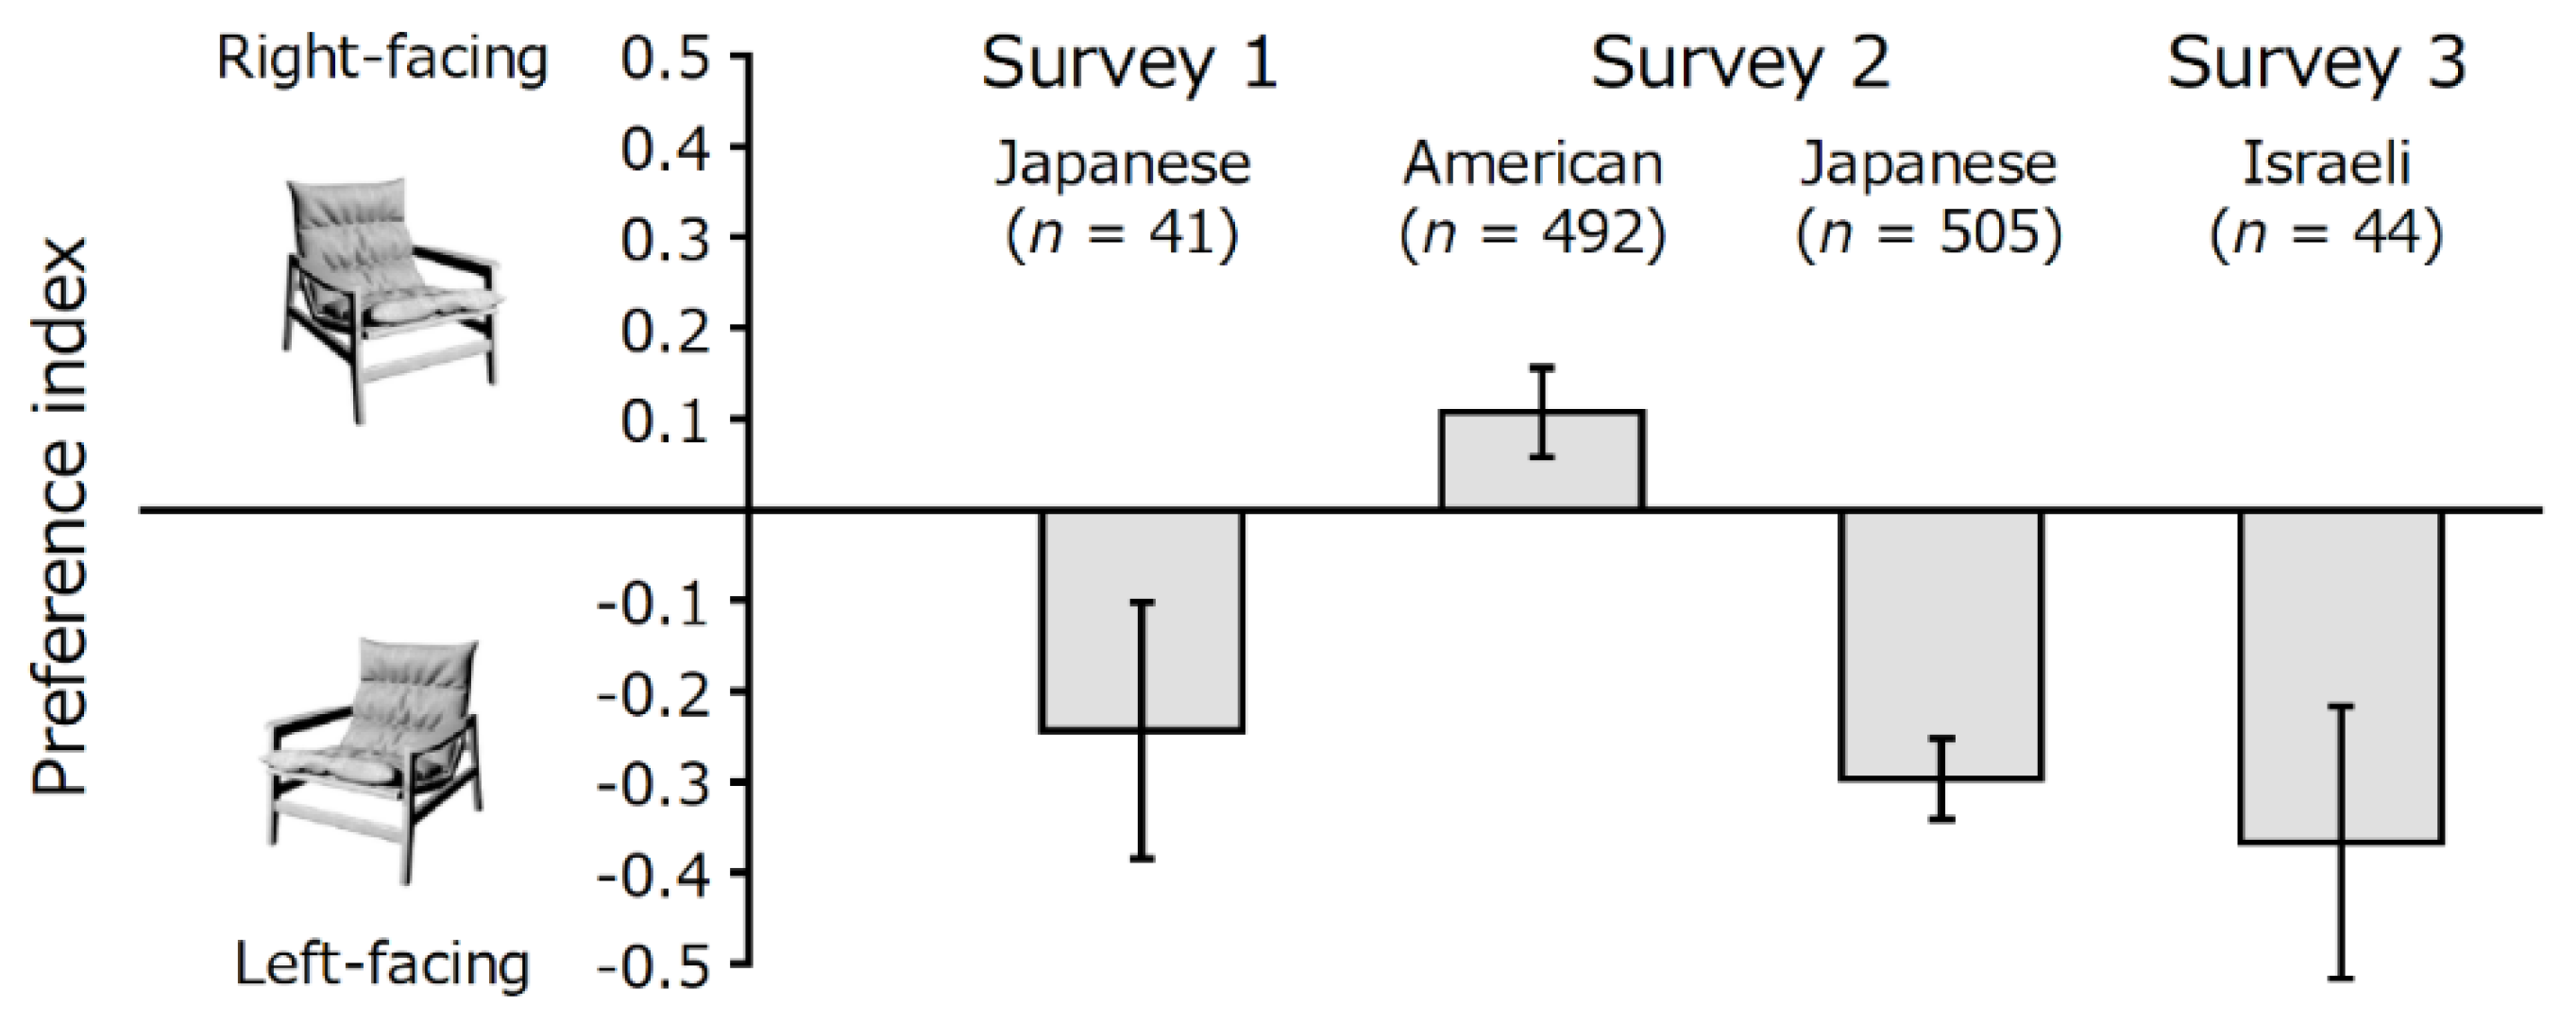
Figure 2 shows the mean preference index in each survey. Because the 95% CIs do not cross zero, all groups showed significant biases in preference. In Survey 1, the Japanese participants showed a significant leftward preference, M = −0.24, SD = 0.45, d = −0.54, which means that they chose left-facing images in 62.1% of the pairs on average, 95% CI = [55.1%, 69.2%]. This result was confirmed by a larger sample in Survey 2. The leftward preference was obvious, M = −0.30, SD = 0.51, d = −0.58, meaning left-facing images were chosen in 64.8% of the pairs, 95% CI = [62.6%, 67.0%]. A similar leftward preference was found for the Israeli participants (Survey 3), M = −0.37, SD = 0.49, d = −0.75, which means that left-facing images were chosen in 68.3% of the pairs, 95% CI = [60.8%, 75.8%]. In contrast, Americans (Survey 2) showed a significant rightward preference, M = +0.11, SD = 0.56, d = +0.19. They chose right-facing images over left-facing images in 55.3% of the pairs on average, 95% CI = [52.9%, 57.8%]. It should be noted that the absolute effect size (i.e., deviation from zero) was larger for the leftward bias of the Japanese and Israeli participants than for the rightward bias of the American participants.
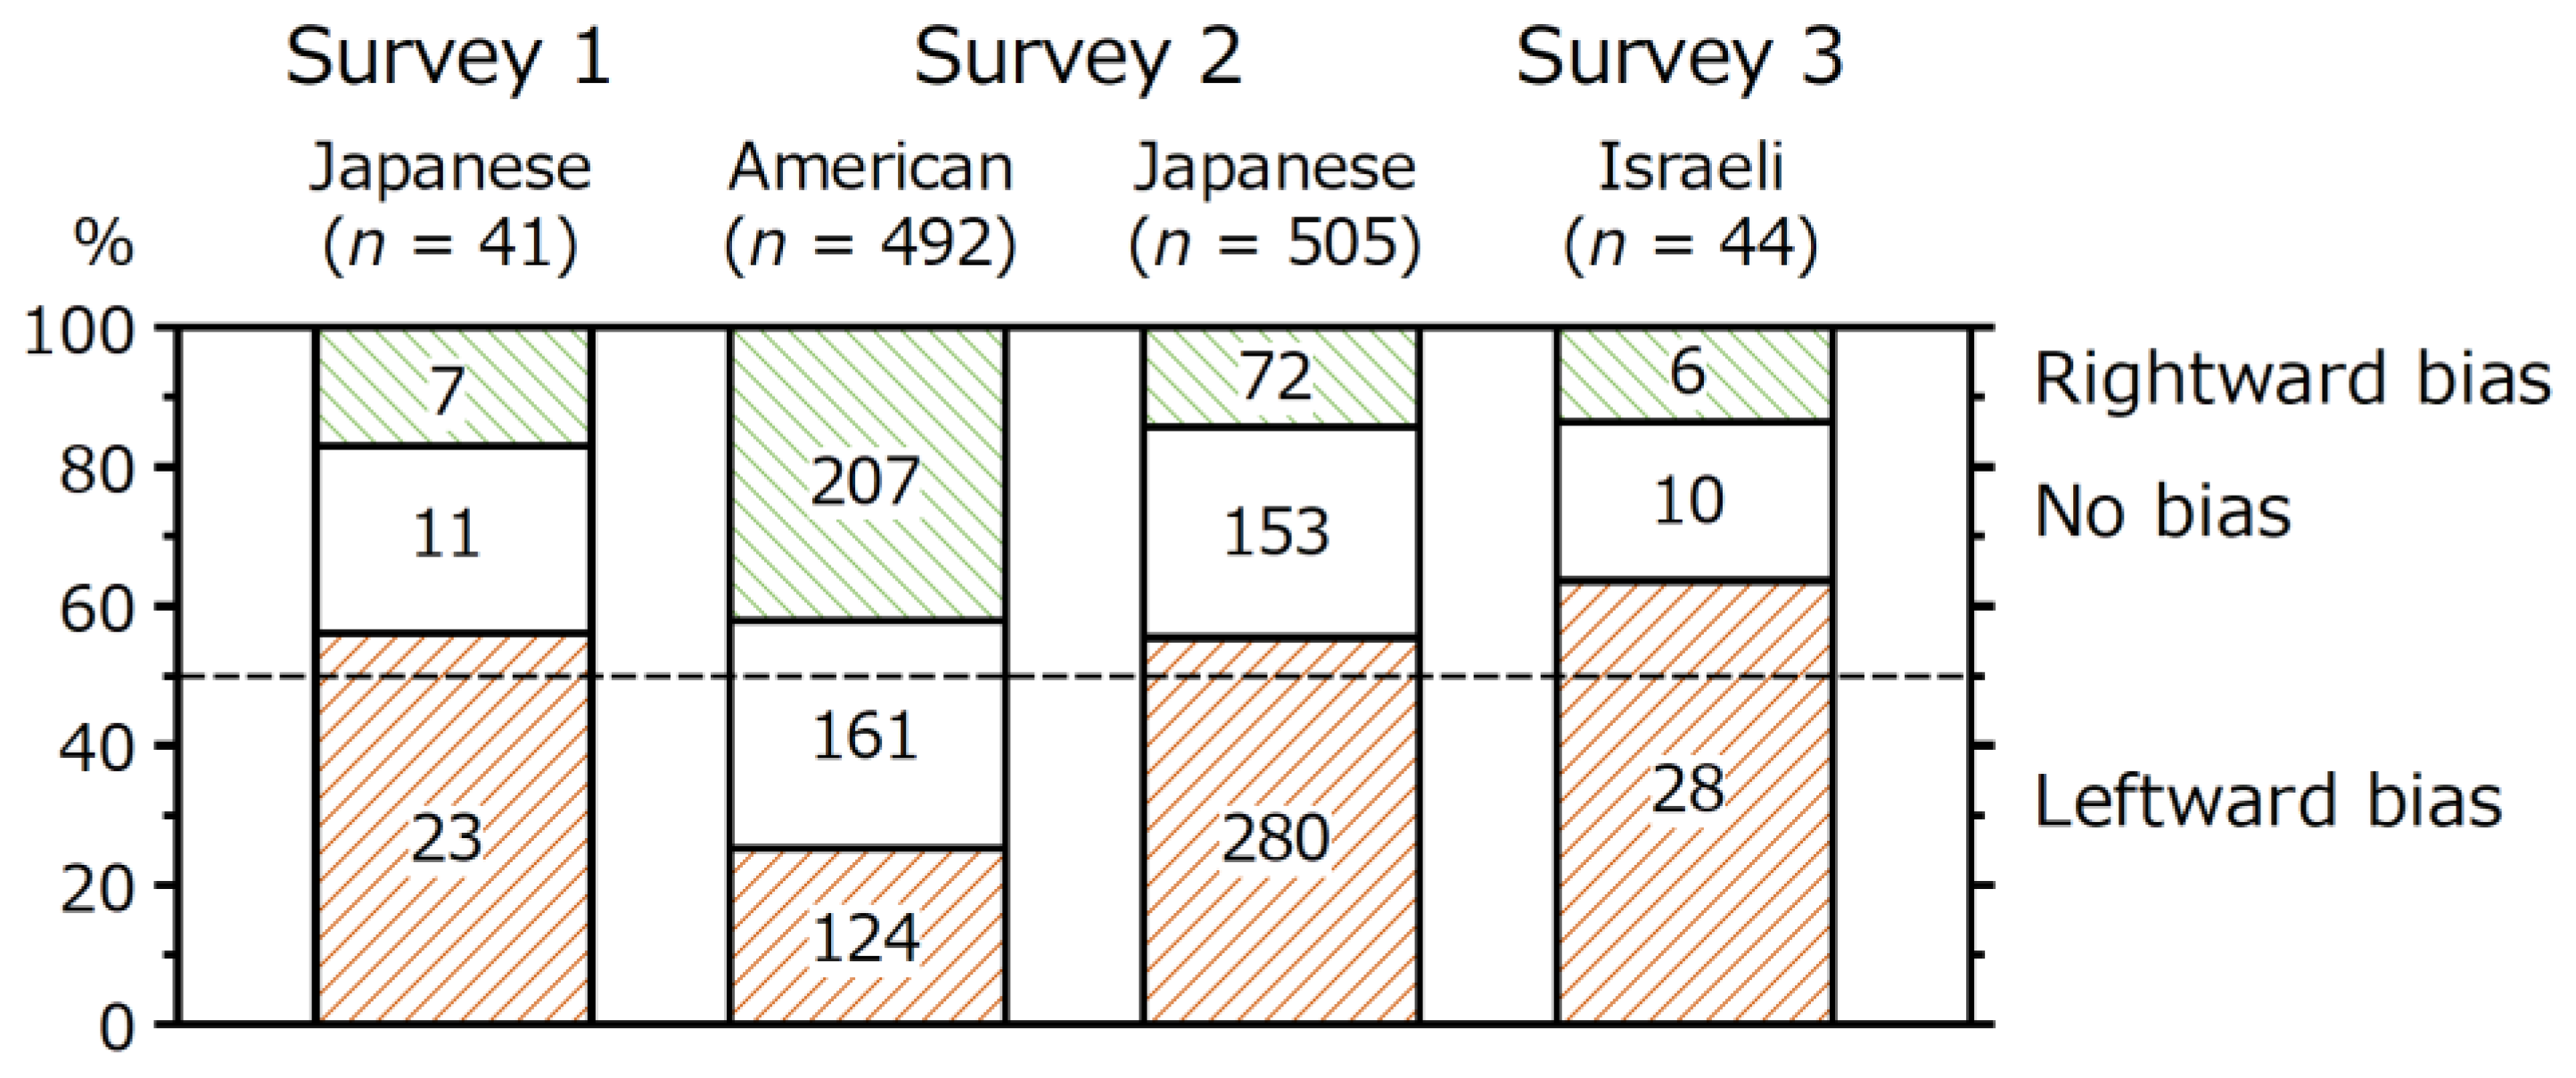
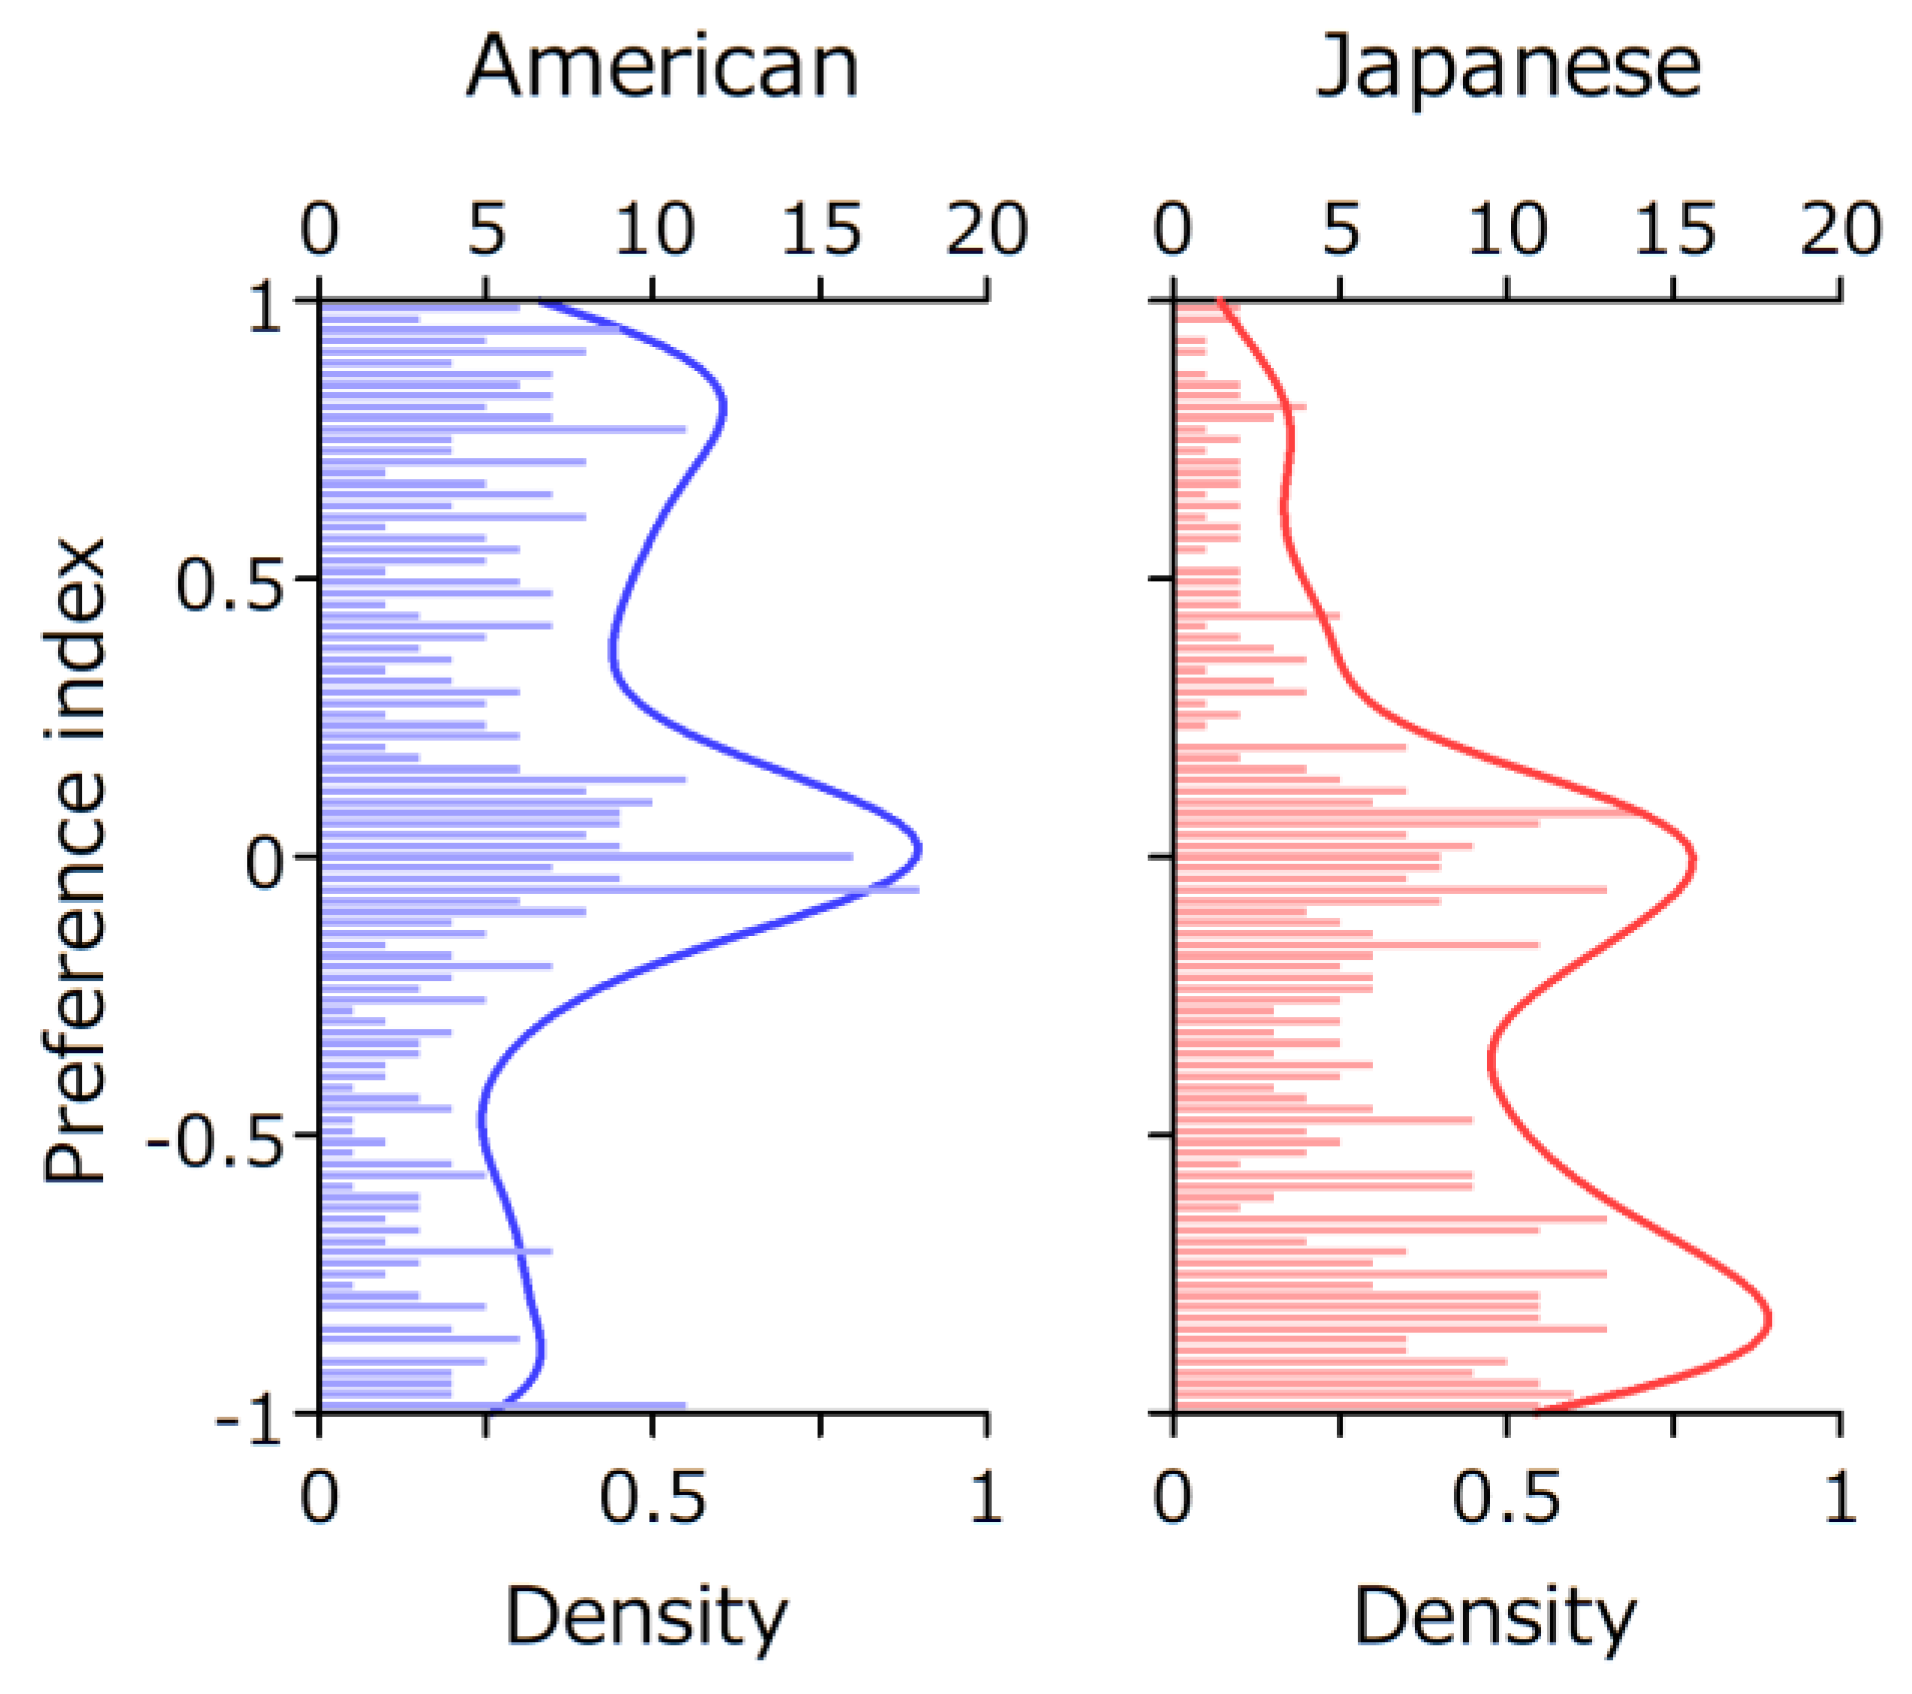
Figure 3 shows the proportions and numbers of the participants who showed a significant preference for left- or right-facing objects at the individual level. If the choice is random, the proportions of the participants with a leftward or rightward bias would be 2.5% each (two-tailed p < 0.05). However, more than two-thirds of the participants had a biased preference: 73% (30/41) of the Japanese participants in Survey 1; 67% (331/492) of the American participants and 70% (352/505) of the Japanese participants in Survey 2; and 77% (34/44) of the Israeli participants in Survey 3. Moreover, all groups included both types of people who showed a significant leftward bias and showed a significant rightward bias. For instance, although the Americans showed a rightward bias and the Japanese showed a leftward bias as a whole, there were also a considerable number of the Americans and Japanese who showed the opposite biases. This trend is also obvious in Figure 4, which shows the histograms of the mean preference index in Survey 2. The distribution was not unimodal; rather, there were three clusters of participants who showed a leftward, no, or rightward bias. The frequencies of the three clusters, shown in Figure 3, were compared between the groups by a chi-square test. Americans showed different proportions than Japanese (Survey 1), Japanese (Survey 2), and Israelis, X2s(2) = 19.40, 125.62, and 30.52, ps < 0.001, respectively. The groups, except for the Americans, did not differ between one other, X2s(2) < 1.28, ps > 0.52.
3.2. Additional Analyses
3.2.1. The Effect of Handedness
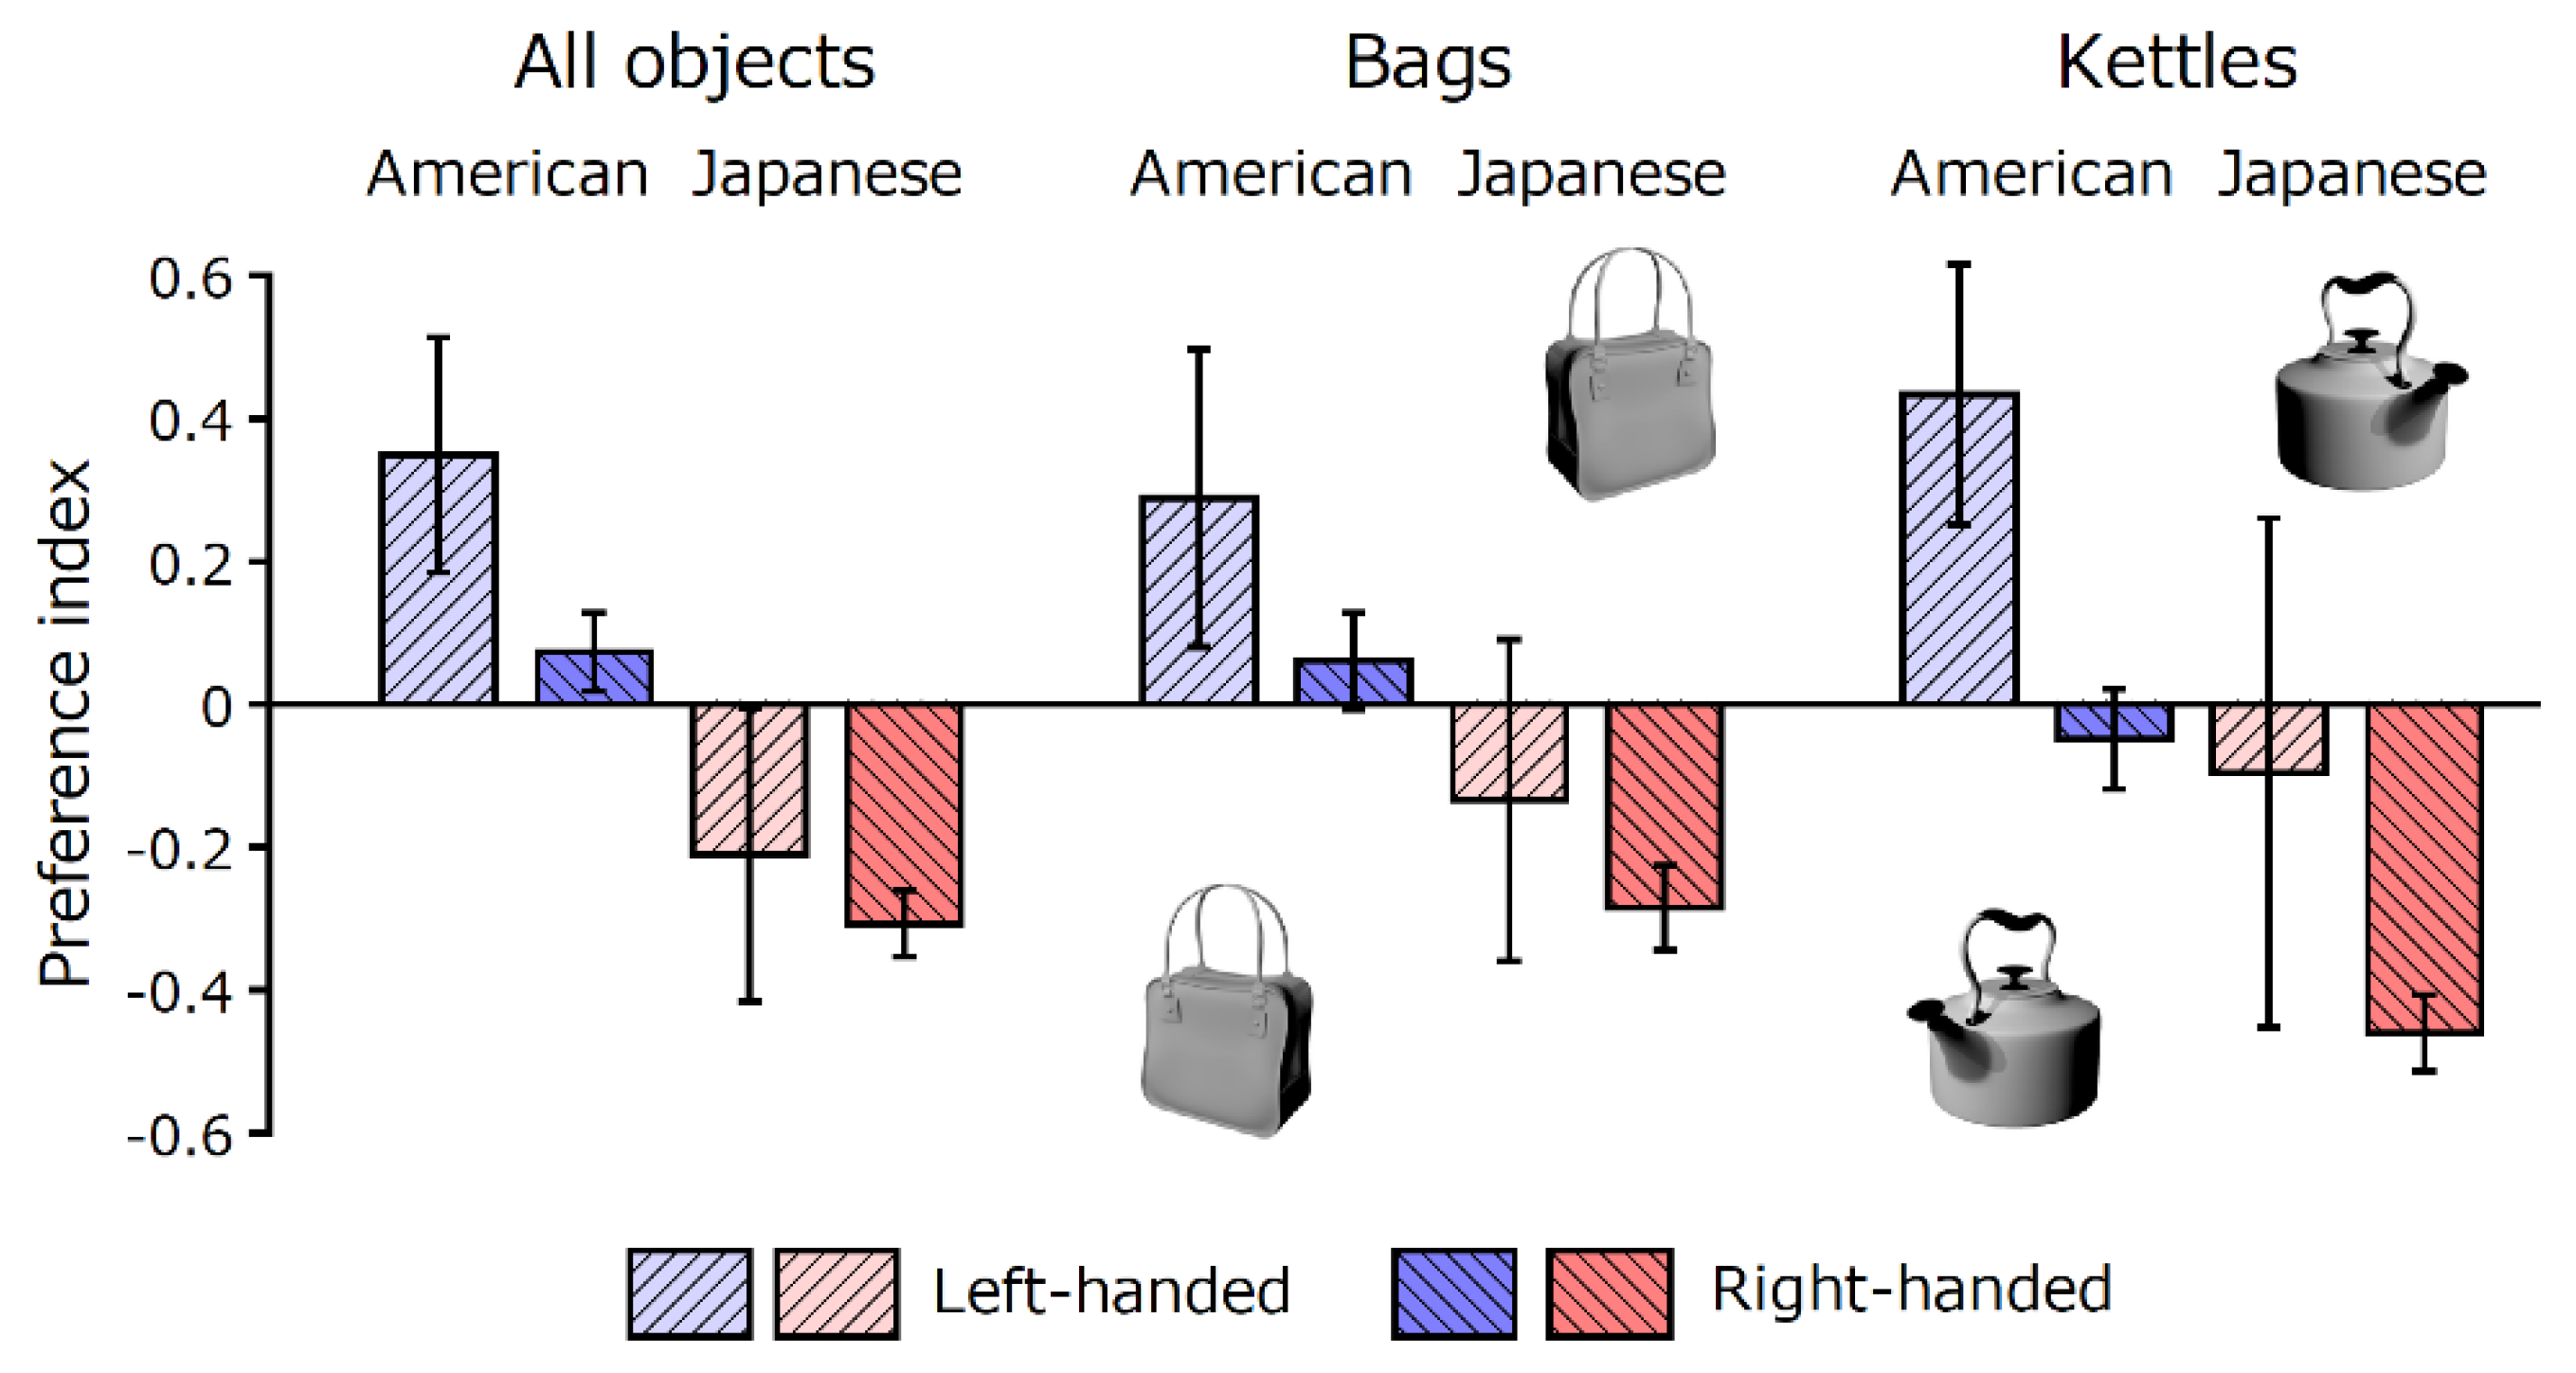
The left-handed and right-handed participants were extracted from the Survey 2 dataset. Mixed-handers were excluded from this analysis. Figure 5 shows the results. Left-handers showed a more positive preference index (i.e., a more rightward bias) than right-handers. For the mean preference index of all objects, an ANOVA shows the main effects of nationality and handedness, Fs(1, 941) = 47.16 and 7.38, p < 0.001 and p = 0.007, η2s = 0.047 and 0.007, respectively. The interaction effect was not significant, F(1, 941) = 1.72, p = 0.190, η2 = 0.002. Therefore, handedness affected the preference for facing directionality irrespective of nationality; left-handers preferred right-facing objects to left-facing objects when compared with right-handers. Simultaneously, the results showed that the effect size was smaller for the handedness factor than for the nationality factor. That is, only 0.7% of the total variance was explained by handedness, while 4.3% of the total variance was explained by nationality. The accounted variances by these factors were generally small, suggesting that individual differences were quite large in this two-alternative forced-choice task.
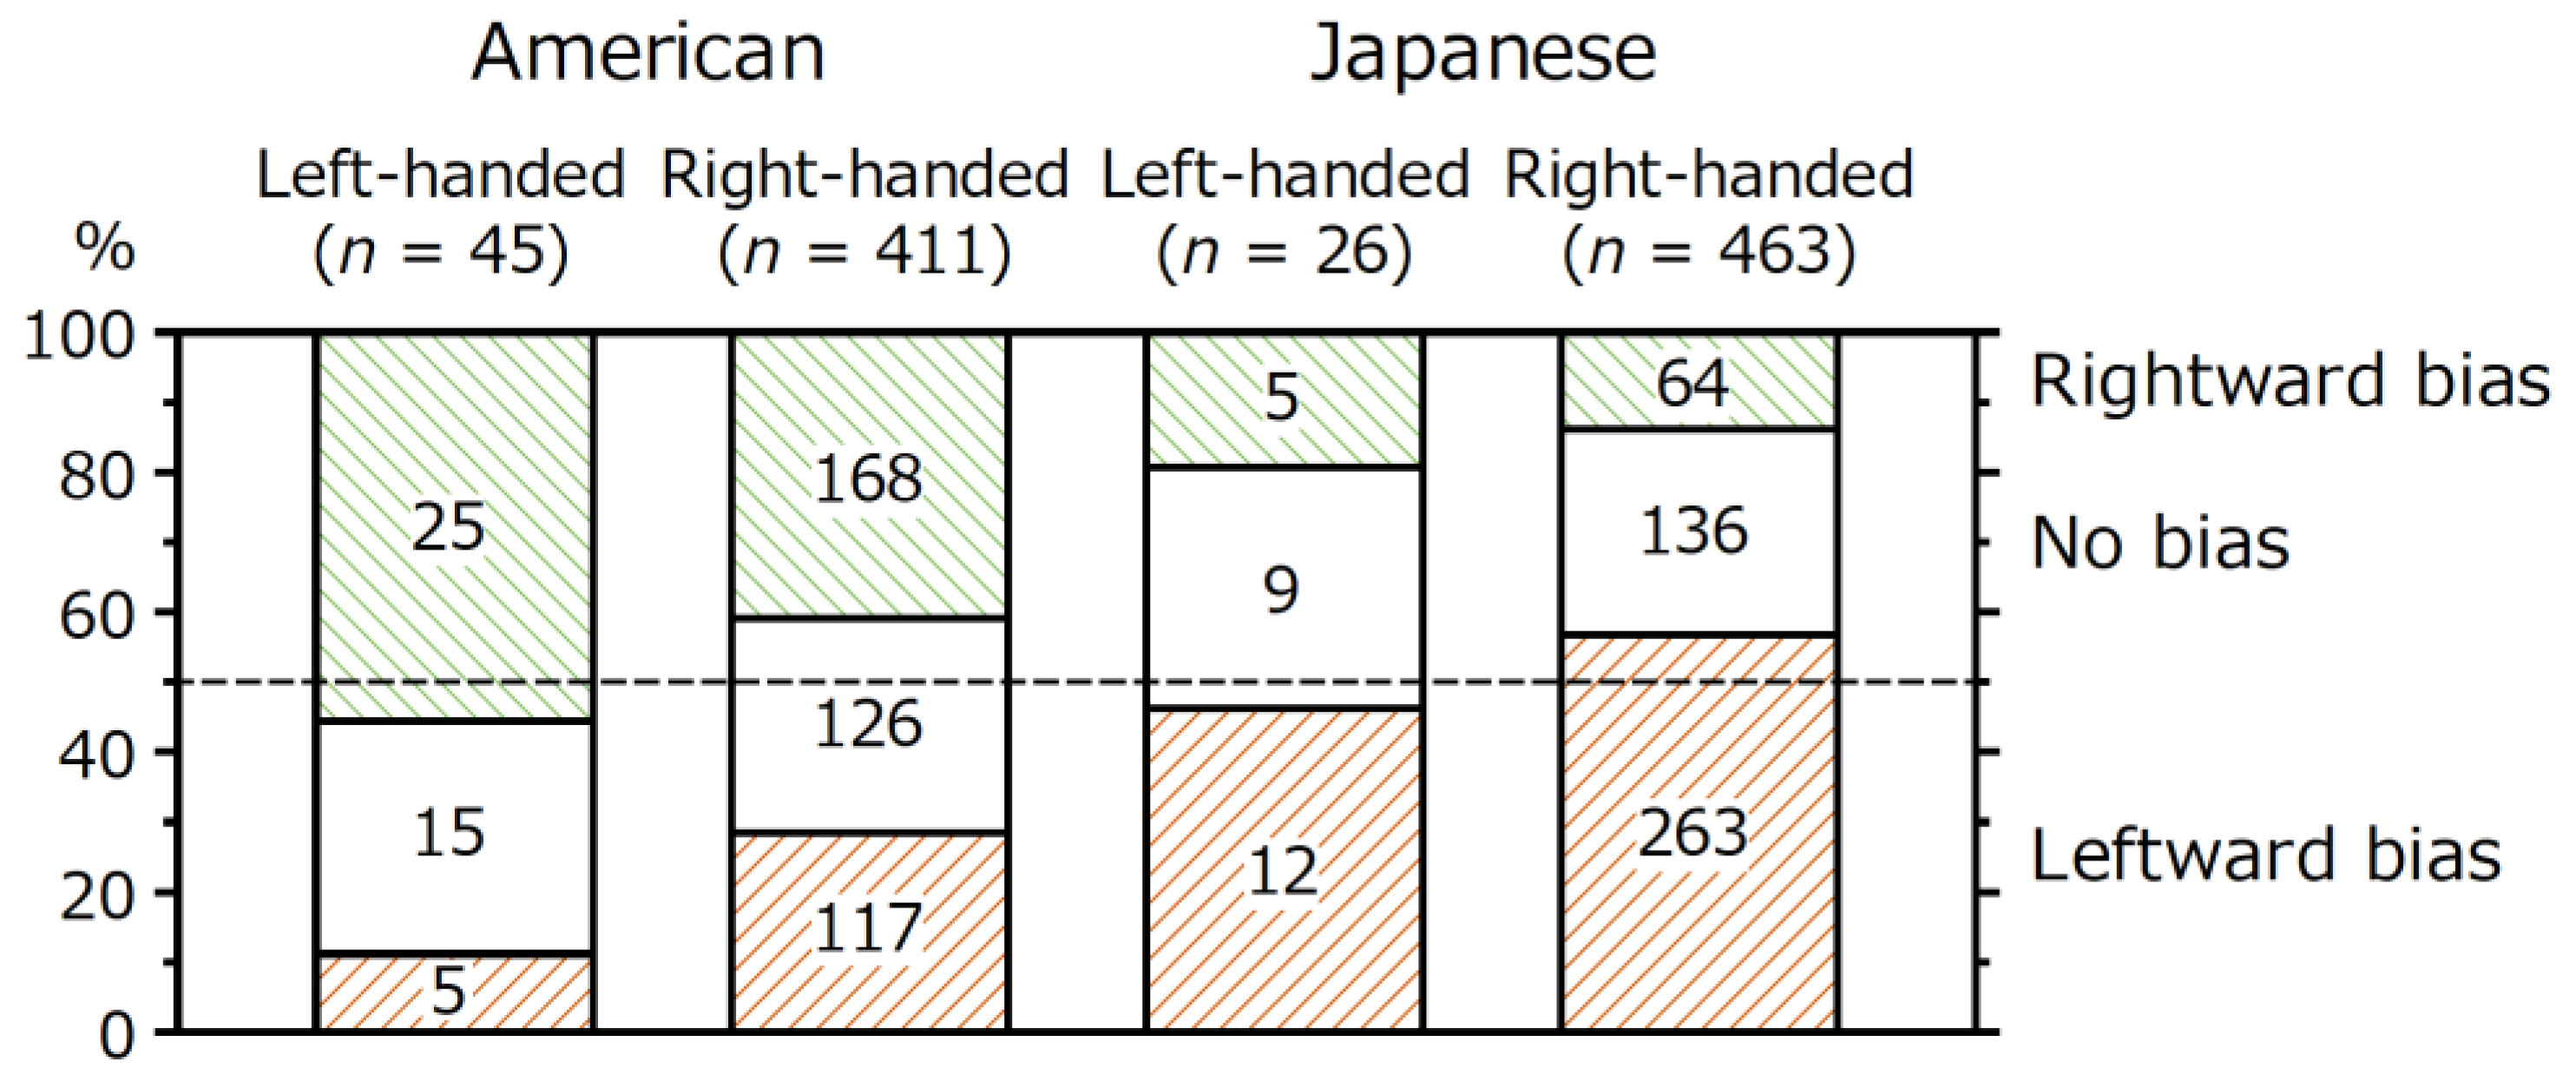
Figure 6 shows the proportions and numbers of left-and right-handed participants with a leftward, no, or rightward bias. The proportion of people with a rightward bias looks larger for left-handers than for right-handers, which is consistent with the analysis of the mean preference index described above. A chi-square test showed a significant difference in the proportions of the three clusters for the American, X2(2) = 6.73, p = 0.035, but not for the Japanese, X2(2) = 1.24, p = 0.539, participants. The latter null result appears to be because of a smaller number of left-handers in the Japanese sample.
3.2.2. The Interaction of Handedness and Object Functionality
Figure 5 also shows that the preference indexes of the four bags (i.e., items that the facing direction and the hand to grasp the item with were compatible) and the four kettles (i.e., items that the facing direction and the hand to grasp the item with were incompatible). A Nationality × Handedness × Item ANOVA showed the main effects of nationality and handedness, Fs(1, 941) = 34.64 and 17.76, ps < 0.001, η2s = 0.026 and 0.013, respectively. The results agree with the analysis of all 100 objects described above. The Handedness × Item interaction was also significant, F(1, 941) = 7.14, p = 0.008, η2 = 0.002. The other effects were not significant, ps > 0.327. Here, the significant interaction effect means that the effect of handedness differed between items, regardless of nationality. A closer look at Figure 5 suggests that the handedness effect was larger when the facing direction and the hand to grasp the item were incompatible (i.e., kettles) than when they were compatible (i.e., bags). When left-handers and right-handers were analyzed separately, the effect of the item was significant only for right-handers, F(1, 872) = 37.07, p < 0.001, η2 = 0.011, but not for left-handers, F(1, 69) = 1.42, p = 0.237, η2 = 0.004. For right-handers, the preference for left-facing objects was higher (i.e., the preference index was lower) when the handle of the object was easy to grasp with the dominant right hand (e.g., left-facing kettles, M = −0.25) than when the handle was graspable with the non-dominant left hand (e.g., left-facing bags, M = −0.11). Left-handers showed the opposite, though nonsignificant, trend; the preference for right-facing objects was higher when the handle was graspable with the dominant left hand (e.g., right-facing kettles, M = +0.17) than when the handle was graspable with the non-dominant right hand (e.g., right-facing bags, M = +0.08).
3.2.3. Object-Based Analysis
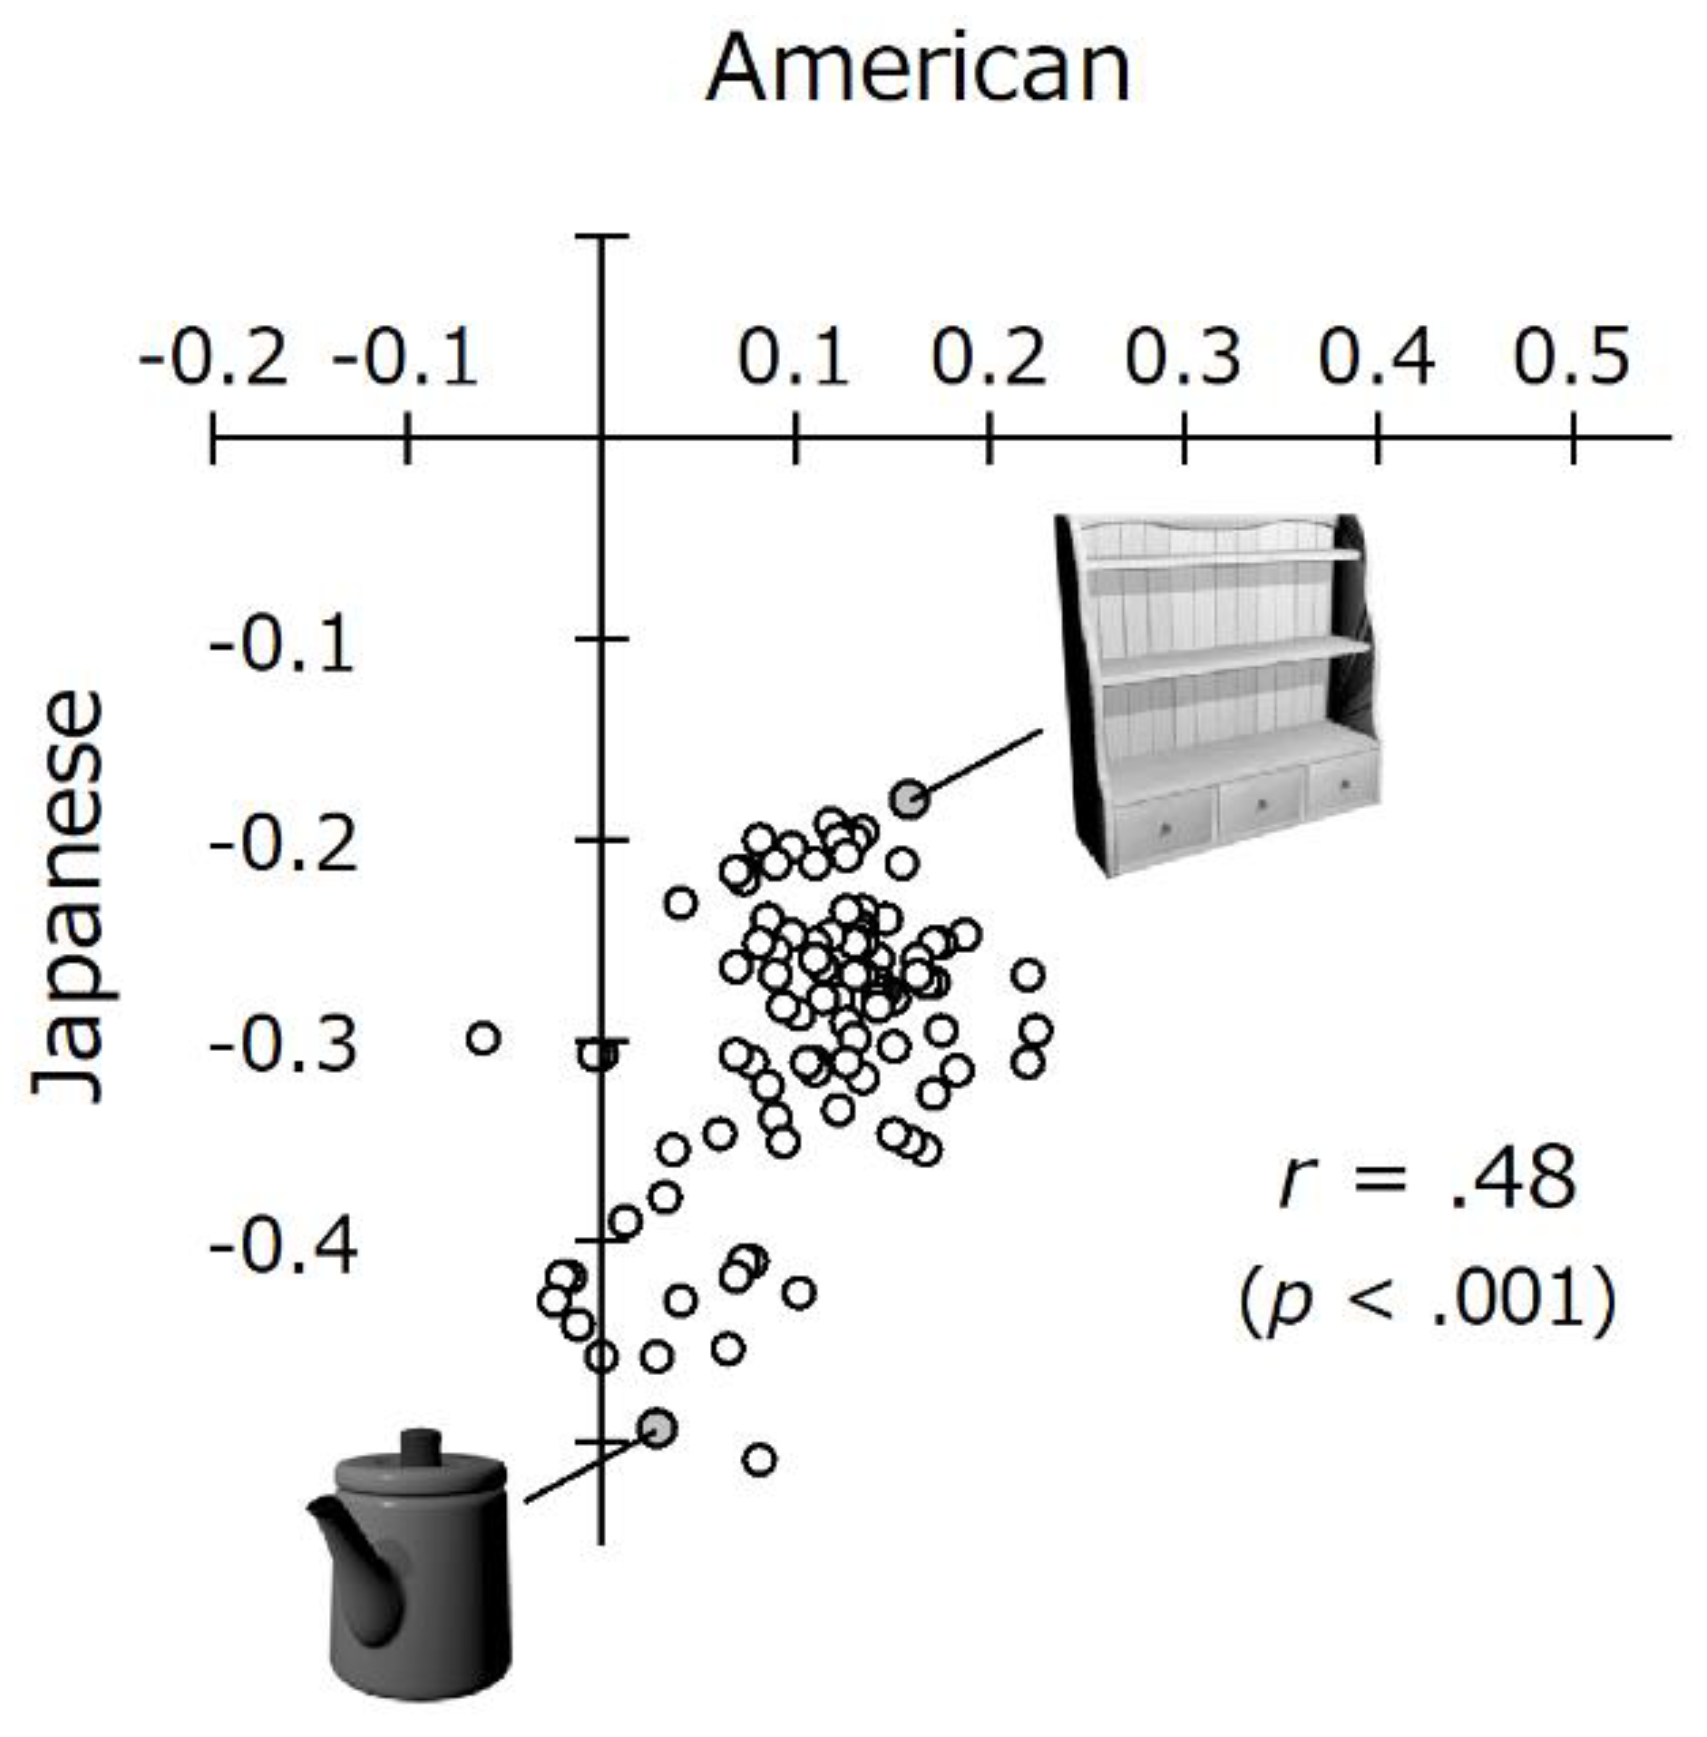
Figure 7 shows a scatter plot of the mean preference index of each object for the American and Japanese participants in Survey 2. For the American participants, most of the mean values were on the positive side (i.e., right-facing images were preferred). For the Japanese participants, all the mean values were below zero (i.e., left-facing images were preferred). There was a moderate positive correlation between the American and Japanese preference indexes (r = 0.48, df = 98, p < 0.001). This finding suggests that although the basic level of leftward or rightward preference was determined by culture, the preference of an object was determined by its attributes. There were both types of objects whose right-facing images were likely to be preferred and whose left-facing images were likely to be preferred, irrespective of culture.
4. Discussion
In the current study, the preferred facing direction of three-dimensional symmetric objects was examined in three online surveys (total N = 1082). The results showed that consistent with previous findings [7,8,10], clear cultural differences can be found: The Japanese and Israeli participants preferred a leftward direction, whereas the American participants preferred a rightward direction. The effects of handedness and object type were also found. Left-handers showed more rightward bias than right-handers, irrespective of culture. Moreover, the angle of an object whose handle was easy to grasp with the dominant hand was preferred over the opposite angle. However, these effects were much weaker than the cultural differences.
The present study demonstrates that cultural factors are the major determinant of the perceptual preference of the facing direction of three-dimensional objects. However, the proportion of variance accounted for by culture was small and only 4.7% in Survey 2. The histograms (Figure 4) show that a considerable number of individuals who had a strong leftward bias and who had a strong rightward bias exist in all groups, irrespective of culture. The large individual differences imply that the responses in this two-alternative forced-choice task are easily biased not only by culture, but also by other unspecified factors.
Although reading habits have been considered as a main cultural factor in directionality research [4,5,6,7,8,9,10], reading directions do not seem to explain the cultural differences, at least in this perceptual evaluation task. As mentioned in the Introduction section, if one’s reading direction enhances the preference for the facing direction that matches this habit, unidirectional English readers would show a larger bias than multidirectional Japanese readers. This was not the case. The absolute effect size (i.e., deviation from zero) was much larger for the Japanese participants (ds = −0.54 and −0.58 in Surveys 1 and 2, respectively) than for the American participants (d = +0.19). This tendency is consistent with the results of Ishii et al. [10], ds = −0.82 and +0.39 for Japanese and Australian individuals, respectively. The Israeli participants in Survey 3 also showed a strong leftward bias (d = −0.75), although all of them declared that they also read English.
At the object level, the relative rankings of directional preference among the 100 objects were similar (i.e., positively correlated) between the Japanese and American participants. This means that an object with a strong leftward preference bias in one culture tends to have a relatively more leftward bias in the other culture, too. This finding supports the idea that each culture has a base bias, either leftward or rightward, and the preference for a certain object is determined by its attributes. The interaction effect of handle position and dominant hand also supports that object attributes affect directional preference, regardless of culture.
Taking all these findings into account, it may be reasonable to assume that a leftward bias, rather than the rightward bias observed in English and French readers, is the basic disposition in the facing direction preference of static objects that do not imply any movement. Although this idea directly comes from the results of the present and previous studies [10] that Japanese and Israeli readers showed a stronger bias than English readers, it is supported by several lines of research in related fields. Three sources of evidence will be described below.
First, human faces tend to be depicted to be facing toward the left (i.e., showing the left cheek of the model) in drawings [20,21], paintings [22], and photographs [23,24,25], with exceptions in self-portraits done in the mirror [26,27], across cultures. Therefore, faces that turn to the left appear to be more familiar than faces in the opposite direction. Although this disposition has been replicated as a whole, which cheek is put forward is affected by various factors, including the model’s gender [22], professions [28,29], expressive intention [30,31], painter’s handedness [13,17,32], and reading habits [32,33]. Because faces are processed by specialized neural mechanisms, the findings on face processing may not be applicable to more general visual processing [34,35].
Second, the overall impression of a stimulus tends to be determined by the left side of the stimulus [16,36,37]. In experiments using chimeric faces (e.g., one-half of the face is smiling and the other half is neutral), people are likely to choose the faces whose left side was smiling as a happier face [15,37,38]. This leftward bias has been discussed in connection with cerebral laterality or hemispheric functional asymmetry. Research has shown that left oblique faces are recognized faster than right oblique faces [39]. Given that attention is directed more easily to the left hemifield than to the right hemifield [14,15], faces and objects would be processed more efficiently when their front side (presumably the main part) is turned to the left than right side [16]. This leftward bias is shown to be more prominent in left-to-right (Hindi) readers than in right-to-left (Arabic or Urdu) readers or in illiterates [40].
Third, people tend to assume that a light source is located at their upper left [41,42,43,44]. An object is usually lit from its front to make it more clearly visible, as in the stimulus images used in the current study. Therefore, left-facing objects lit from the left should be more consistent with one’s assumption of the light source than right-facing objects lit from the right. In fact, Smith and Elias [45] reported that people showed a preference for left-lit photographs with a clear light source originating from the upper left quadrant over its mirror-images and that the leftward bias was larger for left-to-right readers than for right-to-left readers.
These pieces of evidence suggest that even for left-to-right readers, a leftward bias would be a default disposition in the facing direction preference of static objects. However, contradictory evidence has also been obtained. Treiman and Allaith [46] reported that children whose native language was Arabic (right-to-left readers) showed a rightward bias and preferred right-facing objects over left-facing objects, which is the direct opposite of other findings using the same task [7,8]. Boiteau et al. [47] examined the paintings of humans and animals on rocks in southern Africa created by a culture without a written language. They reported that regions with a rightward bias outnumbered regions with a leftward bias, although the absolute number of left-facing figures was nonsignificantly larger than that of right-facing figures. Although these findings also cast questions on the role of reading habits in the directional preference of objects, the precise mechanism of determining the preferred facing direction in each culture remains unclear. If stimuli are objects that imply a movement (e.g., arrows), the reading direction may affect the preference. However, when using stationary objects, the preference seems to be determined by other factors.
One possibility is that the definition of view goodness differs across cultures. For instance, Western culture often values symmetry as an aesthetic standard [48], whereas the Japanese culture appreciates asymmetry, as typically shown in Japanese rock gardens [49]. The preference for symmetry is also influenced by education and training on aesthetic appreciation [50]. Levy [15] hypothesized that people tend to compensate for the leftward attentional bias because of cerebral laterality by putting weight on the right side. When seeing a landscape, English, Japanese, and Taiwanese readers alike prefer a landscape in which the focus of interest is on the right side [8,10,12]. However, when it comes to single static objects, Western people (particularly, non-experts in art [50]) may tend to restore the balance between the left and right sides of the object by focusing more on the unattended right side, whereas Japanese and other Asian people may leave the imbalance as it is. In connection to this, Blanz et al. [1] reported that German participants did not show any leftward or rightward bias when asked to take the best picture of an object, but showed a leftward bias when they were asked to express their natural mental image of the object. Therefore, the choice of the view angle may be affected by task requirements. If other types of questions, such as “looks more natural” or “fits more with your conceived image” rather than “looks better” are used, different results may be obtained. Japanese and Israeli individuals may choose the image that is more consistent with their intuitive image of the object when they are asked to choose the member that looks better.
Left-handers had more rightward bias than right-handers, irrespective of culture. Nachson et al. [7] reported that non-right-handed subjects showed more rightward preference than right-handed subjects, irrespective of reading direction, at least for some types of stimuli (but see [9] for the opposite trend in French readers). The present results are generally consistent with the literature that left-handers have a weaker tendency to process visuospatial information predominantly in the right hemisphere [15,36]. The finding that the angle of an object whose handle was easily graspable was preferred over the opposite angle is consistent with the previous finding in the drawing task [17]. Blanz et al. [1] reported that German participants showed a preference for this functionally appropriate view in the mental image task, but not in the photography task. The correspondence between the dominant hand and the preferred angle of manipulative objects may be related to the concept of affordance [51], which may induce the automatic activation of motor-related brain regions [52]. Although the relationship between motor affordance and view goodness is not self-evident [53], the angle of an object whose handle is graspable may be preferred because it is a more familiar view than the opposite angle.
There are some limitations to this research. First, the present study dealt with monochrome images of single objects. If more complex images with multiple items are used, the results may change. For example, Taiwanese people showed no bias when more realistic pictures were used [12]. Second, it remains unclear if the observed bias can be generalized outside the two-alternative forced-choice task. For example, Niimi and Yokosawa [2] did not find any directional bias when an object was presented alone, and its evaluation was made using a 7-point scale. The directional bias might be very weak, or a special phenomenon observed only in the two-alternative forced-choice task in which an image and its mirror-reversed version are directly compared [54]. Third, the objects in this study were presented without any specific frame. Palmer et al. [55] showed that the preferred facing direction of a single object depended on its position in the rectangular frame. That is, the object that faced into rather than out of the frame was preferred (i.e., inward bias) [56]. It is worth examining whether this interactive effect of the facing direction and the position in the frame on aesthetic preference varies across cultures. Fourth, this study is purely descriptive and does not provide any process-based accounts. Further research is required to elucidate the underlying mechanisms. Among them, it is worth examining how consistent and stable one’s preference is across time and situation. Measuring the test-retest reliability of the preference index would be helpful to consider the basis of this preference. Another direction is to examine the effect of short-term experience on the preferred facing direction. If familiarity is a major determinant of view goodness [3], repeated exposure to objects with a certain facing direction would increase the likelihood of choosing the angle that is consistent with the preceding views [57].
In conclusion, the current study confirms that the preferred facing direction of a symmetrical stationary object displayed obliquely is influenced by cultural factors. The answer to the opening question, “Which side of a three-dimensional object looks better?” may be “it depends on the culture.” Handedness and the functionality of the object are also shown to affect the preference, but only slightly. In addition, the available evidence suggests that a left-facing view could be a standard angle of static objects, although it would not be called a “good” view.
Author Contributions
H.N. and H.S. conceived the study; H.S. created the stimulus images and conducted Survey 1; H.N. conducted Survey 2; S.L.-M. and H.N. conducted Survey 3; H.N. and K.M. analyzed the data; H.N. made figures and tables and wrote the text. All authors have read and agreed to the published version of the manuscript.
Funding
This research was partly supported by the contribution of KANKO GAKUSEIFUKU CO., LTD to H.N. The funder was not involved in any processes of this study and has no responsibility for the content of the paper.
Acknowledgments
The authors thank to Ken Matsuda and Ryosuke Niimi for their helpful comments on the interpretation of the results of Survey 1.
Conflicts of Interest
The authors declare no conflict of interest.
References
- Blanz, V.; Tarr, M.J.; Bülthoff, H.H. What object attributes determine canonical views? Perception 1999, 28, 575–599. [Google Scholar] [CrossRef] [PubMed] [Green Version]
- Niimi, R.; Yokosawa, K. Three-quarter views are subjectively good because object orientation is uncertain. Psychon. Bull. Rev. 2009, 16, 289–294. [Google Scholar] [CrossRef] [PubMed]
- Nonose, K.; Niimi, R.; Yokosawa, K. On the three-quarter view advantage of familiar object recognition. Psychol. Res. 2016, 80, 1030–1048. [Google Scholar] [CrossRef] [PubMed]
- Page, A.G.; McManus, C.; González, C.P.; Chahboun, S. Is beauty in the hand of the writer? Influences of aesthetic preferences through script directions, cultural, and neurological factors: A literature review. Front. Psychol. 2017, 8, 1325. [Google Scholar] [CrossRef] [Green Version]
- Kazandjian, S.; Chokron, S. Paying attention to reading direction. Nat. Rev. Neurosci. 2008, 9, 965. [Google Scholar] [CrossRef]
- Vaid, J. Asymmetries in representational drawing: Alternatives to a laterality account. In Spatial Dimensions of Social Thought; Schubert, T.W., Maass, A., Eds.; Walter de Gruyter: Berlin, Germany, 2011; pp. 231–256. ISBN 9783110254310. [Google Scholar]
- Nachson, I.; Argaman, E.; Luria, A. Effects of directional habits and handedness on aesthetic preference for left and right profiles. J. Cross. Cult. Psychol. 1999, 30, 106–114. [Google Scholar] [CrossRef]
- Chokron, S.; De Agostini, M. Reading habits influence aesthetic preference. Cogn. Brain Res. 2000, 10, 45–49. [Google Scholar] [CrossRef]
- De Agostini, M.; Kazandjian, S.; Lellouch, J.; Chokron, S. Visual aesthetic preference: Effects of handedness, sex, and age-related reading/writing directional scanning experience. Writ. Syst. Res. 2010, 2, 77–85. [Google Scholar] [CrossRef] [Green Version]
- Ishii, Y.; Okubo, M.; Nicholls, M.E.R.; Imai, H. Lateral biases and reading direction: A dissociation between aesthetic preference and line bisection. Brain Cogn. 2011, 75, 242–247. [Google Scholar] [CrossRef]
- Cabinet Secretariat of Japan. Koyobun Sakusei no Yoryo (Procedure for Writing Official Documents). 1952. Available online: https://www.bunka.go.jp/kokugo_nihongo/sisaku/joho/joho/kijun/sanko/koyobun/index.html (accessed on 18 September 2020).
- Liu, C.H.; Lee, C.F.; Lee, H.L. Reading habits infuence aesthetic preference: Exploring the association between theory and practice. J. Internet Technol. 2016, 17, 93–97. [Google Scholar] [CrossRef]
- Alter, I. A cerebral origin for “directionality”. Neuropsychologia 1989, 27, 563–573. [Google Scholar] [CrossRef]
- Nicholls, M.E.R.; Bradshaw, J.L.; Mattingley, J.B. Free-viewing perceptual asymmetries for the judgement of brightness, numerosity and size. Neuropsychologia 1999, 37, 307–314. [Google Scholar] [CrossRef]
- Levy, J. Lateral dominance and aesthetic preference. Neuropsychologia 1976, 14, 431–445. [Google Scholar] [CrossRef]
- Rodway, P.; Schepman, A.; Crossley, B.; Lee, J. A leftward perceptual asymmetry when judging the attractiveness of visual patterns. Laterality 2019, 24, 1–25. [Google Scholar] [CrossRef]
- Karev, G.B. Directionality in right, mixed and left handers. Cortex 1999, 35, 423–431. [Google Scholar] [CrossRef]
- Nicholls, M.E.R.; Thomas, N.A.; Loetscher, T.; Grimshaw, G.M. The Flinders Handedness survey (FLANDERS): A brief measure of skilled hand preference. Cortex 2013, 49, 2914–2926. [Google Scholar] [CrossRef] [PubMed]
- Okubo, M.; Suzuki, H.; Nicholls, M.E.R. A Japanese version of the FLANDERS handedness questionnaire. Jpn. J. Psychol. 2014, 85, 474–481. [Google Scholar] [CrossRef] [Green Version]
- Jensen, B.T. Left-right orientation in profile drawing. Am. J. Psychol. 1952, 65, 80–83. [Google Scholar] [CrossRef]
- Jensen, B.T. Reading habits and left-right orientation in profile drawings by Japanese children. Am. J. Psychol. 1952, 65, 306–307. [Google Scholar] [CrossRef]
- McManus, I.C.; Humphrey, N.K. Turning the left cheek. Nature 1973, 243, 271–272. [Google Scholar] [CrossRef]
- Bruno, N.; Bertamini, M.; Protti, F. Selfie and the city: A world-wide, large and ecologically valid database reveals a two-pronged side bias in naïve self-portraits. PLoS ONE 2015, 10, e0124999. [Google Scholar] [CrossRef] [PubMed]
- Lindell, A.K. Consistently showing your best side? Intra-individual consistency in #selfie pose orientation. Front. Psychol. 2017, 8, 246. [Google Scholar] [CrossRef] [PubMed] [Green Version]
- Manovich, L.; Ferrari, V.; Bruno, N. Selfie-takers prefer left cheeks: Converging evidence from the (extended) selfiecity database. Front. Psychol. 2017, 8, 1460. [Google Scholar] [CrossRef] [PubMed] [Green Version]
- Latto, R. Turning the other cheek: Profile direction in self-portraiture. Empir. Stud. Arts 1996, 14, 89–98. [Google Scholar] [CrossRef]
- Humphrey, N.K.; McManus, C. Status and the left cheek. New Sci. 1973, 59, 437–439. [Google Scholar]
- Churches, O.; Callahan, R.; Michalski, D.; Brewer, N.; Turner, E.; Keage, H.A.D.; Thomas, N.A.; Nicholls, M.E.R. How academics face the world: A study of 5829 homepage pictures. PLoS ONE 2012, 7, e38940. [Google Scholar] [CrossRef] [Green Version]
- ten Cate, C. Posing as professor: Laterality in posing orientation for portraits of scientists. J. Nonverbal Behav. 2002, 26, 175–192. [Google Scholar] [CrossRef]
- Lindell, A.K. The silent social/emotional signals in left and right cheek poses: A literature review. Laterality 2013, 18, 612–624. [Google Scholar] [CrossRef]
- Nicholls, M.E.R.; Clode, D.; Wood, S.J.; Wood, A.G. Laterality of expression in portraiture: Putting your best cheek forward. Proc. R. Soc. B Biol. Sci. 1999, 266, 1517–1522. [Google Scholar] [CrossRef] [Green Version]
- Tosun, S.; Vaid, J. What affects facing direction in human facial profile drawing? A meta-analytic inquiry. Perception 2014, 43, 1377–1392. [Google Scholar] [CrossRef]
- Pérez González, C. Lateral organisation in nineteenth-century studio photographs is influenced by the direction of writing: A comparison of Iranian and Spanish photographs. Laterality 2012, 17, 515–532. [Google Scholar] [CrossRef] [PubMed]
- Freiwald, W.; Duchaine, B.; Yovel, G. Face processing systems: From neurons to real-world social perception. Annu. Rev. Neurosci. 2016, 39, 325–346. [Google Scholar] [CrossRef] [PubMed] [Green Version]
- Kanwisher, N. Functional specificity in the human brain: A window into the functional architecture of the mind. Proc. Natl. Acad. Sci. USA 2010, 107, 11163–11170. [Google Scholar] [CrossRef] [PubMed] [Green Version]
- Levy, J.; Heller, W.; Banich, M.T.; Burton, L.A. Asymmetry of perception in free viewing of chimeric faces. Brain Cogn. 1983, 2, 404–419. [Google Scholar] [CrossRef] [PubMed]
- Worley, M.M.; Boles, D.B. The face is the thing: Faces, not emotions, are responsible for chimeric perceptual asymmetry. Laterality 2016, 21, 672–688. [Google Scholar] [CrossRef] [PubMed]
- Bourne, V.J. How are emotions lateralised in the brain? Contrasting existing hypotheses using the Chimeric Faces Test. Cogn. Emot. 2010, 24, 903–911. [Google Scholar] [CrossRef]
- Yamamoto, M.; Kowatari, Y.; Ueno, S.; Yamane, S.; Kitazawa, S. Accelerated recognition of left oblique views of faces. Exp. Brain Res. 2005, 161, 27–33. [Google Scholar] [CrossRef]
- Vaid, J.; Singh, M. Asymmetries in the perception of facial affect: Is there an influence of reading habits? Neuropsychologia 1989, 27, 1277–1287. [Google Scholar] [CrossRef]
- Elias, L.J.; Robinson, B.M. Lateral biases in assumptions of lighting position. Brain Cogn. 2005, 59, 303–305. [Google Scholar] [CrossRef]
- Mamassian, P.; Goutcher, R. Prior knowledge on the illumination position. Cognition 2001, 81, B1–B9. [Google Scholar] [CrossRef]
- Sun, J.; Perona, P. Where is the sun? Nat. Neurosci. 1998, 1, 183–184. [Google Scholar] [CrossRef] [PubMed]
- McManus, I.C.; Buckman, J.; Woolley, E. Is light in pictures presumed to come from the left side? Perception 2004, 33, 1421–1436. [Google Scholar] [CrossRef] [PubMed] [Green Version]
- Smith, A.K.; Elias, L.J. Native reading direction and corresponding preferences for left- or right-lit images. Percept. Mot. Skills 2013, 116, 355–367. [Google Scholar] [CrossRef] [PubMed]
- Treiman, R.; Allaith, Z. Do reading habits influence aesthetic preferences? Read. Writ. 2013, 26, 1381–1386. [Google Scholar] [CrossRef]
- Boiteau, T.W.; Smith, C.; Almor, A. Rightward directional bias in art produced by cultures without a written language. Laterality 2020, 25, 165–176. [Google Scholar] [CrossRef]
- Jacobsen, T. Beauty and the brain: Culture, history and individual differences in aesthetic appreciation. J. Anat. 2010, 216, 184–191. [Google Scholar] [CrossRef]
- Van Tonder, G.J.; Lyons, M.J. Visual perception in Japanese rock garden design. Axiomathes 2005, 15, 353–371. [Google Scholar] [CrossRef]
- Leder, H.; Tinio, P.P.L.; Brieber, D.; Kröner, T.; Jacobsen, T.; Rosenberg, R. Symmetry is not a universal law of beauty. Empir. Stud. Arts 2018, 37, 104–114. [Google Scholar] [CrossRef] [Green Version]
- Gibson, J.J. The Ecological Approach to Visual Perception; Houghton Mifflin: Boston, MA, USA, 1979. [Google Scholar]
- Proverbio, A.M.; Adorni, R.; D’Aniello, G.E. 250 ms to code for action affordance during observation of manipulable objects. Neuropsychologia 2011, 49, 2711–2717. [Google Scholar] [CrossRef]
- Righi, S.; Orlando, V.; Marzi, T. Attractiveness and affordance shape tools neural coding: Insight from ERPs. Int. J. Psychophysiol. 2014, 91, 240–253. [Google Scholar] [CrossRef]
- Chahboun, S.; Flumini, A.; Pérez González, C.; McManus, I.C.; Santiago, J. Reading and writing direction effects on the aesthetic appreciation of photographs. Laterality 2017, 22, 313–339. [Google Scholar] [CrossRef] [PubMed]
- Palmer, S.E.; Gardner, J.S.; Wickens, T.D. Aesthetic issues in spatial composition: Effects of position and direction on framing single objects. Spat. Vis. 2008, 21, 421–449. [Google Scholar] [CrossRef] [PubMed] [Green Version]
- Bertamini, M.; Bennett, K.M.; Bode, C. The anterior bias in visual art: The case of images of animals. Laterality 2011, 16, 673–689. [Google Scholar] [CrossRef] [PubMed] [Green Version]
- Zajonc, R.B. Attitudinal effects of mere exposure. J. Pers. Soc. Psychol. 1968, 9, 1–27. [Google Scholar] [CrossRef] [Green Version]
Figure 1.
Sample images. Respondents were asked to choose the image that looked better from each of 100 objects.
Figure 1.
Sample images. Respondents were asked to choose the image that looked better from each of 100 objects.

Figure 2.
The mean preference index of each group. The positive value means that right-facing images were chosen more frequently than left-facing images among the 100 object pairs. The error bars indicate 95% confidence intervals.
Figure 2.
The mean preference index of each group. The positive value means that right-facing images were chosen more frequently than left-facing images among the 100 object pairs. The error bars indicate 95% confidence intervals.

Figure 3.
The proportions and numbers of the participants who showed a significantly biased rightward or leftward preference. According to a binominal distribution, those who chose left- or right-facing images 61 times or more (preference index ≤−0.22 or ≥+0.22) were regarded as people with a leftward or rightward bias, respectively (two-tailed p < 0.05).

Figure 4.
Histograms of the mean preference index of the American and Japanese participants in Survey 2. Kernel density curves (gaussian function, bandwidth = 0.05) are shown.
Figure 4.
Histograms of the mean preference index of the American and Japanese participants in Survey 2. Kernel density curves (gaussian function, bandwidth = 0.05) are shown.

Figure 5.
The effect of handedness on the mean preference index of Americans and Japanese people in Survey 2. Left-handers showed a more rightward bias than right-handers. This effect interacted with the functionality of the object. Left-handers preferred the angle at which an object was graspable with the left hand (e.g., right-facing kettles), whereas right-handers preferred the angle at which an object was graspable with the right hand (e.g., left-facing kettles). The error bars indicate 95% confidence intervals.

Figure 6.
The proportions and numbers of participants who showed a significantly biased rightward or leftward preference. Compared with those of right-handers, in left-handers, the proportion of people with a rightward bias was larger, and the proportion of people with a leftward bias was smaller.
Figure 6.
The proportions and numbers of participants who showed a significantly biased rightward or leftward preference. Compared with those of right-handers, in left-handers, the proportion of people with a rightward bias was larger, and the proportion of people with a leftward bias was smaller.

Figure 7.
Object-based analysis of Survey 2. Each circle corresponds to the mean preference index of each of the 100 objects. As examples, the object with the highest rightward preference (a locker) and the object with the highest leftward preference (a teapot) are shown.
Figure 7.
Object-based analysis of Survey 2. Each circle corresponds to the mean preference index of each of the 100 objects. As examples, the object with the highest rightward preference (a locker) and the object with the highest leftward preference (a teapot) are shown.


Table 1.
The number of respondents in each survey.
| Survey | Sample | Total | Male | Female | ||||||
|---|---|---|---|---|---|---|---|---|---|---|
| LH | MH | RH | LH | MH | RH | LH | MH | RH | ||
| 1 | Japanese (n = 41) | 0 | 2 | 39 | 0 | 0 | 5 | 0 | 2 | 34 |
| 2a | American (n = 492) | 45 | 36 | 411 | 27 | 23 | 218 | 18 | 13 | 193 |
| 2b | Japanese (n = 505) | 26 | 16 | 463 1 | 8 | 6 | 173 | 18 | 10 | 288 |
| 3 | Israeli (n = 44) | 8 | 1 | 35 | 4 | 1 | 10 | 4 | 0 | 25 |
1 Two transgender individuals are included. LH, left-handed; MH, mixed-handed; RH, right-handed.
© 2020 by the authors. Licensee MDPI, Basel, Switzerland. This article is an open access article distributed under the terms and conditions of the Creative Commons Attribution (CC BY) license (http://creativecommons.org/licenses/by/4.0/).
Share and Cite
MDPI and ACS Style
Nittono, H.; Shibata, H.; Mizuhara, K.; Lieber-Milo, S. Which Side Looks Better? Cultural Differences in Preference for Left- or Right-Facing Objects. Symmetry 2020, 12, 1658. https://doi.org/10.3390/sym12101658
AMA Style
Nittono H, Shibata H, Mizuhara K, Lieber-Milo S. Which Side Looks Better? Cultural Differences in Preference for Left- or Right-Facing Objects. Symmetry. 2020; 12(10):1658. https://doi.org/10.3390/sym12101658
Chicago/Turabian StyleNittono, Hiroshi, Haruka Shibata, Keita Mizuhara, and Shiri Lieber-Milo. 2020. "Which Side Looks Better? Cultural Differences in Preference for Left- or Right-Facing Objects" Symmetry 12, no. 10: 1658. https://doi.org/10.3390/sym12101658
Note that from the first issue of 2016, this journal uses article numbers instead of page numbers. See further details here.