
Design and Preliminary Validation of Individual Customized Insole for Adults with Flexible Flatfeet Based on the Plantar Pressure Redistribution


Abstract
:1. Introduction
2. Materials and Methods
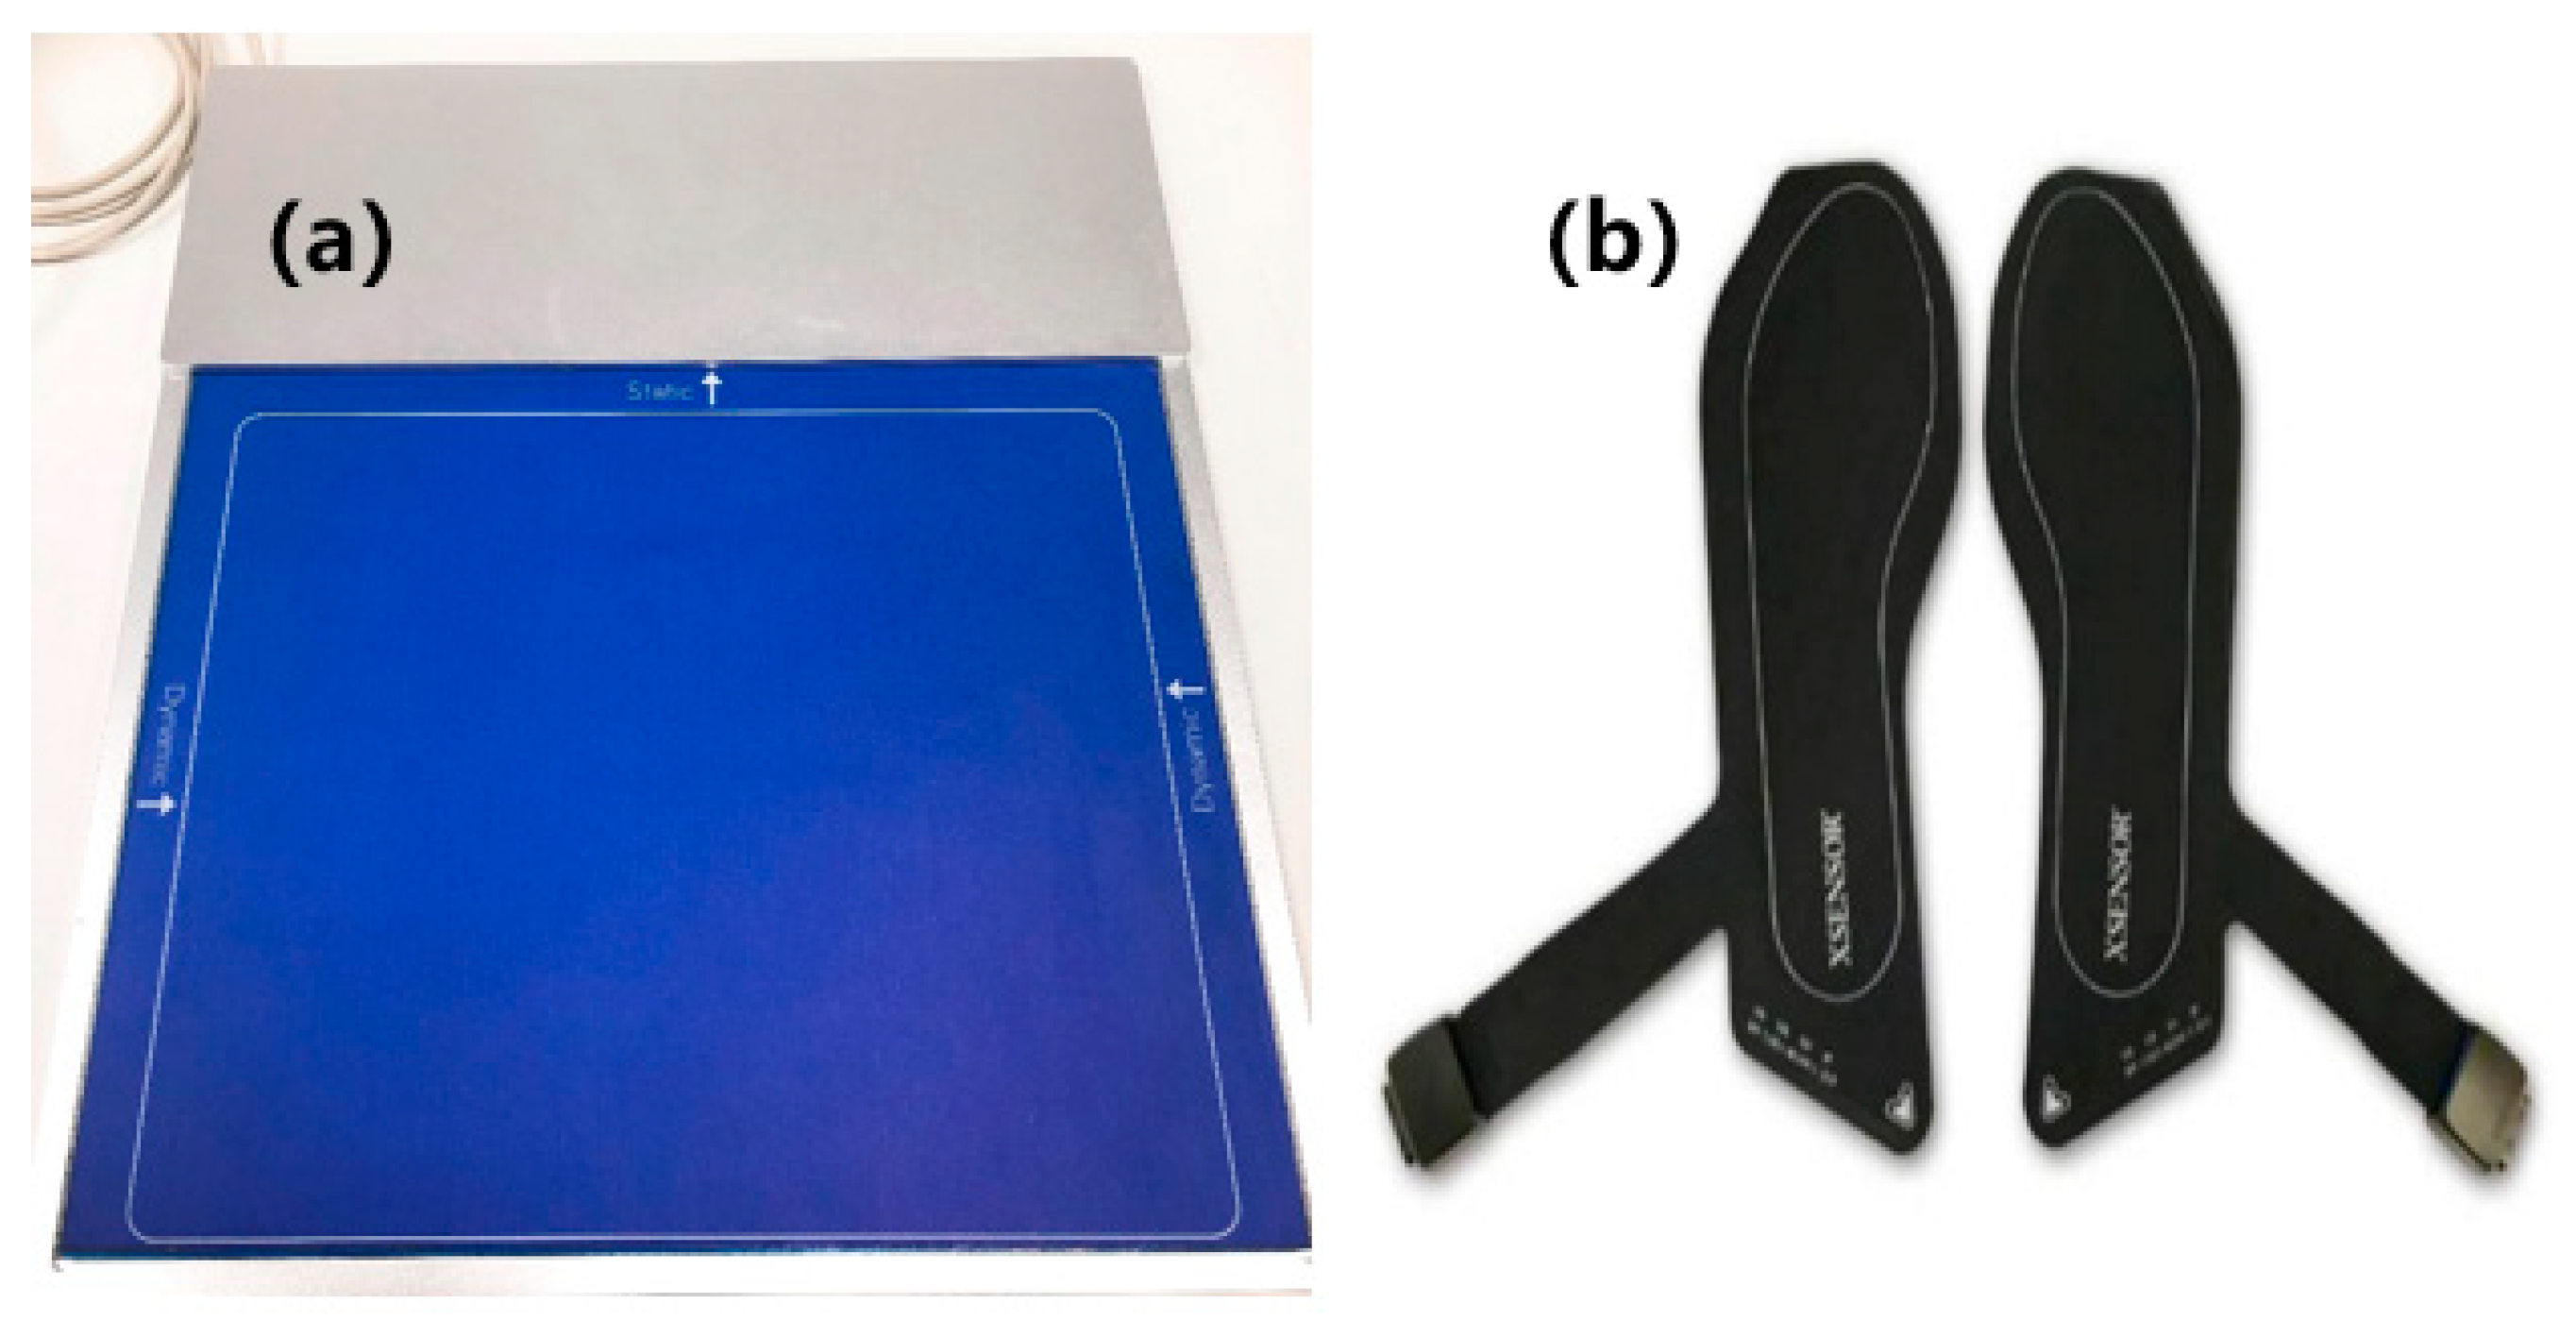
2.1. Equipment
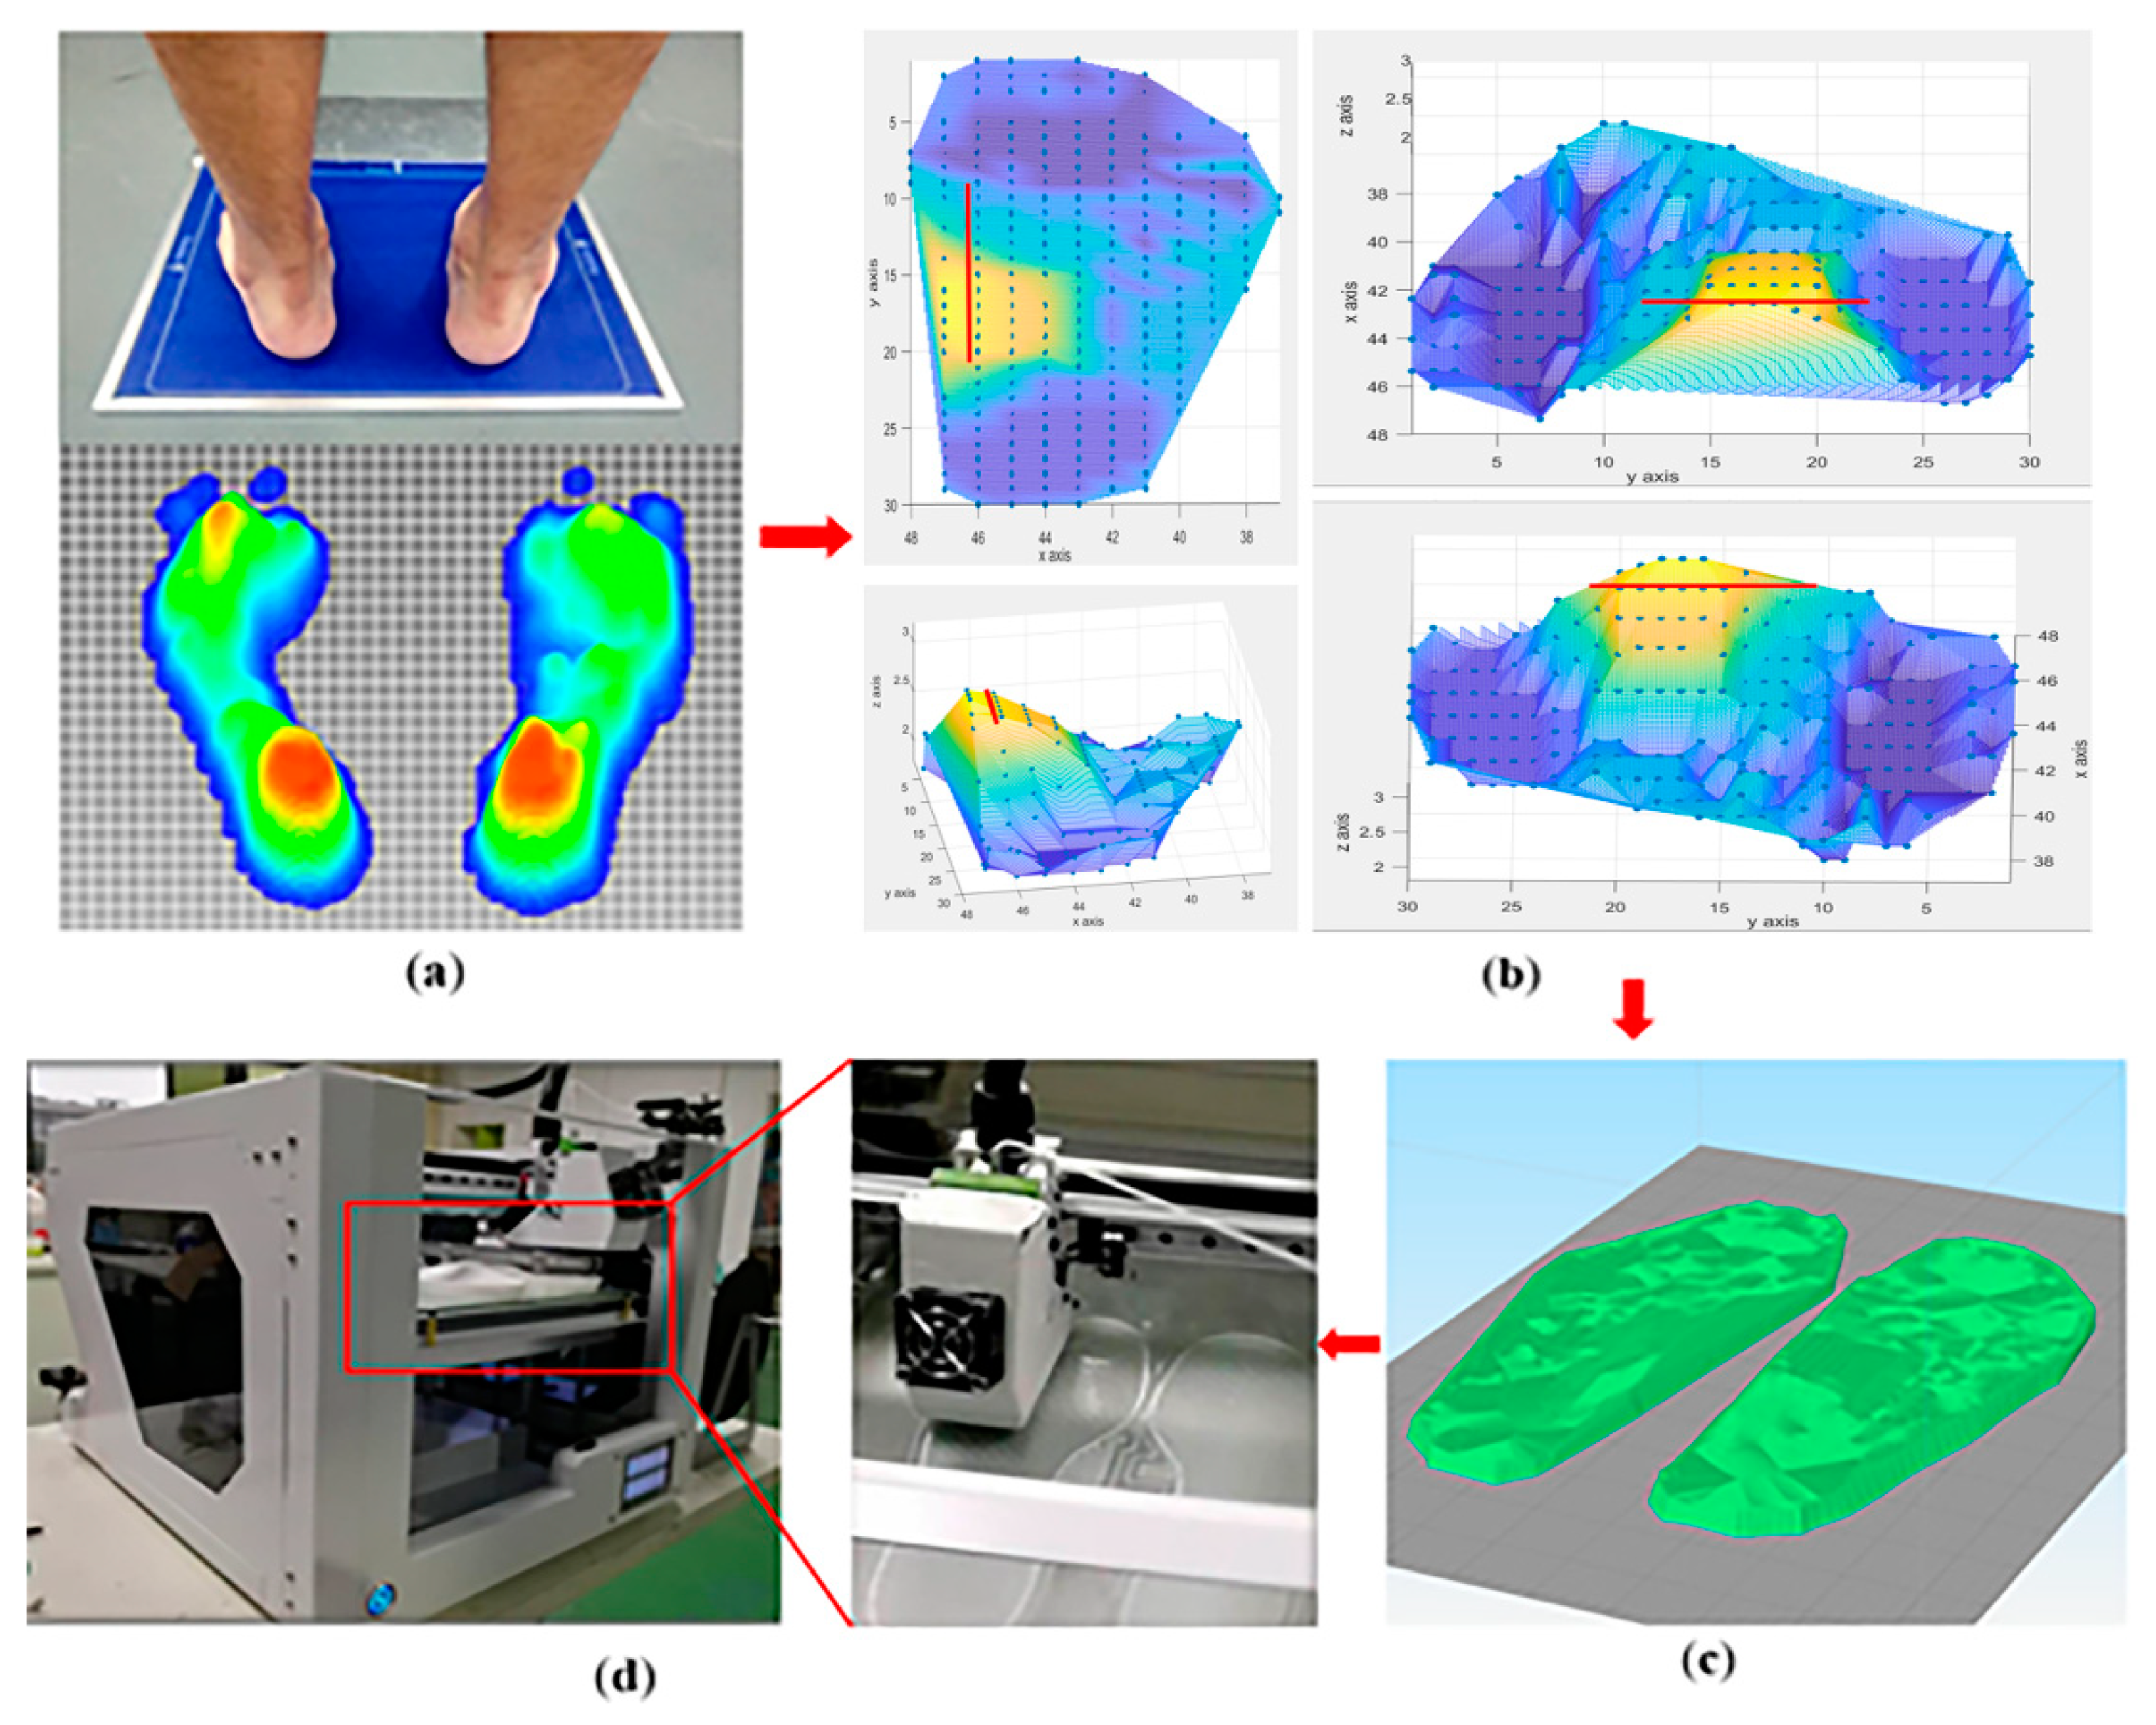
2.2. Design of PPRI
2.3. Subjects and Methods
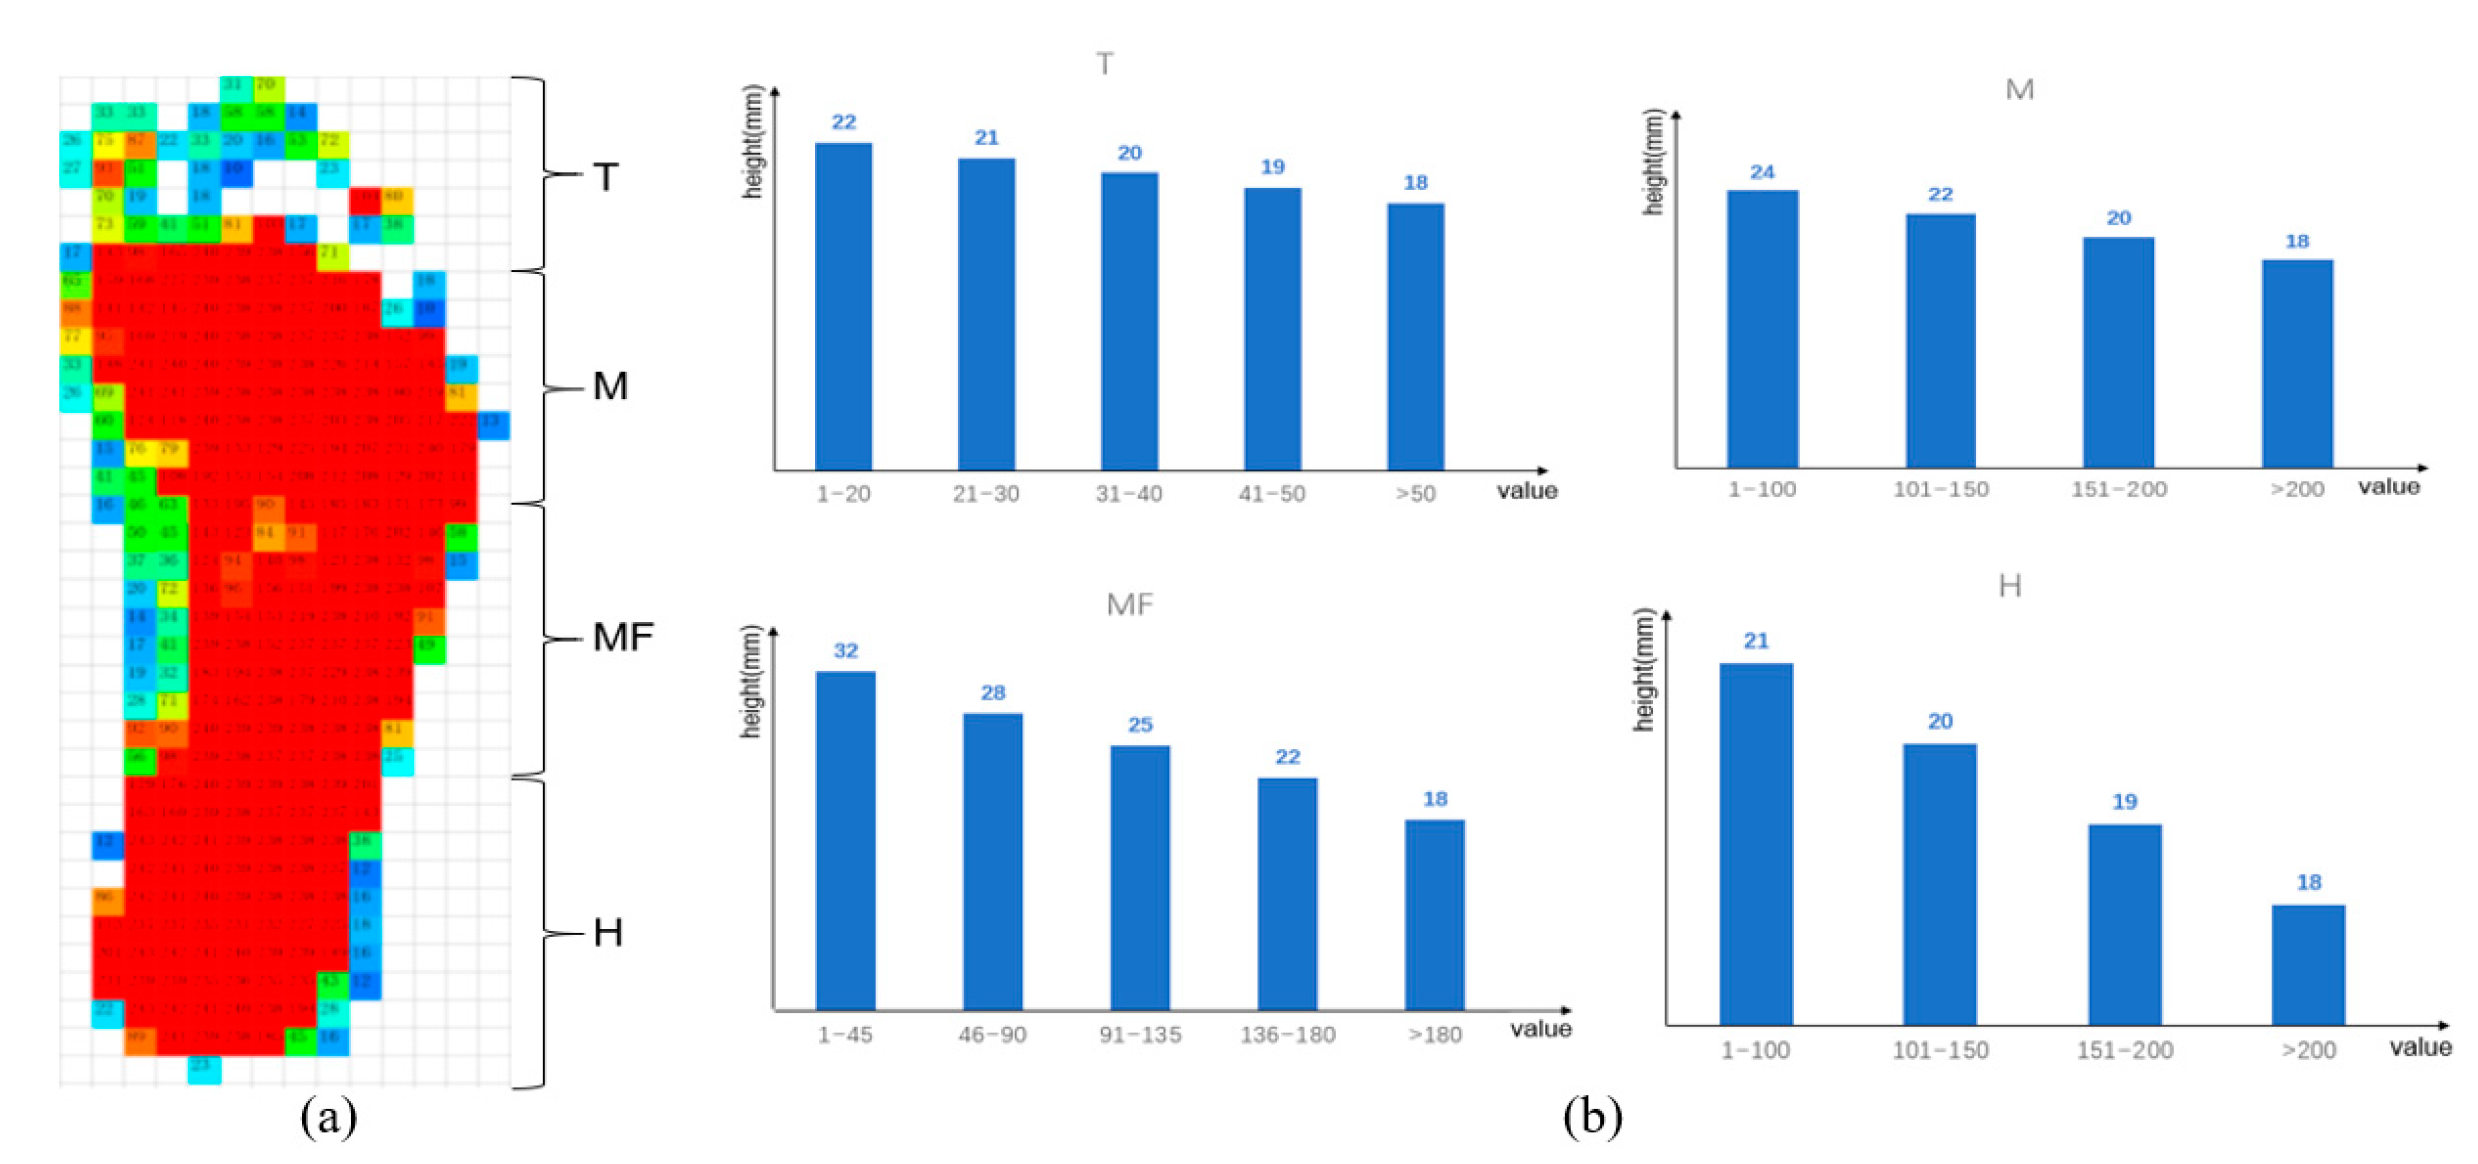
2.4. Data Process
2.5. Statistical Analysis
3. Results
3.1. Stance Time and Step Rate
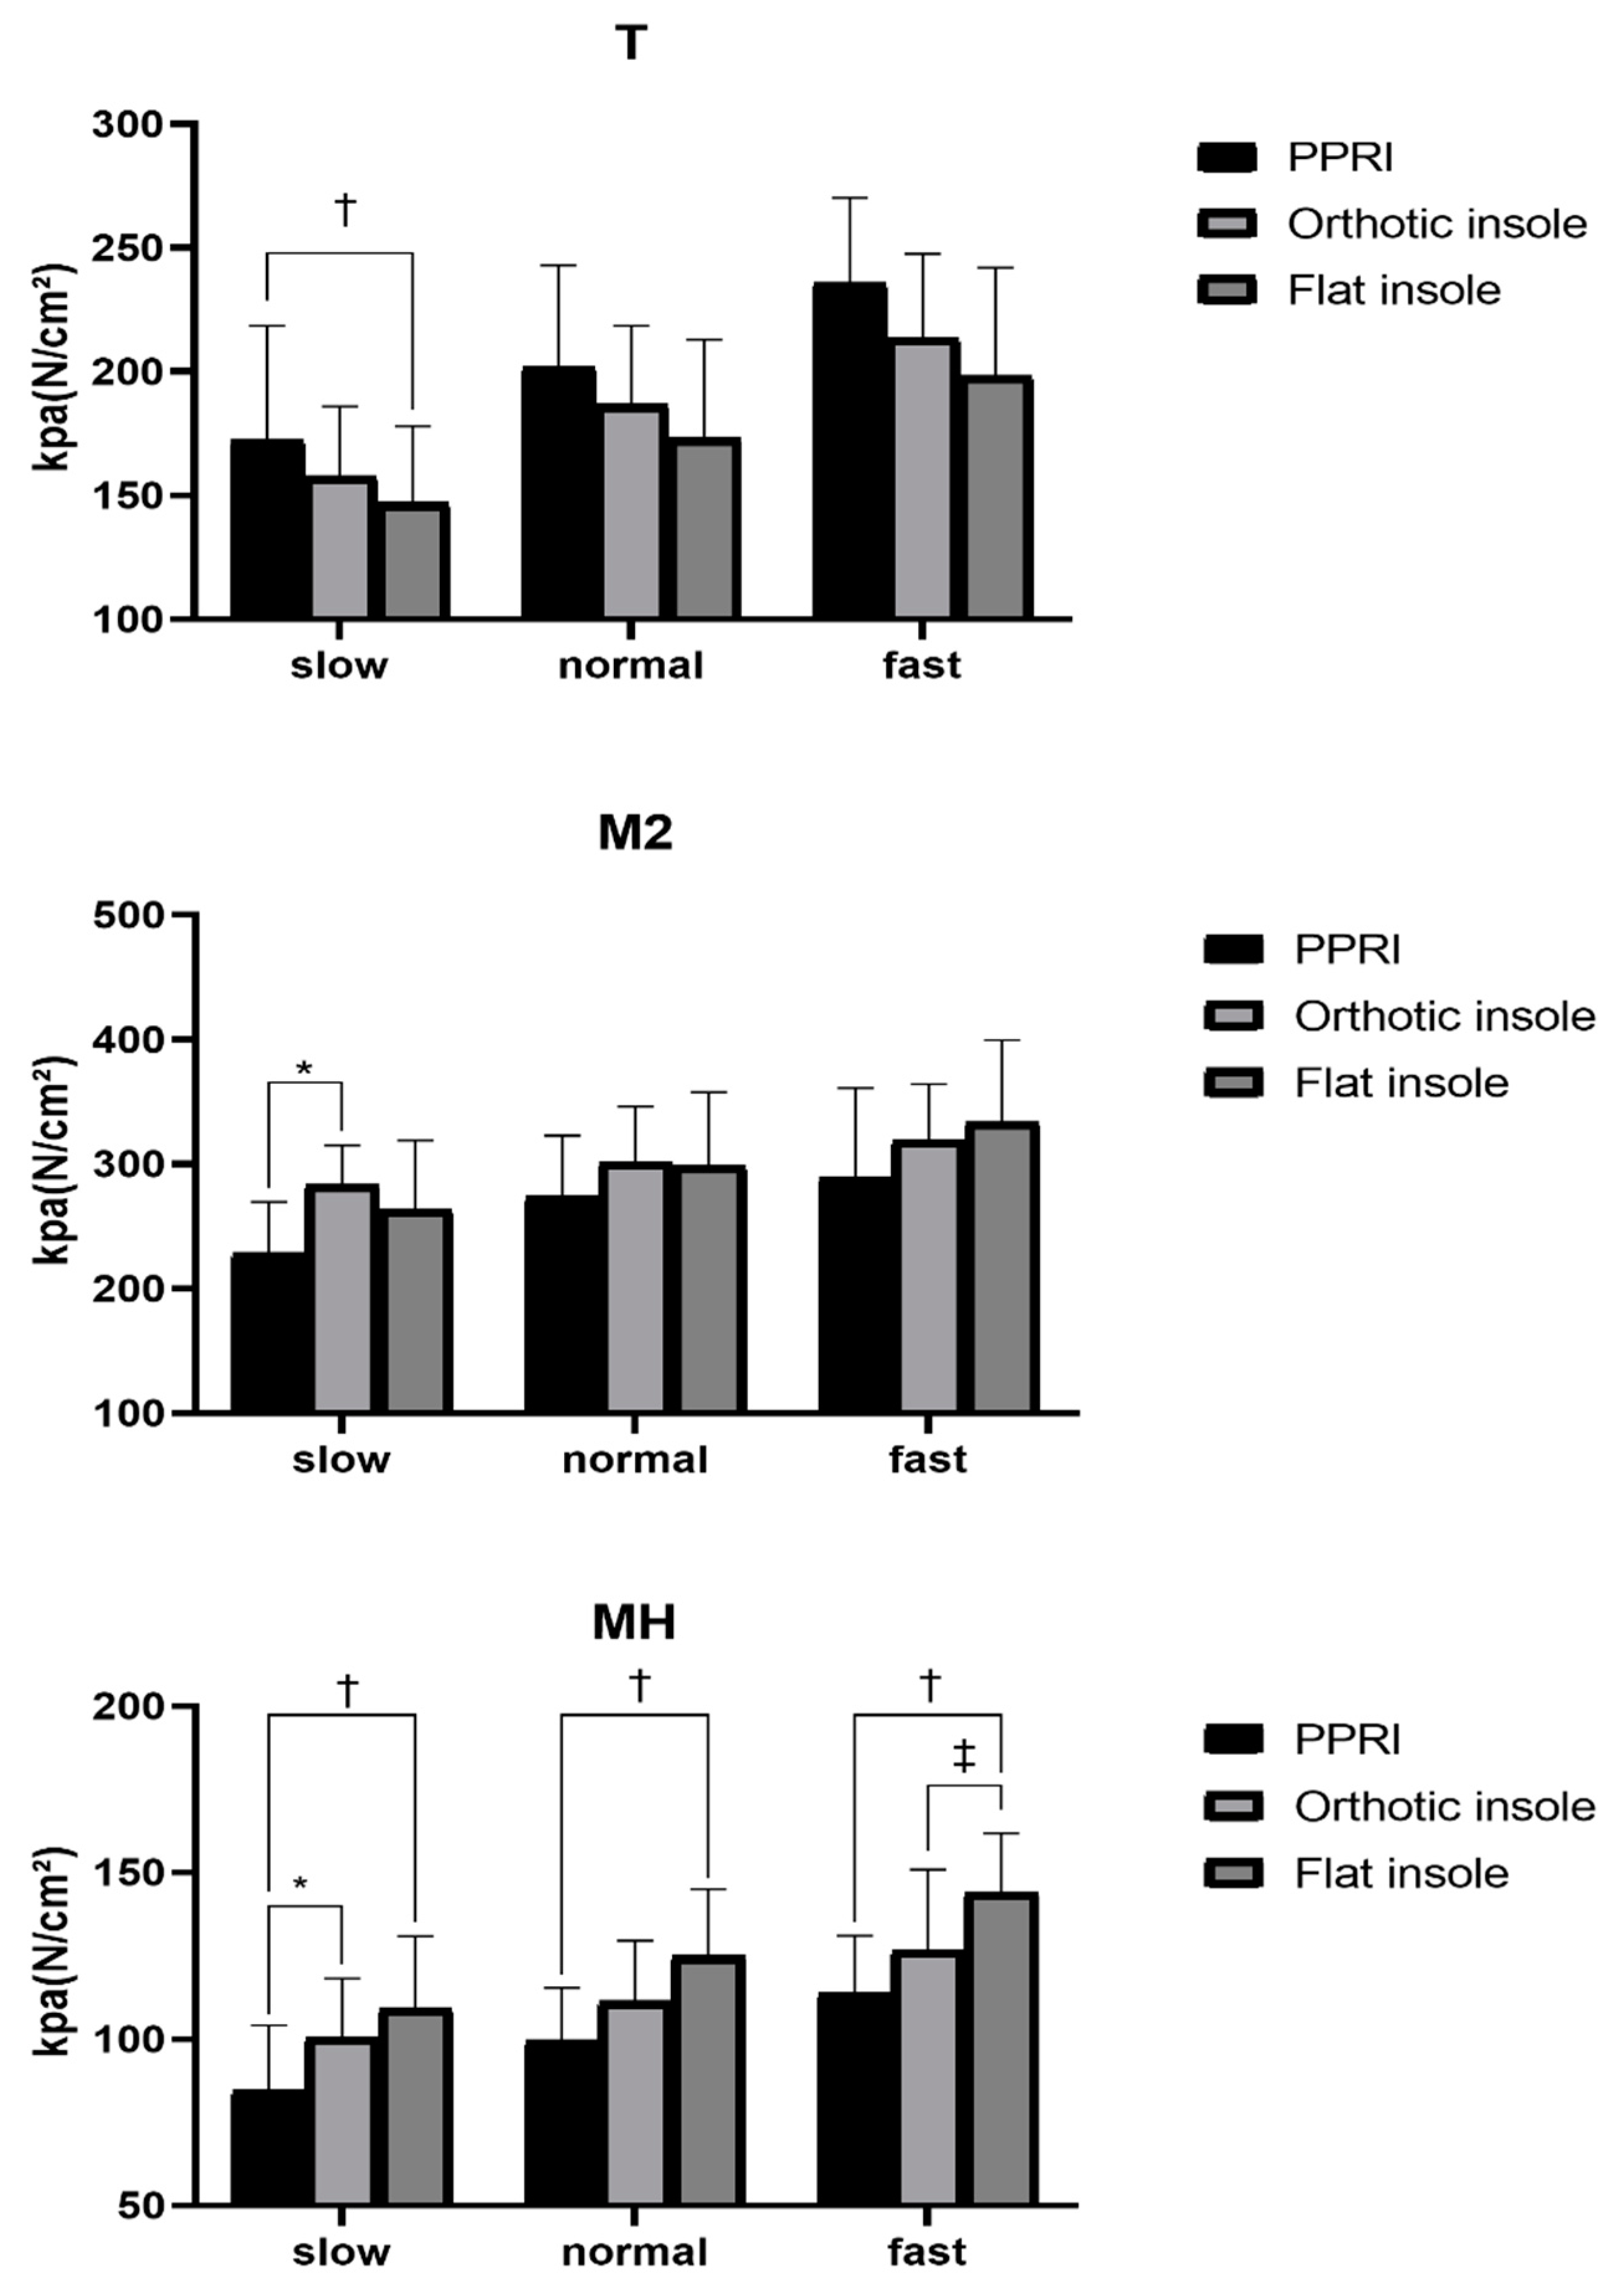
3.2. Peak Pressure
3.3. Contact Area
4. Discussion
5. Conclusions
Author Contributions
Funding
Institutional Review Board Statement
Informed Consent Statement
Data Availability Statement
Acknowledgments
Conflicts of Interest
References
- Razeghi, M.; Batt, M.E. Foot type classification: A critical review of current methods. Gait Posture 2002, 15, 282–291. [Google Scholar] [CrossRef]
- Funk, D.A.; Cass, J.R.; Johnson, K.A. Acquired adult flat foot secondary to posterior tibial-tendon pathology. J. Bone Jt. Surg. Am. Vol. 1986, 68, 95–102. [Google Scholar] [CrossRef]
- Dare, D.M.; Dodwell, E.R. Pediatric flatfoot: Cause, epidemiology, assessment, and treatment. Curr. Opin. Pediatr. 2014, 26, 93–100. [Google Scholar] [CrossRef] [PubMed]
- Han, J.T.; Koo, H.M.; Jung, J.M.; Kim, Y.J.; Lee, J.H. Differences in Plantar Foot Pressure and COP between Flat and Normal Feet during Walking. J. Phys. Ther. Sci. 2011, 23, 683–685. [Google Scholar] [CrossRef] [Green Version]
- Donatelli, R.A. The biomechanics of the foot and ankle. J. Orthop. Sports Phys. Ther. 1987, 9, 11. [Google Scholar] [CrossRef] [Green Version]
- Siu, W.-S.; Shih, Y.-F.; Lin, H.-S. Effects of Kinesio tape on supporting medial foot arch in runners with functional flatfoot: A preliminary study. Res. Sports Med. 2019, 28, 168–180. [Google Scholar] [CrossRef]
- Wang, Z.Y.; Tang, K.L. Treatment and diagnosis of adult flatfoot. Natl. Med. J. China 2010, 90, 2305–2307. [Google Scholar]
- Del Rossi, G.; Fiolkowski, P.; Horodyski, M.B.; Bishop, M.; Trimble, M. For how long do temporary techniques maintain the height of the medial longitudinal arch? Phys. Ther. Sport 2004, 5, 84–89. [Google Scholar] [CrossRef]
- Francisco, R.; Chiodo, C.P.; Wilson, M.G. Management of the rigid adult acquired flatfoot deformity. Foot Ankle Clin. 2007, 12, 317–327. [Google Scholar] [CrossRef]
- Denning, J.R. Tarsal Coalition in Children. Pediatr. Ann. 2016, 45, 139–143. [Google Scholar] [CrossRef]
- Arachchige, S.N.K.; Chander, H.; Knight, A. Flatfeet: Biomechanical implications, assessment and management. Foot 2019, 38, 81–85. [Google Scholar] [CrossRef] [PubMed]
- Tang, S.F.-T.; Chen, C.-H.; Wu, C.-K.; Hong, W.-H.; Chen, K.-J.; Chen, C.-K. The effects of total contact insole with forefoot medial posting on rearfoot movement and foot pressure distributions in patients with flexible flatfoot. Clin. Neurol. Neurosurg. 2015, 129, 8–11. [Google Scholar] [CrossRef]
- Lee, Y.-C.; Lin, G.; Wang, J.M.-J. Comparing 3D foot scanning with conventional measurement methods. J. Foot Ankle Res. 2014, 7, 44. [Google Scholar] [CrossRef] [PubMed]
- Munteanu, S.E.; Scott, L.A.; Bonanno, D.R.; Landorf, K.B.; Pizzari, T.; Cook, J.L.; Menz, H.B. Effectiveness of customised foot orthoses for Achilles tendinopathy: A randomised controlled trial. Br. J. Sports Med. 2015, 49, 989. [Google Scholar] [CrossRef]
- Jin, H.; Xu, R.; Wang, S.; Wang, J. Use of 3D-Printed Heel Support Insoles Based on Arch Lift Improves Foot Pressure Distribution in Healthy People. Med. Sci. Monit. Int. Med. J. Exp. Clin. Res. 2019, 25, 7175–7181. [Google Scholar] [CrossRef] [PubMed]
- Korada, H.; Maiya, A.; Rao, S.K.; Hande, M. Effectiveness of customized insoles on maximum plantar pressure in diabetic foot syndrome: A systematic review. Diabetes Metab. Syndr. Clin. Res. Rev. 2020, 14, 1093–1099. [Google Scholar] [CrossRef] [PubMed]
- Huang, Y.-P.; Peng, H.-T.; Wang, X.; Chen, Z.-R.; Song, C.-Y. The arch support insoles show benefits to people with flatfoot on stance time, cadence, plantar pressure and contact area. PLoS ONE 2020, 15, e0237382. [Google Scholar]
- Wang, C.-S. An analysis and evaluation of fitness for shoe lasts and human feet. Comput. Ind. 2010, 61, 532–540. [Google Scholar] [CrossRef]
- Zhai, J.N.; Wang, J.; Qiu, Y.S. Plantar pressure differences among adults with mild flexible flatfoot, severe flexible flatfoot and normal foot when walking on level surface, walking upstairs and downstairs. J. Phys. Ther. Sci. 2017, 29, 641–646. [Google Scholar] [CrossRef]
- Chuckpaiwong, B.; Nunley, J.A.; Mall, N.A.; Queen, R.M. The effect of foot type on in-shoe plantar pressure during walking and running. Gait Posture 2008, 28, 405–411. [Google Scholar] [CrossRef] [PubMed]
- MacWilliams, B.A.; Cowley, M.; Nicholson, D.E. Foot kinematics and kinetics during adolescent gait. Gait Posture 2003, 17, 214–224. [Google Scholar] [CrossRef]
- Lange, J.S.; Maiwald, C.; Mayer, T.A.; Schwanitz, S.; Odenwald, S.; Milani, T.L. Relationship between plantar pressure and perceived comfort in military boots. Footwear Sci. 2009, 1, 30–32. [Google Scholar] [CrossRef]
- Richie, D. Biomechanics and Orthotic Treatment of the Adult Acquired Flatfoot. Clin. Podiatr. Med. Surg. 2020, 37, 71–89. [Google Scholar] [CrossRef]
- Cotoros, D.; Stanciu, A. Composite Insoles for Improving the Distribution of Plantar Pressure. Macromol. Symp. 2020, 389, 1900081. [Google Scholar] [CrossRef]
- Sneyers, C.J.; Lysens, R.; Feys, H.; Andries, R. Influence of malalignment of feet on the plantar pressure pattern in running. Foot Ankle Int. 1995, 16, 624–632. [Google Scholar] [CrossRef]
- Luczak, T.; Burch, V.R.F.; Smith, B.K.; Carruth, D.W.; Lamberth, J.; Chander, H.; Prabhu, R.K. Closing the wearable gap—Part V: Development of a pressure-sensitive sock utilizing soft sensors. Sensors 2020, 20, 208. [Google Scholar] [CrossRef] [PubMed] [Green Version]
- Zhang, X.Y.; Li, B. Influence of in-shoe heel lifts on plantar pressure and center of pressure in the medial–lateral direction during walking. Gait Posture 2014, 39, 1012. [Google Scholar] [CrossRef]
- Lieberman, D.E.; Venkadesan, M.; Werbel, W.A.; Daoud, A.I.; D’Andrea, S.; Davis, I.S.; Mang’Eni, R.O.; Pitsiladis, Y. Foot strike patterns and collision forces in habitually barefoot versus shod runners. Nature 2010, 463, 531–535. [Google Scholar] [CrossRef]
- Chang, J.-S.; Park, J.-W.; Kim, C.-S. The Changes of Plantar Foot Pressure by External Loads during Walking in Flatfoot. J. Korean Soc. Phys. Med. 2010, 5, 543–549. [Google Scholar]
- Chia, K.K.; Suresh, S.; Kuah, A.; Ong, J.L.; Phua, J.M.; Seah, A.L. Comparative trial of the foot pressure patterns between corrective orthotics, formthotics, bone spur pads and flat insoles in patients with chronic plantar fasciitis. Ann. Acad. Med. 2009, 38, 869–875. [Google Scholar]
- Aminian, G.; Safaeepour, Z.; Farhoodi, M.; Pezeshk, A.F.; Saeedi, H.; Majddoleslam, B. The effect of prefabricated and proprioceptive foot orthoses on plantar pressure distribution in patients with flexible flatfoot during walking. Prosthet. Orthot. Int. 2013, 37, 227–232. [Google Scholar] [CrossRef] [PubMed]
- Khodaei, B.; Saeedi, H.; Jalali, M.; Farzadi, M.; Norouzi, E. Comparison of plantar pressure distribution in CAD-CAM and prefabricated foot orthoses in patients with flexible flatfeet. Foot 2017, 33, 76–80. [Google Scholar] [CrossRef] [PubMed]
- Kirmizi, M.; Sengul, Y.S.; Angin, S. The effects of gait speed on plantar pressure variables in individuals with normal foot posture and flatfoot. Acta Bioeng. Biomech. 2020, 22, 267–282. [Google Scholar] [CrossRef]


| General Characteristics | Subjects (n = 10) |
|---|---|
| Number of subjects (Male/Female) | 8/2 |
| Height (cm) | 167.9 ± 5.5 |
| Body weight (kg) | 67.4 ± 10.9 |
| Foot length (cm) | 25.4 ± 1.6 |
| Ankle width (cm) | 8.5 ± 0.6 |
| Arch index (%) | 31.7 ± 2.7 |
| PPRI | Orthotic Insole | Flat Insole | |||||||
|---|---|---|---|---|---|---|---|---|---|
| Left | Right | Average | Left | Right | Average | Left | Right | Average | |
| Stance time (ms) | |||||||||
| Slow † | 784.6 ± 64.8 | 793.9 ± 39.4 | 789.4 ± 51.0 | 803.9 ± 80.5 | 805.3 ± 75.4 | 804.6 ± 77.2 | 804.4 ± 74.6 | 819.5 ± 79.5 | 812.0 ± 76.3 |
| normal | 695.7 ± 45.9 | 699.2 ± 36.7 | 697.5 ± 38.5 | 696.6 ± 42.0 | 700.8 ± 33.9 | 698.7 ± 37.2 | 699.9 ± 50.4 | 707.5 ± 45.9 | 703.7 ± 47.4 |
| fast | 612.5 ± 43.5 | 622.4 ± s25.7 | 617.5 ± 32.9 | 638.0 ± 33.5 | 642.6 ± 28.7 | 639.8 ± 29.7 | 645.4 ± 33.8 | 668.2 ± 29.0 | 656.8 ± 29.7 |
| Step rate (steps per minute) | |||||||||
| slow | 94.7 ± 7.5 | 95.9 ± 5.2 | 95.3 ± 5.3 | 93.7 ± 6.5 | 94.7 ± 8.5 | 94.2 ± 7.1 | 94.0 ± 8.5 | 97.5 ± 11.3 | 95.8 ± 9.8 |
| normal | 104.6 ± 8.1 | 103.3 ± 6.8 | 104.0 ± 5.5 | 103.9 ± 5.4 | 105.2 ± 6.9 | 104.6 ± 5.5 | 104.6 ± 7.6 | 107.0 ± 12.7 | 105.8 ± 9.9 |
| fast | 115.4 ± 4.7 | 117.5 ± 7.5 | 116.5 ± 5.4 | 113.1 ± 4.9 | 114.3 ± 7.3 | 113.7 ± 5.5 | 111.7 ± 5.0 | 116.4 ± 8.3 | 114.1 ± 6.0 |
| Ppri | Orthotic Insole | Flat Insole | |||||||
|---|---|---|---|---|---|---|---|---|---|
| Left | Right | Average | Left | Right | Average | Left | Right | Average | |
| T (kpa) | |||||||||
| slow † | 179.7 ± 44.7 | 184.8 ± 73.3 | 182.2 ± 46.3 | 163.4 ± 41.8 | 152.1 ± 51.2 | 157.8 ± 28.2 | 141.3 ± 47.3 | 152.9 ± 66.7 | 147.0 ± 31.0 |
| normal | 203.1 ± 23.2 | 201.0 ± 72.5 | 202.0 ± 40.9 | 190.3 ± 40.4 | 183.2 ± 59.6 | 186.8 ± 31.8 | 164.6 ± 38.2 | 181.9 ± 74.7 | 173.3 ± 39.6 |
| fast | 233.6 ± 23.7 | 238.4 ± 75.8 | 236.0 ± 34.3 | 214.7 ± 33.2 | 213.2 ± 76.3 | 213.9 ± 33.8 | 188.9 ± 42.0 | 207.7 ± 84.3 | 198.3 ± 43.7 |
| M1 (kpa) | |||||||||
| slow | 158.8 ± 59.1 | 109.3 ± 31.0 | 134.0 ± 37.6 | 145.7 ± 37.3 | 103.0 ± 38.7 | 124.3 ± 25.3 | 146.7 ± 27.0 | 109.2 ± 31.9 | 128.0 ± 21.0 |
| normal | 174.5 ± 56.6 | 110.5 ± 33.4 | 142.5 ± 37.0 | 158.2 ± 36.7 | 111.1 ± 41.4 | 134.6 ± 29.1 | 153.2 ± 21.5 | 120.2 ± 35.0 | 136.7 ± 22.2 |
| fast | 196.8 ± 53.2 | 127.5 ± 30.7 | 162.2 ± 26.5 | 176.7 ± 25.8 | 126.8 ± 44.4 | 151.8 ± 25.3 | 165.8 ± 20.4 | 139.0 ± 41.6 | 152.4 ± 25.6 |
| M2 (kpa) | |||||||||
| slow * | 211.5 ± 42.7 | 246.1 ± 51.8 | 228.8 ± 40.9 | 285.6 ± 48.3 | 281.4 ± 57.6 | 283.5 ± 31.5 | 256.5 ± 53.4 | 271.2 ± 85.7 | 263.9 ± 55.1 |
| normal | 263.0 ± 47.5 | 284.1 ± 64.0 | 273.6 ± 49.1 | 305.3 ± 30.2 | 298.1 ± 88.0 | 301.7 ± 44.5 | 288.8 ± 40.2 | 307.6 ± 96.9 | 298.2 ± 59.5 |
| fast | 282.0 ± 60.5 | 290.8 ± 101.1 | 286.4 ± 71.5 | 310.3 ± 24.9 | 328.1 ± 82.3 | 319.2 ± 45.0 | 319.0 ± 39.7 | 348.3 ± 110.4 | 333.6 ± 65.8 |
| M3 (kpa) | |||||||||
| slow | 132.6 ± 36.3 | 140.7 ± 46.9 | 136.6 ± 38.2 | 153.9 ± 56.7 | 152.2 ± 42.5 | 153.1 ± 43.6 | 150.7 ± 51.2 | 141.0 ± 54.0 | 145.8 ± 51.0 |
| normal | 156.7 ± 48.8 | 156.4 ± 57.9 | 156.5 ± 48.5 | 172.9 ± 69.3 | 154.5 ± 55.6 | 163.7 ± 60.2 | 171.1 ± 69.6 | 154.7 ± 57.5 | 162.9 ± 62.5 |
| fast | 159.0 ± 50.8 | 153.5 ± 60.0 | 156.3 ± 52.5 | 173.9 ± 69.4 | 161.3 ± 66.1 | 167.6 ± 65.5 | 180.2 ± 77.3 | 156.1 ± 63.4 | 168.1 ± 69.1 |
| MF (kpa) | |||||||||
| slow | 80.9 ± 21.2 | 85.4 ± 11.7 | 83.1 ± 15.6 | 81.3 ± 13.6 | 87.3 ± 14.6 | 84.3 ± 12.9 | 80.2 ± 18.1 | 76.2 ± 14.9 | 78.2 ± 15.7 |
| normal | 75.0 ± 22.2 | 84.9 ± 10.9 | 79.9 ± 14.8 | 82.7 ± 13.7 | 84.4 ± 13.3 | 83.5 ± 12.5 | 84.0 ± 18.6 | 78.6 ± 19.0 | 81.3 ± 17.6 |
| fast | 71.7 ± 17.7 | 76.9 ± 17.9 | 74.3 ± 17.3 | 75.6 ± 11.7 | 82.2 ± 20.8 | 78.9 ± 14.2 | 85.7 ± 16.7 | 77.4 ± 17.1 | 81.6 ± 15.6 |
| MH (kpa) | |||||||||
| slow *,† | 92.6 ± 32.3 | 76.7 ± 11.3 | 84.6 ± 19.5 | 108.9 ± 28.8 | 98.2 ± 13.4 | 103.5 ± 17.6 | 110.4 ± 28.8 | 108.5 ± 15.0 | 109.4 ± 21.5 |
| normal † | 106.7 ± 28.2 | 92.4 ± 12.2 | 99.6 ± 15.7 | 114.8 ± 23.1 | 108.0 ± 18.9 | 111.4 ± 18.1 | 126.0 ± 24.7 | 123.8 ± 16.0 | 124.9 ± 20.0 |
| fast †,‡ | 123.5 ± 28.1 | 103.9 ± 19.9 | 113.7 ± 17.3 | 128.4 ± 25.0 | 112.9 ± 30.1 | 120.6 ± 24.3 | 146.8 ± 24.6 | 141.2 ± 15.3 | 144.0 ± 17.8 |
| LH (kpa) | |||||||||
| slow | 116.8 ± 26.8 | 111.7 ± 15.5 | 114.3 ± 17.0 | 113.9 ± 28.6 | 93.7 ± 6.9 | 103.8 ± 15.8 | 130.0 ± 21.6 | 129.8 ± 12.3 | 129.9 ± 15.7 |
| normal | 125.4 ± 18.1 | 126.9 ± 23.6 | 126.2 ± 13.4 | 124.6 ± 23.8 | 105.4 ± 9.3 | 115.0 ± 13.9 | 145.1 ± 20.7 | 145.2 ± 13.3 | 145.1 ± 14.4 |
| fast | 144.4 ± 16.1 | 142.9 ± 32.1 | 143.7 ± 21.2 | 141.0 ± 28.4 | 116.4 ± 16.9 | 128.7 ± 19.2 | 166.6 ± 21.2 | 159.0 ± 22.0 | 162.8 ± 18.0 |
| PPRI | Orthotic Insole | Flat Insole | |||||||
|---|---|---|---|---|---|---|---|---|---|
| Left | Right | Average | Left | Right | Average | Left | Right | Average | |
| T (%) | |||||||||
| slow | 9.3 ± 0.3 | 9.3 ± 0.7 | 9.3 ± 0.5 | 8.8 ± 0.4 | 8.7 ± 0.5 | 8.8 ± 0.5 | 9.4 ± 0.5 | 9.3 ± 0.7 | 9.4 ± 0.6 |
| normal | 9.3 ± 0.5 | 9.4 ± 0.5 | 9.4 ± 0.5 | 9.3 ± 0.5 | 8.9 ± 0.6 | 9.2 ± 0.6 | 9.4 ± 0.6 | 9.6 ± 0.7 | 9.5 ± 0.6 |
| fast | 9.3 ± 0.3 | 9.2 ± 0.4 | 9.3 ± 0.4 | 9.4 ± 0.6 | 9.3 ± 0.5 | 9.4 ± 0.5 | 9.5 ± 0.3 | 9.7 ± 0.5 | 9.6 ± 0.4 |
| M (%) | |||||||||
| slow † | 41.4 ± 0.5 | 40.7 ± 0.6 | 41.0 ± 0.5 | 41.3 ± 0.4 | 41.6 ± 0.4 | 41.4 ± 0.4 | 41.8 ± 0.4 | 41.9 ± 0.6 | 41.8 ± 0.5 |
| normal † | 41.6 ± 0.6 | 40.9 ± 0.4 | 41.2 ± 0.5 | 41.3 ± 0.3 | 41.9 ± 0.5 | 41.4 ± 0.4 | 41.9 ± 0.6 | 42.0 ± 0.6 | 41.9 ± 0.6 |
| fast | 41.6 ± 0.6 | 41.4 ± 0.3 | 41.5 ± 0.4 | 41.3 ± 0.5 | 41.5 ± 0.2 | 41.4 ± 0.3 | 41.9 ± 0.4 | 41.8 ± 0.6 | 41.8 ± 0.5 |
| MF (%) | |||||||||
| slow †,‡ | 27.6 ± 0.1 | 27.8 ± 0.2 | 27.7 ± 0.1 | 27.8 ± 0.3 | 27.9 ± 0.2 | 27.9 ± 0.2 | 27.3 ± 0,3 | 27.6 ± 0.2 | 27.4 ± 0.2 |
| normal | 27.5 ± 0.1 | 27.7 ± 0.1 | 27.6 ± 0.1 | 27.6 ± 0.2 | 27.6 ± 0.2 | 27.6 ± 0.2 | 27.4 ± 0.3 | 27.6 ± 0.1 | 27.5 ± 0.2 |
| fast | 27.4 ± 0.3 | 27.5 ± 0.2 | 27.5 ± 0.2 | 27.4 ± 0.1 | 27.5 ± 0.2 | 27.5 ± 0.1 | 27.3 ± 0.1 | 27.4 ± 0.2 | 27.3 ± 0.1 |
| H (%) | |||||||||
| slow †,‡ | 21.7 ± 0.3 | 22.1 ± 0.2 | 21.9 ± 0.2 | 22.0 ± 0.4 | 21.9 ± 0.3 | 22.0 ± 0.3 | 21.5 ± 0.3 | 21.1 ± 0.2 | 21.3 ± 0.2 |
| normal †,‡ | 21.6 ± 0.3 | 22.0 ± 0.1 | 21.8 ± 0.2 | 21.8 ± 0.3 | 21.8 ± 0.3 | 21.8 ± 0.3 | 21.4 ± 0.4 | 20.7 ± 0.3 | 21.1 ± 0.3 |
| fast †,‡ | 21.6 ± 0.1 | 21.8 ± 0.1 | 21.7 ± 0.1 | 21.8 ± 0.4 | 21.6 ± 0.2 | 21.7 ± 0.3 | 21.4 ± 0.3 | 21.1 ± 0.2 | 21.2 ± 0.3 |
Publisher’s Note: MDPI stays neutral with regard to jurisdictional claims in published maps and institutional affiliations. |
© 2021 by the authors. Licensee MDPI, Basel, Switzerland. This article is an open access article distributed under the terms and conditions of the Creative Commons Attribution (CC BY) license (http://creativecommons.org/licenses/by/4.0/).
Share and Cite
Jiang, Y.; Wang, D.; Ying, J.; Chu, P.; Qian, Y.; Chen, W. Design and Preliminary Validation of Individual Customized Insole for Adults with Flexible Flatfeet Based on the Plantar Pressure Redistribution. Sensors 2021, 21, 1780. https://doi.org/10.3390/s21051780
Jiang Y, Wang D, Ying J, Chu P, Qian Y, Chen W. Design and Preliminary Validation of Individual Customized Insole for Adults with Flexible Flatfeet Based on the Plantar Pressure Redistribution. Sensors. 2021; 21(5):1780. https://doi.org/10.3390/s21051780
Chicago/Turabian StyleJiang, Yangzheng, Duojin Wang, Jiming Ying, Pengfei Chu, Yu Qian, and Wenming Chen. 2021. "Design and Preliminary Validation of Individual Customized Insole for Adults with Flexible Flatfeet Based on the Plantar Pressure Redistribution" Sensors 21, no. 5: 1780. https://doi.org/10.3390/s21051780