Understanding Development of Malnutrition in Hemodialysis Patients: A Narrative Review

 ,
,  ,
, 
 ,
, 
Abstract
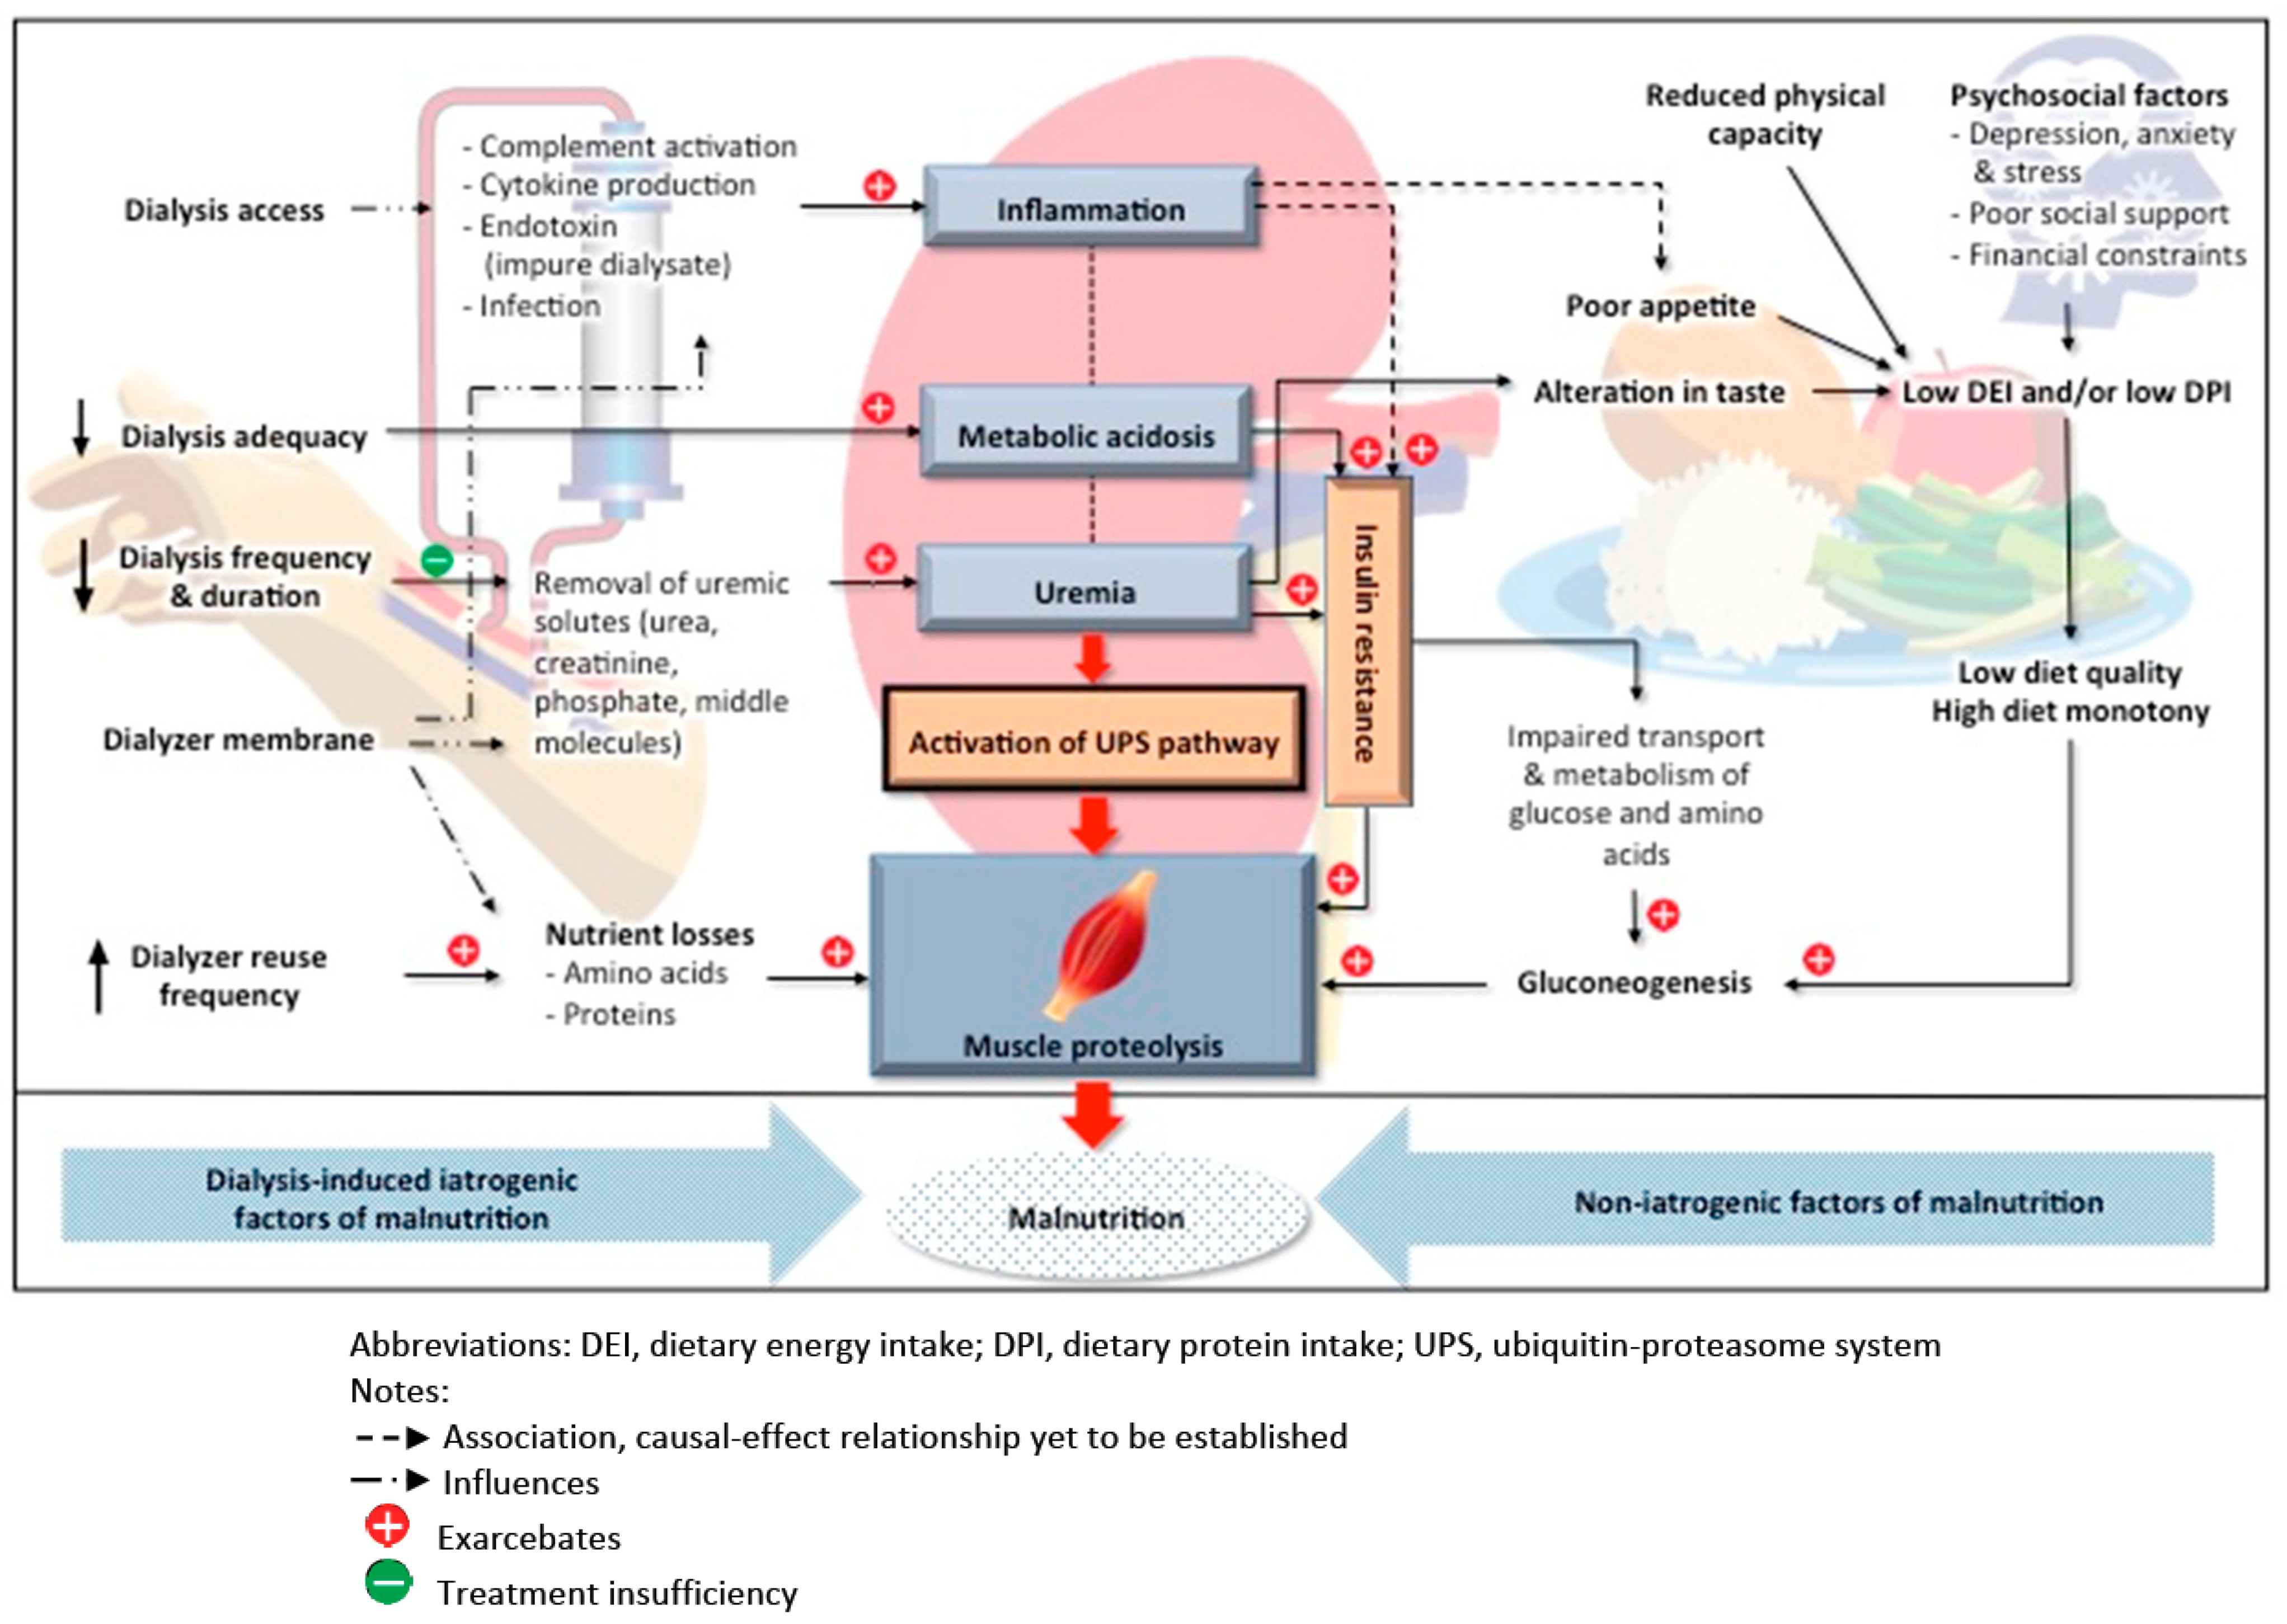
:1. Introduction
2. Development of Malnutrition at the Time of HD Initiation and Indicators of Poor Nutritional Status
3. Iatrogenic Factors of Malnutrition
3.1. Dialysis-Induced Nutrient Losses
3.2. Multiple Dialyzer Reuse
3.3. Dialysis-Induced Inflammation
3.4. Efficacy of Uremia Correction
3.5. Dialysis Adequacy
3.6. Dialysis Frequency
3.7. Dialysis Duration
3.8. Efficacy of Metabolic Acidosis Correction
4. Non-Iatrogenic Causes of Malnutrition
4.1. Suboptimal Dietary Intake
4.2. Taste Alterations
4.3. Poor Appetite
4.4. Insulin Resistance
4.5. Psychosocial Factors
4.5.1. Depression
4.5.2. Lack of Social Support
4.5.3. Financial Constraints
4.5.4. Decreased Physical Functioning
5. Conclusions
Author Contributions
Funding
Acknowledgments
Conflicts of Interest
References
- GBD Chronic Kidney Disease Collaboration. Global, regional, and national burden of chronic kidney disease, 1990–2017: A systematic analysis for the Global Burden of Disease Study 2017. Lancet 2020, 395, 709–733. [Google Scholar] [CrossRef] [Green Version]
- Liyanage, T.; Ninomiya, T.; Jha, V.; Neal, B.; Patrice, H.M.; Okpechi, I.; Zhao, M.; Lv, J.; Garg, A.X.; Knight, J.; et al. Worldwide access to treatment for end-stage kidney disease: A systematic review. Lancet 2015, 385, 1975–1982. [Google Scholar] [CrossRef]
- National Kidney Foundation. KDOQI Clinical Practice Guidelines for HD Adequacy: 2015 Update. Am. J. Kidney Dis. 2015, 66, 884–930. [Google Scholar] [CrossRef] [PubMed] [Green Version]
- Carrero, J.J.; Thomas, F.; Nagy, K.; Arogundade, F.; Avesani, C.M.; Chan, M.; Chmielewski, M.; Cordeiro, A.C.; Espinosa-Cuevas, A.; Fiaccadori, E.; et al. Global Prevalence of Protein-Energy Wasting in Kidney Disease: A Meta-analysis of Contemporary Observational Studies from the International Society of Renal Nutrition and Metabolism. J. Ren. Nutr. 2018, 28, 380–392. [Google Scholar] [CrossRef]
- Takahashi, H.; Inoue, K.; Shimizu, K.; Hiraga, K.; Takahashi, E.; Otaki, K.; Yoshikawa, T.; Furuta, K.; Tokunaga, C.; Sakakibara, T.; et al. on behalf of the Tokai Renal Nutrition Study Group. Comparison of Nutritional Risk Scores for Predicting Mortality in Japanese Chronic Hemodialysis Patients. J. Ren. Nutr. 2017, 27, 201–206. [Google Scholar] [CrossRef]
- Toledo, F.; Antunes, A.; Vannini, F.C.D.; Silveira, L.V.A.; Martin, L.C.; Barretti, P.; Caramori, J.C.T. Validity of malnutrition scores for predicting mortality in chronic hemodialysis patients. Int. Urol. Nephrol. 2013, 45, 1747–1752. [Google Scholar] [CrossRef]
- Uy, M.C.; Lim-Alba, R.; Chua, E. Association of Dialysis Malnutrition Score with Hypoglycemia and Quality of Life among Patients with Diabetes on Maintenance Hemodialysis. J. ASEAN Fed. Endocr. Soc. 2018, 33, 137–145. [Google Scholar] [CrossRef]
- Carrero, J.J.; Stenvinkel, P.; Cuppari, L.; Ikizler, T.A.; Kalantar-Zadeh, K.; Kaysen, G.; Mitch, W.E.; Price, S.R.; Wanner, C.; Wang, A.Y.; et al. Etiology of the protein-energy wasting syndrome in chronic kidney disease: A consensus statement from the International Society of Renal Nutrition and Metabolism (ISRNM). J. Ren. Nutr. 2013, 23, 77–90. [Google Scholar] [CrossRef] [Green Version]
- Tan, R.; Long, J.; Fang, S.; Mai, H.; Lu, W.; Liu, Y.; Wei, J.; Yan, F. Nutritional Risk Screening in patients with chronic kidney disease. Asia Pac. J. Clin. Nutr. 2016, 25, 249–256. [Google Scholar]
- Vanholder, R.; Fouque, D.; Glorieux, G.; Heine, G.H.; Kanbay, M.; Mallamaci, F.; Massy, Z.A.; Ortiz, A.; Rossignol, P.; Wiecek, A.; et al. For the European Renal Association European Dialysis and Transplant Association (ERA-EDTA) European Renal and Cardiovascular Medicine (EURECA-m) working group. Clinical management of the uraemic syndrome in chronic kidney disease. Lancet Diabetes Endocrinol. 2016, 4, 360–373. [Google Scholar] [CrossRef]
- Caetano, C.; Valente, A.; Oliveira, T.; Garagarza, C. Body composition and mortality predictors in hemodialysis patients. J. Ren. Nutr. 2016, 26, 81–86. [Google Scholar] [CrossRef]
- Fouque, D.; Kalantar-Zadeh, K.; Kopple, J. A proposed nomenclature and diagnostic criteria for protein-energy wasting in acute and chronic kidney disease. Kidney Int. 2008, 73, 391–398. [Google Scholar] [CrossRef] [PubMed] [Green Version]
- Bonilla-Palomas, J.L.; Gámez-López, A.L.; Anguita-Sánchez, M.P.; Castillo-Domínguez, J.C.; García-Fuertes, D.; Crespin-Crespin, M.; López-Granados, A.; Suárez de Lezo, J. Impact of malnutrition on long-term mortality in hospitalized patients with heart failure. Rev. Esp. Cardiol. 2011, 64, 752–758. [Google Scholar] [CrossRef]
- Tuegel, C.; Bansal, N. Heart failure in patients with kidney disease. Heart 2017, 103, 1848–1853. [Google Scholar] [CrossRef] [PubMed]
- Grossniklaus, D.A.; O’Brien, M.C.; Clark, P.C.; Dunbar, S.B. Nutrient intake in heart failure patients. J. Cardiovasc. Nurs. 2008, 23, 357–363. [Google Scholar] [CrossRef] [Green Version]
- Naini, A.E.; Karbalaie, A.; Abedini, M.; Askari, G.; Moeinzadeh, F. Comparison of malnutrition in hemodialysis and peritoneal dialysis patients and its relationship with echocardiographic findings. J. Res. Med. Sci. 2016, 21, 78. [Google Scholar] [CrossRef]
- Spatola, L.; Finazzi, S.; Calvetta, A.; Reggiani, F.; Morenghi, E.; Santostasi, S.; Angelini, C.; Badalamenti, S.; Mugnai, G. Subjective Global Assessment-Dialysis Malnutrition Score and cardiovascular risk in hemodialysis patients: An observational cohort study. J. Nephrol. 2018, 31, 757–765. [Google Scholar] [CrossRef] [PubMed]
- Van der Tol, A.; Lameire, N.; Morton, R.L.; Biesen, M.V.; Vanholder, R. An International Analysis of Dialysis Services Reimbursement. Clin. J. Am. Soc. Nephrol. 2019, 14, 83–94. [Google Scholar] [CrossRef] [PubMed]
- Robinson, B.M.; Zhang, J.; Morgenstern, H.; Bradbury, B.D.; Ng, L.J.; McCullough, K.P.; Gillespie, B.W.; Hakim, R.; Rayner, H.; Fort, J.; et al. Worldwide, mortality risk is high soon after initiation of hemodialysis. Kidney Int. 2013, 85, 158–165. [Google Scholar] [CrossRef] [Green Version]
- Lukowsky, L.R.; Kheifets, L.; Arah, O.A.; Nissenson, A.R.; Kalantar-Zadeh, K. Patterns and Predictors of Early Mortality in Incident Hemodialysis Patients: New Insights. Am. J. Nephrol. 2012, 35, 548–558. [Google Scholar] [CrossRef] [Green Version]
- Goldstein, M.; Yassa, T.; Dacouris, N.; McFarlane, P. Multidisciplinary Predialysis Care and Morbidity and Mortality of Patients on Dialysis. Am. J. Kidney Dis. 2004, 44, 706–714. [Google Scholar] [CrossRef]
- McQuillan, R.; Trpeski, L.; Fenton, S.; Lok, C.E. Modifiable Risk Factors for Early Mortality on Hemodialysis. Int. J. Nephrol. 2012, 2012, 435736. [Google Scholar] [CrossRef] [PubMed]
- Slinin, Y.; Guo, H.; Gilbertson, D.T.; Mau, L.W.; Ensrud, K.; Collins, A.J.; Ishani, A. Prehemodialysis Care by Dietitians and First-Year Mortality After Initiation of Hemodialysis. Am. J. Kidney Dis. 2011, 58, 583–590. [Google Scholar] [CrossRef] [PubMed] [Green Version]
- Ledebo, I.; Kessler, M.; van Biesen, W.; Wanner, C.; Wiecek, A.; Prichard, S.; Argilés, A.; Ritz, E. Initiation of dialysis: Opinions from an international survey: Report on the dialysis opinion symposium at the ERA-EDTA Congress, 18 September 2000, Nice. Nephrol. Dial. Transplant. 2001, 16, 1132–1138. [Google Scholar] [CrossRef] [Green Version]
- van de Luijtgaarden, M.W.; Noordzij, M.; Tomson, C.; Couchoud, C.; Cancarini, G.; Ansell, D.; Bos, W.J.; Dekker, F.W.; Gorriz, J.L.; Iatrou, C.; et al. Factors Influencing the Decision to Start Renal Replacement Therapy: Results of a Survey Among European Nephrologists. Am. J. Kidney Dis. 2012, 60, 940–948. [Google Scholar] [CrossRef] [Green Version]
- Rosansky, S.J.; Cancarini, G.; Clark, W.F.; Eggers, P.; Germaine, M.; Glassock, R.; Goldfarb, D.S.; Harris, D.; Hwang, S.J.; Imperial, E.B.; et al. Dialysis Initiation: What’s the Rush? Semin. Dial. 2013, 26, 650–657. [Google Scholar] [CrossRef] [Green Version]
- Nesrallah, G.E.; Mustafa, R.A.; Clark, W.F.; Bass, A.; Barnieh, L.; Hemmelgarn, B.R.; Klarenbach, S.; Quinn, R.R.; Hiremath, S.; Ravani, P.; et al. Canadian Society of Nephrology 2014 clinical practice guideline for timing the initiation of chronic dialysis. CMAJ 2014, 186, 112–117. [Google Scholar] [CrossRef] [Green Version]
- Kelly, J.; Stanley, M.; Harris, D. Caring for Australians with Renal Impairment (CARI). The CARI guidelines. Acceptance into dialysis guidelines. Nephrology 2005, 10, S46–S60. [Google Scholar] [CrossRef]
- Carrero, J.J.; Nakashima, A.; Qureshi, A.R.; Lindholm, B.; Heimburger, O.; Barany, P.; Stenvinkel, P. Protein-energy wasting modifies the association of ghrelin with inflammation, leptin, and mortality in hemodialysis patients. Kidney Int. 2011, 79, 749–756. [Google Scholar] [CrossRef] [Green Version]
- Gama-Axelsson, T.; Heimb€urger, O.; Stenvinkel, P.; Barany, P.; Lindholm, B.; Qureshi, A.R. Serum albumin as predictor of nutritional status in patients with ESRD. Clin. J. Am. Soc. Nephrol. 2012, 7, 1446–1453. [Google Scholar] [CrossRef]
- Therrien, M.; Byham-Gray, L.; Beto, J. A Review of Dietary Intake Studies in Maintenance Dialysis Patients. J. Ren. Nutr. 2015, 25, 329–338. [Google Scholar] [CrossRef] [PubMed]
- Kwon, Y.E.; Yoon, C.Y.; Han, I.M.; Han, S.G.; Park, K.S.; Lee, M.J.; Park, J.T.; Han, S.H.; Yoo, T.H.; Kim, Y.L.; et al. Change of Nutritional Status Assessed Using Subjective Global Assessment Is Associated with All-Cause Mortality in Incident Dialysis Patients. Medicine 2016, 95, e2714. [Google Scholar] [CrossRef] [PubMed]
- Araujo, L.C.; Kamimira, M.A.; Draibe, S.A.; Canziani, M.E.F.; Manfredi, S.R.; Avesani, C.M.; Sesso, R.; Cuppari, L. Nutritional Parameters and Mortality in Incident Hemodialysis Patients. J. Ren. Nutr. 2016, 16, 27–35. [Google Scholar] [CrossRef]
- Bradbury, B.D.; Fissell, R.B.; Albert, J.M.; Anthony, M.S.; Critchlow, C.W.; Pisoni, R.L.; Port, F.K.; Gillespie, B.W. Predictors of Early Mortality among Incident US Hemodialysis Patients in the Dialysis Outcomes and Practice Patterns Study (DOPPS). Clin. J. Am. Soc. Nephrol. 2007, 2, 89–99. [Google Scholar] [CrossRef]
- Murray, D.P.; Young, L.; Waller, J.; Wright, S.; Colombo, R.; Baer, S.; Spearman, V.; Garcia-Torres, R.; Williams, K.; Kheda, M.; et al. Is Dietary Protein Intake Predictive of One-Year Mortality in Dialysis Patients? Am. J. Med. Sci. 2018, 356, 234–243. [Google Scholar] [CrossRef] [PubMed]
- Pifer, T.B.; Mccullough, K.P.; Port, F.K.; Goodkin, D.A.; Maroni, B.J.; Held, P.J.; Young, E.W. Mortality risk in hemodialysis patients and changes in nutritional indicators: DOPPS. Kidney Int. 2002, 62, 2238–2245. [Google Scholar] [CrossRef] [Green Version]
- Dekker, M.J.E.; Marcelli, D.; Canaud, B.; Konings, C.J.A.M.; Leunissen, K.M.; Levin, N.W.; Carioni, P.; Maheshwari, V.; Raimann, J.G.; van der Sande, F.M.; et al. Unraveling the relationship between mortality, hyponatremia, inflammation and malnutrition in hemodialysis patients: Results from the international MONDO initiative. Eur. J. Clin. Nutr. 2016, 70, 779–784. [Google Scholar] [CrossRef]
- Rosenberger, J.; Kissova, V.; Majernikova, M.; Straussova, Z.; Boldizsar, J. Body composition monitor assessing malnutrition in the hemodialysis population independently predicts mortality. J. Ren. Nutr. 2014, 24, 172–176. [Google Scholar] [CrossRef]
- Chertow, G.M.; Goldstein-Fuchs, D.J.; Lazarus, J.M.; Kaysen, G.A. Prealbumin, mortality and cause-specific hospitalization in hemodialysis patients. Kidney Int. 2005, 68, 2794–2800. [Google Scholar] [CrossRef] [Green Version]
- Butterworth, C.E. The skeleton in the hospital closet. Nutr. Today 1974, 9, 4–8. [Google Scholar] [CrossRef]
- Van Gelder, M.; Abrahams, A.C.; Joles, J.A.; Kaysen, G.A.; Gerritsen, K. Albumin handling in different hemodialysis modalities. Nephrol. Dial. Transplant. 2018, 33, 906–913. [Google Scholar] [CrossRef] [PubMed]
- Wolfson, M.; Jones, M.R.; Kopple, J.D. Amino acid losses during hemodialysis with infusion of amino acids and glucose. Kidney Int. 1982, 21, 500–506. [Google Scholar] [CrossRef] [PubMed] [Green Version]
- Ikizler, T.A.; Flakoli, P.J.; Parker, R.A.; Hakim, R.M. Amino acid and albumin losses during hemodialysis. Kidney Int. 1994, 46, 830–837. [Google Scholar] [CrossRef] [PubMed] [Green Version]
- Salame, C.; Eaton, S.; Grimble, G.; Davenport, A. Protein Losses and Urea Nitrogen Underestimate Total Nitrogen Losses in Peritoneal Dialysis and Hemodialysis Patients. J. Ren. Nutr. 2018, 28, 317–323. [Google Scholar] [CrossRef]
- Ikizler, T.A.; Pupim, L.B.; Brouillette, J.R.; Levenhagen, D.K.; Farmer, K.; Hakim, R.M.; Flakoll, P.J. Hemodialysis stimulates muscle and whole body protein loss and alters substrate oxidation. Am. J. Physiol.-Endocrinol. Metab. 2002, 282, E107–E116. [Google Scholar] [CrossRef] [Green Version]
- Murtas, S.; Aquilani, R.; Deiana, M.L. Differences in amino acid loss between high-efficiency hemodialysis and post-dilution and pre-dilution hemodiafiltration using high convection volume exchange-A new metabolic scenario? A pilot study. J. Ren. Nutr. 2019, 29, 126–135. [Google Scholar] [CrossRef] [Green Version]
- Pupim, L.B.; Flakoll, P.J.; Brouillette, J.R.; Levenhagen, D.K.; Hakim, R.M.; Ikizler, T.A. Intradialytic parenteral nutrition improves protein and energy homeostasis in chronic hemodialysis patients. J. Clin. Investig. 2002, 110, 483–492. [Google Scholar] [CrossRef]
- Kohlová, M.; Amorim, C.G.; Araújo, A.; Santos-Silva, A.; Solich, P.; Montenegro, M.C.B.S.M. The biocompatibility and bioactivity of hemodialysis membranes: Their impact in end-stage renal disease. J. Artif. Organs. 2019, 22, 14–28. [Google Scholar] [CrossRef]
- Krieter, D.H.; Canaud, B. High permeability of dialysis membranes: What is the limit of albumin loss? Nephrol. Dial. Transplant. 2003, 18, 651–654. [Google Scholar] [CrossRef] [Green Version]
- Fouque, D.; Pelletier, S.; Mafra, D.; Chauveau, P. Nutrition and chronic kidney disease. Kidney Int. 2011, 80, 348–357. [Google Scholar] [CrossRef] [Green Version]
- Honeich, N.A.; Woffindin, C.; Matthews, J.N.S.; Goldfinch, M.E.; Turnbull, J. Clinical comparison of high-flux cellulose acetate and synthetic membranes. Nephrol. Dial. Transplant. 1994, 9, 60–66. [Google Scholar]
- Gil, H.W.; Yang, J.O.; Lee, E.Y.; Lee, E.M.; Choi, J.S.; Hong, S.Y. The Effect of Dialysis Membrane Flux on Amino Acid Loss in Hemodialysis Patients. J. Korean Med. Sci. 2007, 22, 598–603. [Google Scholar] [CrossRef] [PubMed]
- Kirsch, A.H.; Lyko, R.; Nilsson, L.G.; Beck, W.; Amdahl, M.; Lechner, P.; Schneider, A.; Wanner, C.; Rosenkranz, A.R.; Krieter, D.H. Performance of hemodialysis with novel medium cut-off dialyzers. Nephrol. Dial. Transplant. 2017, 32, 165–172. [Google Scholar] [CrossRef] [PubMed] [Green Version]
- Meert, N.; Eloot, S.; Schepers, E.; Lemke, H.D.; Dhondt, A.; Glorieux, G.; Landschoot, M.V.; Waterloos, M.A.; Vanholder, R. Comparison of removal capacity of two consecutive generations of high-flux dialysers during different treatment modalities. Nephrol. Dial. Transplant. 2011, 26, 2624–2630. [Google Scholar] [CrossRef] [Green Version]
- Scribner, B.H. A personalized history of chronic hemodialysis. Am. J. Kidney Dis. 1990, 16, 511–519. [Google Scholar] [CrossRef]
- Fagugli, R.M.; De Smet, R.; Buoncristiani, U.; Lameire, N.; Vanholder, R. Behavior of Non–Protein-Bound and Protein-Bound Uremic Solutes During Daily Hemodialysis. Am. J. Kidney Dis. 2002, 40, 339–347. [Google Scholar] [CrossRef]
- Florens, N.; Juillard, L. Large Middle Molecule and Albumin Removal: Why Should We Not Rest on Our Laurels? Contrib. Nephrol. 2017, 191, 178–187. [Google Scholar]
- Krieter, D.H.; Hackl, A.; Rodriguez, A.; Chenine, L.; Moragues, H.L.; Lemke, H.D.; Wanner, C.; Canaud, B. Protein-bound uraemic toxin removal in haemodialysis and post-dilution haemodiafiltration. Nephrol. Dial. Transplant. 2010, 25, 212–218. [Google Scholar] [CrossRef]
- Locatelli, F.; Martin-Malo, A.; Hannedouche, T. Effect of membrane permeability on survival of hemodialysis patients. J. Am. Soc. Nephrol. 2009, 20, 645–654. [Google Scholar] [CrossRef] [Green Version]
- Tiranathanagul, K.; Praditpornsilpa, K.; Katavetin, P.; Srisawat, N.; Townamchai, N.; Susantitaphong, P.; Tungsanga, K.; Eiam-Ong, S. On-line Hemodiafiltration in Southeast Asia: A Three-year Prospective Study of a Single Center. Ther. Apher. Dial. 2009, 13, 56–62. [Google Scholar] [CrossRef]
- Boschetti-de-Fierro, A.; Beck, W.; Hildwein, H.; Krause, B.; Storr, M.; Zweigart, C. Membrane Innovation in Dialysis. Contrib. Nephrol. 2017, 191, 100–114. [Google Scholar] [PubMed]
- Slinin, Y.; Greer, N.; Ishani, A.; MacDonald, R.; Olson, C.; Rutks, I.; Wilt, T.J. Timing of Dialysis Initiation, Duration and Frequency of Hemodialysis Sessions, and Membrane Flux: A Systematic Review for a KDOQI Clinical Practice Guideline. Am. J. Kidney Dis. 2015, 66, 823–836. [Google Scholar] [CrossRef] [PubMed]
- Kneis, C.; Beck, W.; Boenisch, O.; Klefisch, F.; Deppisch, R.; Zickler, D.; Schindler, R. Elimination of Middle-Sized Uremic Solutes with High-Flux and High-Cut-Off Membranes: A Randomized in vivo Study. Blood Purif. 2013, 36, 287–294. [Google Scholar] [CrossRef] [PubMed]
- Gondouin, B.; Hutchison, C.A. High Cut-off Dialysis Membranes: Current Uses and Future Potential. Adv. Chronic Kidney Dis. 2011, 18, 180–187. [Google Scholar] [CrossRef] [PubMed]
- Girndt, M.; Fiedler, R.; Martus, P.; Pawlak, M.; Storr, M.; Bohler, T.; Glomb, M.A.; Liehr, K.; Henning, C.; Templin, M.; et al. High cut-off dialysis in chronic haemodialysis patients. Eur. J. Clin. Investig. 2015, 45, 1333–1340. [Google Scholar] [CrossRef]
- Zickler, D.; Schindler, R.; Willy, K.; Martus, P.; Pawlak, M.; Storr, M.; Hulko, M.; Boehler, T.; Glomb, M.A.; Liehr, K.; et al. Medium Cut-Off (MCO) Membranes Reduce Inflammation in Chronic Dialysis Patients: A Randomized Controlled Clinical Trial. PLoS ONE 2017, 12, e0169024. [Google Scholar] [CrossRef]
- Upadhyay, A.; Jaber, B.L. Reuse and Biocompatibility of Hemodialysis Membranes: Clinically Relevant? Semin. Dial. 2017, 30, 121–124. [Google Scholar] [CrossRef]
- Upadhyay, A. Dialyzer reuse: Is it safe and worth it? Braz. J. Nephrol. 2019, 41, 312–314. [Google Scholar] [CrossRef] [Green Version]
- Lacson, E., Jr.; Lazarus, J.M. Dialyzer best practice: Single use or reuse? Semin. Dial. 2006, 19, 120–128. [Google Scholar] [CrossRef]
- Ribeiro, I.C.; Roza, N.A.V.; Duarte, D.A.; Guadagnini, D.; Elias, R.M.; de Oliveira, R.B. Clinical and microbiological effects of dialyzers reuse in hemodialysis patients. Braz. J. Nephrol. 2019, 41, 384–392. [Google Scholar] [CrossRef]
- Argyropoulos, C.; Roumelioti, M.E.; Sattar, A.; Kellum, J.A.; Weissfeld, L.; Unruh, M.L. Dialyzer Reuse and Outcomes of High Flux Dialysis. PLoS ONE 2015, 10, e0129575. [Google Scholar] [CrossRef] [PubMed] [Green Version]
- Hamid, A.; Dhrolia, M.F.; Imtiaz, S.; Qureshi, R.; Ahmad, A. Comparison of Adequacy of Dialysis between Single-use and Reused Hemodialyzers in Patients on Maintenance Hemodialysis. J. Coll. Physicians Surg. Pak. 2019, 29, 720–723. [Google Scholar] [CrossRef] [PubMed]
- Jofre, R.; Rodriguez-Benitez, P.; Lopez-Gomez, J.M.; Perez-Garcia, R. Inflammatory Syndrome in Patients on Hemodialysis. J. Am. Soc. Nephrol. 2006, 17, S274–S280. [Google Scholar] [CrossRef]
- Poppelaars, F.; Faria, B.; da Costa, M.G.; Franssen, C.F.M.; van Son, W.J.; Berger, S.P.; Daha, M.R.; Seelen, M.A. The Complement System in Dialysis: A Forgotten Story? Front. Immunol. 2018, 9, 71. [Google Scholar] [CrossRef] [PubMed] [Green Version]
- Abe, M.; Hamano, T.; Wada, A.; Nakai, S.; Masakane, I. Effect of dialyzer membrane materials on survival in chronic hemodialysis patients: Results from the annual survey of the Japanese Nationwide Dialysis Registry. PLoS ONE 2017, 12, e0184424. [Google Scholar] [CrossRef] [PubMed] [Green Version]
- Wong, J.; Vilar, E.; Farrington, K. Endotoxemia in End-Stage Kidney Disease. Semin. Dial. 2014, 28, 59–67. [Google Scholar] [CrossRef]
- Gagliardi, G.M.; Rossi, S.; Condino, F.; Mancuso, D.; Greco, F.; Tenuta, R.; Savino, O.; Bonofiglio, R.; Domma, F.; Latorre, G. Malnutrition, infection and arteriovenous fistula failure: Is there a link? J. Vasc. Access 2011, 12, 57–62. [Google Scholar] [CrossRef]
- Dukkipati, R.; Molnar, M.Z.; Park, J.; Jing, J.; Kovesdy, C.P.; Kajani, R.; Kalantar-Zadeh, K. Association of Vascular Access Type with Inflammatory Marker Levels in Maintenance Hemodialysis Patients. Semin. Dial. 2014, 27, 415–423. [Google Scholar] [CrossRef] [Green Version]
- Zavacka, M.; Zelko, A.; Madarasova Geckova, A.; Majernikova, M.; Pobehova, J.; Zavacky, P. Vascular access as a survival factor for the haemodialysis population: A retrospective study. Int. Angiol. 2020. [Google Scholar] [CrossRef]
- Debska-Slizien, A.; Malgorzewicz, S.; Dudziak, M.; Ksiazek, A.; Sulowicz, W.; Grzeszczak, W. Cardiovascular risk in patients undergoing maintenance hemodialysis with Helixone(R) membrane: A multicenter randomized study. Pol. Arch. Med. Wewn. 2014, 124, 593–598. [Google Scholar]
- Movilli, E.; Camerini, C.; Gaggia, P. Total convection affects serum beta2 microglobulin and C-reactive protein but not erythropoietin requirement following post-dilutional hemodiafiltration. Am. J. Nephrol. 2015, 41, 494–501. [Google Scholar] [CrossRef] [PubMed]
- Galli, F.; Benedetti, S.; Floridi, A.; Canestrari, F.; Piroddi, M.; Buoncristiani, E.; Buoncristiani, U. Glycoxidation and inflammatory markers in patients on treatment with PMMA-based protein-leaking dialyzers. Kidney Int. 2005, 67, 750–759. [Google Scholar] [CrossRef] [PubMed] [Green Version]
- Glorieux, G.; Neirynk, N.; Veys, N.; Vanholder, R. Dialysis water and fluid purity: More than endotoxin. Nephrol. Dial. Transplant. 2012, 27, 4010–4021. [Google Scholar] [CrossRef] [Green Version]
- Heumann, D.; Roger, T. Initial responses to endotoxins and Gram-negative bacteria. Clin. Chim. Acta 2002, 323, 59–72. [Google Scholar] [CrossRef]
- Bossola, M.; Stasio, E.D.; Sanguinetti, M.; Posteraro, B.; Antocicco, M.; Pepe, G.; Mello, E.; Bugli, F.; Vulpio, C. Serum Endotoxin Activity Measured with Endotoxin Activity Assay Is Associated with Serum Interleukin-6 Levels in Patients on Chronic Hemodialysis. Blood Purif. 2016, 42, 294–300. [Google Scholar] [CrossRef]
- El-Koraie, A.F.; Naga, Y.S.; Farahat, N.G.; Hazzah, W.A. Endotoxins and inflammation in hemodialysis patients. Hemodial. Int. 2013, 17, 359–365. [Google Scholar] [CrossRef]
- Horl, W.H. Hemodialysis Membranes: Interleukins, biocompatibility, and middle molecules. J. Am. Soc. Nephrol. 2002, 13, 62–71. [Google Scholar]
- Vanholder, R.; Pletinck, A.; Schepers, E.; Glorieux, G. Biochemical and Clinical Impact of Organic Uremic Retention Solutes: A Comprehensive Update. Toxins 2018, 10, 33. [Google Scholar] [CrossRef] [Green Version]
- Biswas, S.K. Does the Interdependence between Oxidative Stress and Inflammation Explain the Antioxidant Paradox? Oxid. Med. Cell Longev. 2016, 2016, 5698931. [Google Scholar] [CrossRef] [PubMed] [Green Version]
- Sanz, A.B.; Sanchez-Nino, M.D.; Ramos, A.M.; Moreno, J.A.; Santamaria, B.; Ruiz-Ortega, M.; Egido, J.; Ortiz, A. NF-κB in Renal Inflammation. J. Am. Soc. Nephrol. 2010, 21, 1254–1262. [Google Scholar] [CrossRef] [PubMed] [Green Version]
- Liakopoulos, V.; Roumeliotis, S.; Zarogiannis, S.; Eleftheriadis, T.; Mertens, P.R. Oxidative stress in hemodialysis: Causative mechanisms, clinical implications, and possible therapeutic interventions. Semin. Dial. 2019, 32, 58–71. [Google Scholar] [CrossRef] [PubMed]
- Navarro-García, J.A.; Rodríguez-Sánchez, E.; Aceves-Ripoll, J.; Abarca-Zabalía, J.; Susmozas-Sánchez, A.; González Lafuente, L.; Bada-Bosch, T.; Hernández, E.; Mérida-Herrero, E.; Praga, M.; et al. Oxidative Status before and after Renal Replacement Therapy: Differences between Conventional High Flux Hemodialysis and on-Line Hemodiafiltration. Nutrients 2019, 11, 2809. [Google Scholar]
- Fatonah, S.; Sulchan, M.; Sofro, M.A.U. Macronutrients, micronutrients intake and inflammation in hemodialysis patients. Potravin. Slovak J. Food Sci. 2019, 13, 891–897. [Google Scholar] [CrossRef] [Green Version]
- Barroso, C.F.; Pires, L.V.; Santos, L.B.; Henriques, G.S.; Pessoa, P.P.; de Araújo, G.N.; de Araújo, C.O.D.; Oliveira, C.M.C.; Maia, C.S.C. Selenium Nutritional Status and Glutathione Peroxidase Activity and Its Relationship with Hemodialysis Time in Individuals Living in a Brazilian Region with Selenium-Rich Soil. Biol. Trace Elem. Res. 2020. [Google Scholar] [CrossRef] [PubMed]
- Silva, R.E.; Simões-E-Silva, A.C.; Miranda, A.S.; Justino, P.B.I.; Brigagão, M.R.P.L.; Moraes, G.O.I.; Gonçalves, R.V.; Novaes, R.D. Potential Role of Nutrient Intake and Malnutrition as Predictors of Uremic Oxidative Toxicity in Patients with End-Stage Renal Disease. Oxid. Med. Cell. Longev. 2019, 2019, 7463412. [Google Scholar] [CrossRef] [PubMed]
- Viramontes Hörner, D.; Selby, N.M.; Taal, M.W. The Association of Nutritional Factors and Skin Autofluorescence in Persons Receiving Hemodialysis. J. Ren. Nutr. 2019, 29, 149–155. [Google Scholar] [CrossRef] [PubMed]
- Almeida, S.G.; Veiga, J.P.; Arruda, S.F.; Neves, C.F.; Siqueira, E.M. The association of markers of oxidative-inflammatory status with malnutrition in hemodialysis patients with serum ferritin lower than 500 ng/mL. J. Bras. Nefrol. 2013, 35, 6–12. [Google Scholar] [CrossRef] [Green Version]
- Kalantar-Zadeh, K.; Ikizler, T.A.; Block, G.; Avram, M.M.; Kopple, J.D. Malnutrition-inflammation complex syndrome in dialysis patients: Causes and consequences. Am. J. Kidney Dis. 2003, 42, 864–881. [Google Scholar] [CrossRef] [Green Version]
- Rippe, B.; Öberg, C.M. Albumin Turnover in Peritoneal and Hemodialysis. Semin. Dial. 2006, 29, 458–462. [Google Scholar] [CrossRef]
- Oliveira, C.M.C.; Kubrusly, M.; Lima, A.T.; Torres, D.M.; Cavalcante, N.M.R.; Jeronimo, A.L.C.; Oliveira, T.C.B. Correlation Between Nutritional Markers and Appetite Self-Assessments in Hemodialysis Patients. J. Ren. Nutr. 2015, 25, 301–307. [Google Scholar] [CrossRef]
- Essadik, R.; Msaad, R.; Lebrazi, H.; Taki, H.; Tahri, E.H.; Kettani, A.; Madkouri, G.; Ramdani, B.; Saïle, R. Assessing the prevalence of protein-energy wasting in haemodialysis patients: A cross-sectional monocentric study. Nephrol. Ther. 2017, 13, 537–543. [Google Scholar] [CrossRef] [PubMed]
- Eloot, S.; Biesen, W.V.; Dhondt, A.; de Wynkele, H.V.; Glorieux, G.; Verdonck, P.; Vanholder, R. Impact of hemodialysis duration on the removal of uremic retention solutes. Kidney Int. 2008, 73, 765–770. [Google Scholar] [CrossRef] [PubMed] [Green Version]
- Stegmayr, B. Dialysis Procedures Alter Metabolic Conditions. Nutrients 2017, 9, 548. [Google Scholar] [CrossRef]
- Depner, T.A. Uremic toxicity: Urea and beyond. Semin. Dial. 2008, 14, 246–251. [Google Scholar] [CrossRef] [PubMed]
- Jansen, J.; Jankowski, J.; Gajjala, P.R.; Wetzels, J.F.M.; Masereeuw, R. Disposition and clinical implications of protein-bound uremic toxins. Clin. Sci. 2017, 131, 1631–1647. [Google Scholar] [CrossRef]
- Deltombe, O.; de Loor, H.; Glorieux, G.; Dhondt, A.; Biesen, W.V.; Meijers, B.; Eloot, S. Exploring binding characteristics and the related competition of different protein-bound uremic toxins. Biochimie 2017, 139, 20–26. [Google Scholar] [CrossRef]
- Kuhlmann, M.K.; Kotanko, P.; Levin, N.W. Hemodialysis: Outcome and Adequacy. In Comprehensive Clinical Nephrology; Johnson, R.J., Feehally, J., Floege, J., Eds.; Elsevier: Philadelphia, PA, USA, 2015; pp. 1075–1083. [Google Scholar]
- Yu, X. The Evolving Patterns of Uremia: Unmet Clinical Needs in Dialysis. Contrib. Nephrol. 2017, 191, 1–7. [Google Scholar]
- Rocco, M.V.; Dwyer, J.T.; Larive, B.; Greene, T.; Cockram, D.B.; Chumlea, W.C.; Kusek, J.W.; Leung, J.; Burrowes, J.D.; Mcleroy, S.L.; et al. The effect of dialysis dose and membrane flux on nutritional parameters in hemodialysis patients: Results of the HEMO Study. Kidney Int. 2004, 65, 2321–2334. [Google Scholar] [CrossRef] [Green Version]
- Jones, C.B.; Bargman, M. Should we look beyond Kt/V urea in assessing dialysis adequacy? Semin. Dial. 2018, 31, 420–429. [Google Scholar] [CrossRef]
- Bossola, M.; Muscaritoli, M.; Tazza, L.; Giungi, S.; Tortorelli, A.; Fanelli, F.R.; Luciani, G. Malnutrition in Hemodialysis Patients: What Therapy? Am. J. Kidney Dis. 2005, 46, 371–386. [Google Scholar] [CrossRef]
- Carrero, J.J.; Aguilera, A.; Stenvinkel, P.; Gil, F.; Selgas, R.; Lindhlm, B. Appetite Discorders in Uremia. J. Ren. Nutr. 2008, 18, 107–112. [Google Scholar] [CrossRef] [PubMed]
- Daugirdas, J.T.; Greene, T.; Chertow, G.M.; Depner, T.A. Can rescaling dose with 6 of dialysis to body surface area in the HEMO study explain the different responses to dose in women versus men? Clin. J. Am. Soc. Nephrol. 2010, 5, 1628–1636. [Google Scholar] [CrossRef] [PubMed] [Green Version]
- Rashidi, A.A.; Soleimani, A.R.; Nikoueinejad, H.; Sarbolouki, S. The Evaluation of Increase in Hemodialysis Frequency on C-Reactive Protein Levels and Nutritional Status. Acta Med. Iran. 2013, 51, 119–124. [Google Scholar] [PubMed]
- Chazot, C.; Jean, G. The advantages and challenges of increasing the duration and frequency of maintenance dialysis sessions. Nature Clin. Pract. Nephrol. 2009, 5, 34–44. [Google Scholar] [CrossRef] [PubMed]
- Jha, V. Current status of end-stage renal disease care in India and Pakistan. Kidney Inter Suppl. 2013, 3, 157–160. [Google Scholar] [CrossRef] [Green Version]
- Jha, V. End-stage renal care in developing countries: The India experience. Ren. Fail. 2004, 26, 201–208. [Google Scholar] [CrossRef]
- Chauhan, R.; Mendonca, S. Adequacy of twice weekly hemodialysis in end stage renal disease patients at a tertiary care dialysis centre. Indian J. Nephrol. 2015, 25, 329–333. [Google Scholar] [CrossRef]
- Daugirdas, J.T. Hemodialysis Treatment Time: As Important as it seems? Semin. Dial. 2017, 30, 93–98. [Google Scholar] [CrossRef]
- Torigoe, A.; Sato, E.; Mori, T.; Ieiri, N.; Takahashi, C.; Ishida, Y.; Hotta, O.; Ito, S. Comparisons of amino acids, body constituents and antioxidative response between long-time HD and normal HD. Hemodial. Int. 2016, 20, S17–S24. [Google Scholar] [CrossRef]
- Tentori, F.; Zhang, J.; Li, Y.; Karaboyas, A.; Kerr, P.; Saran, R. Longer dialysis session length is associated with better intermediate outcomes and survival among patients on in-center three times per week hemodialysis: Results from the Dialysis Outcomes and Practice Patterns Study (DOPPS). Nephrol. Dial. Transplant. 2012, 27, 4180–4188. [Google Scholar] [CrossRef]
- Rezende, L.R.; de Souza, P.B.; Pereira, G.R.M.; Lugon, J.R. Metabolic acidosis in hemodialysis patients: A review. Braz. J. Nephrol. 2017, 39, 305–311. [Google Scholar] [CrossRef]
- Soudan, K.; Ricanati, E.S.; Leon, J.B.; Sehgal, A.R. Determinants of metabolic acidosis among hemodialysis patients. Hemodial. Int. 2006, 10, 209–214. [Google Scholar] [CrossRef]
- Abramowitz, M.K. Bicarbonate Balance and Prescription in ESRD. J. Am. Soc. Nephrol. 2017, 28, 726–734. [Google Scholar] [CrossRef]
- Gennari, F.J. Acid-base considerations in end stage renal disease. In Principles and Practice of Dialysis; Henrich, W.L., Ed.; Lippincott Williams & Wilkins: Philadelphia, PA, USA, 2004; pp. 393–407. [Google Scholar]
- Ikizler, T.A.; Burrowes, J.D.; Byham-Gray, L.D.; Campbell, K.L.; Carrero, J.J.; Chan, W.; Fouque, D.; Friedman, A.N.; Ghaddar, S.; Goldstein-Fuchs, D.J.; et al. KDOQI Clinical Practice Guideline for Nutrition in CKD: 2020 Update. Am J Kidney Dis. 2020, 3, S1–S107. [Google Scholar] [CrossRef] [PubMed]
- Thornley-Brown, D.; Saha, M. Dialysate content and risk of sudden cardiac death. Curr. Opin. Nephrol. Hypertens. 2015, 24, 557–562. [Google Scholar] [CrossRef]
- Mehrotra, R.; Kopple, J.D.; Wolfsin, M. Metabolic acidosis in maintenance dialysis patients: Clinical considerations. Kidney Int. 2003, 64, S13–S25. [Google Scholar] [CrossRef] [Green Version]
- Ikizler, T.A.; Cano, N.J.; Franch, H.; Fouque, D.; Himmelfarb, J.; Kalantar-Zadeh, K.; Kuhlmann, M.K.; Stenvinkel, P.; TerWee, P.; Teta, D.; et al. Prevention and treatment of protein energy wasting in chronic kidney disease patients: A consensus statement by the International Society of Renal Nutrition and Metabolism. Kidney Int. 2013, 84, 1096–1107. [Google Scholar] [CrossRef] [PubMed] [Green Version]
- Stenvinkel, P.; Carrero, J.J.; von Walden, F.; Ikizler, T.A.; Nader, G.A. Muscle wasting in end-stage renal disease promulgates premature death: Established, emerging and potential novel treatment strategies. Nephrol. Dial. Transplant. 2016, 31, 1070–1077. [Google Scholar] [CrossRef] [Green Version]
- DeFronzo, R.A.; Tobin, J.D.; Rowe, J.W.; Andres, R. Glucose intolerance in uremia. Quantification of pancreatic beta cell sensitivity to glucose and tissue sensitivity to insulin. J. Clin. Investig. 1978, 62, 425–435. [Google Scholar] [CrossRef] [PubMed] [Green Version]
- Raj, S.; Scott, D.R.; Nguyen, T.; Sachs, G.; Kraut, J.A. Acid stress increases gene expression of proinflammatory cytokines in Madin-Darby canine kidney cells. Am. J. Physiol. Renal. Physiol. 2013, 304, F41–F48. [Google Scholar] [CrossRef] [Green Version]
- Kellum, J.A.; Song, M.; Li, J. Lactic and hydrochloric acids induce different patterns of inflammatory response in LPS-stimulated RAW 264.7 cells. Am. J. Physiol. Regul. Integr. Comp. Physiol. 2004, 286, R686–R692. [Google Scholar] [CrossRef] [PubMed] [Green Version]
- Soleymanian, T.; Ghods, A. The Deleterious Effect of Metabolic Acidosis on Nutritional Status of Hemodialysis Patients. Saudi J. Kidney Dis. Transplant. 2011, 22, 1149–1154. [Google Scholar]
- Wu, D.Y.; Shinaberger, C.S.; Regidor, D.L.; McAllister, C.J.; Kopple, J.D.; Kalantar-Zadeh, K. Association between serum bicarbonate and death in hemodialysis patients: Is it better to be acidotic or alkalotic? Clin. J. Am. Soc. Nephrol. 2006, 1, 70–78. [Google Scholar] [CrossRef] [Green Version]
- Bommer, J.; Locatelli, F.; Satayathum, S.; Keen, M.L.; Goodkin, D.A.; Saito, A.; Akiba, T.; Port, F.K.; Young, E.W. Association of Predialysis Serum Bicarbonate Levels with Risk of Mortality and Hospitalization in the Dialysis Outcomes and Practice Patterns Study (DOPPS). Am. J. Kidney Dis. 2004, 44, 661–671. [Google Scholar] [CrossRef]
- Misra, M. Pro: Higher serum bicarbonate in dialysis patients is protective. Nephrol. Dial. Transplant. 2016, 31, 1220–1224. [Google Scholar] [CrossRef]
- Kang, S.S.; Chang, J.W.; Park, Y. Nutritional Status Predicts 10-Year Mortality in Patients with End-Stage Renal Disease on Hemodialysis. Nutrients 2017, 9, 399. [Google Scholar] [CrossRef]
- James, G.; Jackson, H. European Guidelines for the Nutritional Care of Adult Renal Patients. EDTNA-ERCA Journal. 2003, 29, 23–43. [Google Scholar] [CrossRef]
- Malaysian Dietetic Association (MDA). Malaysian Medical Nutrition Therapy (MNT) Guidelines for Chronic Kidney Disease; MDA: Kuala Lumpur, Malaysia, 2005. [Google Scholar]
- Cano, N.; Fiaccadori, E.; Tesinsky, P.; Toigo, G.; Druml, W.; Kuhlmann, M.; Mann, H.; Horl, W.H. ESPEN Guidelines on Enteral Nutrition: Adult Renal Failure. Clin. Nutr. 2006, 25, 295–310. [Google Scholar] [CrossRef] [PubMed]
- Sualaheen, A.; Khor, B.H.; Balasubramanian, G.; Sahathevan, S.; Ali, M.S.M.; Narayanan, S.S.; Chinna, K.; Daud, A.A.M.; Khosla, P.; Karupaiah, T. Habitual Dietary Patterns of Patients on Haemodialysis Indicate Nutritional Risk. J. Ren. Nutr. 2020, 30, 322–332. [Google Scholar] [CrossRef]
- Burrowes, J.D.; Larive, B.; Cockram, D.B.; Dwyer, J.; Kusek, J.W.; McLeroy, S.; Poole, D.; Rocco, M.V. Effects of Dietary Intake, Appetite, and Eating Habits on Dialysis and Non–Dialysis Treatment Days in Hemodialysis Patients: Cross-Sectional Results From the HEMO Study. J. Ren. Nutr. 2003, 13, 191–198. [Google Scholar] [CrossRef]
- Harvinder, G.H.; Chee, W.S.S.; Karupaiah, T.; Sahathevan, S.; Chinna, K.; Ghazali, A.; Bavanandan, S.; Goh, B.L. Comparison of malnutrition prevalence between haemodialysis and continuous ambulatory peritoneal dialysis patients: A cross-sectional study. Malays J. Nutr. 2013, 19, 271–283. [Google Scholar]
- Ichikawa, Y.; Hiramatsu, F.; Hamada, H.; Sakai, A.; Hara, K.; Kogirima, M.; Kawahara, K.; Minakuchi, J.; Kawashima, S.; Yamamoto, S. Effect of protein and energy intakes of body composition in non-diabetic maintenance hemodialysis patients. J. Nutr. Sci. Vitaminol. 2007, 53, 410–418. [Google Scholar] [CrossRef] [Green Version]
- Moreira, A.C.; Carolino, E.; Domingos, F.; Gaspar, A.; Ponce, P.; Camili, M.E. Nutritional status influences generic and disease-specific quality of life measures in haemodialysis patients. Nutr. Hosp. 2013, 28, 951–957. [Google Scholar] [PubMed]
- Rocco, M.V.; Paranandi, L.; Burrowes, J.D.; Cockram, D.B.; Dwyer, J.T.; Kusek, J.W.; Leung, J.; Makoff, R.; Maroni, B.; Poole, D. Nutritional Status in the HEMO Study Cohort at baseline. Am. J. Kidney Dis. 2002, 39, 245–256. [Google Scholar] [CrossRef] [PubMed]
- Sahathevan, S.; Se, C.H.; Ng, S.H.; Chinna, K.; Harvinder, G.S.; Chee, W.S.S.; Goh, B.L.; Halim, A.G.; Bavanandan, S.; Ghazali, A.; et al. Assessing protein energy wasting in a Malaysian haemodialysis population using self-reported appetite rating: A cross sectional study. BMC Nephrol. 2015, 16, 99. [Google Scholar] [CrossRef] [Green Version]
- Adanan, N.I.H.; Ali, M.S.M.; Lim, J.H.; Zakaria, N.F.; Lim, C.T.S.; Yahya, R.; Gafr, A.H.A.; Karupaiah, T.; Daud, Z.A.M. Investigating Physical and Nutritional Changes During Prolonged Intermittent Fasting in Hemodialysis Patients: A Prospective Cohort Study. J. Ren. Nutr. 2020, 30, e15–e26. [Google Scholar] [CrossRef] [Green Version]
- Arslan, Y.; Kiziltan, G. Nutrition-Related Cardiovascular Risk Factors in Hemodialysis Patients. J. Ren. Nutr. 2010, 20, 185–192. [Google Scholar] [CrossRef]
- Chauveau, P.; Grigaut, E.; Kolko, A.; Wolff, P.; Combe, C.; Aparicio, M. Evaluation of nutritional status in patients with kidney disease: Usefulness of dietary recall. J. Ren. Nutr. 2007, 17, 88–92. [Google Scholar] [CrossRef] [PubMed]
- Johansson, L.; Hickson, M.; Brown, E.A. Influence of Psychosocial Factors on the Energy and Protein Intake of Older People on Dialysis. J. Ren. Nutr. 2013, 23, 348–355. [Google Scholar] [CrossRef] [PubMed]
- Kalantar-Zadeh, K.; Kopple, J.D.; Deepak, S.; Block, D.; Block, G. Characteristics of Hemodialysis Patients as Obtained by Food Frequency Questionnaire. J. Food Intake Ren. Nutr. 2002, 12, 17–31. [Google Scholar] [CrossRef] [PubMed] [Green Version]
- Kim, H.; Lim, H.; Choue, R. A Better Diet Quality is Attributable to Adequate Energy Intake in Hemodialysis Patients. Clin. Nutr. Res. 2015, 4, 46–55. [Google Scholar] [CrossRef] [PubMed] [Green Version]
- Morais, A.A.C.; Silva, M.A.T.; Faintuch, J.; Vidigal, E.J.; Costa, R.A.; Lyrio, D.C.; Trindade, C.R.; Pitanga, K.K. Correlation of nutritional status and food intake in hemodialysis patients. Clinics 2005, 60, 185–192. [Google Scholar] [CrossRef] [PubMed] [Green Version]
- Shapiro, B.B.; Bross, R.; Morrison, G.; Kalantar-Zadeh, K.; Kopple, J.D. Self-Reported Interview-Assisted Diet Records Underreport Energy Intake in Maintenance Hemodialysis Patients. J. Ren. Nutr. 2015, 25, 357–363. [Google Scholar] [CrossRef] [PubMed] [Green Version]
- Vijayan, M.; Abraham, G.; Alex, M.E.; Vijayshree, N.; Reddy, Y.; Fernando, E.; Mather, M.; Nair, S.; Yuvaraj, A. Nutritional status in stage V dialyzed patient versus CKD patient on conservative therapy across different economic status. Ren. Fail. 2014, 36, 384–389. [Google Scholar] [CrossRef]
- Stumvoll, M.; Meyer, C.; Perriello, G.; Kreider, M.; Welle, S.; Gerich, J. Human kidney and liver gluconeogenesis: Evidence for organ substrate selectivity. Am. J. Physiol. 1998, 274, E817–E826. [Google Scholar] [CrossRef]
- Antunes, A.A.; Delatim Vannini, F.; de Arruda Silveira, L.V.; Martin, L.C.; Barretti, P.; Caramori, J.C. Influence of protein intake and muscle mass on survival in chronic dialysis patients. Ren. Fail. 2010, 32, 1055–1059. [Google Scholar] [CrossRef] [Green Version]
- Pauzi, F.A.; Sahathevan, S.; Khor, B.H.; Narayanan, S.S.; Zakaria, N.F.; Abas, F.; Karupaiah, T.; Daud, Z.A.M. Exploring Metabolic Signature of Protein Energy Wasting in Hemodialysis Patients. Metabolites 2020, 10, 291. [Google Scholar] [CrossRef]
- Gordon, A. (Ed.) Biochemistry of Hypoglycin and Toxic Hypoglycemic Syndrome. In Food Safety and Quality Systems in Developing Countries; Academic Press: San Diego, CA, USA, 2015; pp. 47–61. [Google Scholar]
- Zimmerer, J.L.; Leon, J.B.; Covinsky, K.E.; Desai, U.; Sehgal, A.R. Diet Monotony as a Correlate of Poor Nutritional Intake Among Hemodialysis Patients. J. Ren. Nutr. 2003, 13, 72–77. [Google Scholar] [CrossRef]
- Kalantar-Zadeh, K.; Block, G.; McAllister, C.J.; Humphreys, M.H.; Kopple, J. Appetite and inflammation, nutrition, anemia and clinical outcome in hemodialysis patients. Am. J. Clin. Nutr. 2004, 80, 299–307. [Google Scholar] [CrossRef]
- Beberashvili, I.; Sinuani, I.; Azar, A.; Yasur, H.; Shapiro, G.; Feldman, L.; Averbukh, Z.; Weissgarten, J. IL-6 Levels, Nutritional Status, and Mortality in Prevalent Hemodialysis Patients. Clin. J. Am. Soc. Nephrol. 2011, 6, 2253–2263. [Google Scholar] [CrossRef] [Green Version]
- Lynch, K.E.; Lynch, R.; Curhan, G.C.; Brunelli, S.M. Altered Taste Perception and Nutritional Status among Hemodialysis Patients. J. Ren. Nutr. 2013, 23, 288–295. [Google Scholar] [CrossRef] [PubMed] [Green Version]
- Ekramzadeh, M.; Mazloom, Z.; Jafari, P.; Ayatollahi, M.; Sagheb, M.M. Major Barriers Responsible for Malnutrition in Hemodialysis Patients: Challenges to Optimal Nutrition. Nephro-Urol. Mon. 2014, 6, e23158. [Google Scholar] [CrossRef] [Green Version]
- Bossola, M.; Luciani, G.; Rosa, F.; Tazza, L. Appetite and Gastrointestinal Symptoms in Chronic Hemodialysis Patients. J. Ren. Nutr. 2011, 21, 448–454. [Google Scholar] [CrossRef]
- Tavares, A.P.D.S.R.; Mafra, D.; Leal, V.O.; Gama, M.D.S.; Vieira, R.M.M.F.; Brum, I.S.D.C.; Borges, N.A.; Silva, A.A. Zinc Plasma Status and Sensory Perception in Nondialysis Chronic Kidney Disease Patients. J. Ren. Nutr. 2020. [Google Scholar] [CrossRef] [PubMed]
- Ronveaux, C.C.; Tomé, D.; Raybould, H.E. Glucagon-Like Peptide 1 Interacts with Ghrelin and Leptin to Regulate Glucose Metabolism and Food Intake through Vagal Afferent Neuron Signaling. J Nutr. 2015, 145, 672–680. [Google Scholar] [CrossRef] [PubMed] [Green Version]
- Vanitha, R.N.; Kavimani, S.; Soundararajan, P.; Chamundeeswari, D.; Kannan, G.; Rengarajan, S. Ghrelin and its Association with Nutritional and Inflammatory Status of Patients on Maintenance Hemodialysis in a South Indian Tertiary Care Hospital. Ann. Med. Health Sci. Res. 2016, 6, 146–155. [Google Scholar] [CrossRef] [Green Version]
- Klok, M.D.; Jakobsdottir, S.; Drent, M.L. The role of leptin and ghrelin in the regulation of food intake and body weight in humans: A review. Obes. Rev. 2007, 8, 21–34. [Google Scholar] [CrossRef]
- Ko, Y.T.; Lin, Y.L.; Kuo, C.H.; Lai, Y.H.; Wang, C.H.; Hsu, B.G. Low serum leptin levels are associated with malnutrition status according to malnutrition-inflammation score in patients undergoing chronic hemodialysis. Hemodial. Int. 2020, 24, 221–227. [Google Scholar] [CrossRef]
- Montazerifar, F.; Karajibani, M.; Gorgij, F.; Akbari, O. Malnutrition Markers and Serum Ghrelin Levels in Hemodialysis Patients. Int. Sch. Res. Not. 2014, 2014, 765895. [Google Scholar] [CrossRef] [Green Version]
- Kara, E.; Ahbap, E.; Sahutoglu, T.; Sakaci, T.; Basturk, Y.; Koc, Y.; Sevinc, M.; Akgol, C.; Ucar, Z.A.; Kayalar, A.O.; et al. Elevated serum leptin levels are associated with good nutritional status in non-obese chronic hemodialysis patients. Clin. Nephrol. 2015, 83, 147–153. [Google Scholar] [CrossRef]
- Mafra, D.; Guebre-Egziabher, F.; Cleaud, C.; Arkouche, W.; Mialon, A.; Drai, J.; Fouque, D. Obestatin and ghrelin interplay in hemodialysis patients. Nutrition 2010, 26, 1100–1104. [Google Scholar] [CrossRef] [PubMed]
- Iikuni, N.; Lam, Q.L.K.; Lu, L.; Matarese, G.; Cava, A.L. Leptin and Inflammation. Curr. Immunol. Rev. 2008, 4, 70–79. [Google Scholar] [CrossRef] [PubMed]
- Molfino, A.; Kaysen, G.A.; Chertow, G.M.; Doyle, J.; Delgado, C.; Dwyer, T.; Laviano, A.; Fanelli, F.R.; Johansen, K.L. Validating Appetite Assessment Tools Among Patients Receiving Hemodialysis. J. Ren. Nutr. 2016, 26, 103–110. [Google Scholar] [CrossRef] [PubMed] [Green Version]
- Perez-Fontan, M.; Cordido, F.; Rodriguez-Carmona, A.; Peteiro, J.; Garcia-Naveiro, R.; Garcia-Buela, J. Plasma ghrelin levels in patients undergoing haemodialysis and peritoneal dialysis. Nephrol. Dial. Transplant. 2004, 19, 2095–2100. [Google Scholar] [CrossRef] [Green Version]
- Kursat, S.; Colak, H.B.; Toraman, A.; Tekçe, H.; Ulman, C.; Bayturan, O. Relationship of insulin resistance in chronic haemodialysis patients with inflammatory indicators, malnutrition, echocardiographic parameters and 24 hour ambulatory blood pressure monitoring. Scand. J. Urol. Nephrol. 2010, 44, 257–264. [Google Scholar] [CrossRef]
- Mak, R.H.K.; DeFronzo, R.A. Glucose and insulin metabolism in urea. Nephron 1992, 61, 377–382. [Google Scholar] [CrossRef]
- Siew, E.D.; Ikizler, T.A. Insulin Resistance and Protein Energy Metabolism in Patients with Advanced Chronic Kidney Disease. Semin. Dial. 2010, 23, 378–382. [Google Scholar] [CrossRef]
- O’Sullivan, A.J.; Kelly, J.J. Insulin resistance and protein catabolism in non-diabetic hemodialysis patients. Kidney Int. 2007, 71, 98–100. [Google Scholar] [CrossRef] [Green Version]
- Hung, A.M.; Ikizler, T.A. Factors Determining Insulin Resistance in Chronic Hemodialysis Patients. Lipid Disord. Metab. 2011, 171, 127–134. [Google Scholar]
- Liao, M.T.; Sung, C.C.; Hung, K.C.; Wu, C.C.; Lo, L.; Lu, K.C. Insulin Resistance in Patients with Chronic Kidney Disease. J. Biomed. Biotechnol. 2012, 2012, 691369. [Google Scholar] [CrossRef] [Green Version]
- Grosjean, F.; Esposito, P.; Maccarrone, R.; Libetta, C.; Canton, A.D.; Rampino, T. RBP4: A Culprit for Insulin Resistance in End Stage Renal Disease That Can Be Cleared by Hemodiafiltration. BioMed Res. Int. 2017, 2017, 7270595. [Google Scholar] [CrossRef] [PubMed] [Green Version]
- Yang, Q.; Graham, T.E.; Mody, N. Serum retinol binding protein 4 contributes to insulin resistance in obesity and type 2 diabetes. Nature 2005, 436, 356–362. [Google Scholar] [CrossRef] [PubMed]
- Wolf, G. Serum retinol-binding protein: A link between obesity, insulin resistance, and type 2 diabetes. Nutr. Rev. 2007, 65, 251–256. [Google Scholar] [CrossRef] [PubMed]
- Lecker, S.H.; Goldberg, A.L.; Mitch, W.E. Protein Degradation by the Ubiquitin-Proteasome Pathway in Normal and Disease States. J. Am. Soc. Nephrol. 2006, 17, 1807–1819. [Google Scholar] [CrossRef]
- Rasic-Milutinovic, Z.; Perunicic-Pekovic, G.; Ristic-Medic, D.; Popovic, T.; Glibetic, M.; Djuric, D.M. Insulin resistance and chronic inflammation are associated with muscle wasting in end-stage renal disease patients on hemodialysis. Gen. Physiol. Biophys. 2009, 28, 184–189. [Google Scholar]
- Hui-Ling, W.; Ting-Ting, D.; Shi, L.; Ye, X.; Jun, T.; Wei-Feng, H.; Jin-Yuan, Z. Muscle mass loss and intermuscular lipid accumulation were associated with insulin resistance in patients receiving hemodialysis. Chin. Med. J. 2013, 126, 4612–4617. [Google Scholar]
- Koo, J.R.; Yoon, J.W.; Kim, S.G.; Lee, Y.K.; Oh, K.H.; Kim, G.H.; Kim, H.J.; Chae, D.W.; Noh, J.W.; Lee, S.K.; et al. Association of Depression with Malnutrition in Chronic Hemodialysis Patients. Am. J. Kidney Dis. 2003, 41, 1037–1042. [Google Scholar] [CrossRef]
- Choi, M.J.; Seo, J.W.; Yoon, J.W.; Lee, S.K.; Kim, S.J.; Lee, Y.K.; Noh, J.W.; Koo, J.R. The Malnutrition-Inflammation-Depression- Arteriosclerosis Complex Is Associated with an Increased Risk of Cardiovascular Disease and All-Cause Death in Chronic Hemodialysis Patients. Nephron Clin. Pract. 2012, 122, 44–52. [Google Scholar] [CrossRef]
- Ogrizovic, S.S.; Jovanovic, D.; Dopsaj, V.; Radovic, M.; Sumarac, Z.; Bogavac, S.N.; Stosovic, M.; Stanojevic, M.; Nesic, V. Could depression be a new branch of MIA syndrome? Clin. Nephrol. 2008, 71, 164–172. [Google Scholar] [CrossRef]
- Lopes, M.B.; Silva, L.F.; Lopes, G.B.; Penalva, M.A.; Matos, C.M.; Robinson, B.M.; Lopes, A.A. Additional Contribution of the Malnutrition–Inflammation Score to Predict Mortality and Patient-Reported Outcomes as Compared With Its Components in a Cohort of African Descent Hemodialysis Patients. J. Ren. Nutr. 2017, 27, 45–52. [Google Scholar] [CrossRef]
- Natashia, D.; Yen, M.; Chen, H.M.; Fetzer, S.J. Self-Management Behaviors in Relation to Psychological Factors and Interdialytic Weight Gain among Patients Undergoing Hemodialysis in Indonesia. J. Nurs. Scholarsh. 2019, 51, 417–426. [Google Scholar] [CrossRef] [PubMed]
- Kiajamali, M.; Hosseini, M.; Estebsari, F.; Nasiri, M.; Ashktorab, T.; Abdi, A.; Mahmoudi, A.; Salimi, A.; Abadi, A. Correlation between social support, self-efficacy and health-promoting behavior in hemodialysis patients hospitalized in Karaj in 2015. Electron. Physician 2017, 9, 4820–4827. [Google Scholar] [CrossRef] [PubMed] [Green Version]
- Kara, B.; Caglar, K.; Kilic, S. Nonadherence with diet and fluid restrictions and perceived social support in patients receiving hemodialysis. J. Nurs. Scholarsh. 2007, 39, 243–248. [Google Scholar] [CrossRef]
- Dilek, E.; Kocaoz, S. Adherence to diet and fluid restriction of individuals on hemodialysis treatment and affecting factors in Turkey. Jpn. J. Nurs. Sci. 2015, 12, 113–123. [Google Scholar]
- Anees, M.; Batool, S.; Imtiaz, M.; Ibrahim, M. Socio-economic factors affecting quality of life of hemodialysis patients and its effects on mortality. Pak. J. Med Sci. 2018, 34, 811–816. [Google Scholar] [CrossRef] [PubMed]
- Lopes, A.A.; Elder, S.J.; Ginsberg, N.; Andreucci, V.E.; Cruz, J.M.; Fukuhara, S.; Mapes, D.L.; Saito, A.; Pisoni, R.L.; Saran, R.; et al. Lack of appetite in haemodialysis patients—Associations with patient characteristics, indicators of nutritional status and outcomes in the international DOPPS. Nephrol. Dial. Transplant. 2007, 22, 3538–3546. [Google Scholar] [CrossRef] [PubMed] [Green Version]
- Untas, A.; Thumma, J.; Rascle, N.; Rayner, H.; Mapes, D.; Lopes, A.A.; Fukuhara, S.; Akizawa, T.; Morgenstern, H.; Robinson, B.M.; et al. The Associations of Social Support and Other Psychosocial Factors with Mortality and Quality of Life in the Dialysis Outcomes and Practice Patterns Study. Clin. J. Am. Soc. Nephrol. 2011, 6, 142–152. [Google Scholar] [CrossRef] [PubMed] [Green Version]
- Clark-Cutaia, M.N.; Sevick, M.A.; Thurheimer-Cacciotti, J.; Hoffman, L.A.; Snetselaar, L.; Burke, L.E.; Zickmund, S.L. Perceived Barriers to Adherence to Hemodialysis Dietary Recommendations. Clin. Nurs. Res. 2018, 28, 1009–1029. [Google Scholar] [CrossRef]
- Freitas, A.T.V.; Vaz, I.M.F.; Ferraz, S.F.; Peixoto, M.R.G.; Campos, M.I.V.M. Prevalence of malnutrition and associated factors in hemodialysis patients. Rev. Nutr. 2014, 27, 357–366. [Google Scholar] [CrossRef] [Green Version]
- Gebrie, M.H.; Ford, J.A. Depressive symptoms and dietary nonadherence among end stage renal disease patients undergoing hemodialysis therapy: Systematic review. BMC Nephrol. 2019, 20, 429. [Google Scholar] [CrossRef] [Green Version]
- Bujang, M.A.; Musa, R.; Liu, W.J.; Chew, T.F.; Lim, C.T.S.; Morad, Z. Depression, anxiety and stress among patients with dialysis and the association with quality of life. Asian J. Psychiatr. 2015, 18, 49–52. [Google Scholar] [CrossRef]
- Koo, J.R.; Yoon, J.Y.; Joo, M.H.; Lee, H.S.; Oh, J.E.; Kim, S.G.; Seo, J.W.; Kim, H.J.; Noh, J.W.; Lee, S.K.; et al. Treatment of Depression and Effect of Antidepression Treatment on Nutritional Status in Chronic Hemodialysis Patients. Am. J. Med. Sci. 2005, 329, 1–5. [Google Scholar] [CrossRef] [Green Version]
- Cukor, D.; Cohen, S.D.; Peterson, R.A.; Kimmel, P.L. Psychosocial Aspects of Chronic Disease: ESRD as a Paradigmatic Illness. J. Am. Soc. Nephrol. 2007, 18, 3042–3055. [Google Scholar] [CrossRef] [PubMed]
- Liu, X.; Yang, X.; Yao, L.; Zhang, Q.; Sun, D.; Zhu, X.; Xu, T.; Liu, Q.; Wang, L. Prevalence and related factors of depressive symptoms in hemodialysis patients in northern China. BMC Psychiatr. 2017, 17, 128. [Google Scholar] [CrossRef] [PubMed] [Green Version]
- Huang, B.; Lai, B.; Xu, L.; Wang, Y.; Cao, Y.; Yan, P.; Chen, J. Low employment and low willingness of being reemployed in Chinese working-age maintained hemodialysis patients. Ren. Fail. 2017, 39, 607–612. [Google Scholar] [CrossRef]
- Tangvoraphonkchai, K.; Davenport, A. Extracellular Water Excess and Increased Self-Reported Fatigue in Chronic Hemodialysis Patients. Ther. Apher. Dial. 2018, 22, 152–159. [Google Scholar] [CrossRef] [PubMed]
- Hatthakit, U. Lived experiences of patients on hemodialysis: A meta-synthesis. Nephrol. Nurs. J. 2012, 39, 295–304. [Google Scholar]
- Helanterä, I.; Haapio, M.; Koskinen, P.; Grönhagen-Riska, C.; Finne, P. Employment of Patients Receiving Maintenance Dialysis and After Kidney Transplant: A Cross-sectional Study from Finland. Am. J. Kidney Dis. 2012, 59, 700–706. [Google Scholar] [CrossRef] [PubMed]
- Jules, D.E.S.; Woolf, K.; Pompeii, M.L.; Sevick, M.A. Exploring Problems in Following the Hemodialysis Diet and Their Relation to Energy and Nutrient Intakes: The BalanceWise Study. J. Ren. Nutr. 2016, 26, 118–124. [Google Scholar] [CrossRef] [Green Version]
- Painter, P.; Roshanravan, B. The association of physical activity and physical function with clinical outcomes in adults with chronic kidney disease. Curr. Opin. Nephrol. Hypertens. 2013, 22, 615–623. [Google Scholar] [CrossRef]
- Painter, P. Physical functioning in end-stage renal disease patients: Update 2005. Hemodial. Int. 2005, 9, 218–235. [Google Scholar] [CrossRef] [PubMed]
- Bossola, M.; Marzetti, E.; Stasio, E.D.; Monteburini, T.; Cenerelli, S.; Mazzoli, K.; Parodi, E.; Sirolli, V.; Santarelli, S.; Ippoliti, F.; et al. Prevalence and associated variables of postdialysis fatigue: Results of a prospective multicenter study. Nephrology 2018, 23, 552–558. [Google Scholar] [CrossRef] [PubMed]
- Bonner, A.; Wellard, S.; Caltabiano, M. The impact of fatigue on daily activity in people with chronic kidney disease. J. Clin. Nurs. 2010, 19, 3006–3015. [Google Scholar] [CrossRef] [PubMed]
- Tchape, O.D.M.; Tchapoga, Y.B.; Atuhaire, C.; Priebe, G.; Cumber, S.N. Physiological and psychosocial stressors among hemodialysis patients in the Buea Regional Hospital, Cameroon. Pan Afr. Med. J. 2018, 30, 49. [Google Scholar] [PubMed]
- Abdulan, I.M.; Onofriescu, M.; Stefaniu, R.; Mastaleru, A.; Mocanu, V.; Alexa, I.D.; Covic, A. The predictive value of malnutrition for functional and cognitive status in elderly hemodialysis patients. Int. Urol. Nephrol. 2019, 51, 155–162. [Google Scholar] [CrossRef]


| Reference | Sample Size (n) | Predictors of Mortality | |||
|---|---|---|---|---|---|
| Bradbury et al., 2007 [34] | 4802 | Months | BMI < 20 kg/m2 | Ser.Alb < 3.5 g/L | |
| (AHR 95% CI) | |||||
| <4 | 0.98 (0.67–1.44) | 1.57 (1.18–2.09) | |||
| 4–12 | 1.38 (0.98–1.94) | 1.27 (1.00–1.63) | |||
| >12 | 1.19 (0.93–1.53) | 1.41 (1.17–1.70) | |||
| Lukowsky et al., 2012 [20] | 18,707 | Months | BMI increase by 2 index points | Ser.Alb < 3.5 g/L | nPCR > 1.0 g/kg/day |
| (AHR 95% CI) | |||||
| <3 | 0.92 (0.90–0.94) | 2.56 (2.30–2.84) | 1.21 (1.06–1.38) | ||
| 4–6 | 0.93 (0.91–0.95) | 2.04 (1.81–2.31) | 0.96 (0.80–1.14) | ||
| 7–12 | 0.94 (0.92–0.96) | 1.89 (1.70–2.10) | 0.89 (0.74–1.07) | ||
| McQuillan et al., 2015 [22] | 4807 | Months | BMI <18.5 kg/m2 | ||
| <3 | AHR (95% CI) = 4.22 (3.12–5.17) | ||||
| Murray et al., 2018 [35] | 227 | Parameters | CPH | p-value | |
| BMI | 0.97 (0.85–1.11) | 0.625 | |||
| Ser.Alb | 0.40 (0.12–1.39) | 0.149 | |||
| Undefined malnutrition (using clinical judgment) | 4.70 (0.25–88.78) | 0.302 | |||
| Parameters Associated to Mortality Risk | References |
|---|---|
| Body mass index | Caetano et al., 2016 [11]; Pifer et al., 2002 [36] |
| Mid-arm muscle circumference | Araujo et al., 2006 [33] |
| Fat tissue index | Caetano et al., 2016 [11] |
| Lean tissue index | Dekker et al., 2016 [37]; Rosenberger et al., 2014 [38] |
| Serum albumin | Araujo et al., 2006 [33]; Pifer et al., 2002 [36], Caetano et al., 2016 [11] |
| Serum prealbumin | Chertow et al., 2005 [39] |
| Modified subjective global assessment (severe malnutrition) | Pifer et al., 2002 [36] |
| Geriatric Nutritional Risk Index | Takahashi et al., 2014 [5] |
| Dietary energy intake | Araujo et al., 2006 [33] |
| Types of Membrane | Nutrient Losses | References |
|---|---|---|
| Cellulosic | 7–8 g of amino acids | Wolfson et al., 1982 [42]; Ikizler et al., 1994 [43] |
| Cellulose acetate with HF | 3 g of protein | Honeich et al., 1994 [51] |
| Cellulose triacetate with HF | 4 g of protein | Honeich et al., 1994 [51] |
| Low flux | 5–6 g of amino acids | Ikizler et al., 1994 [43]; Gil et al., 2007 [52] |
| High flux | 5–8 g of amino acids | Ikizler et al., 1994 [43]; Gil et al., 2007 [52] |
| 3–8 g of protein | Honeich et al., 1994 [51]; Salame et al., 2018 [44]; Ikizler et al., 1994 [43] | |
| Medium cutoff | 3–7 g of albumin | Kirsch et al., 2017 [53] |
| Hemodiafiltration | 4–6 g of albumin | Meert et al., 2011 [54] |
| 9 g of protein | Salame et al., 2018 [44] |
| Reference | Treatment Duration (Months) | Type of Membrane | Inflammatory Marker Outcomes |
|---|---|---|---|
| Dębska-Ślizień et al., 2014 [80] | 6 | Polysulfone (low flux) | CRP: 9.3 ± 19.5 to 6.0 ± 6.9 mg/dL |
| Polysulfone (high flux) | CRP: 12.2 ± 27.8 to 6.5 ± 9.2 mg/dL | ||
| Movili et al., 2015 [81] | 12 | Usual hemodialysis | CRP: 5.1 ± 6.8 to 5.3 ± 5.0 mg/dL |
| Hemodiafiltration | CRP: 6.8 ± 7.0 to 2.3 ± 2.4 mg/dL | ||
| Zickler et al., 2017 [66] | 1 | Polyarylethersulfone/polyvinylpyrrolidone (medium cutoff) | TNF-α: 24.1 ± 8.1 to 20.6 ± 5.8 pg/mL IL-6: 9.0 ± 13.2 to 6.0 ± 5.9 pg/mL CRP: 15.3 ± 30.0 to 9.3 ± 14.5 mg/dL |
| Polyarylethersulfone/polyvinylpyrrolidone (high flux) | TNF-α: 23.4 ± 7.3 to 22.0 ± 6.0 pg/mL IL-6: 9.8 ± 20.5 to 5.5 ± 4.5 pg/mL CRP: 13.4 ± 25.5 to 9.6 ± 15.7 mg/dL | ||
| Galli et al., 2005 [82] | 6 | Polymethylmethacrylate (high flux) | TNF-α: 18.7 ± 4.3 to 15.1 ± 3.1 a pg/mL IL-6: 5.0 ± 1.9 to 3.1 ± 0.6 a pg/mL CRP: 22.7 ± 33.9 to 12.1 ± 9.1 mg/dL |
| Cellulose acetate/cuprammonium rayon (low flux) | TNF-α: 19.0 ± 4.0 to 21.5 ± 5.5 pg/mL IL-6: 5.3 ± 2.1 to 5.8 ± 2.3 pg/mL CRP: 25.8 ± 28.6 to 27.4 ± 24.0 mg/dL |
| Author/Year | Country | Sample Size, n | DEI (kcal/kg BW)/day | DPI (g/kg BW/day) | Dietary Inadequacy a |
|---|---|---|---|---|---|
| Large Cross-Sectional/Cohort Studies (n > 100) | |||||
| Suaheleen et al., 2020 [142] | Malaysia | 382 | 24.9 ± 5.2 | 0.90 ± 0.29 | DEI: 52% DPI: 40% |
| Burrowes et al., 2003 [143] | United States | 1901 | 22.70 ± 8.30 | 0.93 ± 0.35 | - |
| Harvinder et al., 2013 b [144] | Malaysia | 155 | 25.5 ± 8.5 | 1.07 ± 0.47 | DEI: 75% DPI: 67% |
| Ichikawa et al., 2007 b [145] | Japan | 200 | 29.3 | 1.08 ± 0.17 | - |
| Kang et al., 2017 [138] | Korea | 144 | 25.8 ± 5.4 | 0.88 ± 0.23 | - |
| Moreira et al., 2013 [146] | Portugal | 130 | 25.8 | 1.27 | DEI: 74.6% DPI: 32.3% |
| Rocco et al., 2002 [147] | United States | 1000 | 22.90 ± 8.40 | 0.93 ± 0.36 | DEI: 92% DPI: 81% |
| Sahathevan et al., 2015 [148] | Malaysia | 205 | 23.12 ± 6.94 | 0.94 ± 0.39 | DEI: 65% DPI: 42% |
| Small-Scale Studies (n < 100) | |||||
| Adanan et al., 2019 [149] | Malaysia | 54 | 21.8 ± 4.8 | 0.7 ± 0.2 | - |
| Arslan and Kiziltan, 2010 [150] | Turkey | 93 | 34.20 ± 8.89 | 0.94 ± 0.26 | - |
| Chauveau et al., 2007 [151] | France | 99 | 29.80 ± 7.50 | 1.18 ± 0.28 | - |
| Johansson et al., 2013 b [152] | England | 53 | 24.30 ± 6.70 | 0.97 ± 0.25 | - |
| Kalantar-Zadeh et al., 2002 [153] | United States | 30 | 26.40 ± 15.30 | 0.88 ± 0.57 | - |
| Kim et al., 2015 [154] | Korea | 63 | 21.90 ± 6.70 | 0.90 ± 0.30 | - |
| Morais et al., 2005 [155] | Brazil | 44 | 20.70 ± 6.70 | 1.20 ± 0.60 | - |
| Shapiro et al., 2015 [156] | United States | 13 | 25.4 ± 7.4 | 1.03 ± 0.32 | - |
| Vijayan et al., 2014 [157] | India | 98 | 31.3 | 0.98 | - |
| Author/Year | Country | Patient No. | Follow-Up | DEI (kcal/ kg BW)/day | Hazard Ratio (95% CI) | DPI (g/kg BW/day) | Hazard Ratio (95% CI) | ||
|---|---|---|---|---|---|---|---|---|---|
| Survivors | Non-Survivors | Survivors | Non-Survivors | ||||||
| Antunes et al., 2010 a [159] | Brazil | 79 | 33 (17–38) months | 25.9 (22.0–29.8) | 22.0 (18.0–26.0) b | - | 1.20 (0.86–1.47) | 0.93 (0.90–1.1) | DPI < 1.2g/kg: 4.98 (1.47–16.86) b |
| Araujo et al., 2006 [33] | Brazil | 344 | 10 years | 27.4 ± 8.9 | 23.5 ± 7.4 b | 0.96 (0.92–0.99) b | 1.01 ± 0.38 | 0.92 ± 0.34 c | - |
| Beberashvili et al., 2011 [164] | Israel | 85 | 2 years | 20.8 ± 5.4 | 19.1 ± 1.4 | - | 0.88 ± 0.24 | 0.81 ± 0.10 | - |
| Kang et al., 2017 [138] | Korea | 144 | 10 years | 26.7 ± 5.8 | 24.3 ± 4.2 b | DEI <25 kcal/kg: 1.86 (1.02–3.40) b | 0.91 ± 0.21 | 0.82 ± 0.24 b | DPI < 0.8g/kg: 1.35 (0.77–2.35) |
| Associations | References |
|---|---|
| Poor Appetite | |
| BMI, MAC, MAMC, and MAMA | Bossola et al., 2011 [167]; Sahathevan et al., 2015 [148] |
| Muscle mass as per BCM, LTM, and LBM index measures | Ekramzadeh et al., 2014 [166]; Sahathevan et al., 2015 [148]; Oliveira et al., 2015 [100] |
| Serum albumin, serum prealbumin and nPCR/nPNA | Molfino et al., 2015 [177]; Oliveira et al., 2015 [100]; Bossola et al., 2011 [167]; Kalantar-Zadeh et al., 2004 [163] |
| hsCRP | Sahathevan et al., 2015 [148]; Kalantar-Zadeh et al., 2004 [163] |
| DMS, MIS and PG-SGA | Sahathevan et al., 2015 [148] |
| Ekramzadeh et al., 2014 [66]; Kalantar-Zadeh et al., 2004 [163] | |
| GNRI | Oliveira et al., 2015 [100] |
| Overall food intake of < 50% | Molfino et al., 2015 [177] |
| DEI and DPI | Sahathevan et al., 2015 [148] |
| Ghrelin | |
| BMI | Mafra et al., 2010 [175] |
| Serum albumin and nPNA | Perez-Fontan et al., 2004 [178] |
| MIS | Vanita et al., 2016 [170] |
| SGA | Perez-Fontan et al., 2004 [178] |
| Leptin | |
| BMI, leptin | Montazerifar et al., 2015 [173] |
| Serum albumin, leptin | Montazerifar et al., 2015 [173] |
| DMS and MIS, leptin | Kursat et al., 2010 [179]; Ko et al., 2020 [172] |
| Associations | References |
|---|---|
| Depression | |
| BMI, TSF, and MAMC | Koo et al., 2003 [191] |
| Serum albumin, creatinine, hemoglobin, nPCR | Koo et al., 2003 [191]; Choi et al., 2012 [192]; Ogrizovic et al., 2008 [193] |
| Inflammation markers | Choi et al., 2012 [192]; Ogrizovic et al., 2008 [193] |
| SGA | Koo et al., 2003 [191] |
| MIS | Lopes et al., 2017 [194] |
| QoL | Natashia et al., 2019 [195] |
| Lack of social support | |
| Adherence to dietary restriction | Kiajamali et al., 2017 [196]; Kara et al., 2007 [197]; Dilek and Kocaoz, 2015 [198]; Aness et al., 2018 [199] |
| Appetite | Lopes et al., 2007 [200] |
| QoL | Untas et al., 2011 [201] |
| Financial constraints | |
| Access to purchase food | Clark-Cutaia et al., 2018 [202]; Ekramzadeh et al., 2014 [166] |
| Adherence to dietary restriction | Clark-Cutaia et al., 2018 [202] |
| SGA | Freitas et al., 2014 [203] |
| MIS | Freitas et al., 2014 [203] |
Publisher’s Note: MDPI stays neutral with regard to jurisdictional claims in published maps and institutional affiliations. |
© 2020 by the authors. Licensee MDPI, Basel, Switzerland. This article is an open access article distributed under the terms and conditions of the Creative Commons Attribution (CC BY) license (http://creativecommons.org/licenses/by/4.0/).
Share and Cite
Sahathevan, S.; Khor, B.-H.; Ng, H.-M.; Abdul Gafor, A.H.; Mat Daud, Z.A.; Mafra, D.; Karupaiah, T. Understanding Development of Malnutrition in Hemodialysis Patients: A Narrative Review. Nutrients 2020, 12, 3147. https://doi.org/10.3390/nu12103147
Sahathevan S, Khor B-H, Ng H-M, Abdul Gafor AH, Mat Daud ZA, Mafra D, Karupaiah T. Understanding Development of Malnutrition in Hemodialysis Patients: A Narrative Review. Nutrients. 2020; 12(10):3147. https://doi.org/10.3390/nu12103147
Chicago/Turabian StyleSahathevan, Sharmela, Ban-Hock Khor, Hi-Ming Ng, Abdul Halim Abdul Gafor, Zulfitri Azuan Mat Daud, Denise Mafra, and Tilakavati Karupaiah. 2020. "Understanding Development of Malnutrition in Hemodialysis Patients: A Narrative Review" Nutrients 12, no. 10: 3147. https://doi.org/10.3390/nu12103147