User Experience (UX) in Business, Management, and Psychology: A Bibliometric Mapping of the Current State of Research


1
Faculty of Economics and Social Sciences, University of Potsdam, 14482 Potsdam, Germany
2
Institute of Entrepreneurship & Innovation, University of Stuttgart, 70569 Stuttgart, Germany
3
Mads Clausen Institute, University of Southern Denmark, 6400 Sønderborg, Denmark
*
Author to whom correspondence should be addressed.
Multimodal Technol. Interact. 2020, 4(2), 18; https://doi.org/10.3390/mti4020018
Submission received: 31 March 2020
/
Revised: 8 May 2020
/
Accepted: 14 May 2020
/
Published: 16 May 2020
(This article belongs to the Special Issue Understanding UX through Implicit and Explicit Feedback)
Abstract
:User Experience (UX) describes the holistic experience of a user before, during, and after interaction with a platform, product, or service. UX adds value and attraction to their sole functionality and is therefore highly relevant for firms. The increased interest in UX has produced a vast amount of scholarly research since 1983. The research field is, therefore, complex and scattered. Conducting a bibliometric analysis, we aim at structuring the field quantitatively and rather abstractly. We employed citation analyses, co-citation analyses, and content analyses to evaluate productivity and impact of extant research. We suggest that future research should focus more on business and management related topics.
1. Introduction
User Experience (UX), as a central concept of modern digital business strategies, has developed to a significant success factor to deliver optimized products to customers [1]. Due to its popularity, it can be considered as a buzzword [2,3]. UX exceeds the provision of sole functionality of products and adds an explicit user orientation [4].
For businesses, it is particularly important to adopt a successful UX approach when perceptions of digital products and customer loyalty are involved. Intuitive user experience of software can increase the efficiency of organizational processes [5]. Companies selling UX-optimized software or other digital products expect profit and sales increases from this. At the same time, development costs can be saved if only relevant features for the customer are integrated into a product [5]. Besides, customers have been taking functioning product features for granted already for a long time [4] and clearly expect “more”.
UX is mostly associated with the design and presentation of online software solutions such as websites or apps [1]. The associated field of human-computer interaction (HCI) started back in the 1950s with the elaboration of conventions and rules for interactive user interfaces [1,3]. However, the fundamental understanding of UX takes up the subjective experience of products both physically and non-physically [3,5].
The strongly increasing interest in UX in both practice and research lead to a vast amount of scholarly publications, in a rather short time frame. This leaves researchers with a situation of an information overload [6], which calls for attempts to structure the field. A traditional way for this are literature reviews [7]. However, this qualitative approach is subjective in nature and therefore involves the risk of biases. Additionally, due to the broad scope of UX, existing literature reviews focus on partial aspects of UX. For example, Zarour and Alharbi reviewed UX dimensions which could be subject to evaluation [8]. Similarly, Vermeeren et al. reviewed UX evaluation methods [9]. More specifically, Jurca et al. integrate UX with agility [10] and reviewed evaluation and validation studies of Agile-UX [11]. More holistic reviews, to our knowledge, do not exist yet and attempts could be impeded by the multi-faceted nature of UX and its still blurred conceptualization.
In this situation, bibliometrics can compile a rather abstract overview by statistically, and therefore, quantitatively and objectively structuring a large dataset of publications with a multi-faceted range of sub-topics. Due to these properties, bibliometric analyses have become increasingly popular in many disciplines and research areas in recent years (e.g., [6,12,13,14]) and are potentially useful also for mapping UX research. The number of publications and their overall development symbolizes the past [15]. The present is represented by citing behavior across. Statements about future research relate to the determination of the dynamics of publications and their citations [15]. Bibliometric analyses clearly show which researchers engage in a field, which trends have emerged in the past, and which may become a topic in the future (e.g., [7,12,13,14]). However, bibliometrics cannot replace literature reviews. For a qualitative, content-based rather than abstract, statistical view on UX, we refer to the mentioned existing and future reviews.
Therefore, our study aims to identify the most productive researchers, journals, and countries, and maps the main research areas of the UX field within the disciplines of business, management, and psychology. This disciplinary restriction is helpful for researchers in these fields to understand on which questions and concepts UX focuses here, in contrast to other disciplines.
The paper is structured as follows: In the next section, the term UX is defined and briefly conceptualized. We then explain bibliometric analysis in general and the specific analyses we conducted in particular. The results are presented both descriptively and visually and then discussed. We conclude with a comprehensive review of the topic, limitations of the study, and suggestions for future research.
Our findings contribute to the UX literature by providing an overview of extant UX research in a quantitative and objective manner.
2. User Experience (UX)
Norman first coined UX in 1993 by joining the Apple product team as a “User Experience Designer” [1,16]. The job title emphasizes that a product or service needs to offer more value beyond usability [1].
In scholary research, the UX concept is characterized by ambiguous and diverse expressions (e.g., “usability” or “user acceptance”), which impedes an accurate definition [17,18,19]. One reason for this is that usability is considered as a sub-concept of UX [1]. Usability is a necessary component of UX [17,18]. Nevertheless, the statements by Hassenzahl and Tractinsky are still widespread: “UX takes a ‘human’ perspective. It is interested in understanding the role of affect as an antecedent, a consequence, and a mediator of technology use.” ([19] p. 93)
Parts of the term UX have now been established as standard ISO 9241-210 which is defined by the International Organization for Standardization (ISO) [20,21]. While usability focuses on the process during the use of a (digital) product, UX also includes the process before and after its use [1,20,21]. User Experience is the subjective perception made by the user of a product. Usability, on the contrary, refers to the usage behavior and the purpose of the use. However, to create long-term brand loyalty and keep users satisfied, simple usability has already long been not sufficient any more. The focus of UX picks up emotional factors and aims at a positive and confidence-building experience with the medium [2,4,18,19]: “UX is a consequence of a user’s internal state (predispositions, expectations, needs, motivation, mood, etc.), the characteristics of the designed system (e.g., complexity, purpose, usability, functionality, etc.) and the context (or the environment) within which the interaction occurs (e.g., organizational/social setting, meaningfulness of the activity, voluntariness of use, etc.).” ([6] p. 95).
3. Methodology
Bibliometric methods analyze publications in a specific research field statistically to map the current state of research quantitatively and objectively [22,23,24,25]. Their main focus is on citations which are considered to represent the impact of research [23,26].
3.1. Procedure
In order to map the UX research field multidimensionally, we employed several bibliometric methods. Specifically, we employed citation analyses, co-occurrence analyses, and co-citation analyses in order to provide structured information about research on UX. The descriptive analysis in terms of a citation analysis of the number of titles, number of citations, the listing of the research areas, and the corresponding sources form the basis of the study. The number of publications reflects the productivity of the research field. The citation frequency reflects the respective impact [23,26]. The quantitative overview ensures a high degree of objectivity [23]. Based on this, meaningful conclusions can be drawn about the perception of publications in the scientific network [15]. The quantification in the first step, therefore, helps to structure the data. The number of publications carries out an output analysis on the exclusive basis of articles, book contributions or book chapters, book reviews, and editorial material.
The results of the quantitative analysis are decisive for the co-occurrence analysis [27]. Included are the keywords of the authors and the keywords. Furthermore, the bibliographic map based on most frequent title and abstract words, as well as the productivity of the authors and countries, are included. For further structuring of the subject area, a co-citation map of the authors, as well as the sources, are created. The structuring allows conclusions to be drawn about the intellectual origins of individual authors and relevant fields of research [14,28]. Statements about future specialist areas can be formulated more precisely. The method intends to highlight similarities between authors or sources [28]. If units are frequently quoted together, their content is probably thematically related [23]. A subsequent content analysis by listing the 20 most frequently cited articles of the data set shows significant articles and, thus, also authors on the topic of UX.
The indicators, such as frequencies or the H-index, are used for quantitative analyses. The H-index is beneficial to balance the weight of particularly frequently cited, older publications, and less frequently cited publications, thus creating a comparison factor despite different numbers of citations [29,30,31]. The H-index further includes the impact of the publications [29,30]. Although the H-index compares researchers, it is usable as an output factor for several groups [24,25]. The initial definition by Hirsch ([30] p. 16569) is: “A scientist has index h if h of his or her Np papers have at least h citations each and the other (Np−h) papers have ≤ h citations each.” For example, an H-index of 15 means that 15 publications have at least 15 citations. The mentioned H-indexes originate from Scimago and Scopus (from the 1st of February 2020).
The VOSviewer was used for bibliographic processing of the main results and is a central component of the perception analysis. The software program is a freeware program for the processing and subsequent mapping of bibliometric data [27,32]. To display relations of single elements, the distance-based visualization approach of the software as a co-occurrence visualization is useful [33]. The mapping of elements and their distances led to the name of the software, as “VOS” stands for “visualization of similarities.” ([24] p. 294). The preparation of data also makes a subsequent interpretation of the results useful [27,32]. The overlay visualization is identical to the co-occurrence analysis with the difference that the colors indicate the average publication year of the keyword [27,32]. The tool is particularly useful for the visualization of a large data set [24,31]. Thus, beyond the pure quantitative evaluation of the results, additional links can be displayed.
3.2. Sample
The investigation uses, like Vallaster et al., publications from the Web of Science (WoS) Core database [34]. The metadata from the WoS is particularly well suited for bibliometric analyses, as they contain useful information such as the number of citations, abstracts, or references [24,35].
The keyword research performed via WoS using the terms “User Experience” and “UX” combined with the Boolean operator “OR.” The keywords in the title (1) produced 2115 results. They are limited to the areas of business, management, multidisciplinary, and applied psychology—the number of articles reduced to 135. In topic (2), this keyword search initially resulted in 11,793 articles. Restricted to the relevant area of investigation, the result is 345 articles. The combination of the keyword search (1) and (2) with the Boolean operator “OR” results in a total of 411 articles. In a further step, we removed proceedings and reviews.
Furthermore, in the WoS category overview, further articles were removed that were assigned to areas such as oncology, psychiatry, or biochemical social science. In particular, the study excluded articles that mentioned UX or user experience once in the abstract. For a further material selection, articles were removed from the analysis that were published in journals which are assigned to a Q3 or Q4 rating at the Scimago Journal Ranking. The selection resulted in a final dataset of 189 publications with a period from 1983 to December 2019. The dataset performed individual analyses of descriptive causes, co-occurrence analysis, productivity analysis, co-citation analysis, and content analysis.
4. Results
4.1. Number of Publications
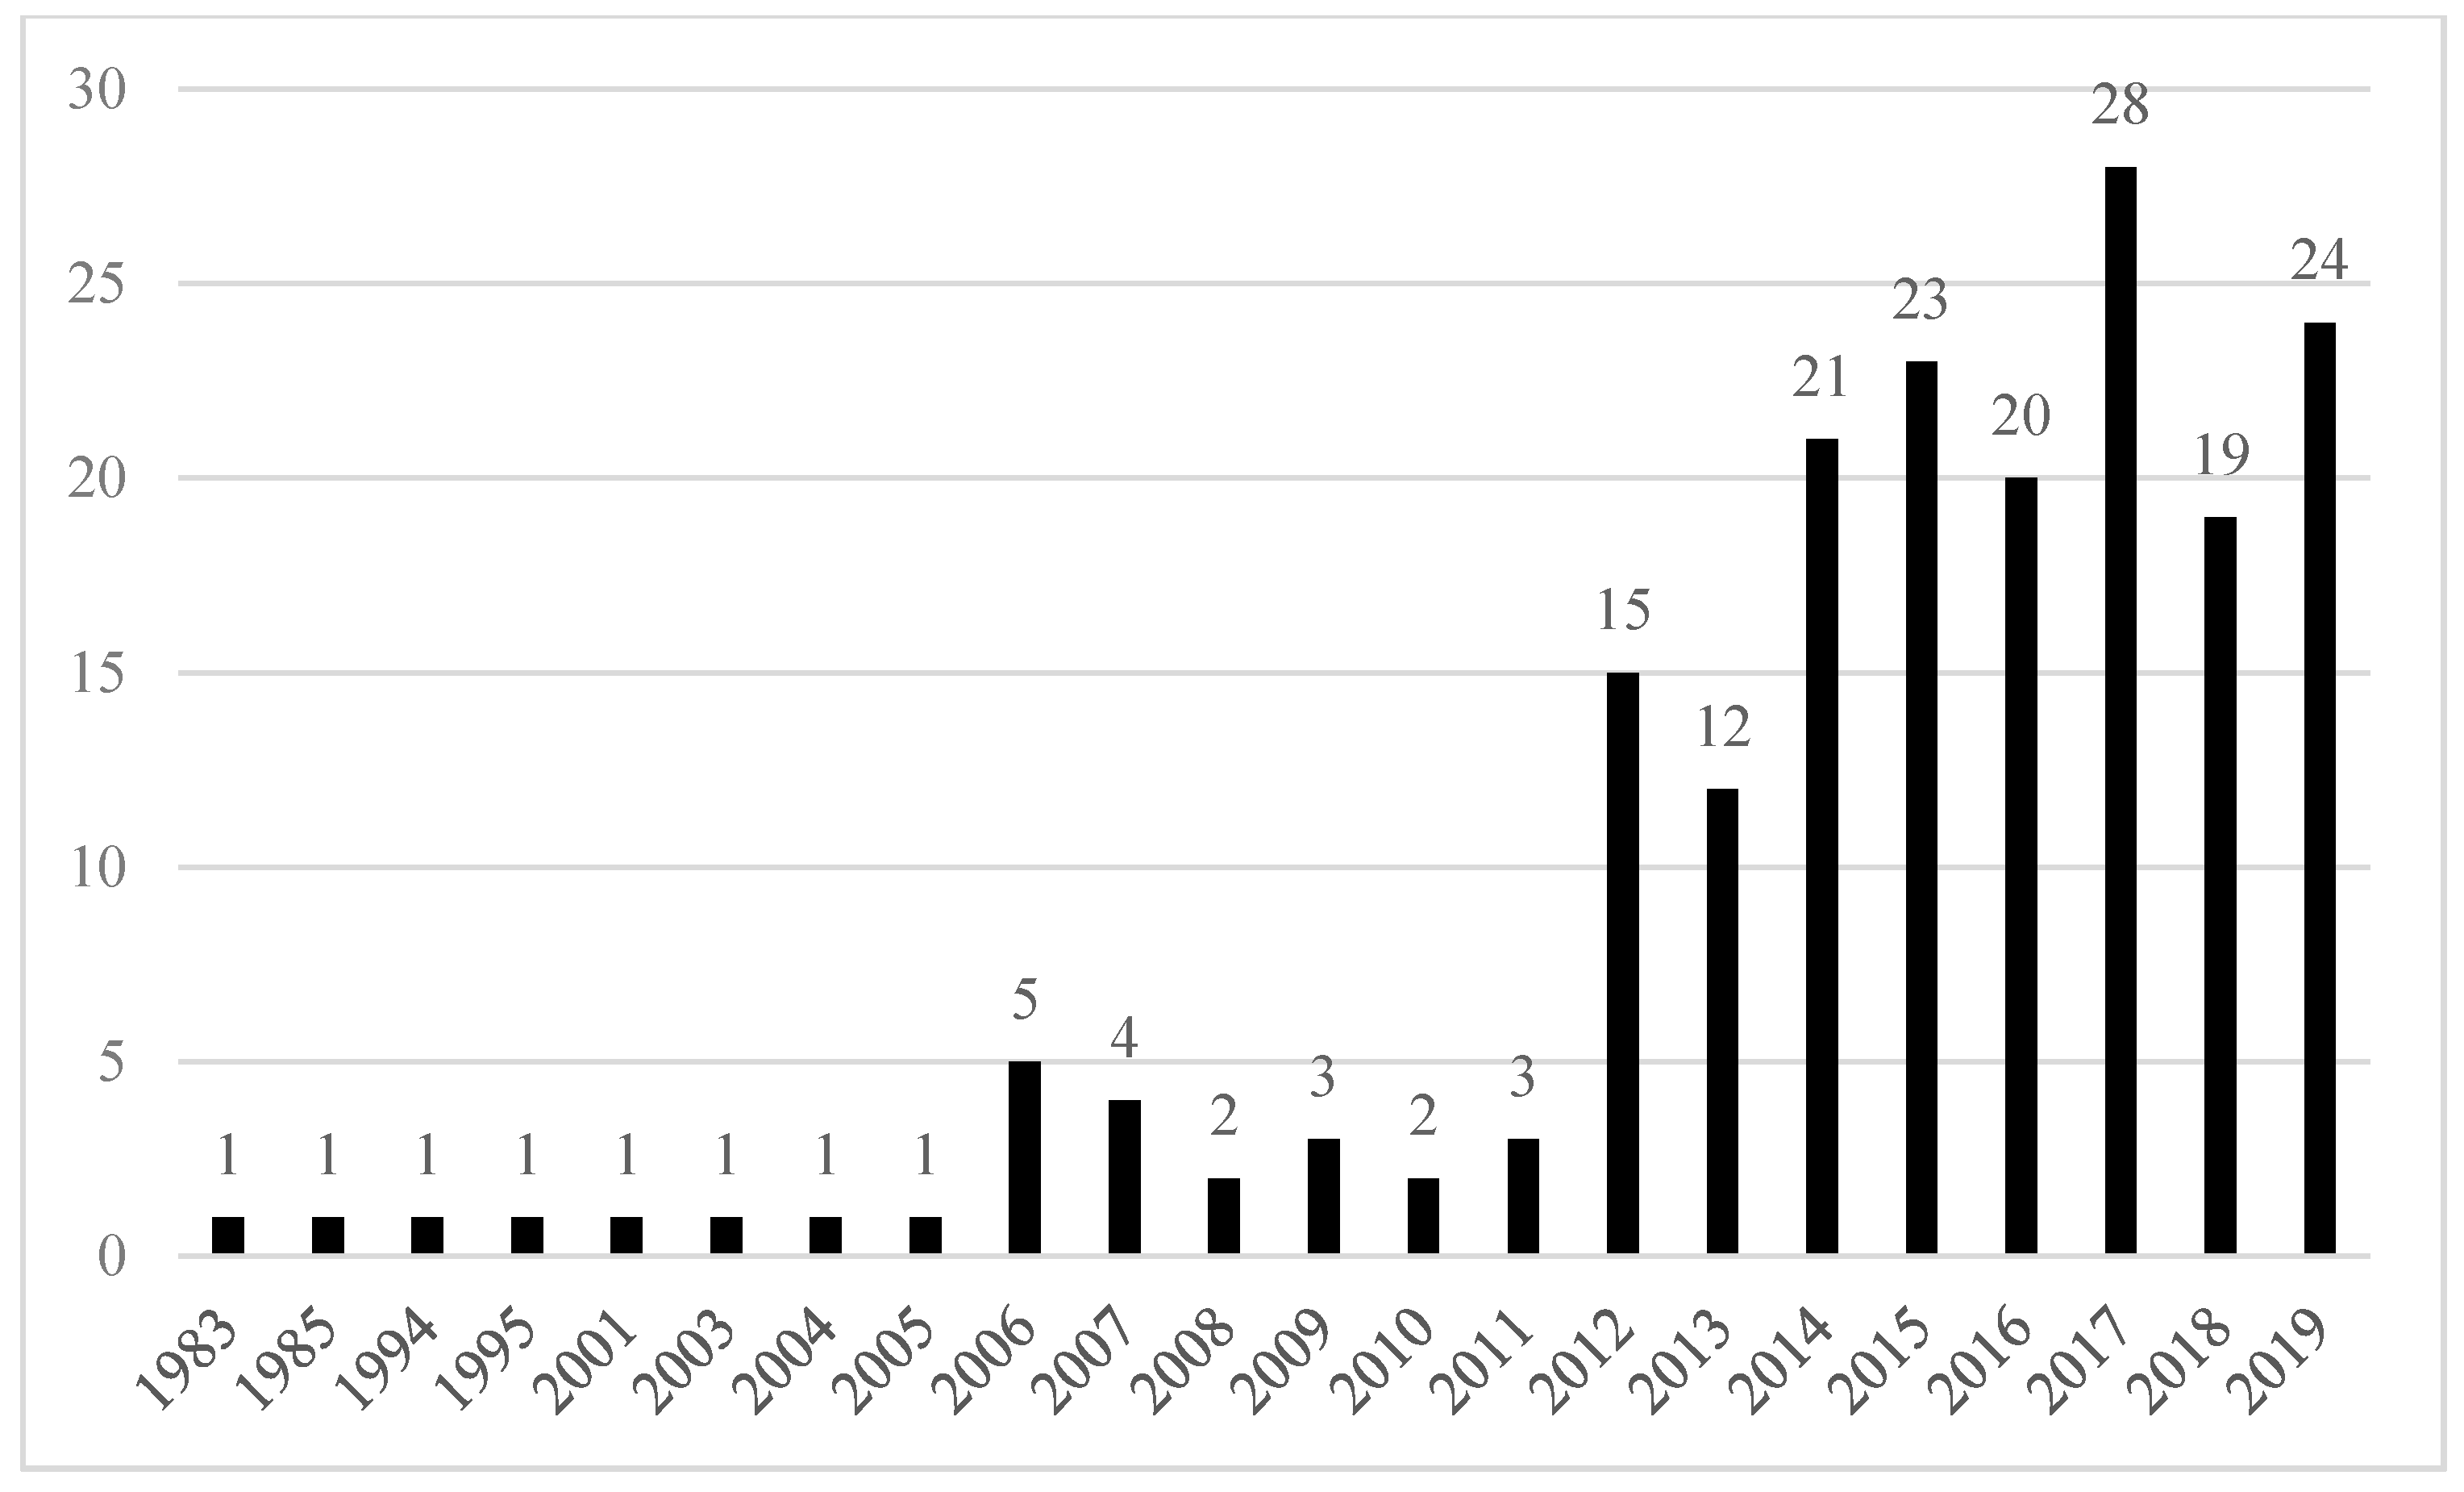
Figure 1 shows the development of the number of published literature. The first article of the dataset was published in 1983. After several years with only one publication, there was a slight increase in the number of publications in 2006 to 2011. Starting in 2012, the topic gained greater relevance in literature and reached its temporary peak in 2017. The articles from 2012 to 2019 represent 85% of the total literature of the data set and are the most productive years. The average number of citations per article is as high as 23.72, and the H-index of the dataset is 32, which means that at least 32 publications on UX received at least 32 citations [30,36].
4.2. Publications Per (Secondary) Discipline
Table 1 shows the number of publications per discipline. However, for the interpretation of the results, it is important to remember that the dataset was limited to literature in the fields business, management, and psychology. Therefore, the table only contains papers that belong to one of these three disciplines and shows the secondary disciplinary assignments. Papers which are not also categorized to these disciplines are not included here. With that in mind, psychology is clearly the most productive discipline in UX research, followed by Computer Science, and Business Economics.
4.3. Publications per Source and Source Co-Citation Analysis
Table 2 shows the ten most relevant sources for UX research. Most of the sources are articles from scholarly journals. The list also indicates that books have a noticeable influence on the literary landscape. The three most productive journals, having published the most articles on UX, are “Computers in Human Behavior,” “International Journal of Human-Computer Studies,” and “Information & Management”. While the first two journals deal with the interaction between humans and machines/computers and, therefore, primarily address the psychological component, “Information & Management” combines the business and management perspective with information systems application topics. According to the Scimago Journal Ranking (SJR), all three journals fall into the first quartile and therefore are top-tier journals. The general, non-UX-specific H-indexes for these journals confirm the results of the productivity for most journals. Despite the lower number of publications for “Information & Management” or “MIS Quarterly”, these journals have a general high H-index, which is a robust indicator of research quality [30,36].
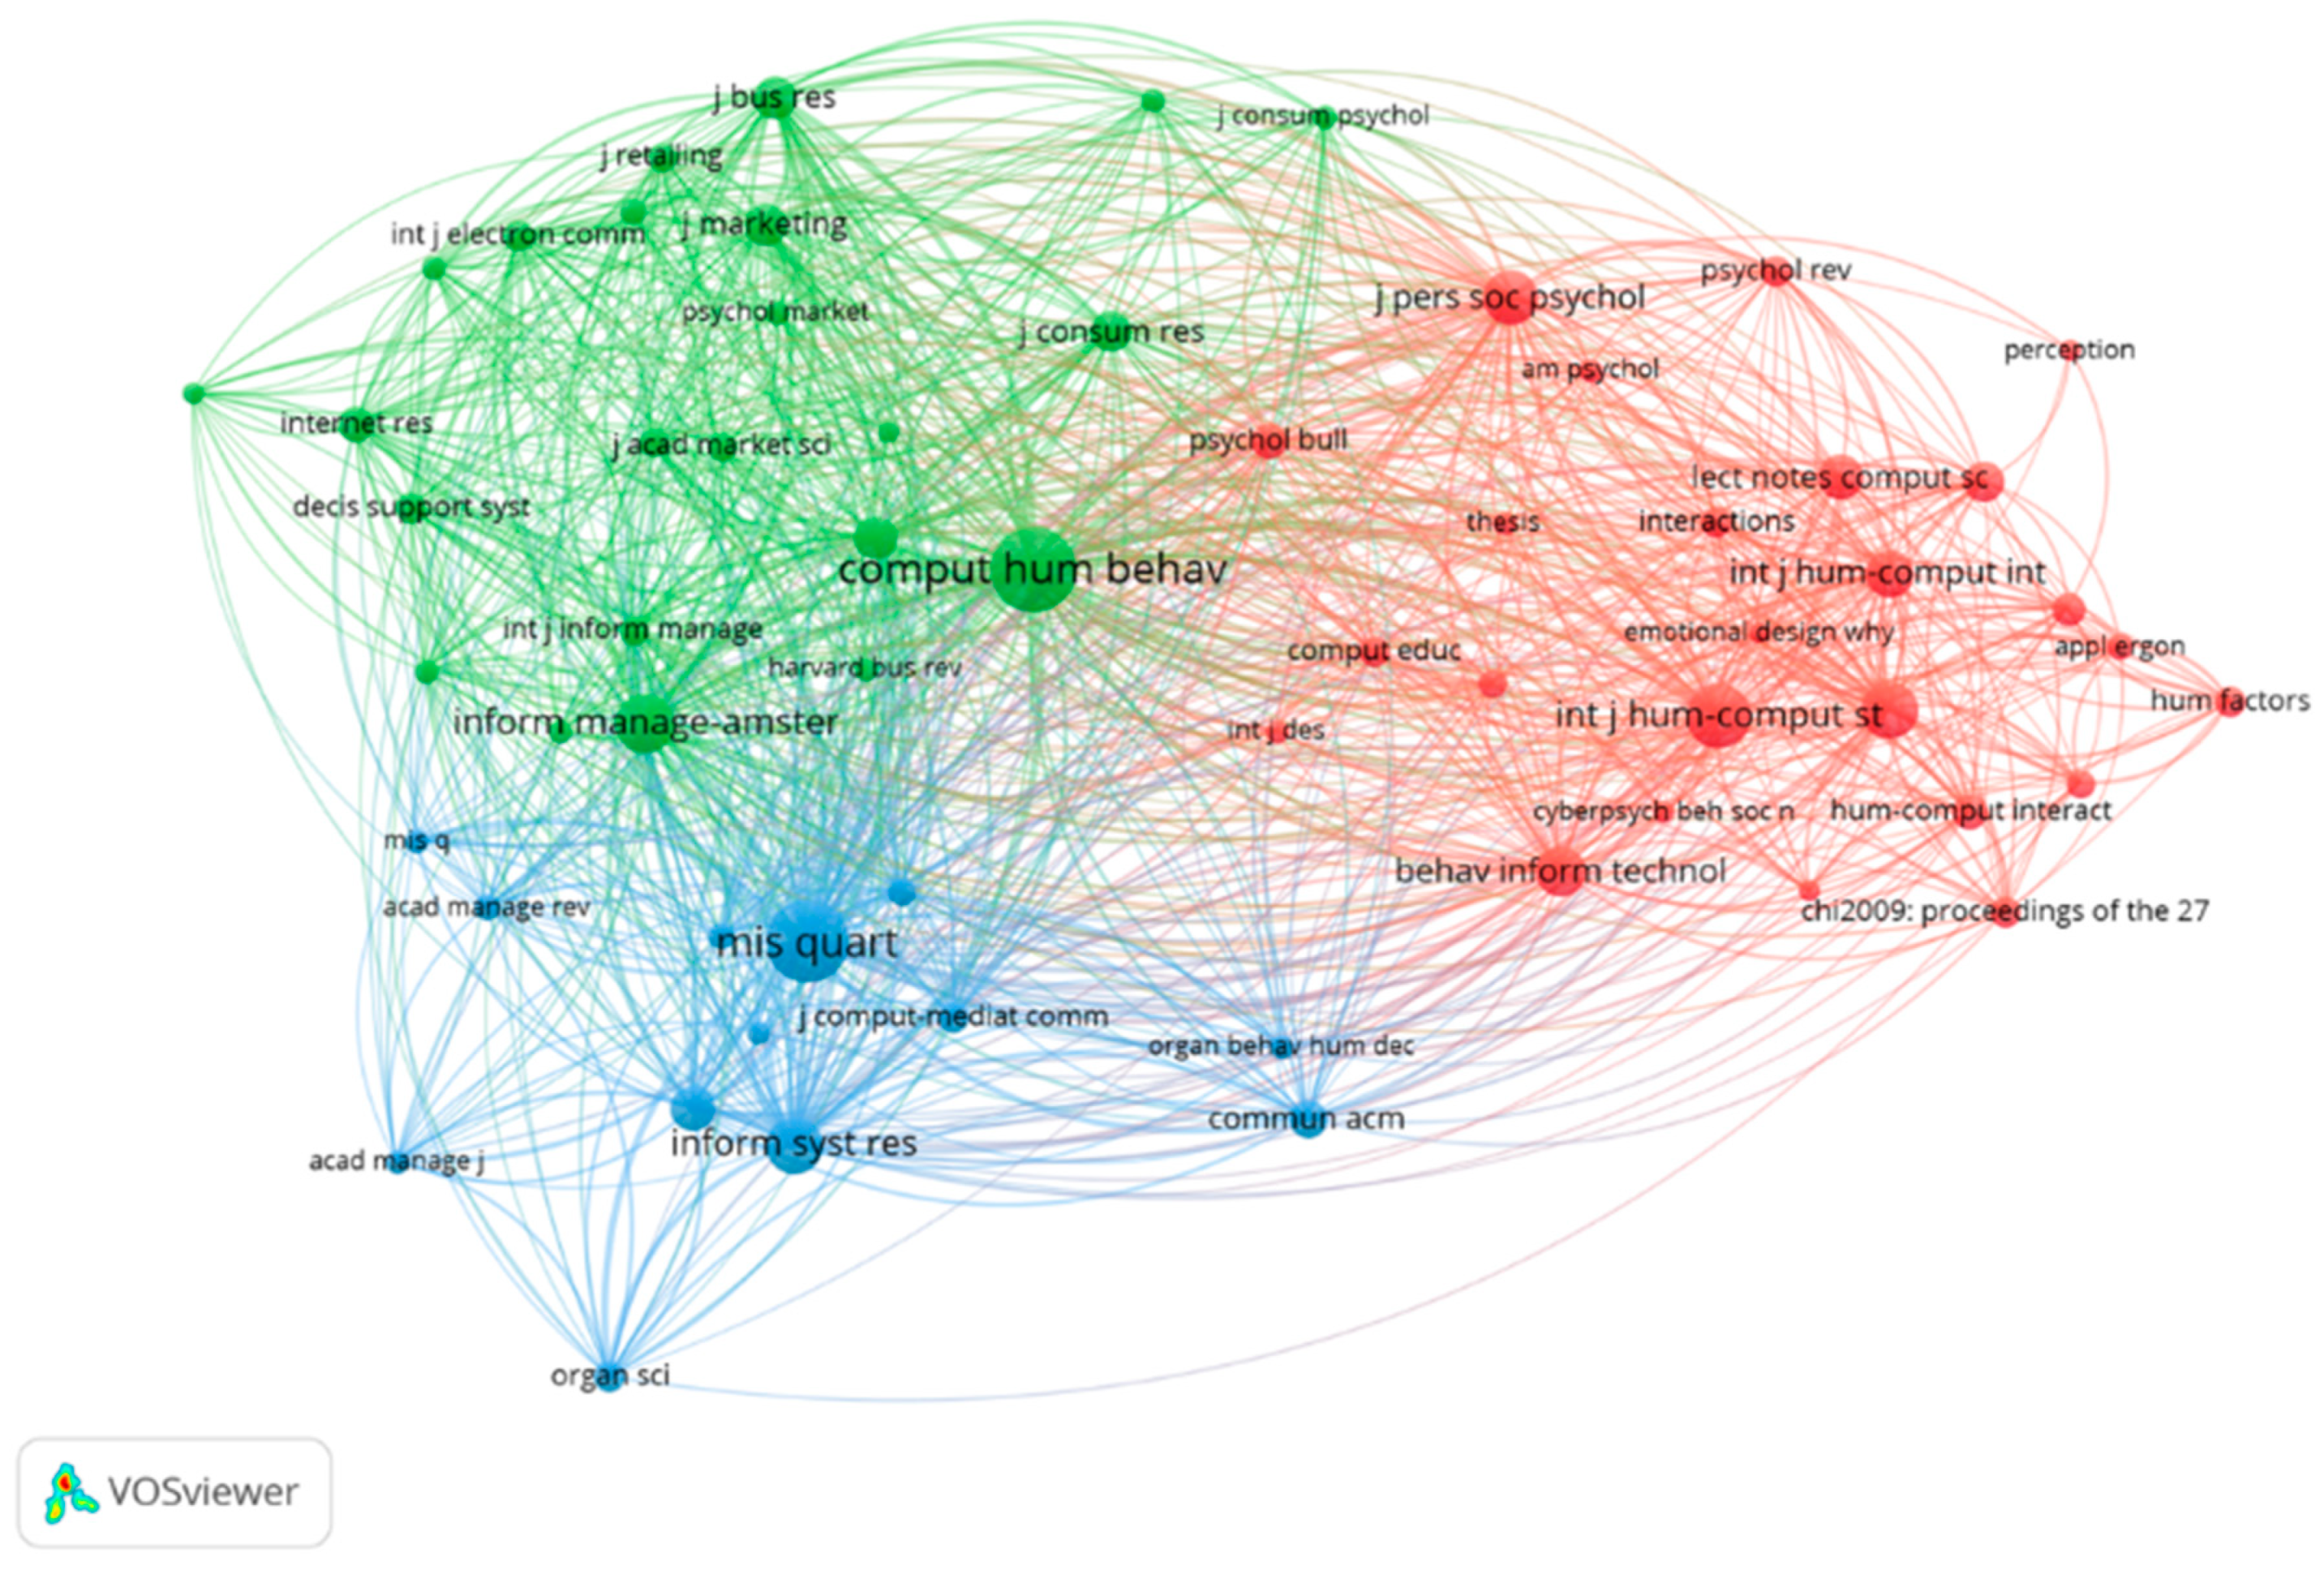
The co-citation analysis of the sources, as shown in Figure 2, provides a more precise overview of the critical subject areas from which citations were made. As a threshold, 20 was chosen as the minimum number of citations of a source. Out of 4145 identified sources, 61 sources met the threshold. Most of the references divided into the three displayed clusters are from sources in the human-computer field. Human-computer interaction thus describes the field from which UX has developed in terms of content. For this reason, UX may have been thematized in a strongly programmatic way [19].
Furthermore, journals assigned to the psychological context are essential sources for the authors of the articles. Journals in the ergonomic context do not occur due to the thematic limitation of the analyzed data set. However, as shown in the figure, they are generally used to explain UX.
4.4. Author Publication, Citation, and Co-Citation Analysis
Overall, the data set contains a total of 477 authors. The average number of authors per article is 2.5. Table 3 lists the top 15 UX authors with the number of publications and number of citations. D. Frohlich and M. Wilson published the most articles on UX, but their work has not been cited yet. The most cited authors are K. Opwis and A. N. Tuch with 191 citations for three articles so far.
However, sole citation analysis favors older, more cited articles, while reducing the chance of newer articles to be considered [37]. In contrast, co-citation analysis looks for jointly cited documents regardless of their age and number of citations. Additionally, co-citation analysis of authors also allows to visualize the collaboration of author teams and to determine the theoretical foundations of UX research [23].
Figure 3 shows the network of co-citations of authors. The threshold of citations was set to 18 to ensure that particularly relevant articles are displayed. In this case, the threshold is higher and odd, since this number visualizes a precise mapping, structuring the most relevant elements into clearly defined clusters [23].
Of the 6607 authors mentioned in the data set, 26 have met the threshold. The figure illustrates the intellectual origins of the topic linked to the respective authors. Furthermore, this results in two main clusters. In Cluster A, Venkatesh was cited most frequently, with 78 citations. His research focuses on concepts of technology diffusion in the context of organizations and society. His publications are featured in leading journals in areas such as human-computer interaction, psychology, and marketing. With 128 citations, Hassenzahl achieves the highest number of citations in Cluster B. His research background mainly covers topics of interaction design. As psychologist, he works with findings from the various interfaces of UX directly.
The overview clarifies that despite the limitation of the categories to business, management, and psychology, several articles refer to researchers in the technology context. In this case, the figure shows that UX comes from the human-computer and technology acceptance research area. The citations are conspicuously frequent from authors who can be traced back to other disciplines.
4.5. Most Productive Countries
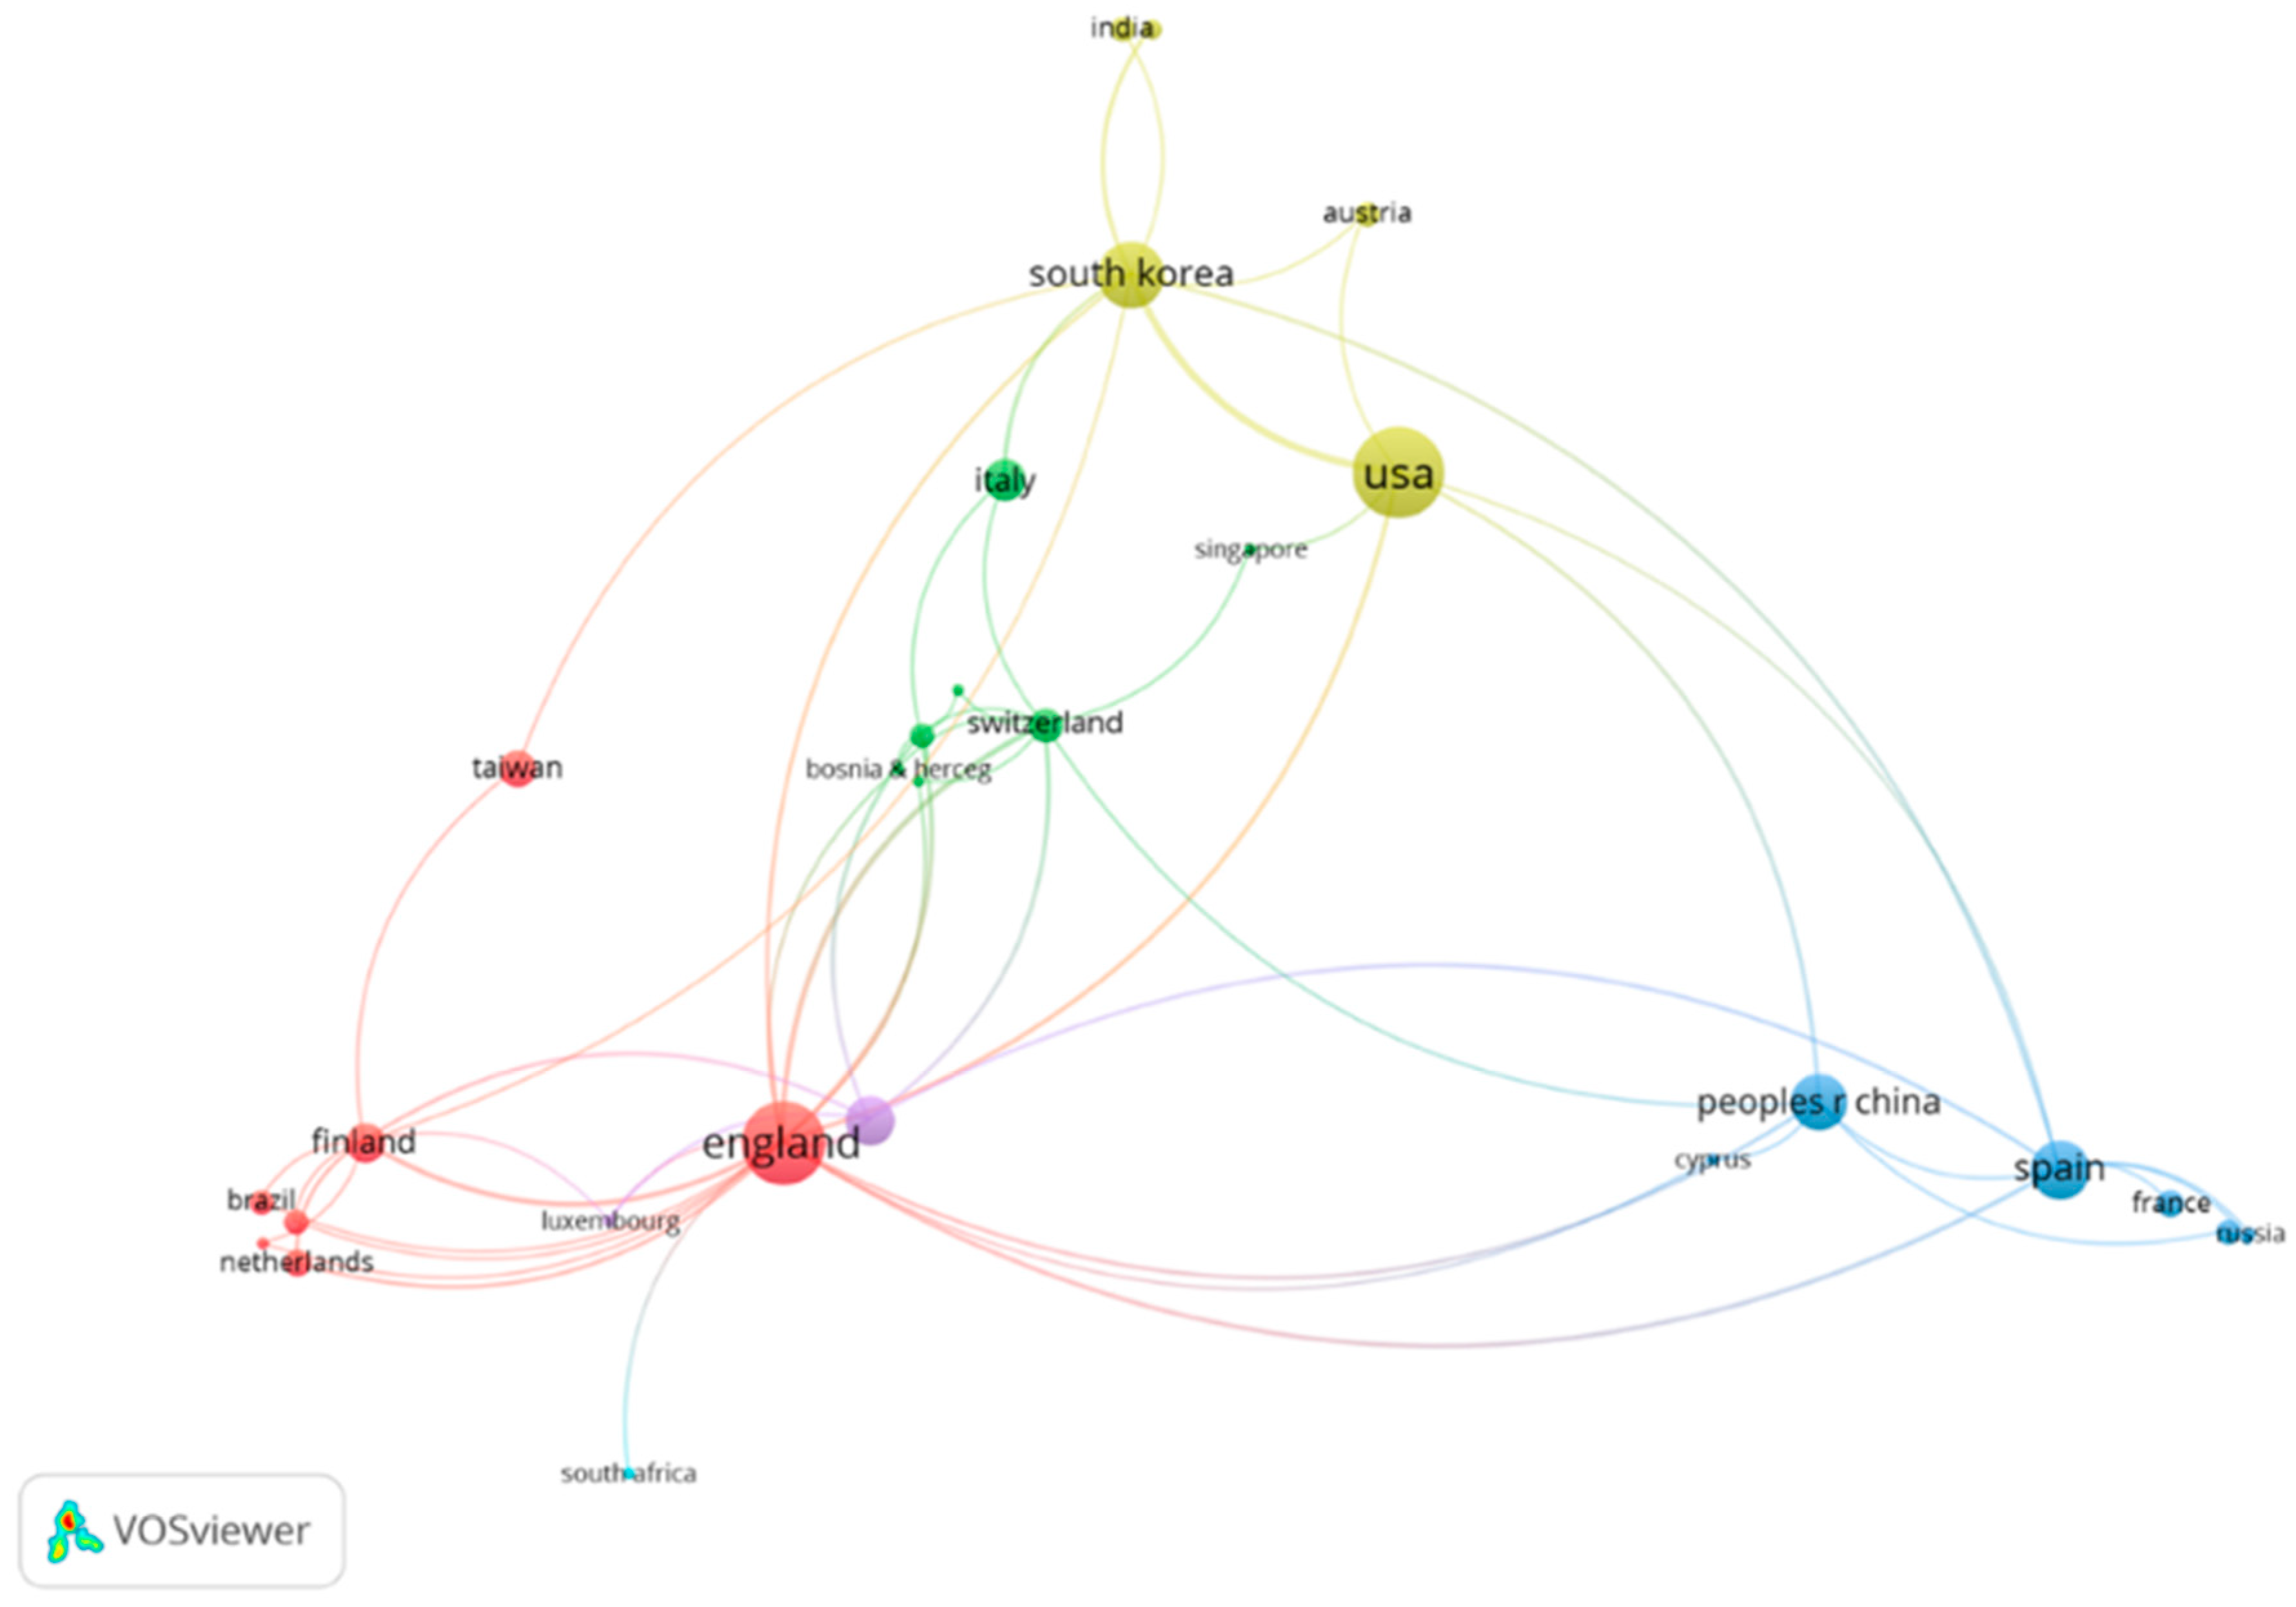
Table 4 and Figure 4 determine in which countries UX research is most frequently conducted and cited. The country refers to the affiliation address of the respective author. Table 4 shows the number of publications and the number of citations of the five most important countries. The list shows that both variables do not correlate perfectly. Especially South Korea has an above-average citation-per-article ratio.
In total, VOSviewer identified relevant data from 46 countries, of which 26 countries were presented in clusters in Figure 4. The figure also shows the network of the authors’ countries to illustrate the international collaboration in UX research. Both the USA and UK are the countries where most publications originate from and the most interconnected countries regarding UX publications.
4.6. Keyword Frequency and Co-Occurrence Analysis
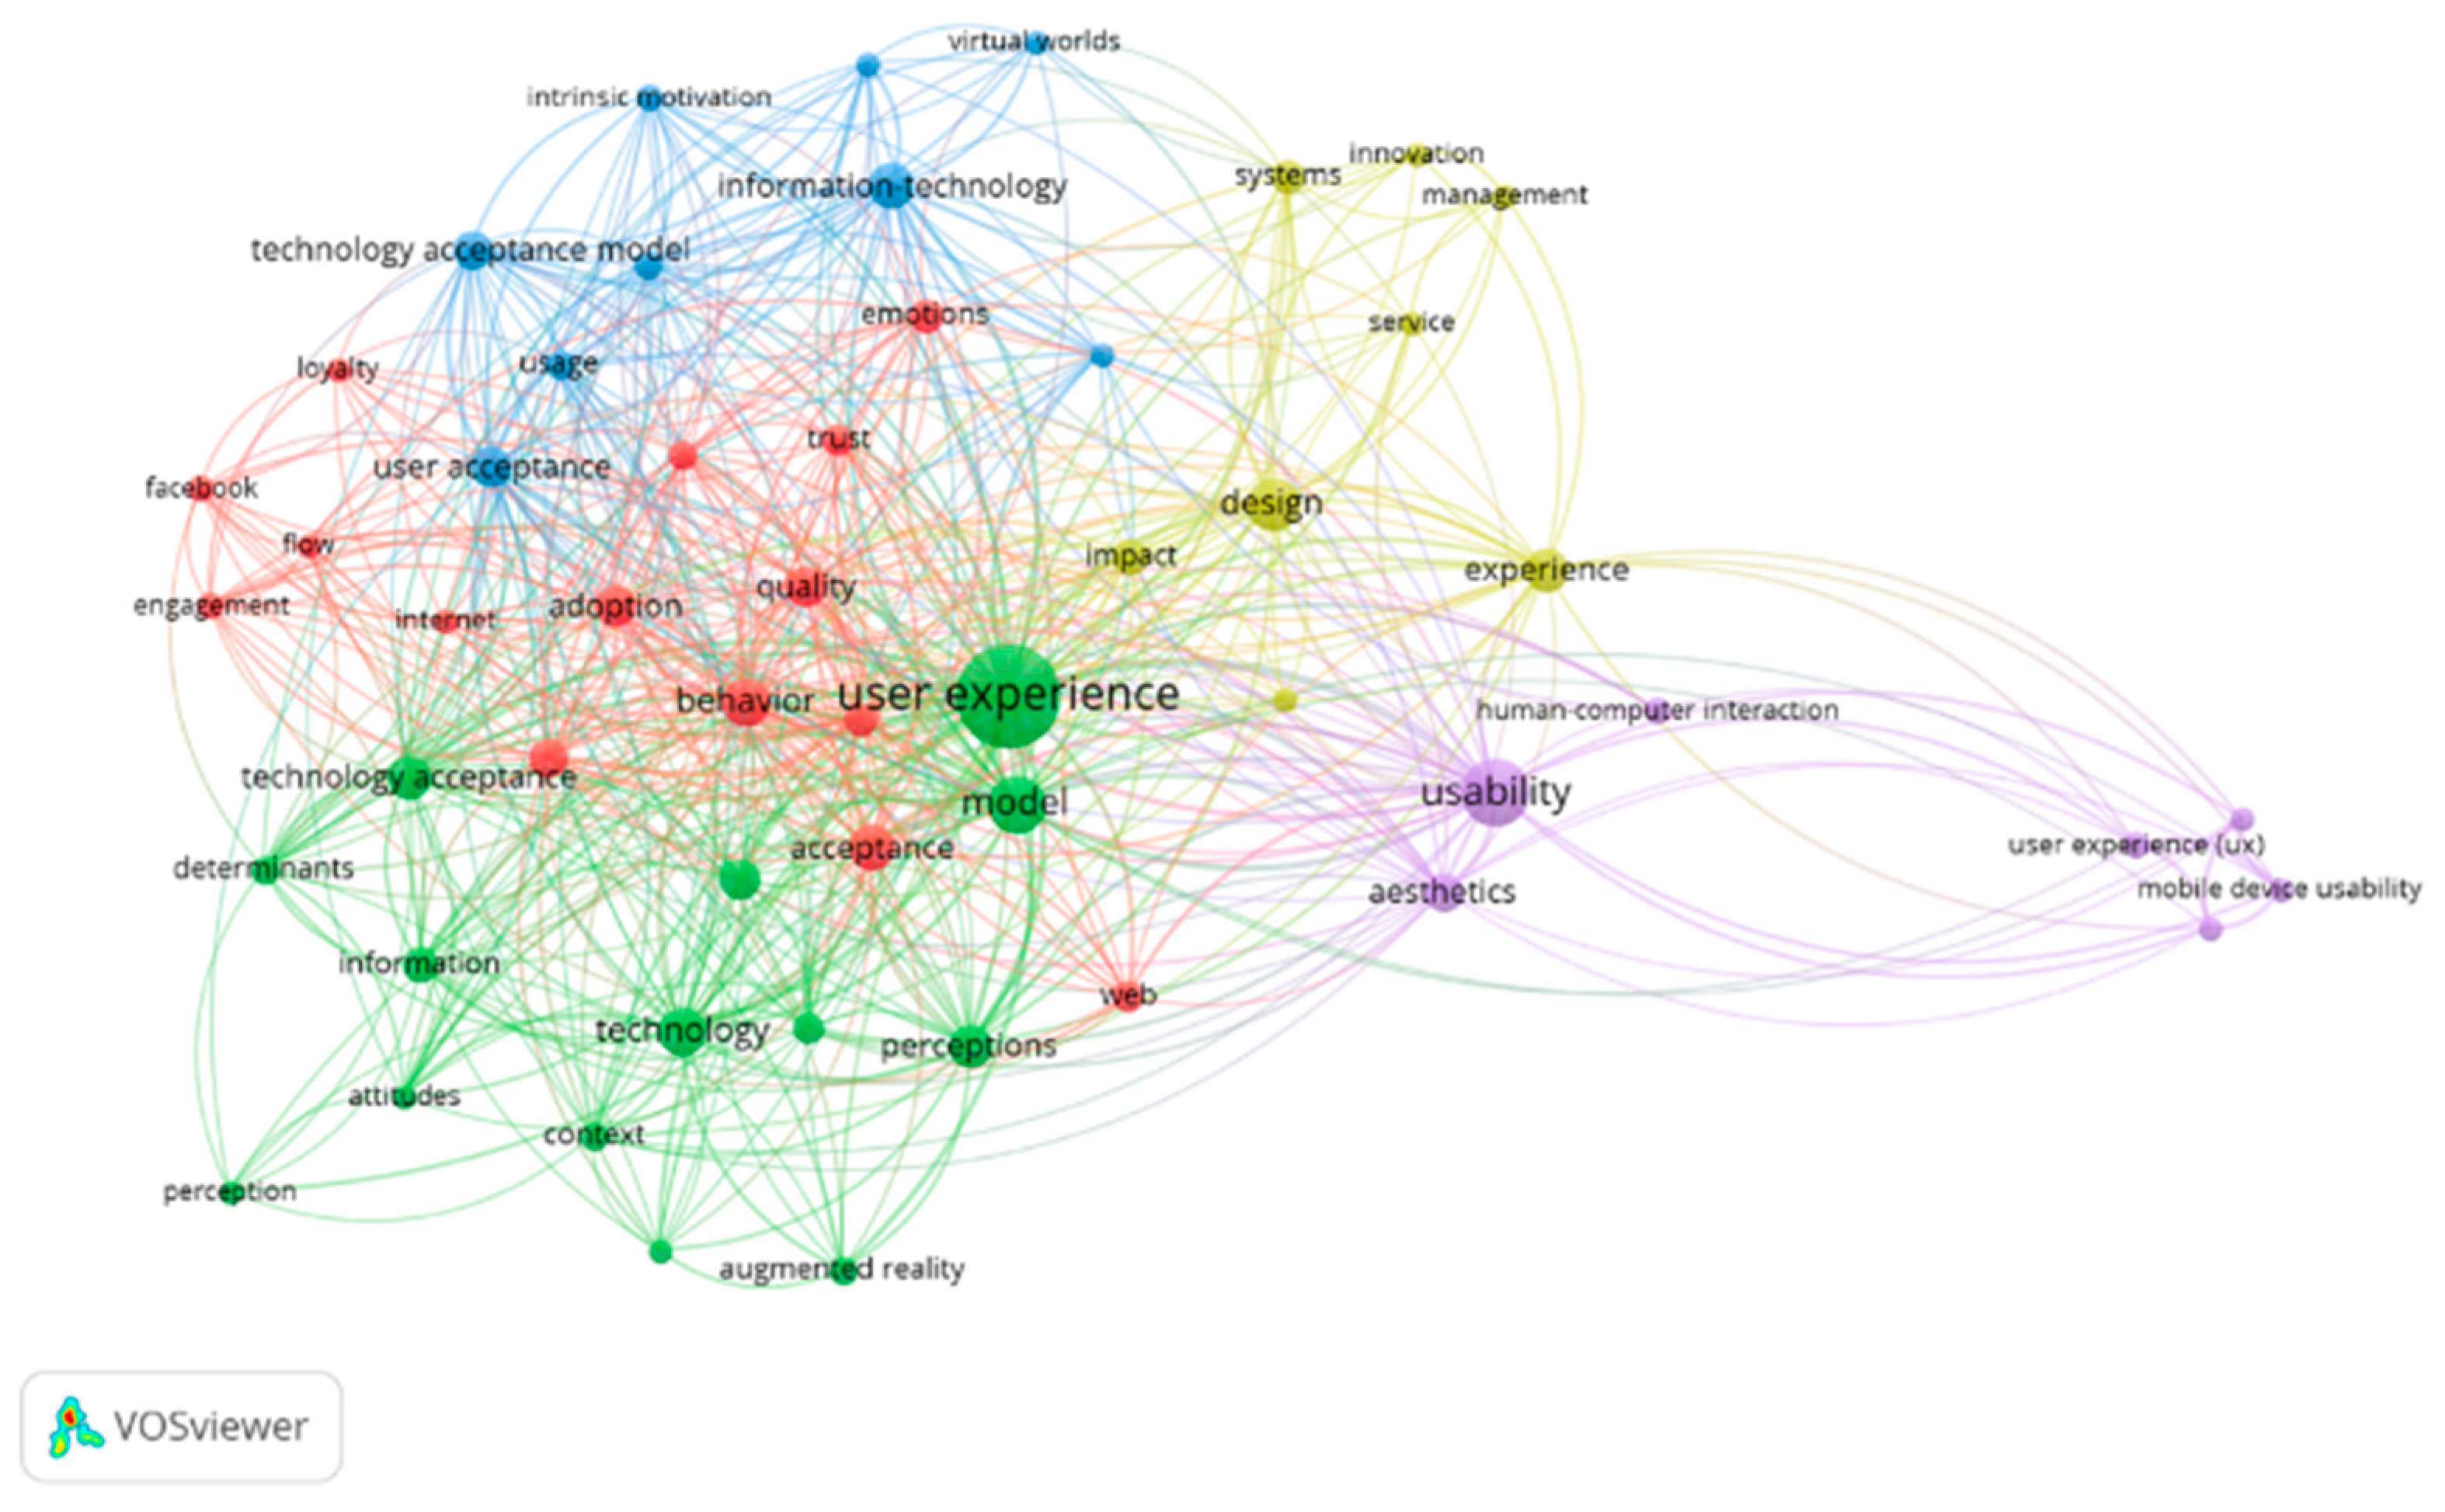
Figure 5 shows the co-occurrence analysis and its links. As with Vallaster et al., the threshold for displaying the keywords was set to five [34]. The threshold indicates how often a keyword must appear in an article of the data set in order to be included in the analysis. The threshold ensures that relevant keywords and, thus, articles are displayed transparently. The choice of thresholds offers a certain amount of flexibility in the representation of the networks. The co-occurrence analysis, visualized by the VOSviewer, structures the research field into clusters [38].
The size of the bubbles indicates the frequency of listing keywords in the articles. The larger a bubble is displayed, the more often the keyword appears in the publication set created [39]. The closer the keywords are associated with each other, the stronger the relationship between the terms [29]. The individual clusters that result from this presentation are color-coded according to subject areas. In general, Clusters 1, 3, 4, and 5 are particularly interrelated. Cluster 2 distinguished itself with the usability perspective of the diagram. Table 5 shows, as a supplement to Figure 5, the values of the 20 most important keywords of the data set, ordered by total link strength.
The following cluster classification provides a thematic overview:
Cluster 1: The UX model (green): The main focus is on the concept of UX. Therefore, it contains the keyword “user experience” at the center and includes the most references. Closely related terms are “model,” “technology,” and “perceptions.” Gaggioli et al. evaluate the term “positive technology” about the trend towards creating a particularly positive and valuable human perception and experience with digital technologies [40]. Especially the intention of well-being in interaction with technologies of any type, perception, and thus the psychological level are relevant. In a broader sense, a positive perception of products is decisive for marketing. Accordingly, UX is a model approach that attempts to map the perception within the framework of technologies.
Cluster 2: UX and usability (violet): The central term “usability” has the most references in this cluster and is, at the same time, linked to the other clusters. Al-Azzawi explains that “usability, interaction design, and information architecture” [5] was initially considered equivalent to UX. In older research, the human-computer interaction field has concentrated exclusively on “usefulness” and “usability” [41]. However, the utility component of usability does not include an emotional perspective. Moreover, the keyword “human-computer interaction” distinguishes itself more strongly from the other clusters. The cluster thus visualizes the separation of usability and UX.
Cluster 3: UX in connection to user acceptance (blue): This cluster primarily adopts a technical perspective on the topic with terms such as “user acceptance” or “information technology.” Yu et al. link technical user acceptance with the intention of the user to use the product [42]. As a starting point, self-customization was chosen as an instrument to optimize the product offering. With this intention, the value of the user concerning the product is also created. Acceptance and implementation are a prerequisite for appropriate UX [42]. The cluster is similar to Cluster 1, although a crucial first obstacle, user acceptance, is addressed here.
Cluster 4: UX and behavior (red): In this cluster the terms “behavior” and “acceptance” are combined. They address human behavior and reaction and, above all, introduce a psychological perspective and output. Using the example of Augmented Reality, Grzegorczyk et al., illustrate the relevance of human acceptance of technologies and summarize adaptation or UX with “attractiveness” [43]. In their study, they researched the attractiveness of Augmented Reality. With the correct implementation of this technology, the respective value can increase. In their study, Hart and Sutcliffe emphasize that no adoption of technologies is associated with a poorly perceived utility, and thus UX in a broader sense [44]. This cluster complements cluster 3 with the behavioral spectrum of humans and thus the central role in the successful implementation of UX.
Cluster 5: UX in management (yellow): This cluster addresses the economic perspective of UX with terms such as “management” or “service experience.” Beltaugi et al. also use the term “experience economy” [45]. The user’s positive experience is regarded as a major success factor for companies in competition [45]. The user experience, thus, does not merely affect the general use of the product or service. It is an indicator of the perception of a brand and its related recommendation.
More specifically, Table 6 distinguishes the keywords depicted in Figure 3 into author keywords and so called keywords plus. Keywords are provided by the authors, usually below the article abstract, whereas keywords plus are automatically generated by an algorithm as recommended additional keywords representing the articles content [22]. The keywords plus do not contain the search term UX as such. At the same time, the terms “model,” “behavior,” and “usability” are listed with high priorities. Thus, UX is somewhat associated with these constructs, even though they are similar. The keywords plus show an additional classification of the concept of UX into constructs, such as a model or concerning human behavior and its user acceptance.
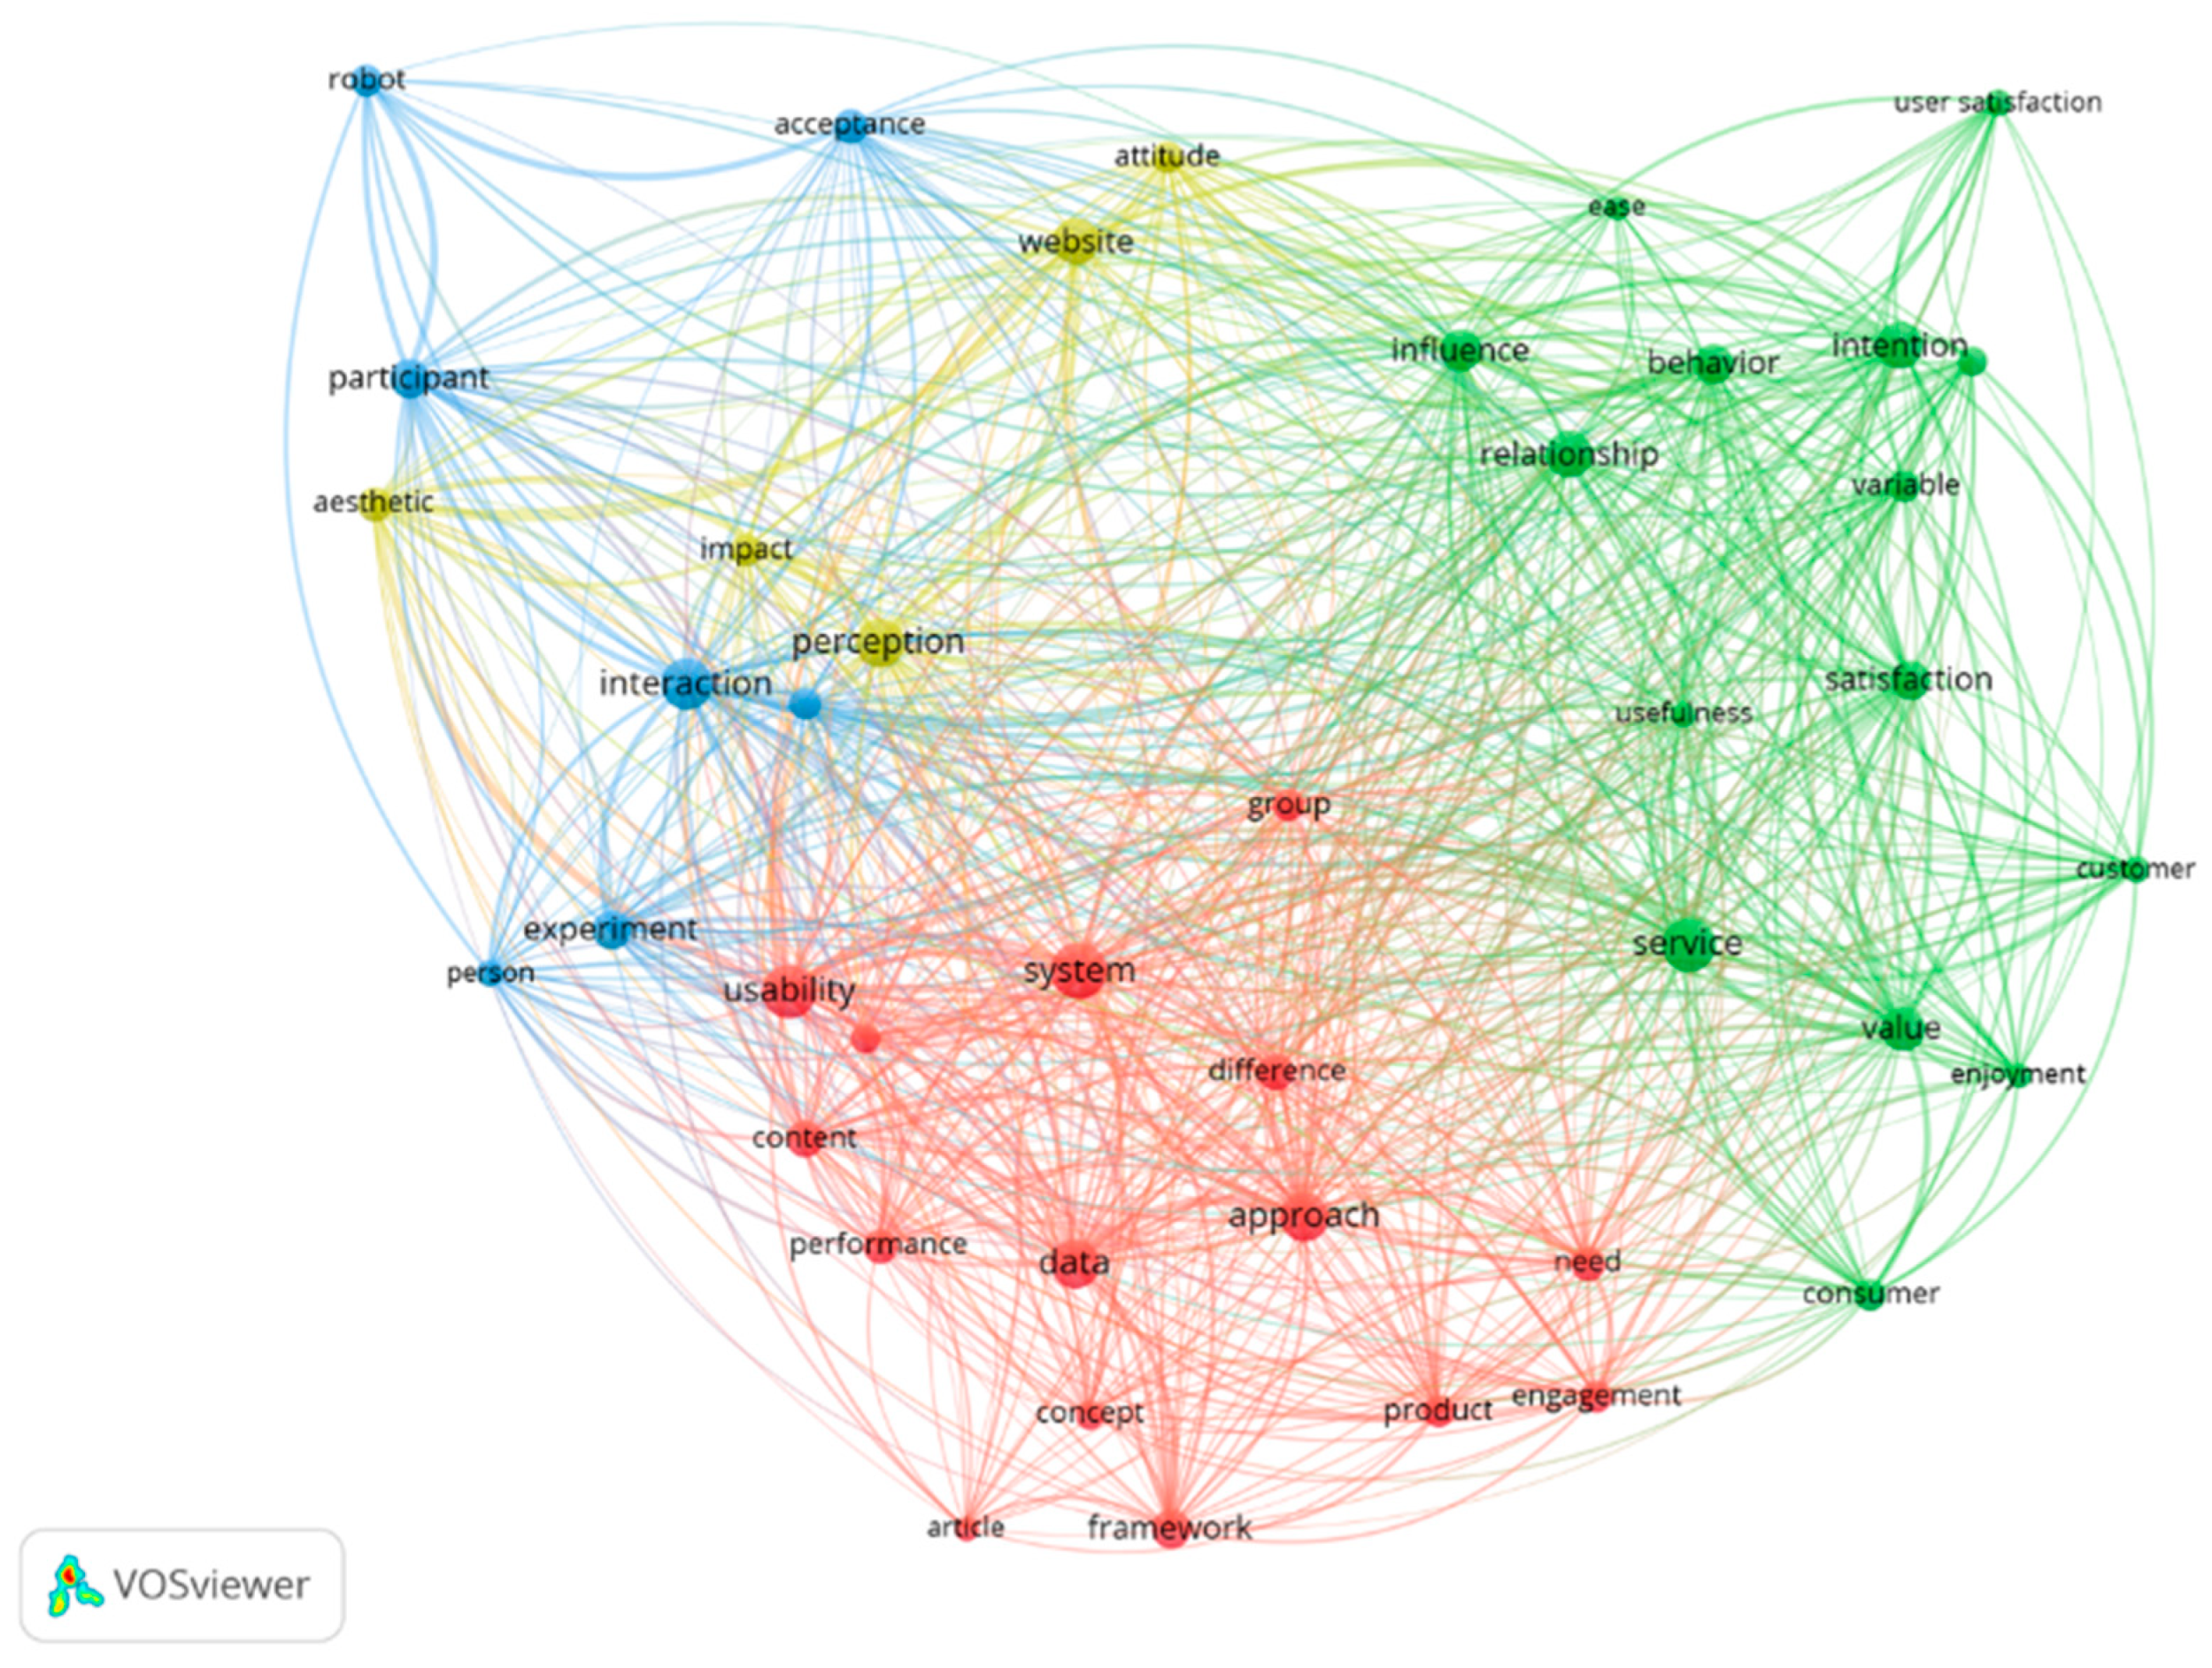
4.7. Topic Words Co-Occurrence Analysis
Whereas the keyword analysis only included the specified keywords of the articles, the most frequently mentioned words in the topic (title and abstract) can be derived by text mining and serve as an additional information about the research field. The “full counting” setting was chosen for the screening. The threshold of minimum mentions was set to 15, and 70 words meet this threshold. Sixty percent of the essential terms were filtered by the VOSviewer, resulting in a count of 42. This results in a total of four clusters (Figure 6). In the titles and abstracts of the data set, words such as “system” or “usability” appear more frequently than in the previous keyword analysis. Also, “interaction” appears more frequently, especially in the context of the topic of human-computer interaction compared to the previous presentation of the keywords.
4.8. Content Analysis—The 20 Most Cited Articles
Table 7 lists the 20 most frequently cited articles in the data set and thus complements parts of the citation analysis and the co-occurrence analysis. Due to their high citation numbers, the articles also indicate specific research trends within the UX area.
Most citations were assigned to the article “Assessing IT usage: The role of prior experience” by Taylor and Todd who fill a critical research gap within the Technology Acceptance Model (TAM) by testing IT tools by users of it [46]. However, the testing refers to a leading stage of the TAM and whether users have understood the mechanism of a used tool.
Among the 20 most frequently cited articles, a large proportion explain UX in the context of the experience of users and the use of websites. For Chung & Tan, a positive UX (more specifically: playfulness) is a decisive factor for user acceptance of information-search websites [47]. User experience and user acceptance are particularly crucial for revisiting websites. Furthermore, the complexity of a website is a central factor to influence the UX [48]. Therefore, the individual features of the website such as animation, audio, and pictures are crucial for the experience of website visitors. Concerning the performance of a company, it is of fundamental importance that features of digital products are particularly relevant or not. In a broader sense, Nadkarni and Gupta use “user satisfaction” as an indicator of user UX [48]. Tuch et al. especially focus on the role of visual complexity and prototypicality as website design factors and what impact these have on users’ first impressions [49]. If websites have a complex structure, the first impression is more harmful than if they are rather simple. However, prototypical web pages create a better first impression than non-prototypical web pages [49]. Likewise, Van Schaik and Ling address the perception of aesthetics and the evaluation of websites [50]. However, the authors found that context plays an essential role in the stability of the evaluation of websites by users [50]. The appearance of websites alone is not sufficient for a positive evaluation, and thus, UX (sooner: usability) is a necessary basis. UX can also be usability, but usability cannot be UX at the same time as UX describes a multidimensional phenomenon [50]. Somewhat contrary to these statements, Tuch et al. outline a correlation between usability and aesthetics in the evaluation of online shops and state that a definite aesthetic positively influences the perceived usability [51]. Aesthetics of websites and especially their positive evaluation are considered a sub-theme of UX in their study if it is indirectly manipulated by means such as aesthetic websites. Bilgihan goes one step further and refers to loyalty towards products and websites in the UX context [52]. As a group of investigation, Generation Y is mainly addressed. In the study, Bilgihan found that, for this generation, trust is the most important antecedent of “e-loyalty.” [52] For mobile instant messaging, as a counterpart to website solutions, UX is also a decisive factor for social presence and user satisfaction [53]. Especially from a business perspective, these results are valuable for meeting customer needs in the long term. However, in order to explain why specific systems are preferred, emotional factors and aesthetics become relevant, and thus, UX and a more comprehensive picture of them. Lallemand et al. structure the concept of UX by presenting the complexity of the whole research area, validating it for self-evident facts and thus developing it further by interviewing practitioners and researchers [54]. As UX is already established as a research area, Law et al. also investigate whether UX constructs are measurable and scalable [55]. As UX is often depicted in abstract models, it is hardly possible to measure these constructs accurately.
The articles point out research trends in order to obtain necessary data for companies regarding their digital products. The interwoven model of UX with elements of emotion, usability, and aesthetics complicates precise measurements and statements about the causes and results of successful UX implementations.
5. Discussion
The study maps the evolution of scientific research on UX between 1983 and 2019 in terms of scholarly publications. Regarding the number of publications, the last ten years of the data set embrace the majority of publications, namely 85% of the whole time span, showing that UX has just recently been gaining momentum. The bibliometric analysis has provided a detailed quantitative overview of the publication landscape. The “PC revolution” and therefore the first steps of digitization [56] took place during the 1980s, when the first articles on UX were published [15]. The first noticeable rise of the number of articles in 2006 to five articles is associated with the impacts of the WWW revolution starting in the 1990s and the related increasing pressure to prepare websites for users visually [16]. Older articles naturally have a significantly better chance for a high number of citations, so the citation numbers must be considered per year. Additionally, the more rapid development in the UX field took place just in recent years, which is why more attention must be paid to articles published in the last years. Since the significant increase in the number of publications in 2012, the leading search areas of psychology, computer science, and business economics stand out.
The analysis of (secondary) disciplines which cover UX research clearly shows that UX is a highly interdisciplinary topic. The majority of UX publications stems from psychology making clear that human perception of UX-optimized and subsequent behavior represent the most discussed issues. Whereas humans can be interpreted as the receivers of UX stimuli and psychologists analyze human information processing, inversely, computer scientists, who account for the second most publications, deal with the “sending” part of UX-optimized signals. Business Economics account for the third most UX publications and deal with the value of UX for both customers and firms. Many publications are assigned to two or more disciplines, stressing the interdisciplinarity of UX research. The interdisciplinarity makes a precise definition difficult because every discipline views UX from another perspective. Therefore, UX conceptualizations are somewhat abstract and complex [4]. However, the recent development of the ISO standards [20,21] shows that there is a clear need for a sufficient definition of UX.
The analysis of publications per source confirms these findings. The two journals with the most UX articles, Computers in Human Behavior and the International Journal of Human-Computer Studies, are positioned at the intersection between psychology and computer science. The journal with the third most articles, Information & Management, connects computer Science with business and management. The journals have high H-indexes. The co-citation analysis of sources not only confirms the existence of three large journal clusters—psychology, computer science, and business/management—but also shows that researchers from all these disciplines cite articles that were published in journals not only from their own discipline but interdisciplinarily.
Interestingly, the analysis of authors does not manifest clear “UX star researchers”. Rather, the average UX author only published 2.5 articles so far, with 5 being the current maximum. This is quite a few compared to other topics, where experts publish much more articles on their specific field. In other words, UX researchers do not only focus on UX but deal with other topics as well. The co-citation analysis indicates that most authors are jointly cited in most publications. In other words, as the number of UX publications is still manageable, there is a considerable chance for UX authors to be cited in subsequent UX publications.
Additionally, the co-citation analysis of sources and authors show that UX has diffused from the field of human-computer interaction to other spheres humans interact with. In that sense, UX is also be applied to physical products independently of the use of digital technologies. Especially in the automotive industry, the “experience” of a vehicle and its interior gains utmost attention. Particularly this industry is facing new competitive pressure coming from digital products [1,3]. For example, the intuitive operability of a smartphone or tablet sets the new standard of human-machine interaction. Hence, car manufacturers adopt these technologies and modes of interaction. In this sense, UX also deals with technology acceptance [19]. A car with lots of single buttons and knobs would hardly be accepted by digital native customers.
The results regarding the most productive countries in terms of where UX authors are located, is hardly surprising regarding the first place, the US, which dominate in many research fields. However, South Korean authors account for the second most citations, despite having published less articles that UK authors. Spain as the country with both the fourth most cited authors and fourth most articles might be considered as a surprise candidate. German authors are positioned on the fifth place regarding both citations and articles. The author countries’ network is strongly interconnected, showing that UX is a highly international research field.
The keyword (plus) analysis and the topic (title and abstract) word mapping also confirm the high degree of interdisciplinarity of UX as the most frequently used and the most jointly used terms stem from the aforementioned disciplines. Whereas the two most relevant keywords, user experience and usability, just label an article as an UX publication, the third most relevant and transdisciplinary keyword, “models” shows that the essence of UX research is to try to provide a simplified representation of the interaction between humans and objects in order to understand how this interaction can be optimized. Therefore, UX models also form the first research cluster, as derived from the keyword co-occurrence analysis. The second cluster deals with usability as a sub-concept of UX. In other words, UX-optimized platforms, products, and services have to exhibit usability as a minimum requirement. Usability alone, however, does not constitute a UX-optimized object. The formation of this cluster indicates distinction and that the relationship between these two concepts still keep many researchers busy. UX researchers still have to explain to their readers that UX exceeds usability. This shows that UX has not yet become an established concept which is not in need of justification any more. As closely related to the very basic business concept of “use”, the cluster also stresses that UX creates value which exceeds customers’ pure need and which offers opportunities for firms to capture a large proportion of the created value. The third cluster dealing with user acceptance stresses a contrasting perspective on UX. While UX can provide additional arguments to buy a product (Cluster 2), customers can also get accustomed to a certain established technology and, thenceforward, expect and demand this as a standard. In other words, UX can be seen as a dynamic concept and the additional value of UX standards might diminish over time. Cluster 4, the behavioral aspects of UX, goes beyond the problems of terminology and basic conceptualization of UX and rather takes a closer look at the psychological processes a UX-optimized object causes. Finally, Cluster 5 embraces the managerial aspects of UX, stressing the significant relevance for firms. As already implied in Cluster 2, UX has an additional use that creates value that can be captured by a firm. Therefore, UX can clearly generate competitive advantages. The existence of the cluster underlines that UX is not only a psychological or technical concept but also has a high significance for marketing success and firm performance.
The content analysis of the 20 most frequently quoted articles exemplifies the afore-mentioned perspectives and focal points of UX research. UX research still focuses on websites and digital products.
6. Conclusions
UX has become a central component especially of successful websites and digital products. Also in research, UX gained momentum as a concept and optimization tool Measuring technical performance and scalability for these products is indispensable. User Experience describes a user’s holistic experience before, during, and after the interaction with a platform, product, or service.
The topic has been mainly discussed in the human-computer interaction field, rather than in business and management, despite its high relevance for competitiveness, customer satisfaction, customer retention, and, finally, firm performance.
The bibliometric analysis of scholarly publications from 1983 to the end of 2019 mapped the research field quantitatively. Citation analyses, co-citation analyses, and content analyses were used to evaluate both productivity and the impact of the literature. The co-occurrence and content analyses served as a fundamental basis for formation of research themes.
In UX practice, development costs decrease significantly, purchasing power increases through adapted UX methods, and overall performance increases in organizations due to the use of UX. Law et al. can be considered as a starting point for further research, as they have already operationalized UX measurements in semi-structured interviews [55]. UX measurement should also be more focused on UX optimization. Especially in the business context, the measurement of performance and the definition of corresponding key performance indicators are central factors for targeting customers, for example, the e-commerce sector effectively. UX thus becomes indispensable for companies when developing a brand. With appropriate testing and measurements, problems during UX can be identified more quickly. The question of what happens before and after a click on a website is therefore central.
Due to the recent acceleration of the growth of scholarly publications on UX, we expect UX research to further gain momentum. Fundamental disputes about terminological and conceptual questions will probably end soon for the benefit of a consolidated understanding of UX across involved disciplines. The already strong interdisciplicarity will probably sustain. However, with the increasing advancement of UX research, we also expect scholars to specialize in more specific, partial aspects of UX and to use their discipline’s specific methodologies. Especially business and management scholars should pay more attention to UX because the concept is neither a psychological nor a technological end in itself but should serve firms, customers, and employees and provide benefits to them. In that sense, we encourage more general business, management, marketing, and human resource journals to explicitly invite UX papers for publication. UX is a promising source of competitive advantages, a unique selling proposition, and possibilities of value creation and capture. However, also wear-out effects of temporal UX standards—as customers get used to given UX-optimized technologies—should be subject to future research. Future research should also consider expanding the scope of UX and its application area beyond websites and digital products to non-digital products and services. While UX conceptualizations already grasp these, concrete research is still scarce.
As for every research, this paper comes with several limitations. First, our bibliometric analysis is limited to a rather abstract, quantitative view on UX research and therefore cannot replace an in-depth systematic literature review, which future research should tackle. The findings from our bibliometric analysis can help pre-structure such review endeavors, which might proceed holistically or focus on specific partial aspects of UX.
Second, since UX is primarily anchored in the HCI field but has an extremely high degree of interdisciplinarity, distortions may have occurred due to filtering and manual sorting (e.g., rankings). However, focusing only on publications in journals which rank in the first and second quartile of the SJR, might have excluded important innovative research that might have been rejected by more conservative top-tier journals. Future research should consider to dispense with such a quality threshold. Additionally, manual selection may be subject to the authors’ biases. The work is also limited to business, management, and psychology, so the results of such an analysis may vary for other focus areas. Future research should conduct a bibliometric analysis without this disciplinary restriction or conduct analyses in several other disciplines to be able to identify if different disciplines focus on different research questions or concepts.
Third, another large part of the literature, which was excluded for reasons of quality, were proceedings. In the area of business and management, proceedings accounted for more than 40% of the overall search results. It is unclear if these conference contributions will pass review processes and get published, but the large amount of proceedings shows that research activities in the UX field are more extensive than currently represented in our study.
Fourth, clustering can also be criticized for providing a slightly sharp picture of the publication landscape [27]. However, in this work, the initial structuring of the topic is essential.
Fifth, the “Matthew effect” can also lead to biased conclusions, when frequently cited articles are blindly cited at the same time without checking their quality individually [15].
Author Contributions
Conceptualization, L.L. and V.T.; methodology, L.L. and V.T.; formal analysis, L.L.; investigation, L.L. and V.T.; writing—original draft preparation, L.L., V.T. and A.B.; writing—review and editing, V.T.; visualization, L.L.; supervision, V.T. and A.B. All authors have read and agreed to the published version of the manuscript.
Funding
This research received no external funding.
Conflicts of Interest
The authors declare no conflict of interest.
References
- Weichert, S.; Quint, G.; Bartel, T. Quick guide UX Management: So Verankern Sie Usability und User Experience im Unternehmen; Springer: Wiesbaden, Germany, 2018. [Google Scholar]
- Jordan, P.W. Designing Pleasurable Products: An Introduction to the New Human Factors; CRC Press: London, UK, 2000. [Google Scholar]
- Van De Sand, F.; Frison, A.-K.; Zotz, P.; Riener, A.; Holl, K. User Experience Is Brand Experience: The Psychology Behind Successful Digital Products and Services; Springer: Cham, Germany, 2020. [Google Scholar] [CrossRef]
- Hassenzahl, M. The Thing and I: Understanding the Relationship between User and Product. In Funology: From Usability to Enjoyment; Kluwer Academic Publishers: Dordrecht, Germany, 2003; Volume 3, pp. 31–42. [Google Scholar]
- Al-Azzawi, A. Experience with Technology; Springer: London, UK, 2014. [Google Scholar]
- Castillo-Vergara, M.; Alvarez-Marin, A.; Placencio-Hidalgo, D. A bibliometric analysis of creativity in the field of business economics. J. Bus. Res. 2018, 85, 1–9. [Google Scholar] [CrossRef]
- Tranfield, D.; Denyer, D.; Smart, P. Towards a Methodology for Developing Evidence-Informed Management Knowledge by Means of Systematic Review. Br. J. Manag. 2003, 14, 207–222. [Google Scholar] [CrossRef]
- Zarour, M. User Experience Aspects and Dimensions: Systematic Literature Review. Int. J. Knowl. Eng. 2017, 3, 52–59. [Google Scholar] [CrossRef]
- Vermeeren, A.; Law, E.L.-C.; Roto, V.; Obrist, M.; Hoonhout, J.; Väänänen, K. User experience evaluation methods. In Proceedings of the 6th Nordic Conference on Human-Computer Interaction: Extending Boundaries, Reykjavik, Iceland, 16–20 October 2010; p. 521. [Google Scholar]
- Brand, M.; Tiberius, V.; Bican, P.M.; Brem, A. Agility as an innovation driver: Towards an agile front end of innovation framework. Rev. Manag. Sci. 2019. [Google Scholar] [CrossRef]
- Jurca, G.; Hellmann, T.D.; Maurer, F. Integrating Agile and User-Centered Design: A Systematic Mapping and Review of Evaluation and Validation Studies of Agile-UX. In Proceedings of the 2014 Agile Conference, Institute of Electrical and Electronics Engineers (IEEE), Kissimmee, FL, USA, 28 July–1 August 2014; pp. 24–32. [Google Scholar]
- Batistič, S.; Van Der Laken, P. History, Evolution and Future of Big Data and Analytics: A Bibliometric Analysis of Its Relationship to Performance in Organizations. Br. J. Manag. 2019, 30, 229–251. [Google Scholar] [CrossRef] [Green Version]
- Randhawa, K.; Wilden, R.; Hohberger, J. A bibliometric review of open innovation: Setting a research Agenda. J. Prod. Innov. Manag. 2016, 33, 750–772. [Google Scholar] [CrossRef]
- Vogel, R.; Güttel, W.H. The Dynamic Capability View in Strategic Management: A Bibliometric Review. Int. J. Manag. Rev. 2012. [Google Scholar] [CrossRef]
- Ball, R.; Tunger, D. Bibliometrische Analysen: Daten, Fakten und Methoden: Grundwissen Bibliometrie für Wissenschaftler, Wissenschaftsmanager, Forschungseinrichtungen und Hochschulen; Forschungszentrum Jülich, Zentralbibliothek: Jülich, Germany, 2005. [Google Scholar]
- Nielsen, J. A 100-Year View of User Experience. Nielsen Norman Group. Available online: https://www.nngroup.com/articles/100-years-ux/ (accessed on 21 February 2020).
- Hassenzahl, M. The Effect of Perceived Hedonic Quality on Product Appealingness. Int. J. Hum.-Comput. Interact. 2001, 13, 481–499. [Google Scholar] [CrossRef]
- Hassenzahl, M.; Burmester, M.; Koller, F. Der User Experience (UX) auf der Spur: Zum Einsatz von. Available online: www.attrakdiff (accessed on 12 February 2020).
- Hassenzahl, M.; Tractinsky, N. User experience—A research agenda. Behav. Inf. Technol. 2006, 25, 91–97. [Google Scholar] [CrossRef]
- International Organization for Standardization. ISO 9241-11:2018 Ergonomics of Human-System Interaction—Part 11: Usability: Definitions and Concepts. Available online: https://www.iso.org/standard/63500.html (accessed on 25 February 2020).
- International Organization for Standardization. ISO 9241-210:2019 Ergonomics of Human-System Interaction—Part 210: Human-Centred Design for Interactive Systems. Available online: https://www.iso.org/standard/77520.html (accessed on 25 February 2020).
- Merediz-Solà, I.; Bariviera, A.F. A bibliometric analysis of bitcoin scientific production. Res. Int. Bus. Financ. 2019, 50, 294–305. [Google Scholar] [CrossRef] [Green Version]
- Zupic, I.; Čater, T. Bibliometric Methods in Management and Organization. Organ. Res. Methods 2015, 18, 429–472. [Google Scholar] [CrossRef]
- Vanhala, M.; Lu, C.; Peltonen, J.; Sundqvist, S.; Nummenmaa, J.; Järvelin, K. The usage of large data sets in online consumer behaviour: A bibliometric and computational text-mining–driven analysis of previous research. J. Bus. Res. 2020, 106, 46–59. [Google Scholar] [CrossRef]
- Ferreira, M.P.; Santos, J.C.; De Almeida, M.I.R.; Reis, N.R. Mergers & acquisitions research: A bibliometric study of top strategy and international business journals, 1980–2010. J. Bus. Res. 2014, 67, 2550–2558. [Google Scholar] [CrossRef]
- Devos, P. Research and bibliometrics: A long history. Clin. Res. Hepatol. Gastroenterol. 2011, 35, 336–337. [Google Scholar] [CrossRef]
- Waltman, L.; Van Eck, N.J.; Noyons, E. A unified approach to mapping and clustering of bibliometric networks. J. Inf. 2010, 4, 629–635. [Google Scholar] [CrossRef] [Green Version]
- McCain, K.W. Mapping authors in intellectual space: A technical overview. J. Am. Soc. Inf. Sci. 1990, 41, 433–443. [Google Scholar] [CrossRef]
- Alonso, S.; Cabrerizo, F.; Herrera-Viedma, E.; Herrera, F. h-Index: A review focused in its variants, computation and standardization for different scientific fields. J. Inf. 2009, 3, 273–289. [Google Scholar] [CrossRef] [Green Version]
- Hirsch, J. An index to quantify an individual’s scientific research output. Proc. Natl. Acad. Sci. USA 2005, 102, 16569–16572. [Google Scholar] [CrossRef] [Green Version]
- Gaviria-Marin, M.; Lindahl, J.M.M.; Baier-Fuentes, H. Knowledge management: A global examination based on bibliometric analysis. Technol. Forecast. Soc. Chang. 2019, 140, 194–220. [Google Scholar] [CrossRef]
- Van Eck, N.J.; Waltman, L. VOSviewer Manual—Version 1.6.10. Available online: https://www.vosviewer.com/documentation/Manual_VOSviewer_1.6.10.pdf (accessed on 3 March 2020).
- Van Eck, N.J.; Waltman, L. Visualizing Bibliometric Networks. In Measuring Scholarly Impact; Ding, Y., Rousseau, R., Wolfram, D., Eds.; Springer: Cham, Germany, 2014; pp. 285–320. [Google Scholar]
- Vallaster, C.; Kraus, S.; Lindahl, J.M.M.; Nielsen, A. Ethics and entrepreneurship: A bibliometric study and literature review. J. Bus. Res. 2019, 99, 226–237. [Google Scholar] [CrossRef]
- Carvalho, M.M.; Fleury, A.; Lopes, A.P. An overview of the literature on technology roadmapping (TRM): Contributions and trends. Technol. Forecast. Soc. Chang. 2013, 80, 1418–1437. [Google Scholar] [CrossRef]
- Glänzel, W. On the h-index—A mathematical approach to a new measure of publication activity and citation impact. Scientometrics 2006, 67, 315–321. [Google Scholar] [CrossRef]
- Van Oorschot, J.A.; Hofman, E.; Halman, J.I. A bibliometric review of the innovation adoption literature. Technol. Forecast. Soc. Chang. 2018, 134, 1–21. [Google Scholar] [CrossRef] [Green Version]
- Callon, M.; Courtial, J.-P.; Turner, W.A.; Bauin, S. From translations to problematic networks: An introduction to co-word analysis. Soc. Sci. Inf. 1983, 22, 191–235. [Google Scholar] [CrossRef]
- Van Eck, N.J.; Waltman, L. Software survey: VOSviewer, a computer program for bibliometric mapping. Scientometrics 2009, 84, 523–538. [Google Scholar] [CrossRef] [Green Version]
- Gaggioli, A.; Villani, D.; Serino, S.; Banos, R.; Botella, C. Editorial: Positive Technology: Designing E-experiences for Positive Change. Front. Psychol. 2019, 10, 1571. [Google Scholar] [CrossRef]
- Thüring, M.; Mahlke, S. Usability, aesthetics and emotions in human–technology interaction. Int. J. Psychol. 2007, 42, 253–264. [Google Scholar] [CrossRef]
- Yu, H.; Seo, I.; Choi, J. A study of critical factors affecting adoption of self-customisation service—Focused on value-based adoption model. Total Qual. Manag. Bus. Excell. 2019, 30, 98–113. [Google Scholar] [CrossRef]
- Grzegorczyk, T.; Sliwinski, R.; Kaczmarek, J. Attractiveness of augmented reality to consumers. Technol. Anal. Strat. Manag. 2019, 31, 1257–1269. [Google Scholar] [CrossRef]
- Hart, J.; Sutcliffe, A. Is it all about the Apps or the Device? User experience and technology acceptance among iPad users. Int. J. Hum.-Comput. Stud. 2019, 130, 93–112. [Google Scholar] [CrossRef]
- Beltagui, A.; Candi, M.; Riedel, J.C. Setting the stage for service experience: Design strategies for functional services. J. Serv. Manag. 2016, 27, 751–772. [Google Scholar] [CrossRef]
- Taylor, S.; Todd, P. Assessing IT Usage: The Role of Prior Experience. MIS Q. 1995, 19, 561. [Google Scholar] [CrossRef] [Green Version]
- Chung, J.; Tan, F.B. Antecedents of perceived playfulness: An exploratory study on user acceptance of general information-searching websites. Inf. Manag. 2004, 41, 869–881. [Google Scholar] [CrossRef] [Green Version]
- Gupta, S.N. A Task-Based Model of Perceived Website Complexity. MIS Q. 2007, 31, 501. [Google Scholar] [CrossRef]
- Tuch, A.N.; Presslaber, E.E.; Stöcklin, M.; Opwis, K.; Bargas-Avila, J.A. The role of visual complexity and proto-typicality regarding first impression of websites: Working towards understanding aesthetic judgments. Int. J. Hum.-Comput. Stud. 2012, 70, 794–811. [Google Scholar] [CrossRef]
- Van Schaik, P.; Ling, J. The role of context in perceptions of the aesthetics of web pages over time. Int. J. Hum.-Comput. Stud. 2009, 67, 79–89. [Google Scholar] [CrossRef] [Green Version]
- Tuch, A.N.; Roth, S.; Hornbæk, K.; Opwis, K.; Bargas-Avila, J.A. Is beautiful really usable? Toward understanding the relation between usability, aesthetics, and affect in HCI. Comput. Hum. Behav. 2012, 28, 1596–1607. [Google Scholar] [CrossRef]
- Bilgihan, A. Gen Y customer loyalty in online shopping: An integrated model of trust, user experience and branding. Comput. Hum. Behav. 2016, 61, 103–113. [Google Scholar] [CrossRef]
- Ogara, S.O.; Koh, C.E.; Prybutok, V.R. Investigating factors affecting social presence and user satisfaction with Mobile Instant Messaging. Comput. Hum. Behav. 2014, 36, 453–459. [Google Scholar] [CrossRef]
- Lallemand, C.; Gronier, G.; Koenig, V. User experience: A concept without consensus? Exploring practitioners’ perspectives through an international survey. Comput. Hum. Behav. 2015, 43, 35–48. [Google Scholar] [CrossRef]
- Law, E.L.-C.; Van Schaik, P.; Roto, V. Attitudes towards user experience (UX) measurement. Int. J. Hum.-Comput. Stud. 2014, 72, 526–541. [Google Scholar] [CrossRef] [Green Version]
- Tiberius, V.; Hirth, S. Impacts of digitization on auditing: A Delphi study for Germany. J. Int. Account. Audit. Tax. 2019, 37, 100288. [Google Scholar] [CrossRef]
Figure 1.
Annual number of UX publications. Source: Own elaboration based on WoS.

Figure 2.
Sources co-citation map. Source: Own elaboration based on VOSViewer.

Figure 3.
Author co-citation analysis. Source: Own elaboration based on VOSViewer.

Figure 4.
Mapping of most productive countries. Source: Own elaboration based on VOSviewer.

Figure 5.
Keyword co-occurrence map. Source: Own elaboration based on VOSViewer.

Figure 6.
Topic words map. Source: Own elaboration based on VOSViewer.


Table 1.
Number of UX publications per discipline. Source: Own elaboration based on WoS.
| Discipline | # Records | % of 189 |
|---|---|---|
| Psychology | 121 | 64.0% |
| Computer Science | 78 | 41.3% |
| Business Economics | 68 | 36.0% |
| Engineering | 56 | 29.6% |
| Information Science Library Science | 18 | 9.5% |
| Operations Research Management | 6 | 3.2% |
| Social Science Other Topics | 5 | 2.6% |
| Telecommunications | 4 | 2.1% |
| Science Technology Other Topics | 3 | 1.6% |
| Behavioral Science | 2 | 1.1% |
| Public Administration | 2 | 1.1% |
| Art | 1 | 0.5% |
| Mathematical Methods in Social Science | 1 | 0.5% |
| Sociology | 1 | 0.5% |
Table 2.
Top ten most productive sources. Source: Own elaboration based on WoS.
| Sources | # Articles | Type | H-Index |
|---|---|---|---|
| Computers in Human Behavior | 50 | Article | 137 |
| International Journal of Human-Computer Studies | 46 | Article; Editorial Material | 109 |
| Information & Management | 9 | Article | 142 |
| Frontiers in Psychology | 7 | Article; Editorial Material | 81 |
| Experience with Technology: Dynamics of User Experience with Mobile Media Device | 6 | Book | n.n. |
| MIS Quarterly | 5 | Article | 195 |
| Applied Ergonomics | 4 | Article | 84 |
| Information Systems and E-Business Management | 4 | Article; Editorial Material | 31 |
| Value-Driven Business in the Cloud | 3 | Book | n.n. |
| Ergonomics | 3 | Article; Book Review | 97 |
Table 3.
Most productive authors. Source: Own elaboration based on WoS.
| Name | Affiliation | # Articles | # Citations |
|---|---|---|---|
| D. Frohlich | University of Surrey | 5 | 0 |
| M. Wilson | University of Surrey | 5 | 0 |
| D. Shin | Chung Ang University | 4 | 121 |
| K. Opwis | Universitat Basel | 3 | 191 |
| A. N. Tuch | Swiss Heal Observatory | 3 | 191 |
| P. van Schaik | Teesside University | 3 | 143 |
| D. Fonseca | Universitat Ramon Llull | 3 | 110 |
| E.L. Law | University of Leicester | 3 | 103 |
| F. Munoz-Leiva | Universidad de Granada | 2 | 175 |
| M. Thuering | Technical University of Berlin | 2 | 160 |
| S. P. Roth | Universitat Basel | 2 | 107 |
| J. Ling | University of Sunderland | 2 | 94 |
| V. R. Prybutok | University of North Texas | 2 | 90 |
| E. Redondo | Universitat Politècnica Catalunya | 2 | 88 |
Table 4.
Most productive and influential countries. Source: Own elaboration based on WoS.
| Country | # Articles | # Citations |
|---|---|---|
| USA | 40 | 1304 |
| South Korea | 21 | 573 |
| UK | 34 | 470 |
| Spain | 17 | 377 |
| Germany | 12 | 218 |
Table 5.
Most relevant keywords. Source: Own elaboration based on VOSviewer.
| Rang | Keyword | O | TLS |
|---|---|---|---|
| 1 | User experience | 81 | 238 |
| 2 | Usability | 35 | 119 |
| 3 | Model | 26 | 110 |
| 4 | Technology | 18 | 81 |
| 5 | User acceptance | 13 | 74 |
| 6 | Behavior | 18 | 72 |
| 7 | Information-technology | 16 | 71 |
| 8 | Acceptance | 17 | 70 |
| 9 | Perceptions | 14 | 64 |
| 10 | Technology acceptance | 14 | 64 |
| 11 | Design | 22 | 62 |
| 12 | Technology acceptance model | 11 | 55 |
| 13 | Adoption | 13 | 52 |
| 14 | Quality | 13 | 52 |
| 15 | Satisfaction | 11 | 52 |
| 16 | Aesthetics | 12 | 51 |
| 17 | Experience | 14 | 50 |
| 18 | Online | 9 | 42 |
| 19 | Motivation | 8 | 39 |
| 20 | Impact | 10 | 38 |
Abbreviations: O = Occurrences, TLS = Total link strength.
Table 6.
Keywords and keywords plus. Source: Own elaboration based on VOSviewer.
| Rank | Keyword | O | TLS | Keyword Plus | O | TLS |
|---|---|---|---|---|---|---|
| 1 | User experience | 77 | 31 | Model | 25 | 73 |
| 2 | User experience (UX) | 6 | 17 | Behavior | 18 | 58 |
| 3 | Human-computer interaction | 5 | 16 | Usability | 25 | 57 |
| 4 | Mobile device usability | 5 | 16 | Acceptance | 17 | 55 |
| 5 | User experience dynamics | 5 | 16 | Technology | 17 | 51 |
| 6 | Usability | 13 | 14 | Information-technology | 16 | 71 |
| 7 | Aesthetics | 7 | 13 | Quality | 13 | 43 |
| 8 | Emotions | 8 | 8 | Adoption | 12 | 42 |
| 9 | Human-computer interaction | 6 | 8 | Perceptions | 14 | 41 |
| 10 | Design | 8 | 7 | User acceptance | 11 | 39 |
| 11 | Technology adoption | 5 | 7 | Technology acceptance | 10 | 36 |
| 12 | Augmented reality | 5 | 4 | Online | 9 | 32 |
| 13 | Technology acceptance model | 5 | 3 | Satisfaction | 9 | 32 |
| 14 | - | Determinants | 7 | 30 | ||
| 15 | - | Impact | 10 | 30 |
Abbreviations: O = Occurrence, TLS = Total link strength.
Table 7.
The 20 most cited articles. Source: Own elaboration based on WoS.
| C | Author(s) (year) | Title | Source | A/Y |
|---|---|---|---|---|
| 983 | Taylor and Todd (1995) | Assessing IT usage: The role of prior experience | MIS Quarterly | 39.32 |
| 240 | Sabherwal et al. (2006) | Information system success: Individual and organizational determinants | Management Science | 17.14 |
| 166 | Castaneda et al. (2007) | Web Acceptance Model (WAM): Moderating effects of user experience | Information & Management | 12.77 |
| 153 | Im et al. (2008) | The effects of perceived risk and technology type on users’ acceptance of technologies | Information & Management | 12.75 |
| 147 | Thuring and Mahike (2007) | Usability, aesthetics and emotions in human-technology interaction | International Journal of Psychology | 11.31 |
| 144 | Chung and Tan (2004) | Antecedents of perceived playfulness: an exploratory study on user acceptance of general information-searching websites | Information & Management | 9 |
| 123 | Kohler et al. (2011) | CO-Creation in virtual worlds: The design of the user Experience | MIS Quarterly | 13.67 |
| 108 | Nadkarni and Gupta (2007) | A task-based model of perceived website complexity | MIS Quarterly | 8.31 |
| 94 | Gatain (1994) | Is user satisfaction a valid measure of system effectiveness? | Information & Management | 3.62 |
| 84 | Tuch, Presslaber et al. (2012a) | The role of visual complexity and prototypicality regarding first impression of websites: Working towards understanding aesthetic judgments | International Journal of Human-Computer Studies | 10.5 |
| 82 | van Schaik and Ling (2009) | The role of context in perceptions of the aesthetics of web pages over time | International Journal of Human-Computer Studies | 7.45 |
| 81 | Fonseca et al. (2014) | Relationship between student profile, tool use, participation, and academic performance with the use of Augmented Reality technology for visualized architecture models | Computers in Human Behavior | 13.5 |
| 76 | Tuch, Roth et al. (2012) | Is beautiful really usable? Toward understanding the relation between usability, aesthetics, and affect in HCI | Computers in Human Behavior | 9.5 |
| 60 | Bilgihan (2016) | Gen Y customer loyalty in online shopping: An integrated model of trust, user experience and branding | Computers in Human Behavior | 15 |
| 59 | Ogara et al. (2014) | Investigating factors affecting social presence and user satisfaction with Mobile Instant Messaging | Computers in Human Behavior | 9.83 |
| 57 | Burigat and Chittaro (2007) | Navigation in 3D virtual environments: Effects of user experience and location-pointing navigation aids | International Journal of Human-Computer Studies | 4.38 |
| 51 | Lallemand et al. (2015) | User experience: A concept without consensus? Exploring practitioners’ perspectives through an international survey | Computers in Human Behavior | 10.2 |
| 49 | Law et al. (2014) | Attitudes towards user experience (UX) measurement | International Journal of Human-Computer Studies | 8.17 |
| 49 | Bruseberg and McDonagh-Philp (2001) | New product development by eliciting user experience and aspirations | International Journal of Human-Computer Studies | 2.58 |
| 47 | Hirschheim (1985) | User experience with an assessment of participative systems-design | MIS Quarterly | 1.34 |
Abbreviations: C = citations, A/Y = Average citations per year.
© 2020 by the authors. Licensee MDPI, Basel, Switzerland. This article is an open access article distributed under the terms and conditions of the Creative Commons Attribution (CC BY) license (http://creativecommons.org/licenses/by/4.0/).
Share and Cite
MDPI and ACS Style
Luther, L.; Tiberius, V.; Brem, A. User Experience (UX) in Business, Management, and Psychology: A Bibliometric Mapping of the Current State of Research. Multimodal Technol. Interact. 2020, 4, 18. https://doi.org/10.3390/mti4020018
AMA Style
Luther L, Tiberius V, Brem A. User Experience (UX) in Business, Management, and Psychology: A Bibliometric Mapping of the Current State of Research. Multimodal Technologies and Interaction. 2020; 4(2):18. https://doi.org/10.3390/mti4020018
Chicago/Turabian StyleLuther, Laura, Victor Tiberius, and Alexander Brem. 2020. "User Experience (UX) in Business, Management, and Psychology: A Bibliometric Mapping of the Current State of Research" Multimodal Technologies and Interaction 4, no. 2: 18. https://doi.org/10.3390/mti4020018