Paper-Based Assessment of the Effects of Aging on Response Time: A Diffusion Model Analysis

 , ,
, ,
Abstract
:1. Introduction
1.1. Age-Related Cognitive Slowing and the Diffusion Model
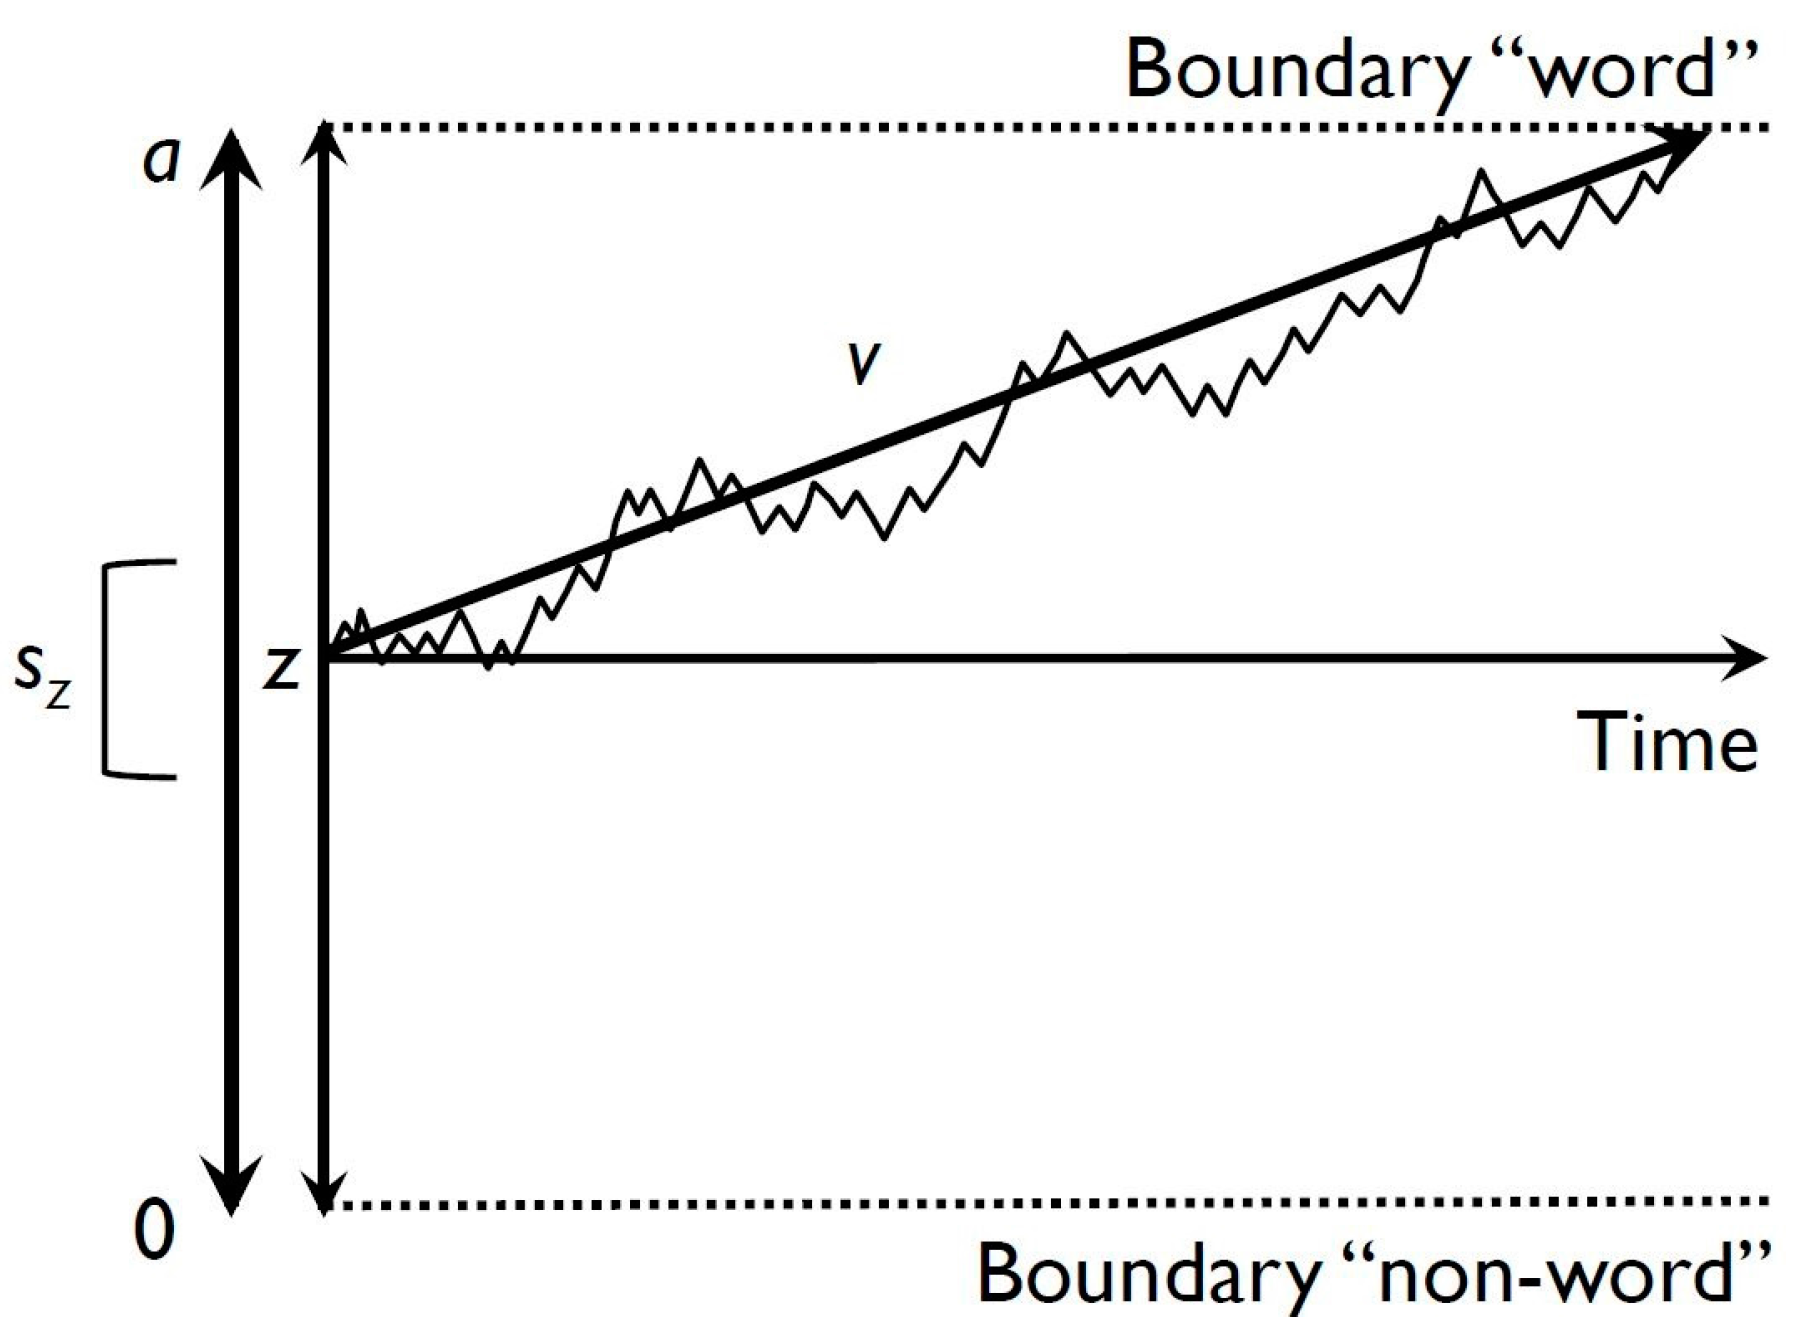
1.2. The Diffusion Model
1.3. Motivation for the Current Study
1.4. Research Questions and Hypotheses
- Can age-related differences in processing speed be investigated from a comprehensive diffusion model perspective in a paper-based lexical decision experiment using digital pens?
- To what degree do results compare to findings previously obtained with the diffusion model in computer-based assessment?
2. Experimental Section
2.1. Participants
2.2. Procedure
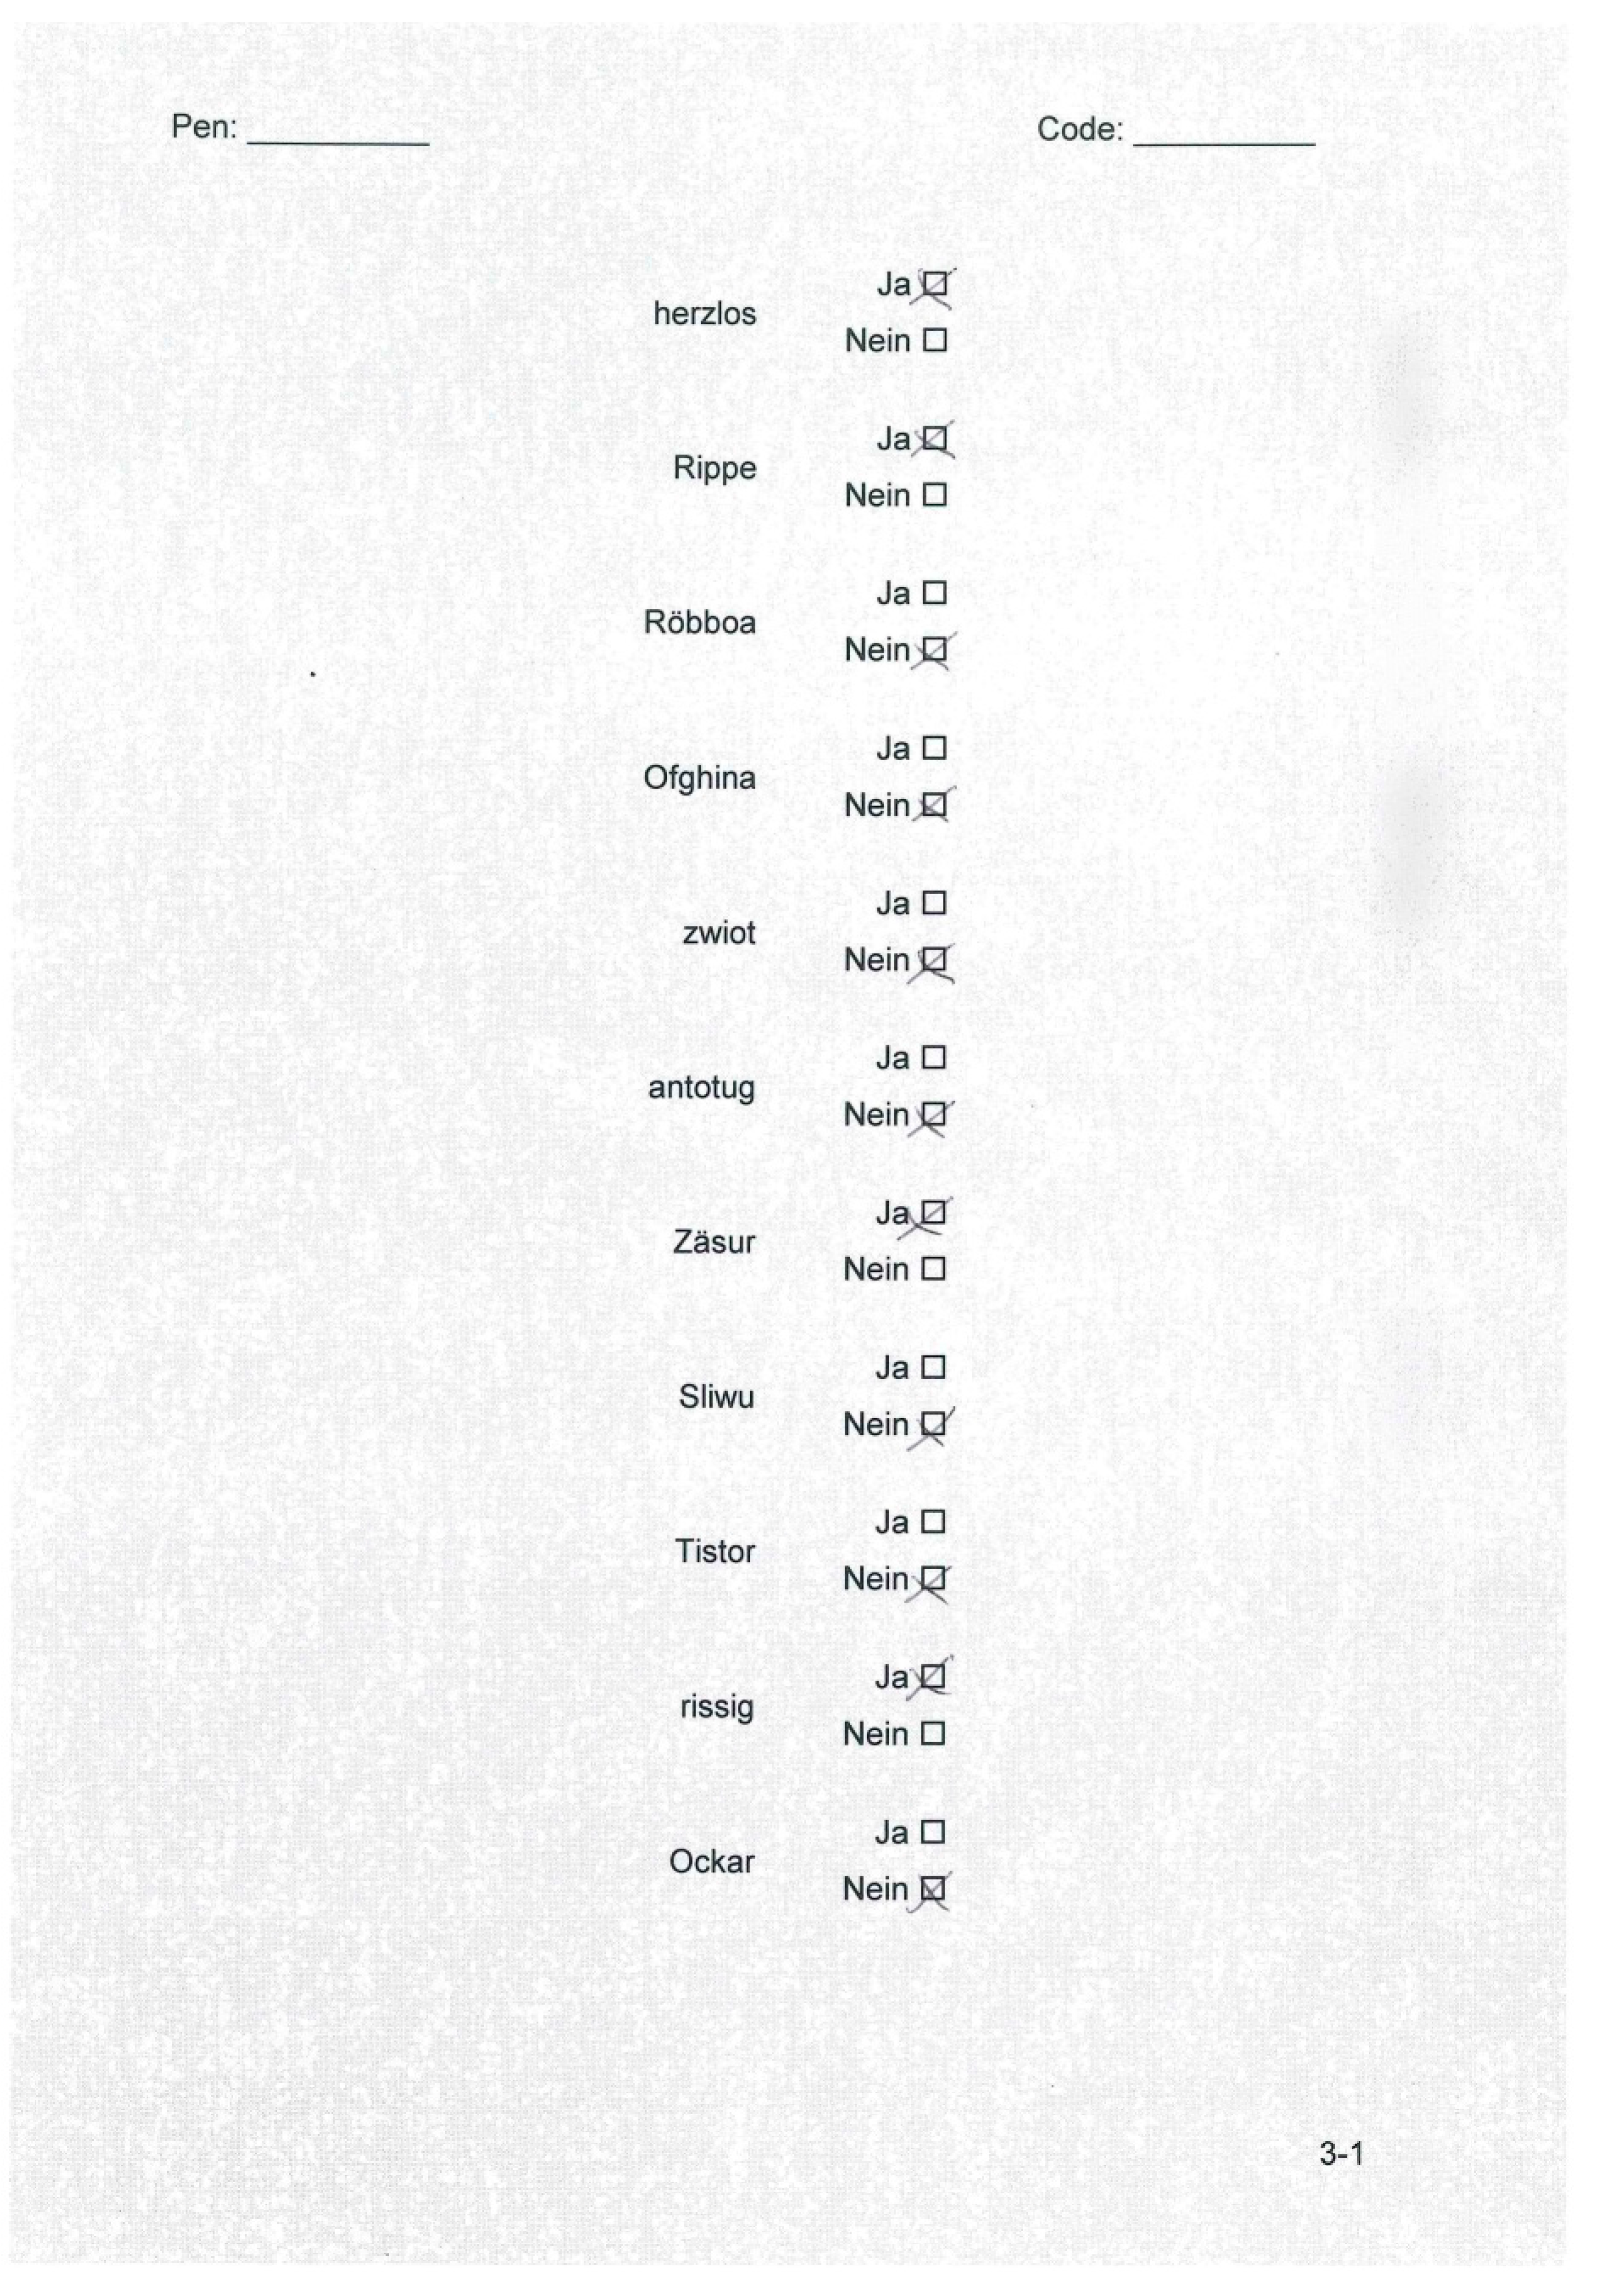
2.3. Stimuli
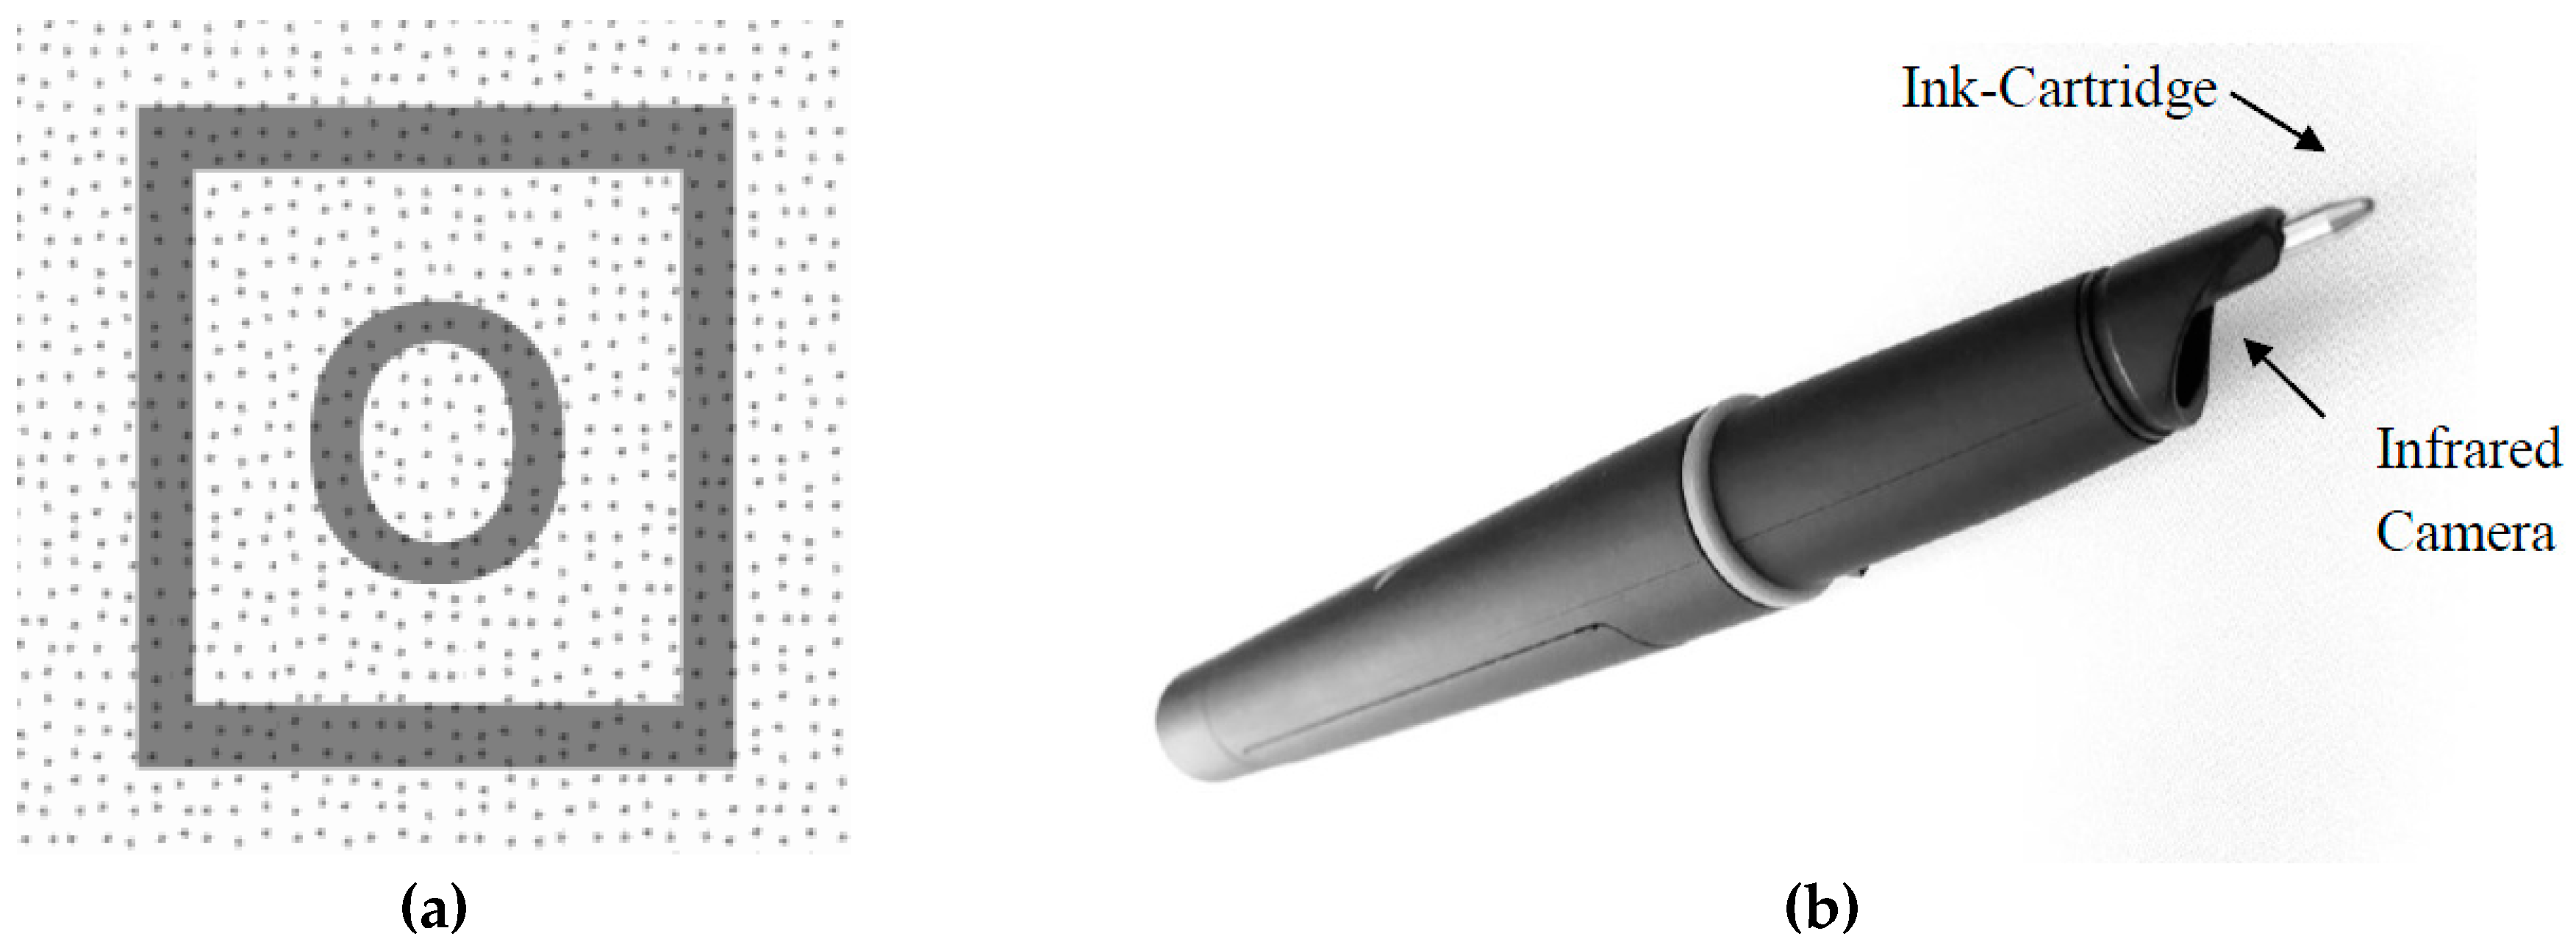
2.4. Apparatus
2.5. Background Measures
2.6. Estimation of the Diffusion Model Parameters
2.7. Data Analysis
3. Results and Discussion
3.1. Results on RT and Accuracy
3.2. Results from Diffusion Model Analyses
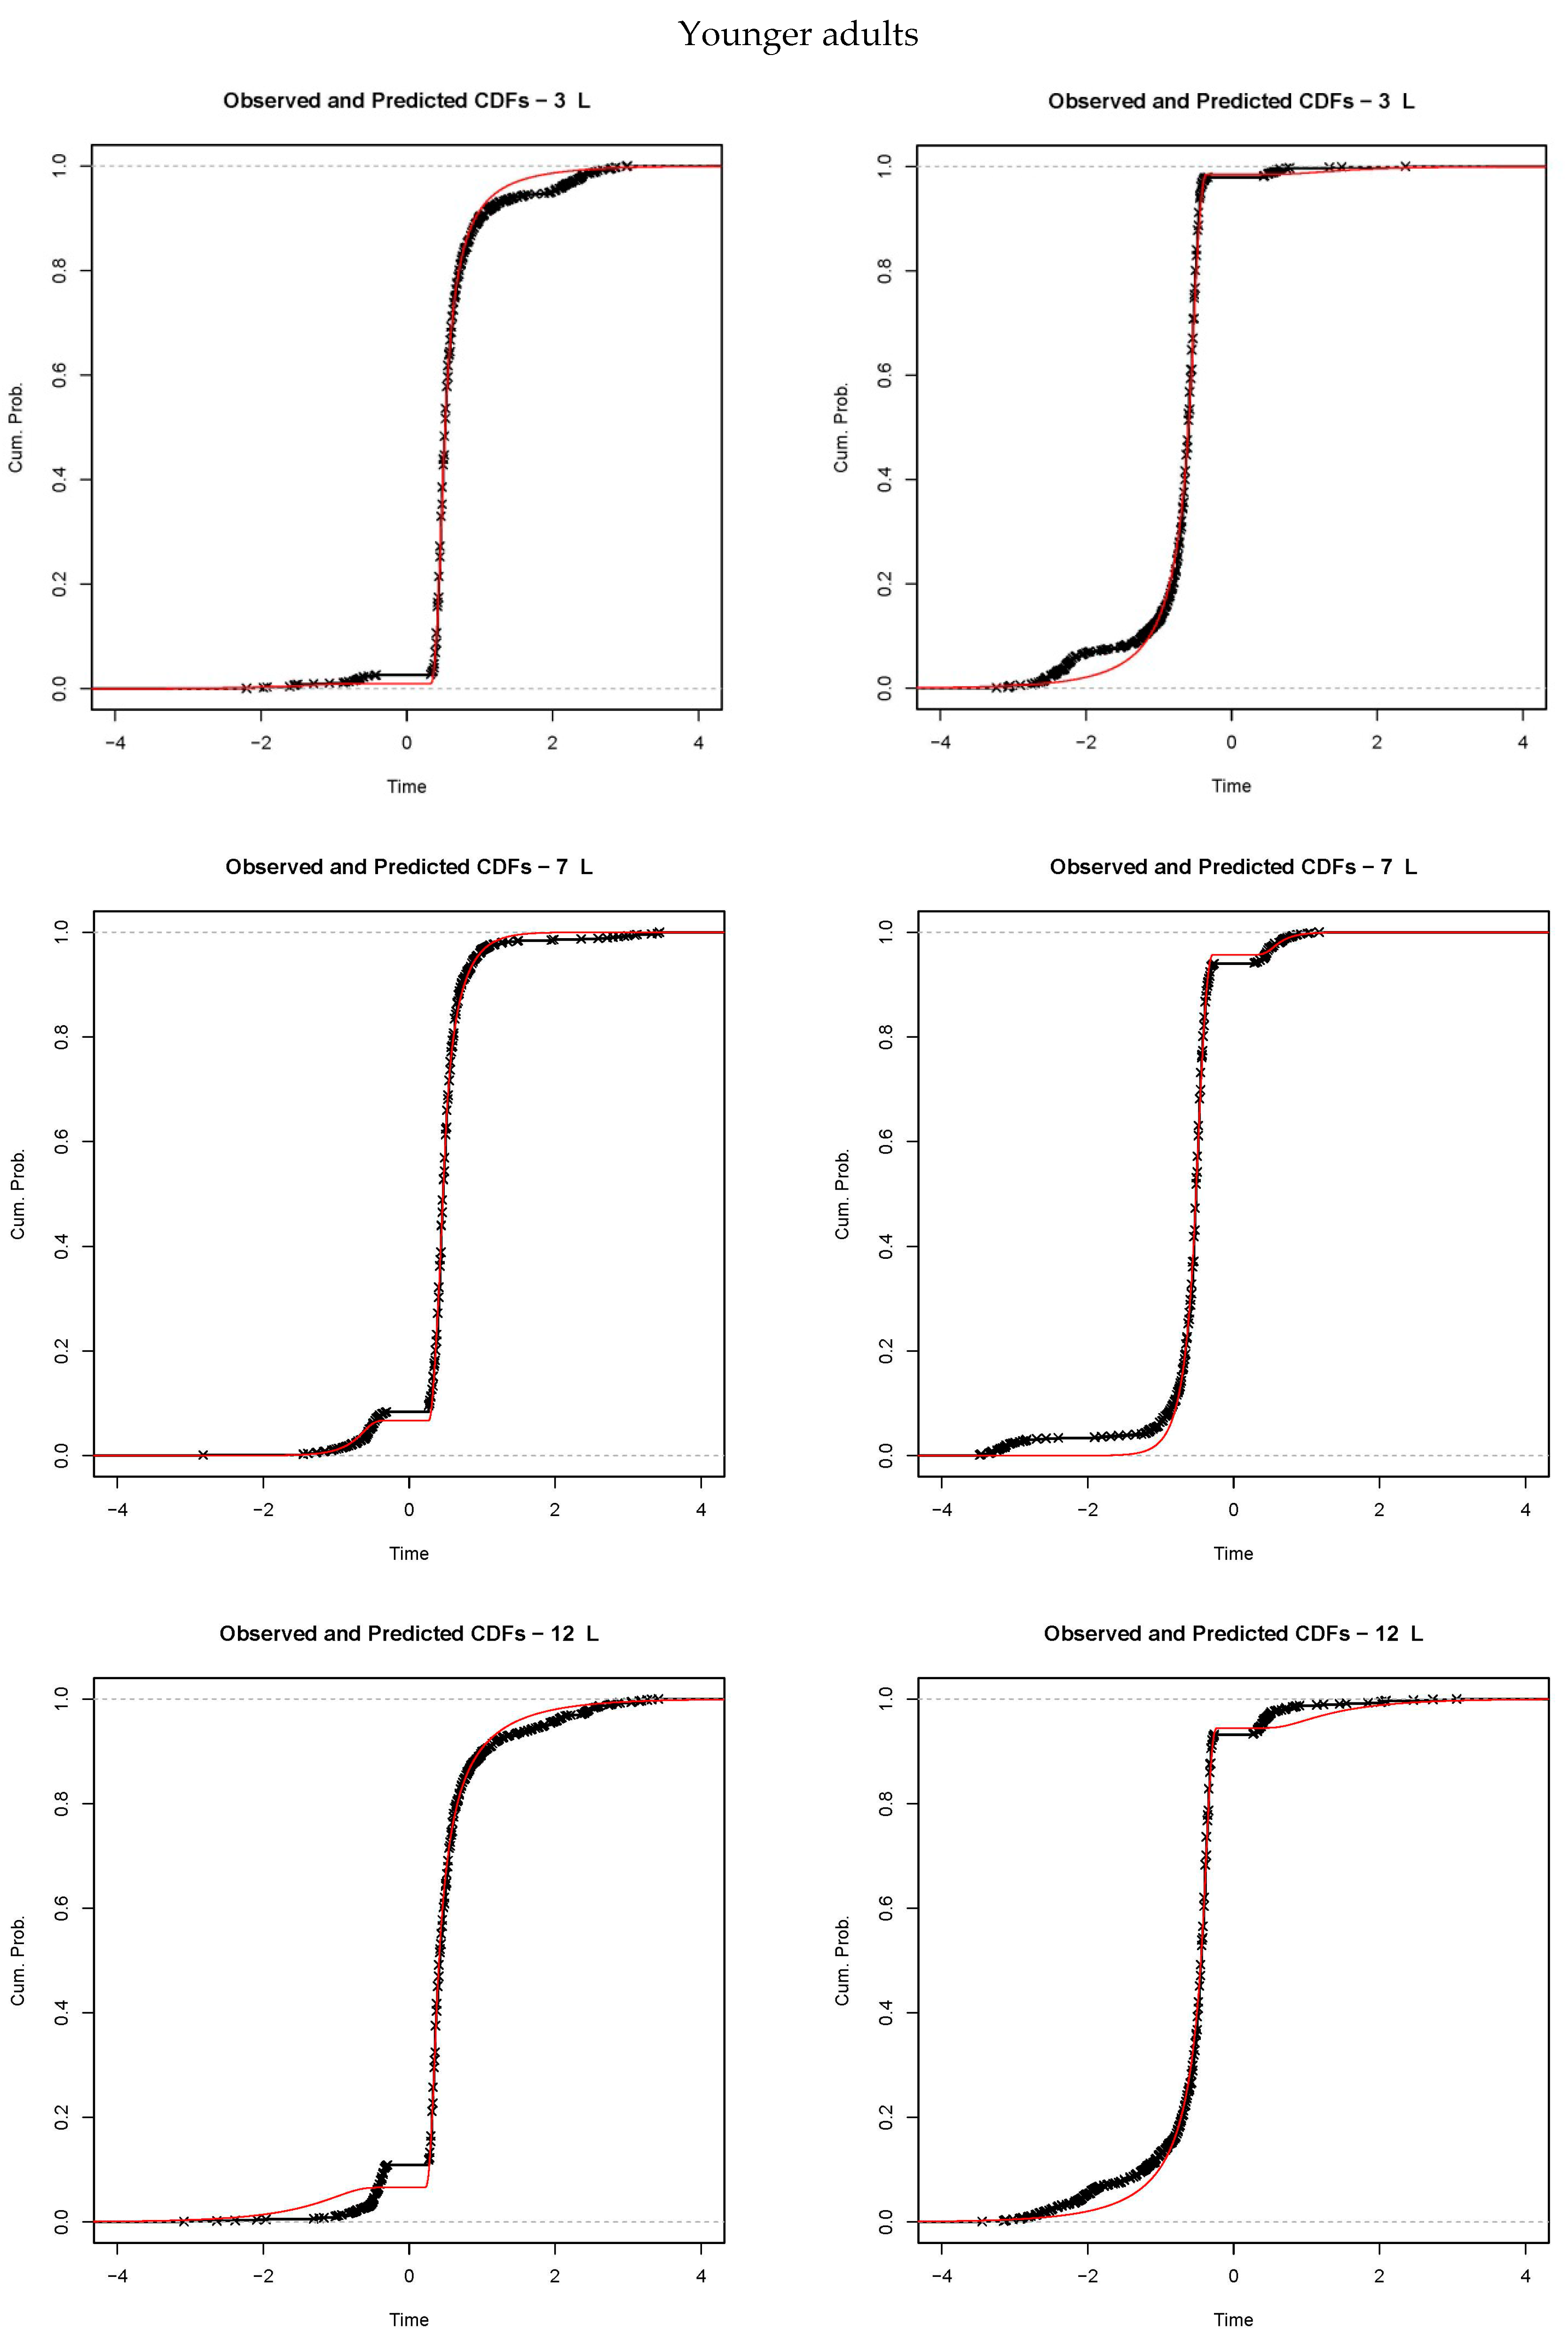
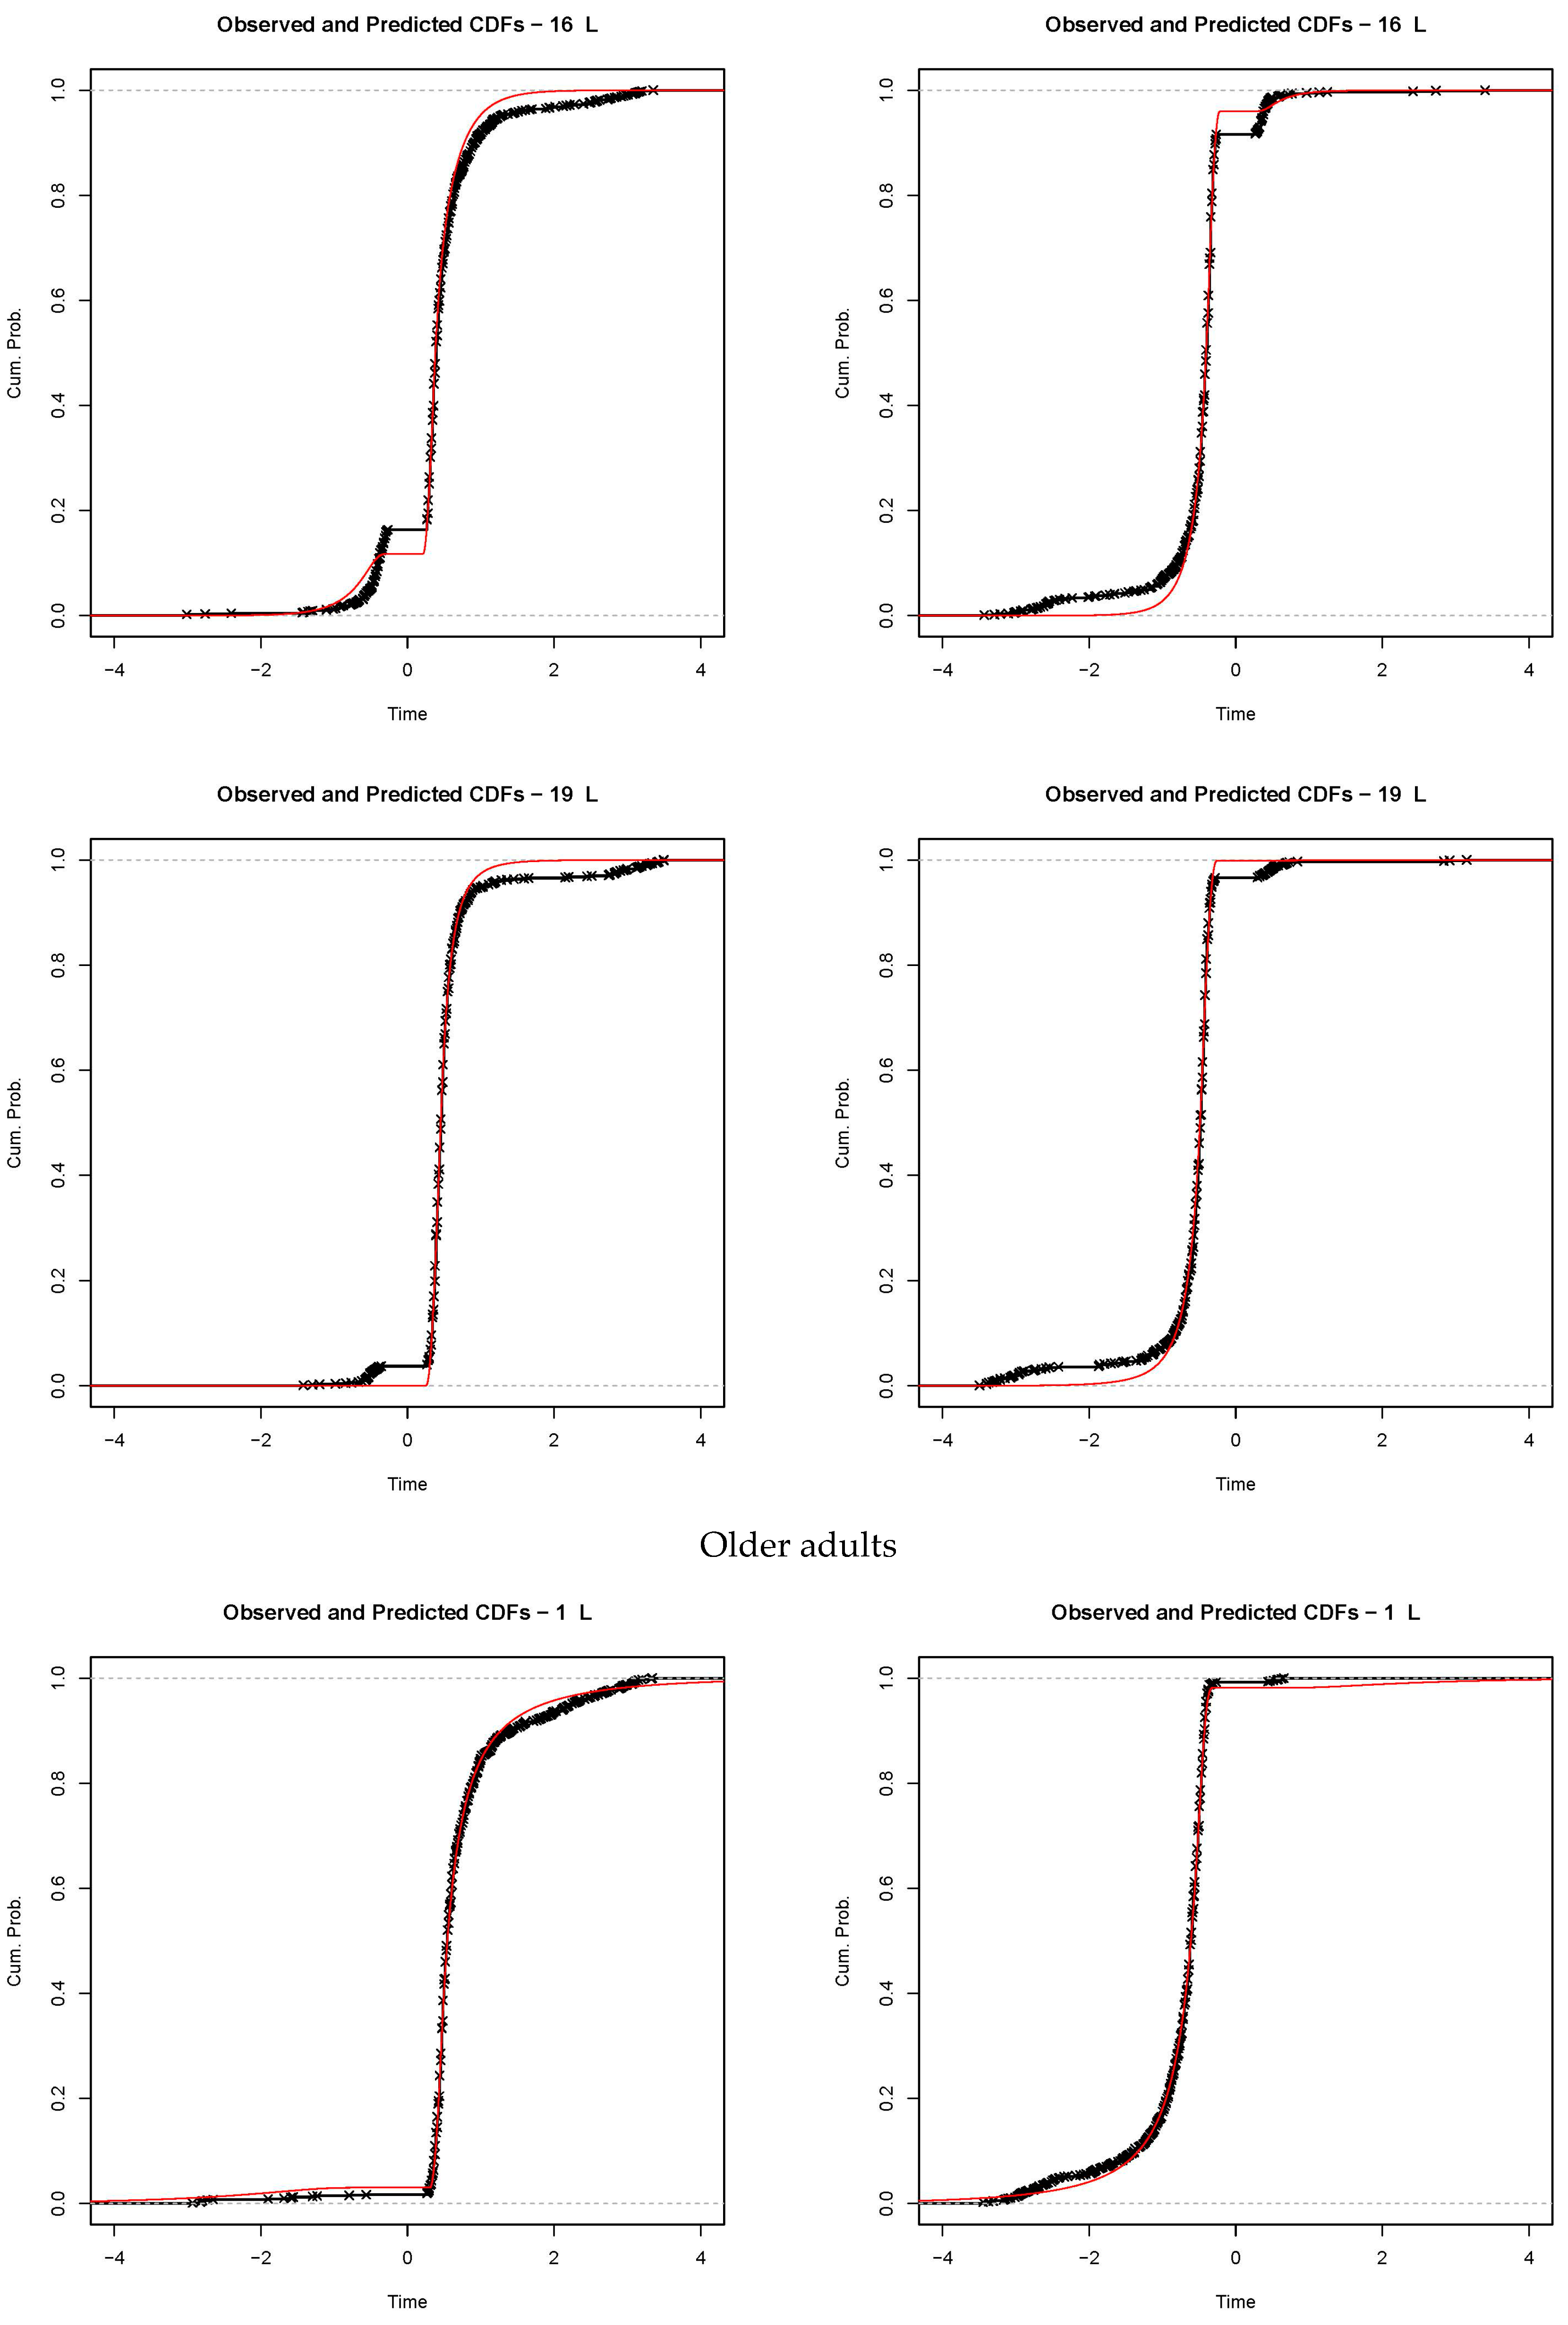
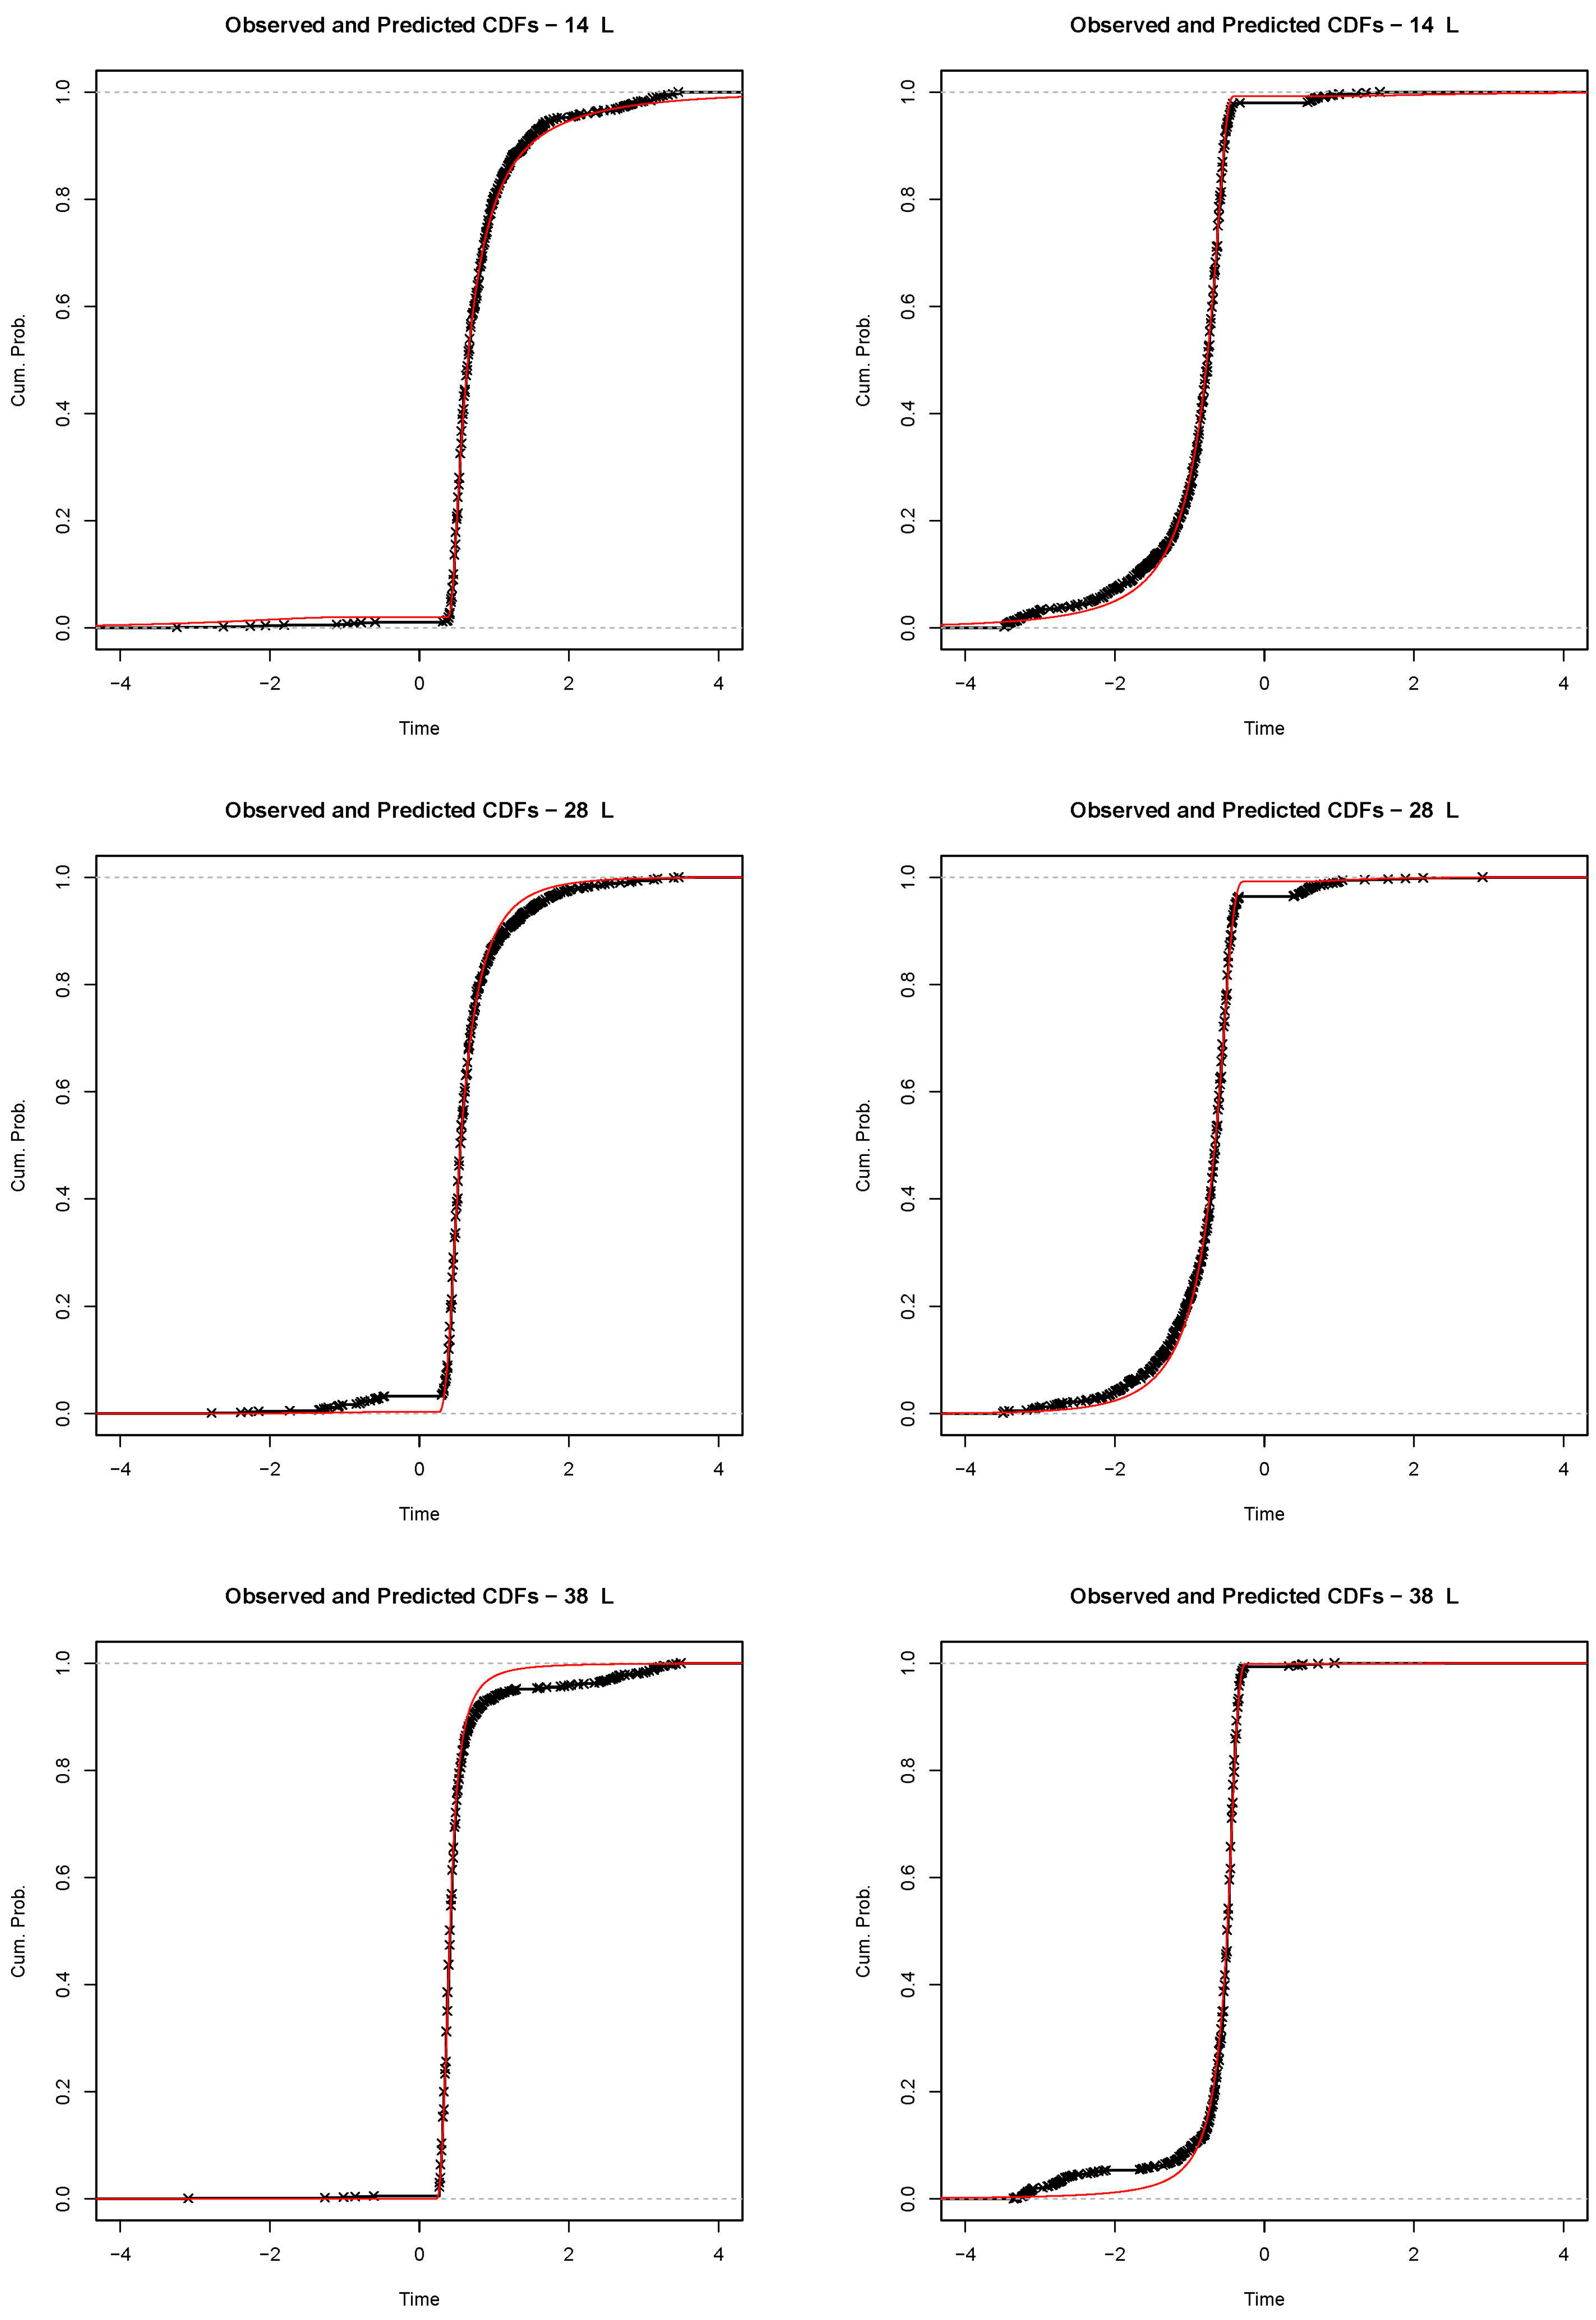
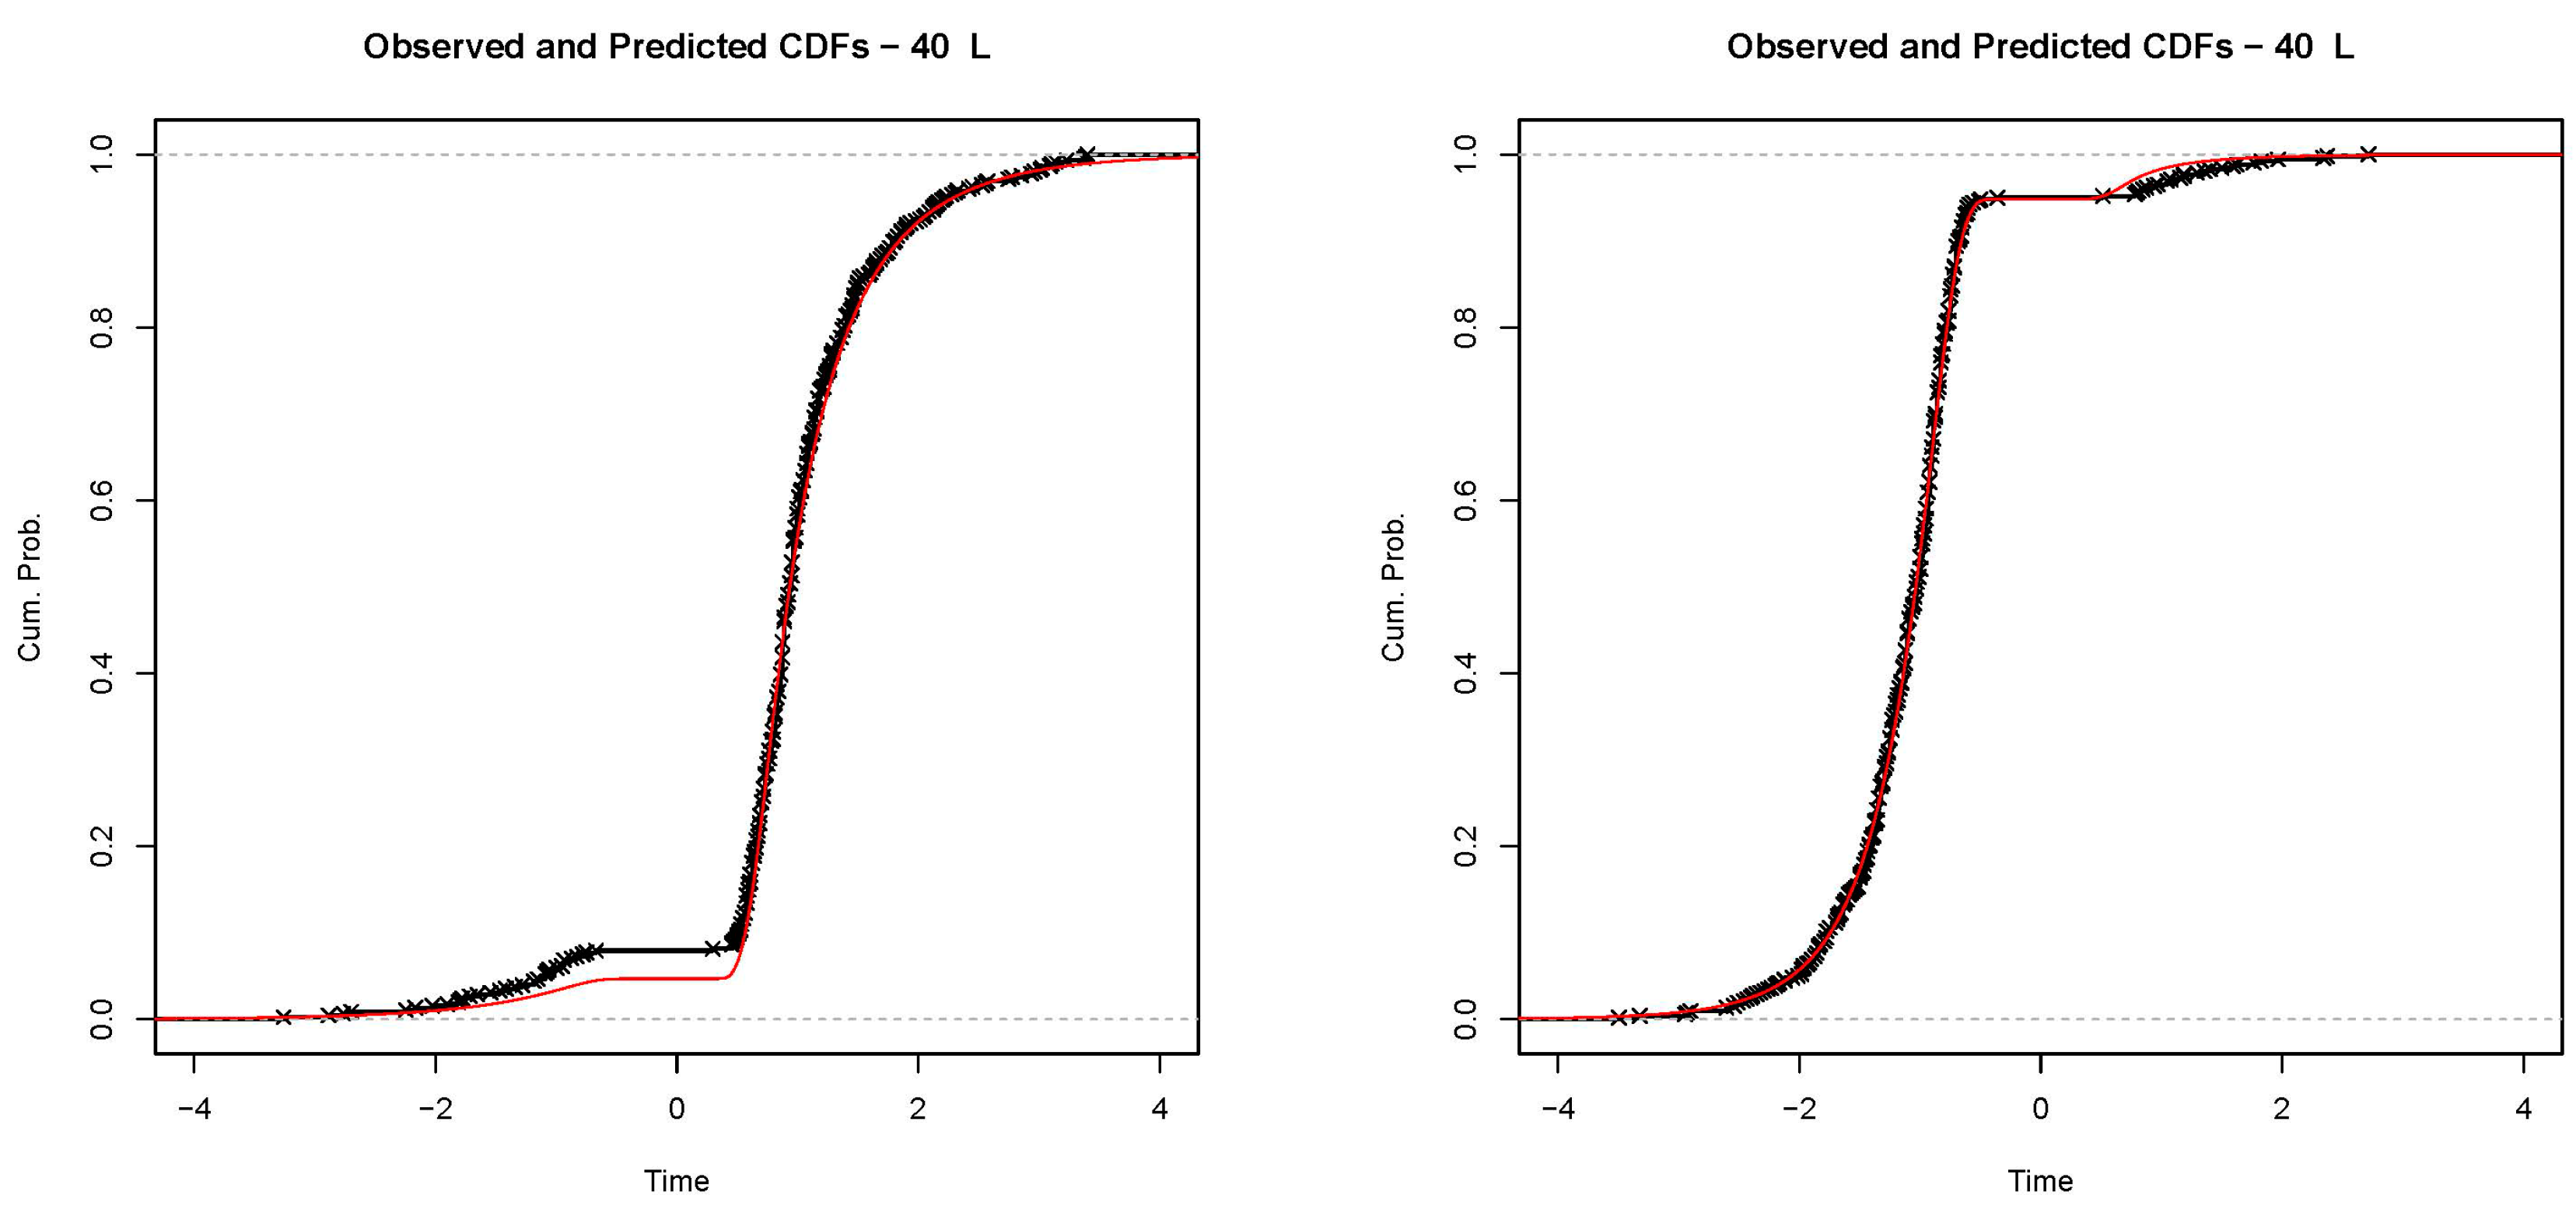
3.3. Fits of the Diffusion Model to the Data
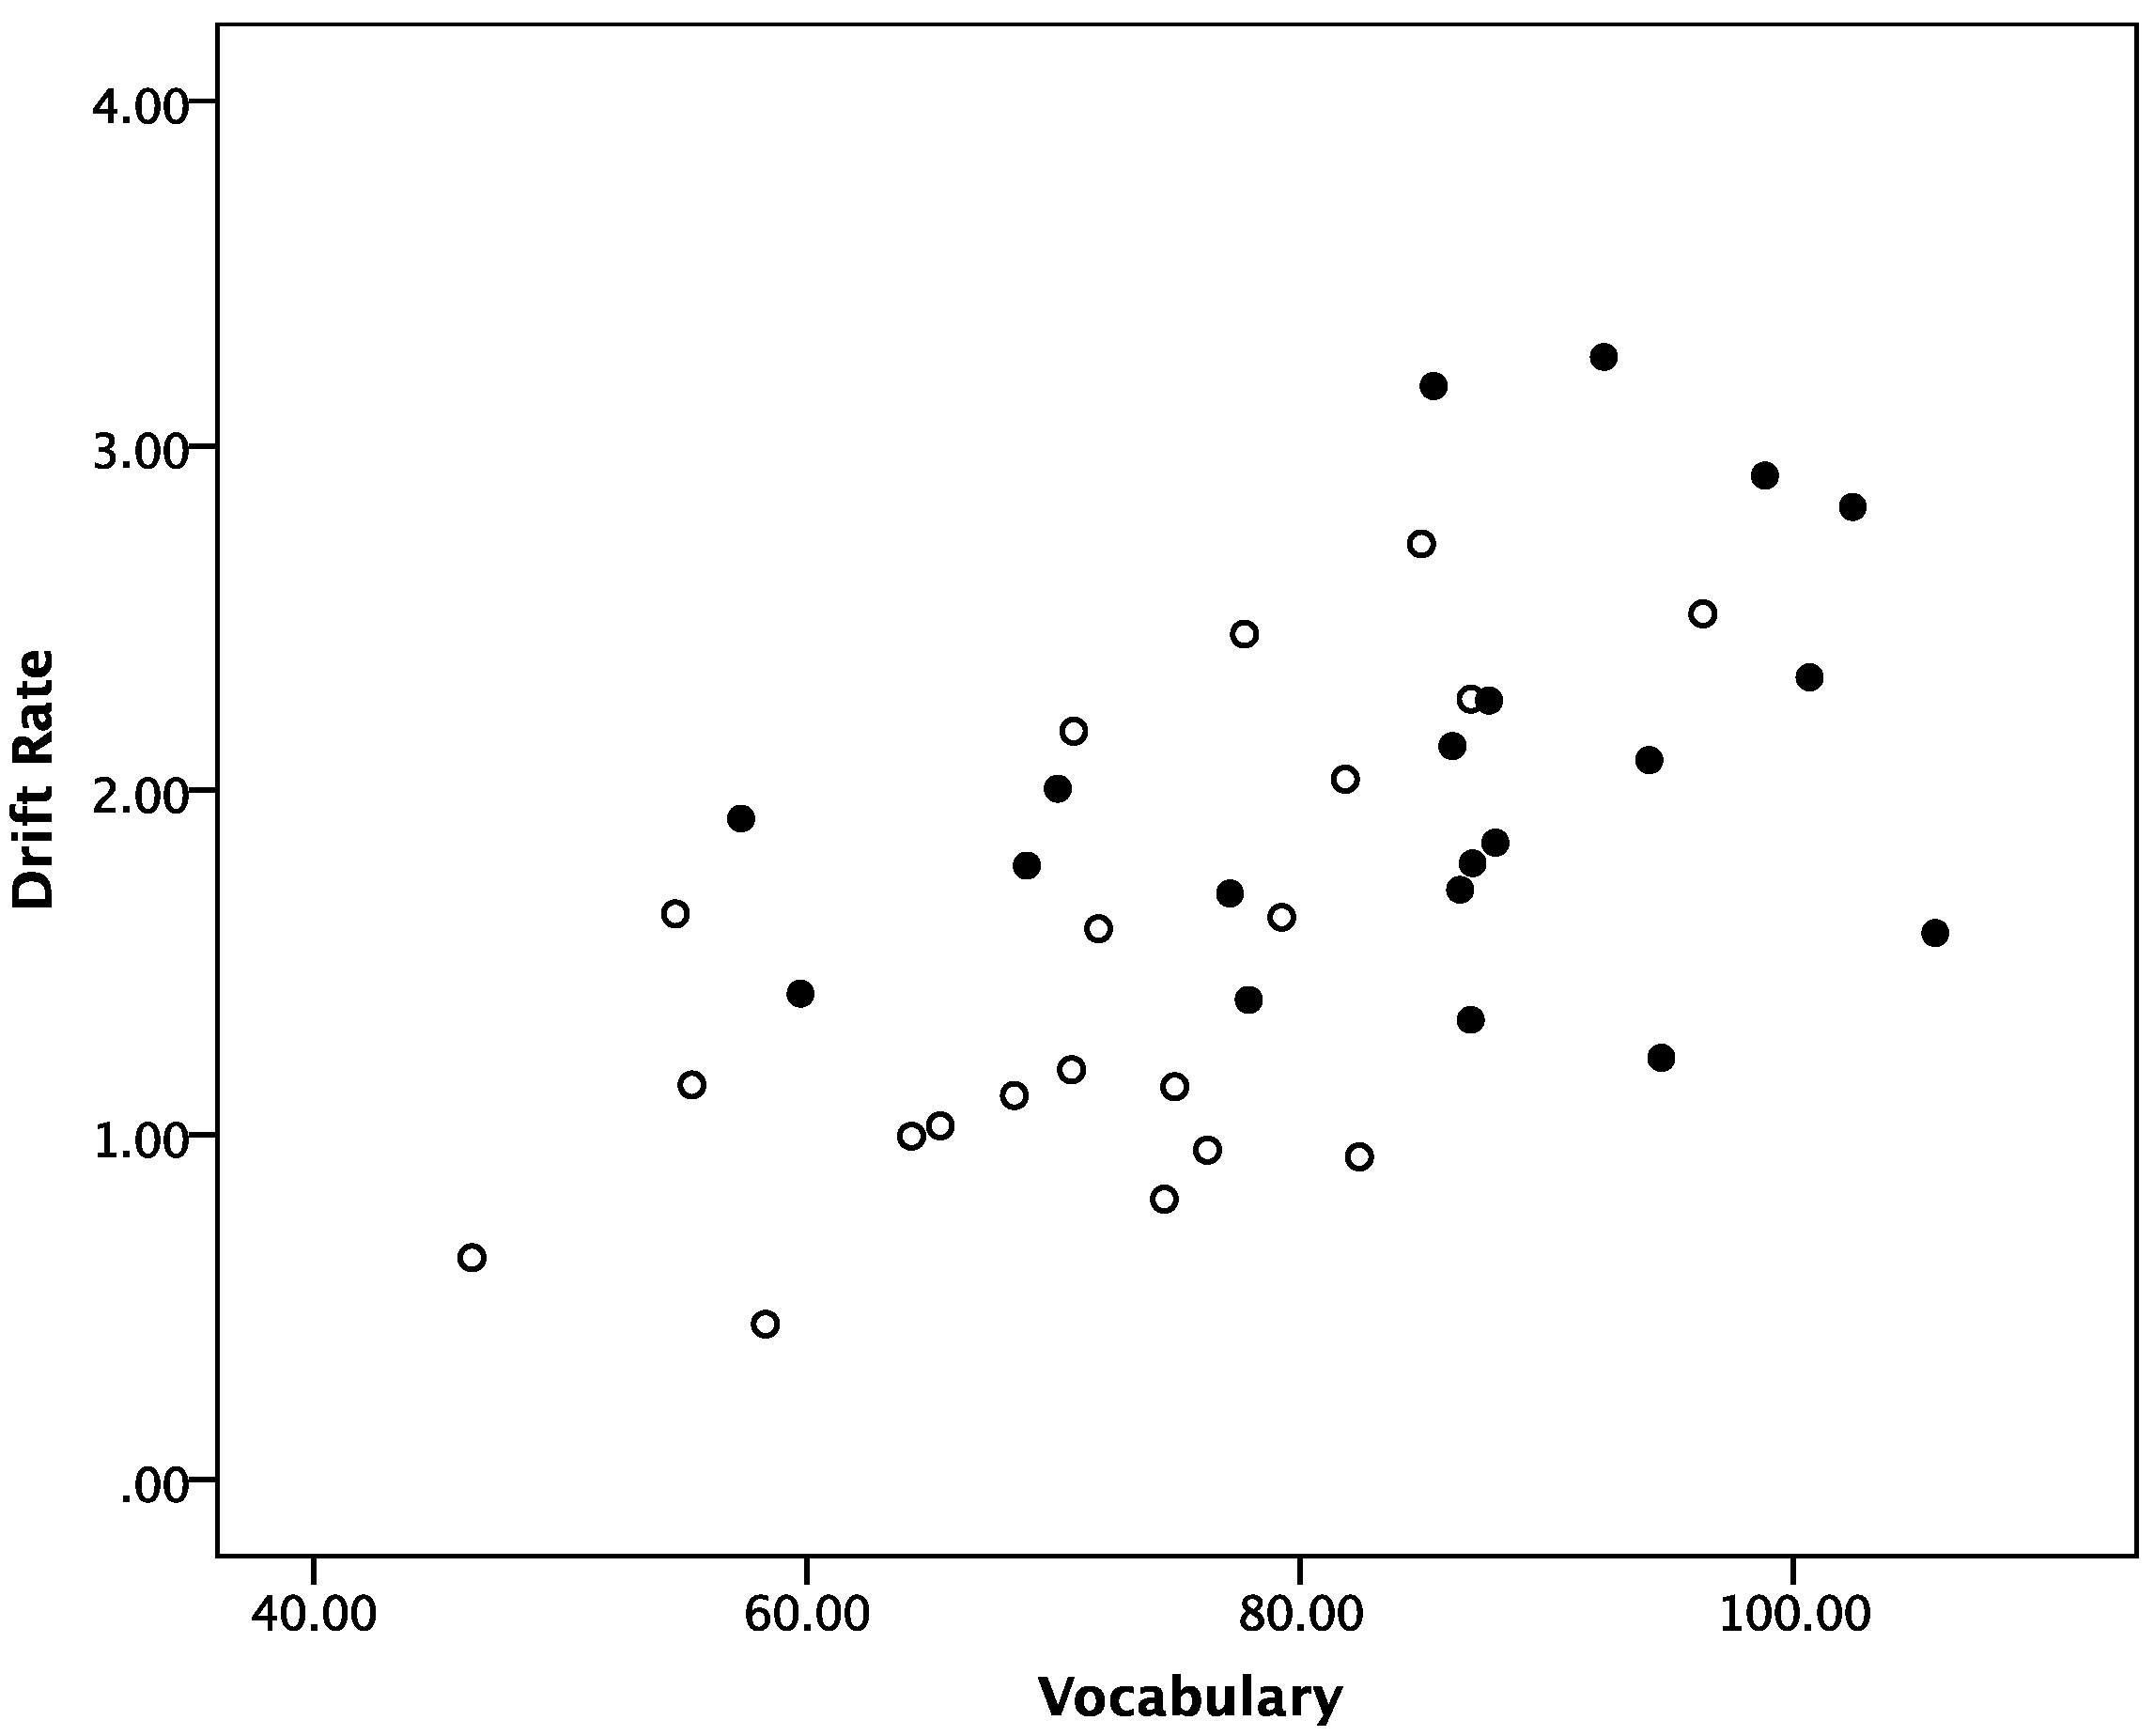
3.4. Post-Hoc Analyses
3.5. Discussion
4. Conclusions
Acknowledgments
Author Contributions
Conflicts of Interest
Appendix A


References
- Dirk, J.; Schmiedek, F. Processing speed. In The Wiley-Blackwell Handbook of Adulthood and Aging; Krauss Whitbourne, S., Sliwinski, M.J., Eds.; Wiley-Blackwell: Hoboken, NJ, USA, 2012; pp. 135–153. [Google Scholar]
- Verhaeghen, P.; Cerella, J. Everything we know about aging and response times: A meta-analytic integration. In Handbook of Cognitive Aging: Interdisciplinary Perspectives; Hofer, S.M., Alwin, D.F., Eds.; Sage Publications: Thousand Oaks, CA, USA, 2008; pp. 134–150. [Google Scholar]
- Birren, J.E. Age changes in speed of behavior: Its central nature and physiological correlates. In Behavior, Aging and the Nervous System; Welford, A.T., Birren, J.E., Eds.; Charles C. Thomas Publisher: Springfield, IL, USA, 1965; pp. 191–216. [Google Scholar]
- Welford, A.T. Performance, biological mechanisms and age: A theoretical sketch. In Behavior, Aging and the Nervous System; Welford, A.T., Birren, J.E., Eds.; Charles C. Thomas Publisher: Springfield, IL, USA, 1965; pp. 3–20. [Google Scholar]
- Cerella, J. Information-processing rates in the elderly. Psychol. Bull. 1985, 98, 67–83. [Google Scholar] [CrossRef] [PubMed]
- Salthouse, T.A. The processing-speed theory of adult age differences in cognition. Psychol. Rev. 1996, 103, 403–437. [Google Scholar] [CrossRef] [PubMed]
- Ratcliff, R.; Spieler, D.H.; McKoon, G. Analysis of group differences in processing speed: Where are the models of processing? Psychon. Bull. Rev. 2004, 11, 755–769. [Google Scholar] [CrossRef] [PubMed]
- Ratcliff, R.; Thapar, A.; Gomez, P.; McKoon, G. A diffusion model analysis of the effects of aging in the lexical-decision task. Psychol. Aging 2004, 19, 278–289. [Google Scholar] [CrossRef] [PubMed]
- Ratcliff, R.; Thapar, A.; McKoon, G. A diffusion model analysis of the effects of aging on recognition memory. J. Mem. Lang. 2004, 50, 408–424. [Google Scholar] [CrossRef]
- Ratcliff, R.; Thapar, A.; McKoon, G. Application of the diffusion model to two-choice tasks for adults 75–90 years old. Psychol. Aging 2007, 22, 56–66. [Google Scholar] [CrossRef] [PubMed]
- Ratcliff, R.; Thapar, A.; McKoon, G. Effects of aging and IQ on item and associative memory. J. Exp. Psychol. Gen. 2011, 140, 464–487. [Google Scholar] [CrossRef] [PubMed]
- Ratcliff, R.; Thapar, A.; McKoon, G. Individual differences, aging, and IQ in two-choice tasks. Cogn. Psychol. 2010, 60, 127–157. [Google Scholar] [CrossRef] [PubMed]
- Ratcliff, R. A theory of memory retrieval. Psychol. Rev. 1978, 85, 59–108. [Google Scholar] [CrossRef]
- Ratcliff, R.; Spieler, D.; McKoon, G. Explicitly modeling the effects of aging on response time. Psychon. Bull. Rev. 2000, 7, 1–25. [Google Scholar] [CrossRef] [PubMed]
- Ratcliff, R.; Rouder, J.N. Modeling response times for two-choice decisions. Psychol. Sci. 1998, 9, 347–356. [Google Scholar] [CrossRef]
- Voss, A.; Voss, J. Fast-dm: A free program for efficient diffusion model analysis. Behav. Res. Methods 2007, 39, 767–775. [Google Scholar] [CrossRef] [PubMed]
- Voss, A.; Voss, J.; Lerche, V. Assessing cognitive processes with diffusion model analyses: A tutorial based on fast-dm-30. Front. Psychol. 2015, 6, 336. [Google Scholar] [CrossRef] [PubMed]
- Kroehne, U.; Martens, T. Computer-based competence tests in the national educational panel study the challenge of mode effects. Z. Erzieh. 2011, 14, 169–186. [Google Scholar] [CrossRef]
- Mead, A.D.; Drasgow, F. Equivalence of Computerized and Paper-and-Pencil Cognitive Ability Tests: A Meta-Analysis. Psychol. Bull. 1993, 114, 449–458. [Google Scholar] [CrossRef]
- Parshall, C.G. (Ed.) Practical Considerations in Computer-Based Testing; Springer: New York, NY, USA, 2002. [Google Scholar]
- Luong, G.; Charles, S.T.; Rook, K.S.; Reynolds, C.A.; Gatz, M. Age differences and longitudinal change in the effects of data collection mode on self-reports of psychosocial functioning. Psychol. Aging 2015, 30, 106–119. [Google Scholar] [CrossRef] [PubMed]
- Fazeli, P.L.; Ross, L.A.; Vance, D.E.; Ball, K. The Relationship between Computer Experience and Computerized Cognitive Test Performance among Older Adults. J. Gerontol. Ser. B Psychol. Sci. Soc. Sci. 2013, 68, 337–346. [Google Scholar] [CrossRef] [PubMed]
- Cutler, S.J.; Hendricks, J.; Guyer, A. Age differences in home computer availability and use. J. Gerontol. Ser. B Psychol. Sci. Soc. Sci. 2003, 58, 271–280. [Google Scholar] [CrossRef]
- Steimle, J. Pen-And-Paper User Interfaces; Springer: Berlin, Germany, 2012. [Google Scholar]
- Cohen, J.; Penney, D.L.; Davis, R.; Libon, D.J.; Swenson, R.A.; Ajilore, O.; Kumar, A.; Lamar, M. Digital clock drawing: Differentiating ‘thinking’ versus ‘doing’ in younger and older adults with depression. J. Int. Neuropsychol. Soc. 2014, 20, 920–928. [Google Scholar] [CrossRef] [PubMed]
- Kroehne, U.; Roelke, H.; Kuger, S.; Goldhammer, F.; Klieme, E. Theoretical Framework for Log-Data in Technology-Based Assessments with Empirical Applications from PISA. In Proceedings of the 2016 Meeting of the National Council on Measurement in Education (NCME), Washington, DC, USA, 7–11 April 2016. [Google Scholar]
- Ratcliff, R.; Gomez, P.; McKoon, G. A diffusion model account of the lexical decision task. Psychol. Rev. 2004, 111, 159–182. [Google Scholar] [CrossRef] [PubMed]
- Allen, P.A.; Madden, D.J.; Crozier, L.C. Adult age differences in letter-level and word-level processing. Psychol. Aging 1991, 6, 261–271. [Google Scholar] [CrossRef] [PubMed]
- Baayen, R.; Piepenbrock, R.; van Rijn, H. The CELEX Lexical Database; CD-ROM; Linguistic Data Consortium: Philadelphia, PA, USA, 1993. [Google Scholar]
- Duyck, W.; Desmet, T.; Verbeke, L.; Brysbaert, M. WordGen: A tool for word selection and non-word generation in Dutch, German, English, and French. Behav. Res. Methods Instrum. Comput. 2004, 36, 488–499. [Google Scholar] [CrossRef] [PubMed]
- Wechsler, D. Wechsler Adult Intelligence Scale—Revised (WAIS-R); Psychological Corporation: New York, NY, USA, 1981. [Google Scholar]
- Raven, J.C.; Ibrahimovic, N.; Bulheller, S. WST-Wortschatztest. Deutsche Version der Mill Hill Vocabulary Scale; Hogrefe: Göttingen, Germany, 2005. [Google Scholar]
- Hoyer, W.J.; Stawski, R.S.; Wasylyshyn, C.; Verhaeghen, P. Adult age and digit symbol substitution performance: A meta-analysis. Psychol. Aging 2004, 19, 211–214. [Google Scholar] [CrossRef] [PubMed]
- Verhaeghen, P. Aging and vocabulary scores: A meta-analysis. Psychol. Aging 2003, 18, 332–339. [Google Scholar] [CrossRef] [PubMed]
- Voss, A.; Rothermund, K.; Voss, J. Interpreting the parameters of the diffusion model: An empirical validation. Mem. Cogn. 2004, 23, 1206–1220. [Google Scholar] [CrossRef]
- Ratcliff, R.; Thapar, A.; McKoon, G. The effects of aging on reaction time in a signal detection task. Psychol. Aging 2001, 16, 323–341. [Google Scholar] [CrossRef] [PubMed]
- Thapar, A.; Ratcliff, R.; McKoon, G. A diffusion model analysis of the effects of aging on letter discrimination. Psychol. Aging 2003, 18, 415–429. [Google Scholar] [CrossRef] [PubMed]
- Roberts, B.W.; Mroczek, D. Personality trait change in adulthood. Curr. Dir. Psychol. Sci. 2008, 17, 31–35. [Google Scholar] [CrossRef] [PubMed]


| Measure | Younger Adults | Older Adults | ||||||
|---|---|---|---|---|---|---|---|---|
| M | SD | Min | Max | M | SD | Min | Max | |
| Age | 25.70 | 4.78 | 18.00 | 36.00 | 68.10 | 3.14 | 64.00 | 75.00 |
| Years of education | 13.00 | 1.92 | 10.00 | 17.00 | 14.90 | 3.58 | 8.00 | 20.00 |
| Vocabulary | 72.06 | 12.23 | 46.42 | 96.32 | 85.37 | 13.41 | 57.33 | 105.74 |
| Processing speed | 66.05 | 11.01 | 49.00 | 82.00 | 50.10 | 9.43 | 35.00 | 68.00 |
| Group and Condition | Accuracy | M RT Correct (SD) | M Error RT (SD) | M Observations (SD) |
|---|---|---|---|---|
| 1. Younger adults | ||||
| Words | 0.91 (0.07) | 709 (184) | 1030 (359) | 985 (16) |
| Nonwords | 0.98 (0.02) | 737 (188) | 994 (457) | 989 (11) |
| 2. Older adults | ||||
| Words | 0.98 (0.02) | 723 (138) | 1227 (314) | 938 (119) |
| Nonwords | 0.96 (0.07) | 805 (149) | 1024 (234) | 954 (99) |
| Group and Condition | v | a | t0 | zr | sv | st0 | szr |
|---|---|---|---|---|---|---|---|
| Younger adults (words) | 1.472 (0.675) | 2.106 (0.489) | 0.345 (0.073) | 0.724 (0.089) | 0.662 (0.191) | 0.183 (0.052) | 0.256 (0.088) |
| Younger adults (nonwords) | −1.944 (0.645) | 0.359 (0.123) | |||||
| Older adults (words) | 2.033 (0.602) | 2.679 (0.540) | 0.399 (0.071) | 0.771 (0.107) | 0.758 (0.153) | 0.172 (0.062) | 0.215 (0.062) |
| Older adults (nonwords) | −2.069 (0.545) | 0.305 (0.125) |
© 2017 by the authors. Licensee MDPI, Basel, Switzerland. This article is an open access article distributed under the terms and conditions of the Creative Commons Attribution (CC BY) license (http://creativecommons.org/licenses/by/4.0/).
Share and Cite
Dirk, J.; Kratzsch, G.K.; Prindle, J.P.; Kröhne, U.; Goldhammer, F.; Schmiedek, F. Paper-Based Assessment of the Effects of Aging on Response Time: A Diffusion Model Analysis. J. Intell. 2017, 5, 12. https://doi.org/10.3390/jintelligence5020012
Dirk J, Kratzsch GK, Prindle JP, Kröhne U, Goldhammer F, Schmiedek F. Paper-Based Assessment of the Effects of Aging on Response Time: A Diffusion Model Analysis. Journal of Intelligence. 2017; 5(2):12. https://doi.org/10.3390/jintelligence5020012
Chicago/Turabian StyleDirk, Judith, Gesa Katharina Kratzsch, John P. Prindle, Ulf Kröhne, Frank Goldhammer, and Florian Schmiedek. 2017. "Paper-Based Assessment of the Effects of Aging on Response Time: A Diffusion Model Analysis" Journal of Intelligence 5, no. 2: 12. https://doi.org/10.3390/jintelligence5020012