The Impact of Risk Perception on Social Distancing during the COVID-19 Pandemic in China


Abstract
:1. Introduction
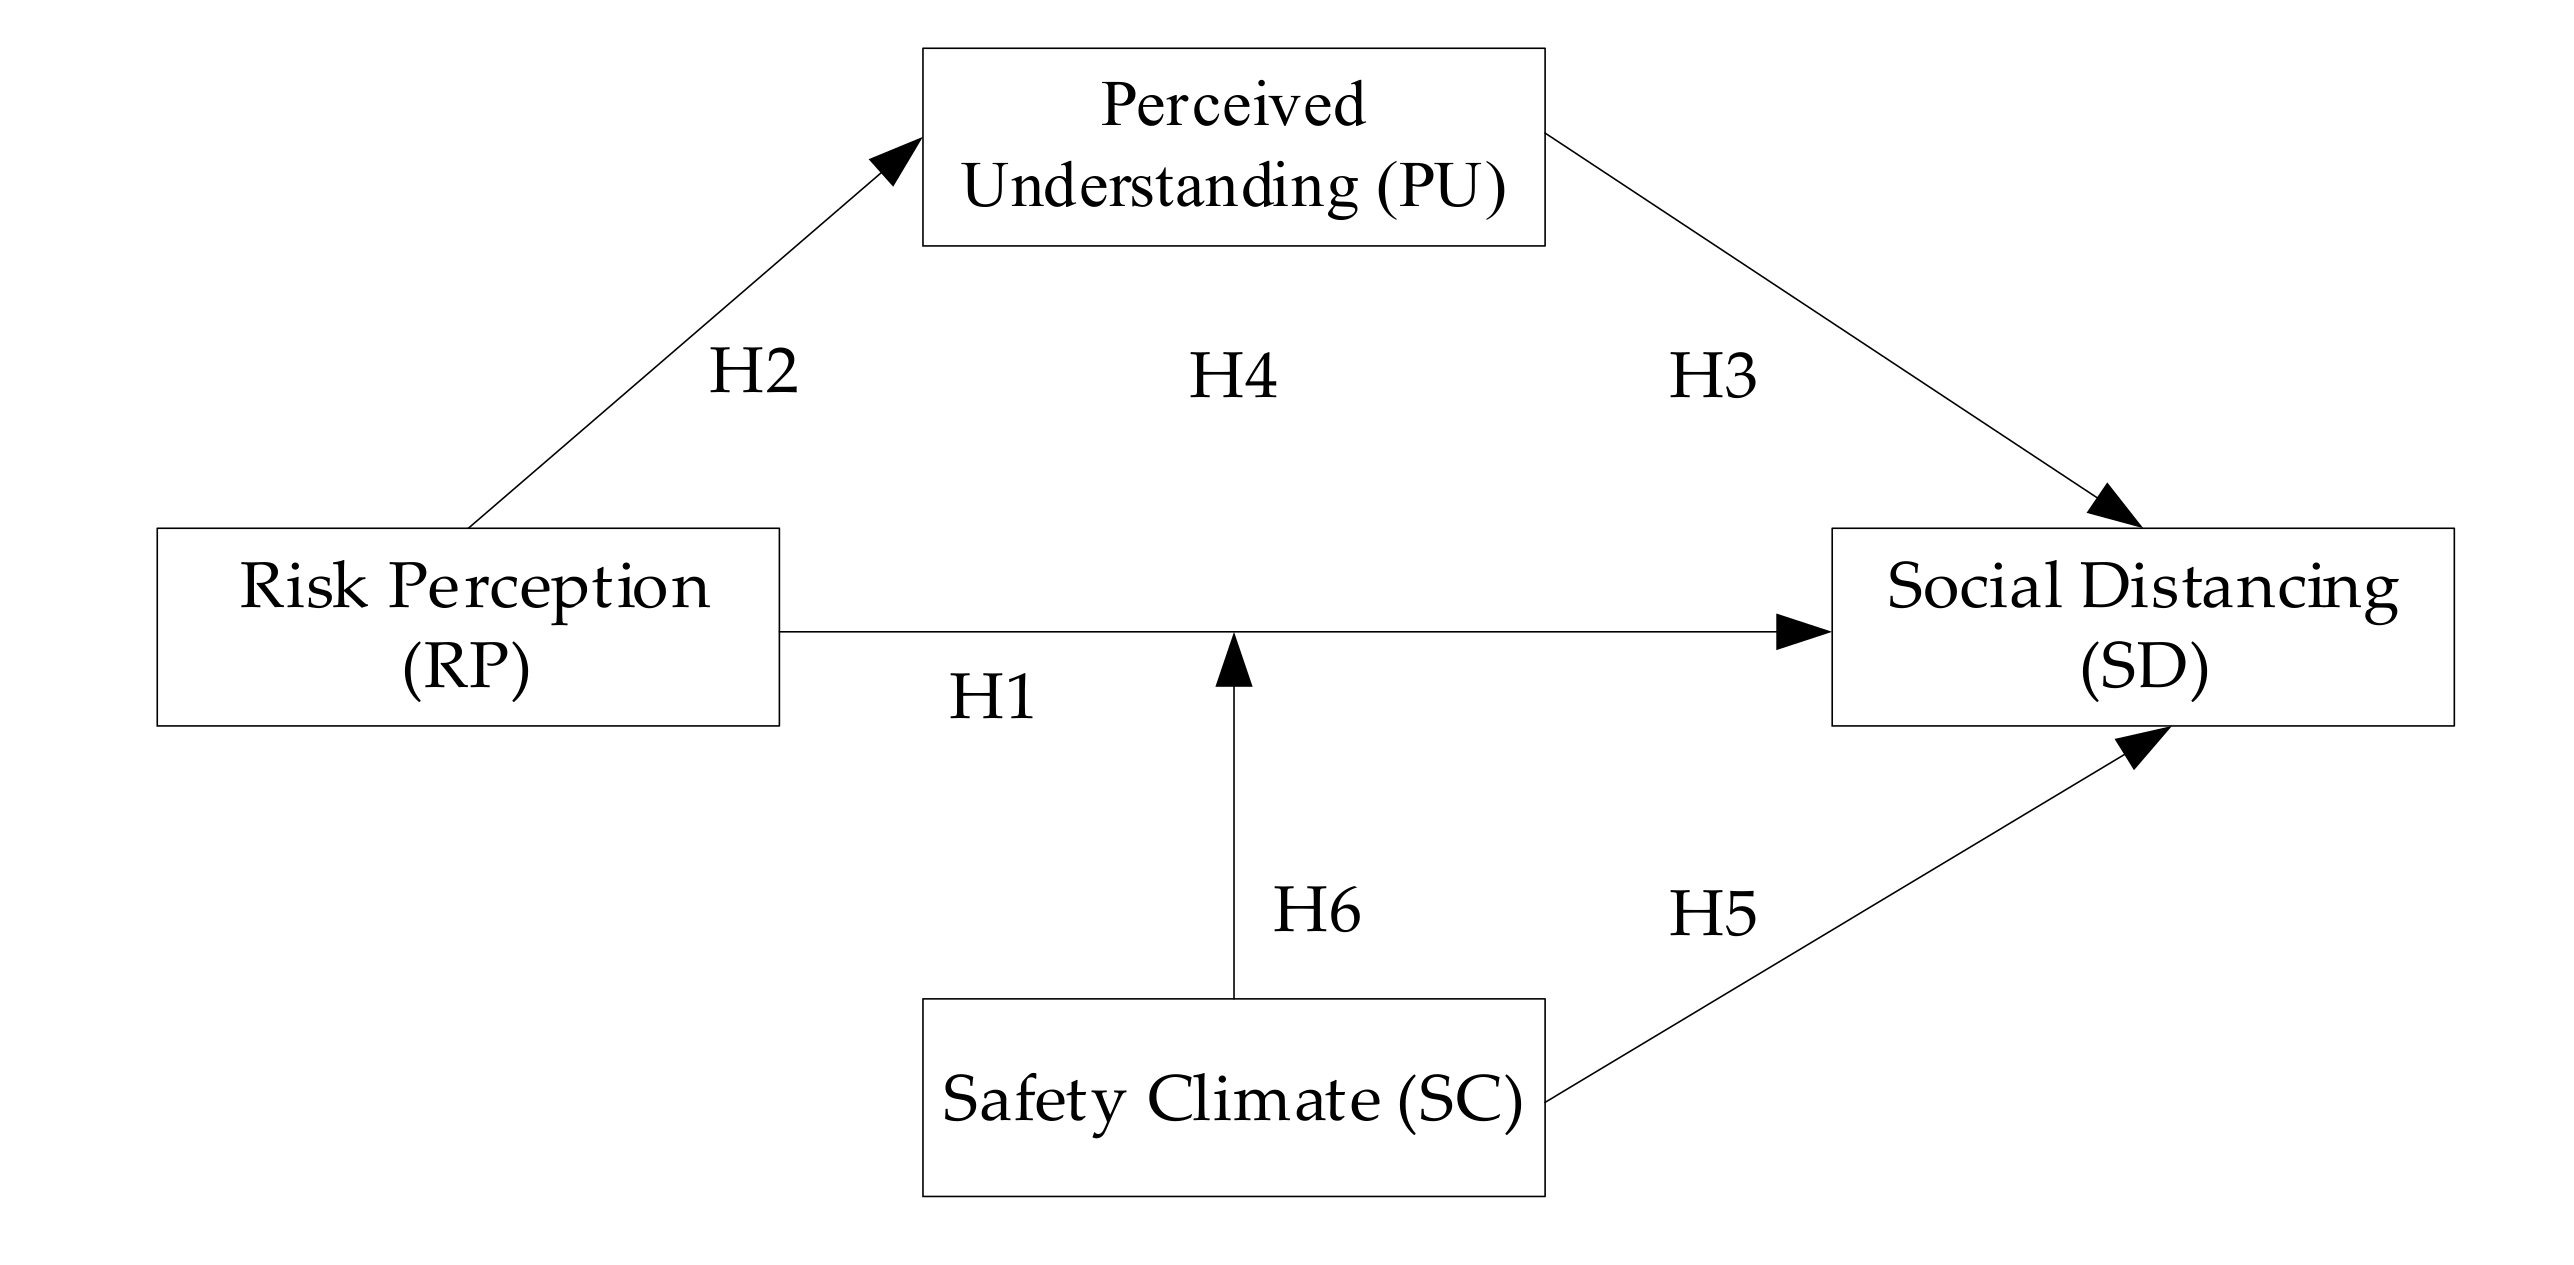
2. Hypothesis Development and Study Model
2.1. Risk Perception and Perceived Understanding Related to Social Distancing
2.2. Risk Perception and Safety Climate Related to Social Distancing
3. Materials and Methods
3.1. Population and Sample
3.2. Survey Instrument
3.3. Data Analysis
4. Results
4.1. Reliability and Validity Analysis
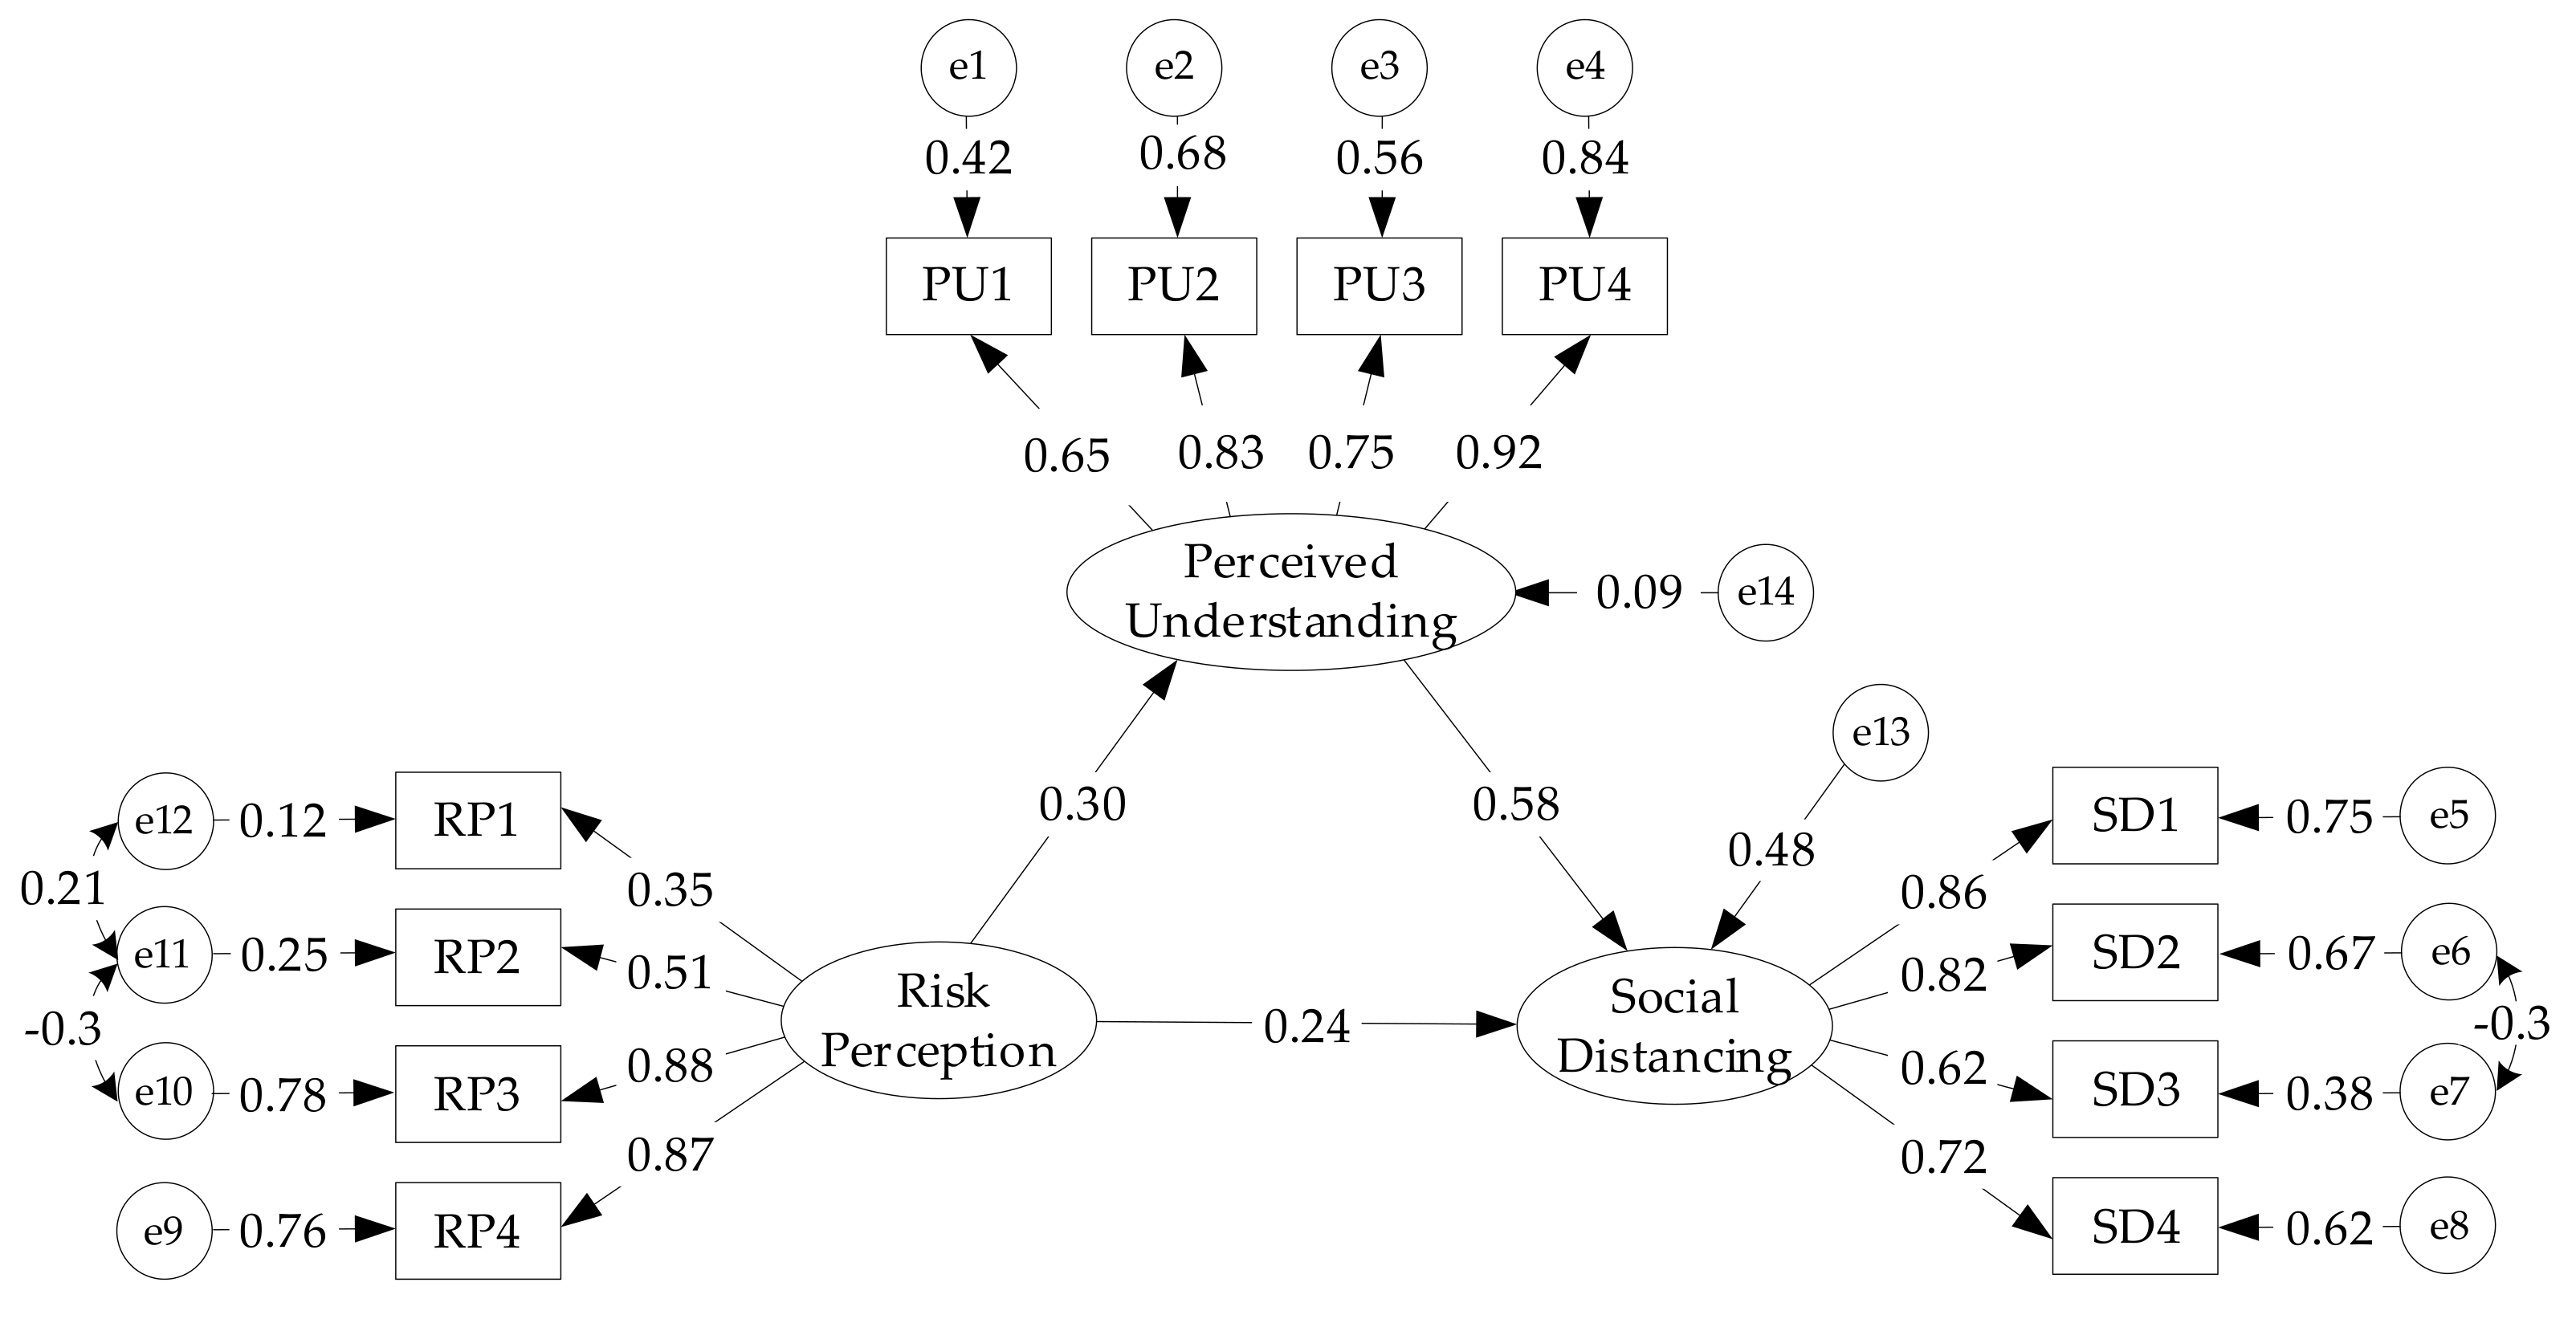
4.2. SEM Analysis
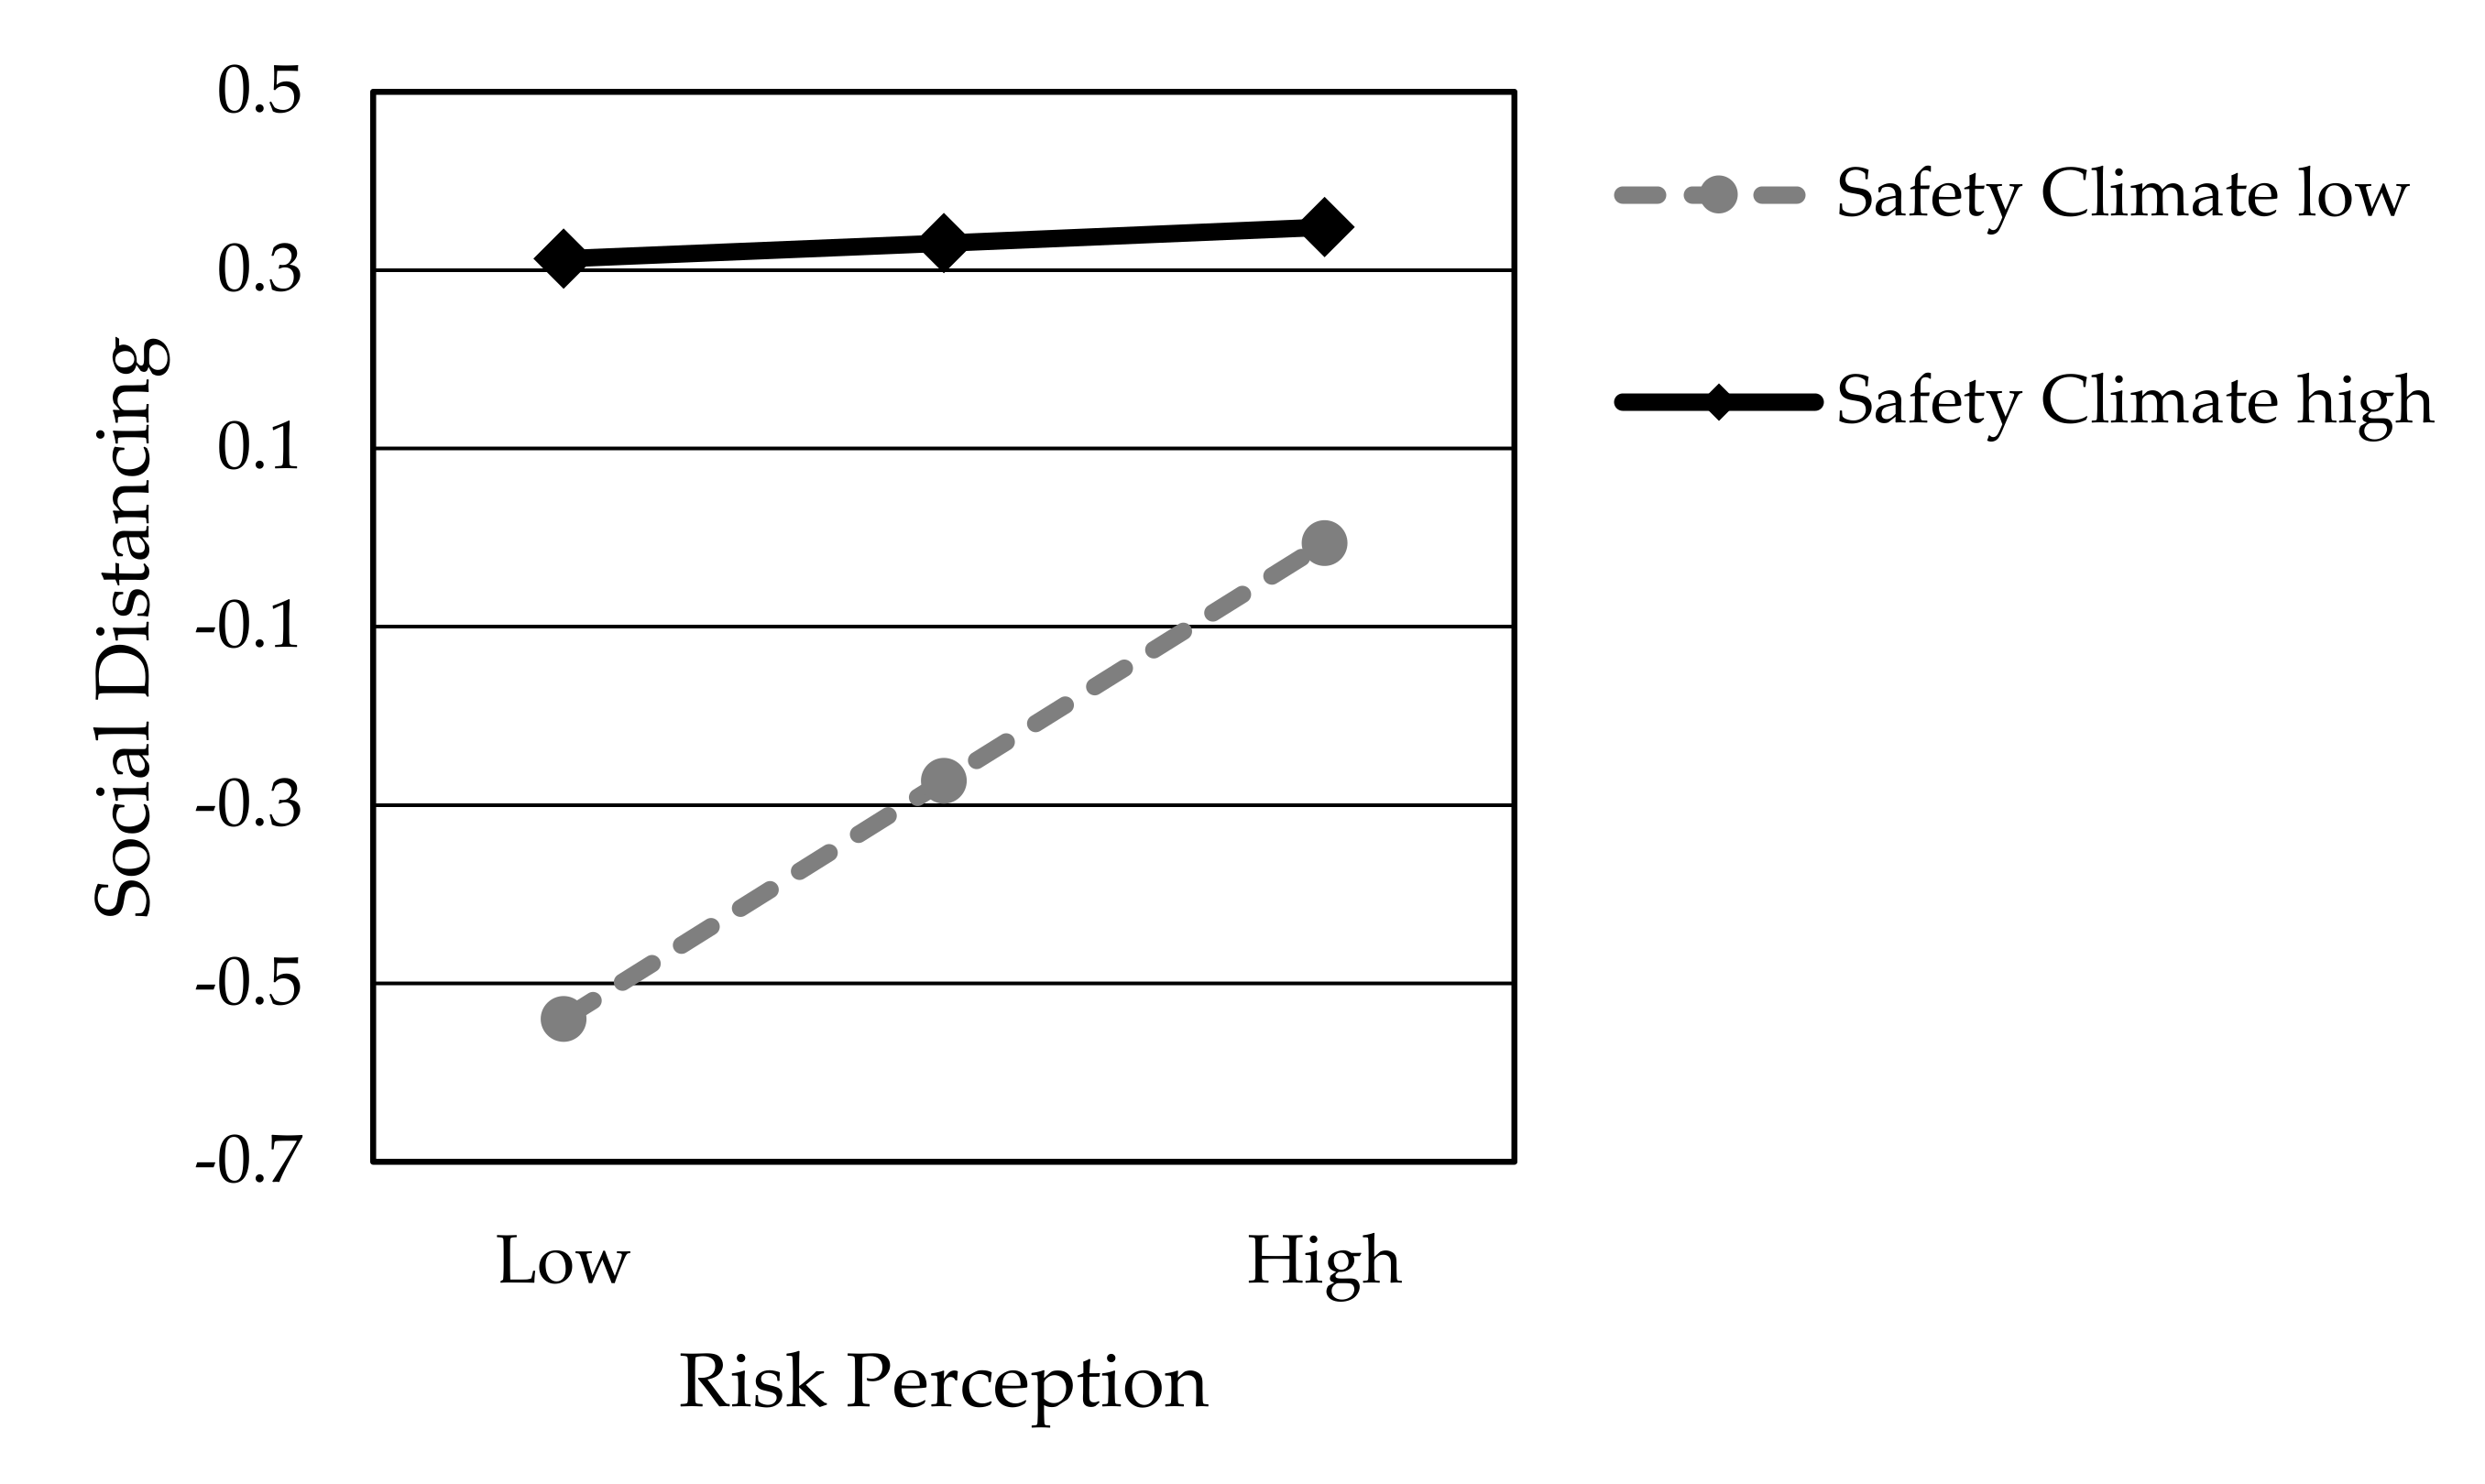
4.3. HLR Analysis
5. Discussion
5.1. Research and Policy Implications
5.2. Limitations and Future Research
6. Conclusions
Supplementary Materials
Author Contributions
Funding
Conflicts of Interest
References
- O’Connell, K.; Berluti, K.; Rhoads, S.A.; Marsh, A. Reduced Social Distancing during the COVID-19 Pandemic Is Associated with Antisocial Behaviors in an Online United States Sample. Available online: https://psyarxiv.com/ezypg/ (accessed on 3 July 2020).
- Korber, B.; Fischer, W.; Gnanakaran, S.; Yoon, H.; Theiler, J.; Abfalterer, W.; Hengartner, N.; Giorgi, E.; Bhattacharya, T.; Foley, B. Tracking changes in SARS-CoV-2 Spike: Evidence that D614G increases infectivity of the COVID-19 virus. Cell 2020, 182, 812–827.e19. [Google Scholar] [CrossRef] [PubMed]
- Li, Q.; Guan, X.; Wu, P.; Wang, X.; Zhou, L.; Tong, Y.; Ren, R.; Leung, K.S.; Lau, E.H.; Wong, J.Y. Early transmission dynamics in Wuhan, China, of novel coronavirus–infected pneumonia. N. Engl. J. Med. 2020, 382, 1199–1207. [Google Scholar] [CrossRef] [PubMed]
- Liu, Y.; Gayle, A.A.; Wilder-Smith, A.; Rocklöv, J. The reproductive number of COVID-19 is higher compared to SARS coronavirus. J. Travel Med. 2020, 27, taaa021. [Google Scholar] [CrossRef] [Green Version]
- Huynh, T.L.D. Does culture matter social distancing under the COVID-19 pandemic? Saf. Sci. 2020, 130, 104872. [Google Scholar] [CrossRef] [PubMed]
- Jaja, I.F.; Anyanwu, M.U.; Iwu Jaja, C.-J. Social distancing: How religion, culture and burial ceremony undermine the effort to curb COVID-19 in South Africa. Emerg. Microbes Infect. 2020, 9, 1077–1079. [Google Scholar] [CrossRef]
- Bahl, P.; Doolan, C.; de Silva, C.; Chughtai, A.A.; Bourouiba, L.; MacIntyre, C.R. Airborne or droplet precautions for health workers treating COVID-19? J. Infect. Dis. 2020, jiaa189. [Google Scholar] [CrossRef] [Green Version]
- Marchiori, M. COVID-19 and the social distancing paradox: Dangers and solutions. arXiv 2020, arXiv:2005.12446v1. [Google Scholar]
- Physical Distancing for Coronavirus (COVID-19). Available online: https://www.health.gov.au/news/health-alerts/novel-coronavirus-2019-ncov-health-alert (accessed on 26 June 2020).
- Sobre a Doença. Available online: https://coronavirus.saude.gov.br/sobre-a-doenca#como-se-proteger (accessed on 12 July 2020).
- Physical Distancing: How to Slow the Spread of COVID-19. Available online: https://www.canada.ca/en/public-health/services/publications/diseases-conditions/social-distancing.html (accessed on 6 June 2020).
- Protection Guide (Revised Edition). Available online: http://www.scio.gov.cn/xwfbh/gbwxwfbh/xwfbh/wsb/Document/1682567/1682567.htm (accessed on 19 June 2020).
- Basic Policies for Novel Coronavirus Disease Control by the Government of Japan (Summary); Ministry of Health, Labour and Welfare: Tokyo, Japan, 2020; pp. 2–4.
- Social Distancing Guidelines. Available online: https://sacoronavirus.co.za/2020/03/16/social-distancing-guidelines/ (accessed on 16 March 2020).
- Staying Alert and Safe (Social Distancing). Available online: https://www.gov.uk/government/publications/staying-alert-and-safe-social-distancing (accessed on 9 July 2020).
- What Is Social Distancing and How Can It Slow the Spread of Covid-19? Available online: https://hub.jhu.edu/2020/03/13/what-is-social-distancing/ (accessed on 14 March 2020).
- Coronavirus Disease (COVID-19) Advice for the Public. Available online: https://www.who.int/emergencies/diseases/novel-coronavirus-2019/advice-for-public (accessed on 4 June 2020).
- Chen, C. CiteSpace II: Detecting and visualizing emerging trends and transient patterns in scientific literature. J. Am. Soc. Inf. Sci. Technol. 2006, 57, 359–377. [Google Scholar] [CrossRef] [Green Version]
- Chen, C. Visualizing and Exploring Scientific Literature with CiteSpace: An Introduction, Proceedings of the 2018 Conference on Human Information Interaction & Retrieval, New Brunswick, NJ, USA, 11–15 March, 2018; Association for Computing Machinery: New York, NY, USA, 2018; pp. 369–370. [Google Scholar]
- Ping, Q.; He, J.; Chen, C. How many ways to use CiteSpace? A study of user interactive events over 14 months. J. Assoc. Inf. Sci. Technol. 2017, 68, 1234–1256. [Google Scholar] [CrossRef]
- Ahmed, F.; Zviedrite, N.; Uzicanin, A. Effectiveness of workplace social distancing measures in reducing influenza transmission: A systematic review. BMC Public Health 2018, 18, 518. [Google Scholar] [CrossRef]
- Aunders-Hastings, P.; Crispo, J.A.; Sikora, L.; Krewski, D. Effectiveness of personal protective measures in reducing pandemic influenza transmission: A systematic review and meta-analysis. Epidemics 2017, 20, 1–20. [Google Scholar] [CrossRef]
- Mushayabasa, S.; Ngarakana-Gwasira, E.T.; Mushanyu, J. On the role of governmental action and individual reaction on COVID-19 dynamics in South Africa: A mathematical modelling study. Inform. Med. Unlocked 2020, 20, 100387. [Google Scholar] [CrossRef] [PubMed]
- Lang, B.C.; Cashin, M.; Thorp, K.; Barrick, T.; Walker, D.; Leong-Kee, S. Social distancing simulation during the COVID-19 health crisis. BMJ Simul. Technol. Enhanc. Learn. 2020, 000674. [Google Scholar] [CrossRef]
- Regmi, K.; Lwin, C.M. Impact of social distancing measures for preventing coronavirus disease 2019 [COVID-19]: A systematic review and meta-analysis protocol. medRxiv 2020, 20130294. [Google Scholar] [CrossRef]
- Cano, O.B.; Morales, S.C.; Bendtsen, C. COVID-19 modelling: The effects of social distancing. medRxiv 2020, 20046870. [Google Scholar] [CrossRef] [Green Version]
- Okuonghae, D.; Omame, A. Analysis of a mathematical model for COVID-19 population dynamics in Lagos, Nigeria. Chaos Solitons Fractals 2020, 139, 110032. [Google Scholar] [CrossRef] [PubMed]
- Ajagbe, A.O.; Onigbinde, O.A.; Oyeniran, O.I.; Chia, T. Mental morbidity arising from social isolation during Covid-19 outbreak. Ulutas Med. J. 2020, 6, 97–100. [Google Scholar] [CrossRef]
- Luiggi-Hernández, J.G.; Rivera-Amador, A.I. Reconceptualizing social distancing: Teletherapy and social inequality during the COVID-19 and loneliness pandemics. J. Humanist. Psychol. 2020, 60, 626–638. [Google Scholar] [CrossRef]
- Bourassa, K.J.; Sbarra, D.A.; Caspi, A.; Moffitt, T.E. Social distancing as a health behavior: County-level movement in the united states during the COVID-19 pandemic is associated with conventional health behaviors. Ann. Behav. Med. 2020, kaaa049. [Google Scholar] [CrossRef]
- Schiavi, M.C.; Spina, V.; Zullo, M.A.; Colagiovanni, V.; Luffarelli, P.; Rago, R.; Palazzetti, P. Love in the time of COVID-19: Sexual function and quality of life analysis during the social distancing measures in a group of italian reproductive-age women. J. Sex. Med. 2020, 17, 1407–1413. [Google Scholar] [CrossRef]
- Cerbara, L.; Ciancimino, G.; Crescimbene, M.; La Longa, F.; Parsi, M.; Tintori, A.; Palomba, R. A nation-wide survey on emotional and psychological impacts of COVID-19 social distancing. Eur. Rev. Med. Pharmacol. Sci. 2020, 24, 7155–7163. [Google Scholar] [PubMed]
- Akim, A.-M.; Ayivodji, F. Interaction effect of lockdown with economic and fiscal measures against COVID-19 on social-distancing compliance: Evidence from Africa. SSRN 2020, 3621693. [Google Scholar] [CrossRef]
- Travaglino, G.A.; Moon, C. Explaining compliance with social distancing norms during the COVID-19 pandemic: The roles of cultural orientations, trust and self-conscious emotions in the US, Italy, and South Korea. psyarXiv 2020. under review. [Google Scholar]
- Aldarhami, A.; Bazaid, A.S.; Althomali, O.W.; Binsaleh, N.K. Public perceptions and commitment to social distancing during COVID-19 pandemic: A national survey in Saudi Arabia. Available online: https://www.preprints.org/manuscript/202005.0517/v1 (accessed on 31 May 2020).
- Lee, H.; Park, S.-A. Third-person effect and pandemic flu: The role of severity, self-efficacy method mentions, and message source. J. Health Commun. 2016, 21, 1244–1250. [Google Scholar] [CrossRef] [PubMed]
- Yanti, B.; Wahyudi, E.; Wahiduddin, W.; Novika, R.G.H.; Arina, Y.M.D.A.; Martani, N.S.; Nawan, N. Community knowledge, attitudes, and behavior towards social distancing policy as prevention transmission of COVID-19 in indonesia. J. Adm. Kesehat. Indones. 2020, 8, 4–14. [Google Scholar]
- Zhang, J.; Litvinova, M.; Liang, Y.; Wang, Y.; Wang, W.; Zhao, S.; Wu, Q.; Merler, S.; Viboud, C.; Vespignani, A. Changes in contact patterns shape the dynamics of the COVID-19 outbreak in China. Science 2020, 368, 1481–1486. [Google Scholar] [CrossRef]
- Askitas, N.; Tatsiramos, K.; Verheyden, B. Lockdown strategies, mobility patterns and COVID-19. arXiv 2020, arXiv:2006.00531. [Google Scholar]
- Aven, T. The risk concept—Historical and recent development trends. Reliab. Eng. Syst. Saf. 2012, 99, 33–44. [Google Scholar] [CrossRef]
- Aven, T. Risk assessment and risk management: Review of recent advances on their foundation. Eur. J. Oper. Res. 2016, 253, 1–13. [Google Scholar] [CrossRef] [Green Version]
- Barrios, J.M.; Hochberg, Y. Risk Perception through the Lens of Politics in the Time of the COVID-19 Pandemic. Available online: https://www.nber.org/papers/w27008 (accessed on 25 July 2020).
- Kinateder, M.T.; Kuligowski, E.D.; Reneke, P.A.; Peacock, R.D. Risk perception in fire evacuation behavior revisited: Definitions, related concepts, and empirical evidence. Fire Sci. Rew. 2015, 4, 1. [Google Scholar] [CrossRef] [Green Version]
- Lin, C.A.; Lagoe, C. Effects of news media and interpersonal interactions on H1N1 risk perception and vaccination intent. Commun. Res. Rep. 2013, 30, 127–136. [Google Scholar] [CrossRef]
- Dionne, G.; Desjardins, D.; Lebeau, M.; Messier, S.; Dascal, A. Health care workers’ risk perceptions and willingness to report for work during an influenza pandemic. Risks 2018, 6, 8. [Google Scholar] [CrossRef] [Green Version]
- Qazi, A.; Qazi, J.; Naseer, K.; Zeeshan, M.; Hardaker, G.; Maitama, J.Z.; Haruna, K. Analyzing situational awareness through public opinion to predict adoption of social distancing amid pandemic COVID-19. J. Med. Virol. 2020, 92, 849–855. [Google Scholar] [CrossRef] [PubMed]
- Stubbings, L.; Chaboyer, W.; McMurray, A. Nurses’ use of situation awareness in decision-making: An integrative review. J. Adv. Nurs. 2012, 68, 1443–1453. [Google Scholar] [CrossRef] [PubMed] [Green Version]
- Morrow, S.L.; McGonagle, A.K.; Dove-Steinkamp, M.L.; Walker, C.T., Jr.; Marmet, M.; Barnes-Farrell, J.L. Relationships between psychological safety climate facets and safety behavior in the rail industry: A dominance analysis. Accid. Anal. Prev. 2010, 42, 1460–1467. [Google Scholar] [CrossRef] [PubMed]
- Kouabenan, D.R.; Ngueutsa, R.; Mbaye, S. Safety climate, perceived risk, and involvement in safety management. Saf. Sci. 2015, 77, 72–79. [Google Scholar] [CrossRef] [Green Version]
- Bosak, J.; Coetsee, W.J.; Cullinane, S.-J. Safety climate dimensions as predictors for risk behavior. Accid. Anal. Prev. 2013, 55, 256–264. [Google Scholar] [CrossRef] [Green Version]
- Koetke, J.; Schumann, K.; Porter, T. Trust in science increases conservative support for social distancing. OSF 2020, cngq8. [Google Scholar] [CrossRef]
- Best, S.J.; Krueger, B.; Hubbard, C.; Smith, A. An assessment of the generalizability of Internet surveys. Soc. Sci. Comput. Rev. 2001, 19, 131–145. [Google Scholar] [CrossRef]
- Kim, B.; Yoon, E.J.; Kim, S.; Lee, D.K. The effects of risk perceptions related to particulate matter on outdoor activity satisfaction in South Korea. Int. J. Environ. Res. Public Health 2020, 17, 1613. [Google Scholar] [CrossRef] [Green Version]
- Tian, X.; Di, Z.; Cheng, Y.; Ren, X.; Chai, Y.; Ding, F.; Chen, J.; Southerland, J.L.; Cui, Z.; Hu, X. Study on the development of an infectious disease-specific health literacy scale in the Chinese population. BMJ Open 2016, 6, 012039. [Google Scholar] [CrossRef] [Green Version]
- Neal, A.; Gri, M.A.; Hart, P.M. The impact of organizational climate on safety climate and individual behavior. Saf. Sci. 2000, 34, 99–109. [Google Scholar] [CrossRef]
- Wu, C.; Song, X.; Wang, T.; Fang, D. Core dimensions of the construction safety climate for a standardized safety-climate measurement. J. Constr. Eng. Manag. 2015, 148, 04015018. [Google Scholar] [CrossRef]
- Swami, V.; Barron, D. Analytic thinking, rejection of coronavirus (COVID-19) conspiracy theories, and compliance with mandated social-distancing: Direct and indirect relationships in a nationally representative sample of adults in the united kingdom. OSF 2020, nmx9w. [Google Scholar] [CrossRef]
- Gudi, S.K.; Chhabra, M.; Undela, K.; Venkataraman, R.; Mateti, U.V.; Tiwari, K.K.; Nyamagoud, S. Knowledge and beliefs towards universal safety precautions during the coronavirus disease (COVID-19) pandemic among the Indian public: A web-based cross-sectional survey. Drugs Ther. Perspect. 2020, 36, 413–420. [Google Scholar] [CrossRef] [PubMed]
- Cronbach, L.J. Coefficient alpha and the internal structure of tests. Psychometrika 1951, 16, 297–334. [Google Scholar] [CrossRef] [Green Version]
- Raykov, T.; Marcoulides, G.A. Introduction to Psychometric Theory; Taylor and Francis Group: New York, NY, USA, 2011; pp. 121–135. [Google Scholar]
- Jobson, J.D. Applied Multivariate Data Analysis: Volume II Categorical and Multivariate Methods; Springer Science & Business Media: New York, NY, USA, 2012; pp. 23–39. [Google Scholar]
- Cheung, G.W.; Lau, R.S. Testing mediation and suppression effects of latent variables: Bootstrapping with structural equation models. Organ. Res. Methods 2008, 11, 296–325. [Google Scholar] [CrossRef]
- Zhong, B.-L.; Luo, W.; Li, H.-M.; Zhang, Q.-Q.; Liu, X.-G.; Li, W.-T.; Li, Y. Knowledge, attitudes, and practices towards COVID-19 among Chinese residents during the rapid rise period of the COVID-19 outbreak: A quick online cross-sectional survey. Int. J. Biol. Sci. 2020, 16, 1745–1752. [Google Scholar] [CrossRef] [PubMed]
- Machida, M.; Nakamura, I.; Saito, R.; Nakaya, T.; Hanibuchi, T.; Takamiya, T.; Odagiri, Y.; Fukushima, N.; Kikuchi, H.; Kojima, T. Adoption of personal protective measures by ordinary citizens during the COVID-19 outbreak in Japan. Int. J. Infect. Dis. 2020, 94, 139–144. [Google Scholar] [CrossRef]
- Ho, Y.-C.; Chen, Y.-H.; Hung, S.-H.; Huang, C.-H.; Po, P.; Chan, C.-H.; Yang, D.-K.; Tu, Y.-C.; Liu, T.-L.; Fang, C.-T. Social distancing 2.0 with privacy-preserving contact tracing to avoid a second wave of COVID-19. arXiv 2020, arXiv:2006.16611. [Google Scholar]


| Country | Affiliation | Social Distancing Definition and Rules |
|---|---|---|
| Australia | Government Department of Health | “Physical distancing in public means people should keep 1.5 m away from others wherever possible.” [9] |
| Brazil | Ministry of Health | “Keep at least 2 m away from anyone who coughs or sneezes.” [10] |
| Canada | Public Health Agency | “Physical distancing is one of the most effective ways to help prevent the spread of COVID-19, and keep at least 2 arms lengths (approximately 2 m) apart when around other people.” [11] |
| China | National Health Commission | “Reduce mass gatherings such as activities of entertainment, catering, etc. and stay more than 1 m from others.” [12] |
| Japan | Ministry of Health, Labour and Welfare | “Carefully avoid 3Cs (closed spaces, crowded places, and close-contact settings) and maintain a distance of at least 1.8 m between people.” [13] |
| South Africa | National Department of Health | Social distancing refers to limiting public gatherings as much as possible (keep distance at least 1 m). [14] |
| U.K. | National Health Service | “Avoid close contact with anyone you do not live with at least 2 m (3 steps) away.” [15] |
| U.S. | Centers for Disease Control and Prevention | “Remaining out of congregate settings, avoiding mass gatherings, and maintaining distance (approximately 6 feet or 2 m) from others when possible.” [16] |
| World Health Organization (WHO) | “Maintain at least 1 m (3 feet) distance between yourself and others.” [17] |
| Variable | Codes of Measurement Items | Survey Instrument Statements | References |
|---|---|---|---|
| Risk Perception | RP1 | My health is at risk during the COVID-19 pandemic. | Dionne et al. [45]; Kim et al. [53] |
| RP2 | The COVID-19 pandemic is difficult to control. | ||
| RP3 | The coronavirus can cause serious harm to my body once infected. | ||
| RP4 | I think the situation of the COVID-19 pandemic is more serious than previous ones. | ||
| RP5 | I am interested in the pandemic policies implemented by the government. * | ||
| RP6 | I trust that the government recommends the appropriate measures to control the COVID-19 outbreak. * | ||
| RP7 | I am interested in the pandemic information released to the public.* | ||
| Perceived Understanding | PU1 | I believe the COVID-19 is caused by the coronavirus. | Qazi et al. [46]; IDSHL [54] |
| PU2 | I know how people get infected with COVID-19. | ||
| PU3 | I think this coronavirus is a new disease. | ||
| PU4 | I know fever and cough are symptoms of COVID-19. | ||
| Social Distancing | SD1 | Avoid going out for any activity due to COVID-19. | Swami V, Barron D [57]; Gudi et al. [58] |
| SD2 | Avoid contact with individuals who have influenza. | ||
| SD3 | Avoid traveling within or between cities/local regions. | ||
| SD4 | Avoid using public transport due to COVID-19. | ||
| SD5 | Avoid going to crowded places due to COVID-19. * | ||
| Safety Climate | SC1 | The government is concerned about the health of people. | Koetke et al. [51]; Neal et al. [55]; Wu et al. [56] |
| SC2 | I trust the COVID-19 information provided by the government. | ||
| SC3 | There is a clearly stated set of goals or objectives for COVID-19 prevention. | ||
| SC4 | People consciously follow the pandemic prevention regulations. | ||
| SC5 | Being able to provide necessary personal protective equipment for workers during the pandemic. | ||
| SC6 | Offering to workers as much safety instruction and training as needed during the pandemic. |
| Variable | No. of Items | Mean | S.D. | RP | PU | SD | SC |
|---|---|---|---|---|---|---|---|
| RP | 4 | 3.68 | 0.97 | - | |||
| PU | 4 | 4.61 | 0.66 | 0.32 ** | - | ||
| SD | 4 | 4.55 | 0.69 | 0.37 ** | 0.54 ** | - | |
| SC | 6 | 4.45 | 0.63 | 0.37 ** | 0.51 ** | 0.63 ** | - |
| Variable | Code | Factors | Cronbach’s α | CR | AVE | |||
|---|---|---|---|---|---|---|---|---|
| 1 | 2 | 3 | 4 | |||||
| Risk Perception | RP1 | 0.61 | 0.72 | 0.76 | 0.47 | |||
| RP2 | 0.53 | |||||||
| RP3 | 0.84 | |||||||
| RP4 | 0.83 | |||||||
| Perceived Understanding | PU1 | 0.68 | 0.856 | 0.87 | 0.63 | |||
| PU2 | 0.80 | |||||||
| PU3 | 0.78 | |||||||
| PU4 | 0.85 | |||||||
| Social Distancing | SD1 | 0.67 | 0.814 | 0.84 | 0.56 | |||
| SD2 | 0.61 | |||||||
| SD3 | 0.76 | |||||||
| SD4 | 0.74 | |||||||
| Safety Climate | SC1 | 0.76 | 0.881 | 0.88 | 0.54 | |||
| SC2 | 0.63 | |||||||
| SC3 | 0.76 | |||||||
| SC4 | 0.67 | |||||||
| SC5 | 0.81 | |||||||
| SC6 | 0.73 | |||||||
| Eigenvalue | 3.69 | 3.50 | 2.44 | 2.32 | ||||
| Proportion of Variance (%) | 20.51 | 19.46 | 13.56 | 12.88 | ||||
| Cumulative of Variance (%) | 20.51 | 39.97 | 53.53 | 66.41 | ||||
| Fit Index | Recommended Value | Estimate |
|---|---|---|
| χ2/df | <3.00 | 2.912 |
| GFI | >0.90 | 0.936 |
| AGFI | >0.90 (good) >0.80 (reasonable) | 0.896 |
| RMR | <0.05 (good) <0.1 (reasonable) | 0.070 |
| RMSEA | ≤0.05 (good) <0.08 (reasonable) | 0.078 |
| CFI | >0.90 | 0.949 |
| NFI | >0.90 | 0.925 |
| TLI | >0.90 | 0.930 |
| PNFI | >0.50 | 0.673 |
| PGFI | >0.50 | 0.576 |
| Dimensions | Unstandardized Path Coefficients | Standardized Path Coefficients | S.E. | C.R. | p |
|---|---|---|---|---|---|
| RP--->PU | 0.150 | 0.296 | 0.034 | 4.435 | *** |
| PU--->SD | 0.664 | 0.581 | 0.079 | 8.426 | *** |
| RP--->SD | 0.138 | 0.238 | 0.031 | 4.421 | *** |
| Path | Effects | Point Estimation | Product of Coefficients | Bootstrapping | ||||
|---|---|---|---|---|---|---|---|---|
| Bia-Corrected 95% | Percentile 95% | |||||||
| SE | Z | Lower | Upper | Lower | Upper | |||
| RP--->SD | Total | 0.238 | 0.052 | 4.577 * | 0.153 | 0.357 | 0.146 | 0.347 |
| Indirect | 0.100 | 0.040 | 2.500 * | 0.041 | 0.205 | 0.036 | 0.193 | |
| Direct | 0.138 | 0.040 | 3.450 * | 0.072 | 0.230 | 0.064 | 0.219 | |
| Model | Variables | Standardized Coefficients | R2 | Change Statistics | Collinearity Statistics | ||
|---|---|---|---|---|---|---|---|
| ΔR2 | ΔF | Tolerance | VIF | ||||
| 1 | RP | 0.165 *** | 0.417 | 0.42 *** | 112.10 | 0.864 | 1.158 |
| SC | 0.566 *** | 0.864 | 1.158 | ||||
| 2 | RP | 0.195 *** | 0.467 | 0.05 *** | 29.65 | 0.851 | 1.176 |
| SC | 0.469 *** | 0.745 | 1.342 | ||||
| RP × SC | −0.242 *** | 0.862 | 1.160 | ||||
© 2020 by the authors. Licensee MDPI, Basel, Switzerland. This article is an open access article distributed under the terms and conditions of the Creative Commons Attribution (CC BY) license (http://creativecommons.org/licenses/by/4.0/).
Share and Cite
Xie, K.; Liang, B.; Dulebenets, M.A.; Mei, Y. The Impact of Risk Perception on Social Distancing during the COVID-19 Pandemic in China. Int. J. Environ. Res. Public Health 2020, 17, 6256. https://doi.org/10.3390/ijerph17176256
Xie K, Liang B, Dulebenets MA, Mei Y. The Impact of Risk Perception on Social Distancing during the COVID-19 Pandemic in China. International Journal of Environmental Research and Public Health. 2020; 17(17):6256. https://doi.org/10.3390/ijerph17176256
Chicago/Turabian StyleXie, Kefan, Benbu Liang, Maxim A. Dulebenets, and Yanlan Mei. 2020. "The Impact of Risk Perception on Social Distancing during the COVID-19 Pandemic in China" International Journal of Environmental Research and Public Health 17, no. 17: 6256. https://doi.org/10.3390/ijerph17176256