The Cognitive Profile of People with High-Functioning Autism Spectrum Disorders

 ,
,  ,
,
Abstract
:1. Introduction
Aims
- (1)
- Investigating the cognitive profile of those with ASD and TD using the Persian version of the WISC-IV, and comparing it to previous research findings;
- (2)
- Investigating the possible relationship between ASD symptoms and performance on the WISC-IV;
- (3)
- Investigating the relationship between ADHD symptoms and the cognitive profile of people with high-functioning ASD.
2. Materials and Methods
2.1. Participants
2.1.1. Participants with High-Functioning ASD
2.1.2. TD Participants
2.2. Research Tools
2.3. Statistical Analysis
2.4. Ethics
3. Results
3.1. Intergroup Comparison
3.2. Intragroup Comparison
3.3. Individual Comparison
4. Discussion
4.1. Intergroup Comparison
4.2. Intragroup Comparison
4.3. Individual Comparison
5. Limitation
6. Conclusions
Author Contributions
Funding
Acknowledgments
Conflicts of Interest
References
- Association, A.P. Diagnostic and Statistical Manual of Mental Disorders (DSM-5®); American Psychiatric Pub: Arlington, VA, USA, 2013. [Google Scholar]
- Kim, H.U. Autism across cultures: Rethinking autism. Disabil. Soc. 2012, 27, 535–545. [Google Scholar] [CrossRef]
- Samadi, S.A.; McConkey, R. Screening for autism in Iranian preschoolers: Contrasting m-chat and a scale developed in Iran. J. Autism Dev. Disord. 2015, 45, 2908–2916. [Google Scholar] [CrossRef] [PubMed]
- Baio, J.; Wiggins, L.; Christensen, D.L.; Maenner, M.J.; Daniels, J.; Warren, Z.; Kurzius-Spencer, M.; Zahorodny, W.; Rosenberg, C.R.; White, T. Prevalence of autism spectrum disorder among children aged 8 years—Autism and developmental disabilities monitoring network, 11 sites, United States, 2014. MMWR Surveill. Summ. 2018, 67, 1–23. [Google Scholar] [CrossRef] [PubMed]
- Ghaziuddin, M.; Mountain-Kimchi, K. Defining the intellectual profile of asperger syndrome: Comparison with high-functioning autism. J. Autism Dev. Disord. 2004, 34, 279–284. [Google Scholar] [CrossRef] [PubMed]
- Groth-Marnat, G. Handbook of Psychological Assessment; John Wiley & Sons: Hoboken, NJ, USA, 2009. [Google Scholar]
- Wechsler, D. Wechsler Intelligence Scale for Children-WISC-IV; Psychological Corporation: San Antonio, TX, USA, 2003. [Google Scholar]
- Mayes, S.D.; Calhoun, S.L. WISC-IV and WIAT-II profiles in children with high-functioning autism. J. Autism Dev. Disord. 2008, 38, 428–439. [Google Scholar] [CrossRef] [PubMed]
- Oliveras-Rentas, R.E.; Kenworthy, L.; Roberson, R.B.; Martin, A.; Wallace, G.L. WISC-IV profile in high-functioning autism spectrum disorders: Impaired processing speed is associated with increased autism communication symptoms and decreased adaptive communication abilities. J. Autism Dev. Disord. 2012, 42, 655–664. [Google Scholar] [CrossRef] [PubMed]
- Nader, A.-M.; Jelenic, P.; Soulières, I. Discrepancy between WISC-III and WISC-IV cognitive profile in autism spectrum: What does it reveal about autistic cognition? PLoS ONE 2015, 10, e0144645. [Google Scholar] [CrossRef] [PubMed]
- Nader, A.-M.; Courchesne, V.; Dawson, M.; Soulières, I. Does WISC-IV underestimate the intelligence of autistic children? J. Autism Dev. Disord. 2016, 46, 1582–1589. [Google Scholar] [CrossRef] [PubMed]
- Freeth, M.; Sheppard, E.; Ramachandran, R.; Milne, E. A cross-cultural comparison of autistic traits in the UK, India and Malaysia. J. Autism Dev. Disord. 2013, 43, 2569–2583. [Google Scholar] [CrossRef]
- Norbury, C.F.; Sparks, A. Difference or disorder? Cultural issues in understanding neurodevelopmental disorders. Dev. Psychol. 2013, 49, 45. [Google Scholar] [CrossRef]
- Lord, C.; Rutter, M.; DiLavore, P.C.; Risi, S. Autism Diagnostic Observation Schedule-WPS (ADOS-WPS); Western Psychological Services: Angeles, CA, USA, 1999. [Google Scholar]
- Leitner, Y. The co-occurrence of autism and attention deficit hyperactivity disorder in children—What do we know? Front. Hum. Neurosci. 2014, 8, 268. [Google Scholar] [CrossRef] [PubMed]
- Mayes, S.D.; Calhoun, S.L. WISC-IV and WISC-III profiles in children with ADHD. J. Atten. Disord. 2006, 9, 486–493. [Google Scholar] [CrossRef] [PubMed]
- San Miguel Montes, L.E.; Allen, D.N.; Puente, A.E.; Neblina, C. Validity of the WISC–IV spanish for a clinically referred sample of hispanic children. Psychol. Assess. 2010, 22, 465. [Google Scholar] [CrossRef] [PubMed]
- Sadeghi, A.; Rabiee, M.; Abedi, M.R. Validation and reliability of the wechsler intelligence scale for children-IV. Dev. Pscychol. 2010, 7, 377–386. [Google Scholar]
- Samadi, S.A.; McConkey, R. The utility of the gilliam autism rating scale for identifying Iranian children with autism. Disabil. Rehabil. 2014, 36, 452–456. [Google Scholar] [CrossRef] [PubMed]
- Shahrivar, Z.; Tehrani-Doost, M.; Pakbaz, B.; Rezaie, A.; Ahmadi, F. Normative data and psychometric properties of the parent and teacher versions of the strengths and difficulties questionnaire (SDQ) in an Iranian community sample. J. Res. Med Sci. 2009, 14, 69–77. [Google Scholar] [PubMed]
- Ghanizadeh, A.; Izadpanah, A.; Abdollahi, G. Scale validation of the strengths and difficulties questionnaire in Iranian children. Iran. J. Psychiatry 2007, 2, 65–71. [Google Scholar]
- Conners, C.K. Conners’ Rating Scales—Revised: User’s Manual; Multi-Health Systems, Incorporated: North Tonawanda, NY, USA, 1997. [Google Scholar]
- Khushabi, K.; Pour-Etemad, H.; Mohammadi, M.; Mohammadkhani, P. The prevalence of adhd in primary school students in Tehran. Med. J. Islamic Repub. Iran (MJIRI) 2006, 20, 147–150. [Google Scholar]
- Shahaeian, A.; Shahim, S.; Bashash, L.; Yusefi, F. Standardization, reliability and factor analysis of Iranian version of the conners’ parent and teacher rating scales—Revised: Short form for children 6 to 11 years old in Shiraz. Q. J. Psychol. Stud. 2006, 3, 97–120. [Google Scholar]
- Corbett, B.A.; Constantine, L.J.; Hendren, R.; Rocke, D.; Ozonoff, S. Examining executive functioning in children with autism spectrum disorder, attention deficit hyperactivity disorder and typical development. Psychiatry Res. 2009, 166, 210–222. [Google Scholar] [CrossRef] [Green Version]
- Cohen, B.H. Explaining psychological statistics. Psyccritiques 1996, 41, 1224–1225. [Google Scholar]
- Willcutt, E.G.; Pennington, B.F.; Boada, R.; Ogline, J.S.; Tunick, R.A.; Chhabildas, N.A.; Olson, R.K. A comparison of the cognitive deficits in reading disability and attention-deficit/hyperactivity disorder. J. Abnorm. Psychol. 2001, 110, 157. [Google Scholar] [CrossRef] [PubMed]
- Calhoun, S.L.; Mayes, S.D. Processing speed in children with clinical disorders. Psychol. Sch. 2005, 42, 333–343. [Google Scholar] [CrossRef]
- Walker, A.J.; Batchelor, J.; Shores, A. Effects of education and cultural background on performance on WAIS-III, WMS-III, WAIS-R and WMS-R measures: Systematic review. Aust. Psychol. 2009, 44, 216–223. [Google Scholar] [CrossRef]
- Boone, K.B.; Victor, T.L.; Wen, J.; Razani, J.; Pontón, M. The association between neuropsychological scores and ethnicity, language, and acculturation variables in a large patient population. Arch. Clin. Neuropsychol. 2007, 22, 355–365. [Google Scholar] [CrossRef] [PubMed] [Green Version]
- Black, D.O.; Wallace, G.L.; Sokoloff, J.L.; Kenworthy, L. Brief report: IQ split predicts social symptoms and communication abilities in high-functioning children with autism spectrum disorders. J. Autism Dev. Disord. 2009, 39, 1613–1619. [Google Scholar] [CrossRef] [PubMed]
- Kenworthy, L.; Case, L.; Harms, M.B.; Martin, A.; Wallace, G.L. Adaptive behavior ratings correlate with symptomatology and IQ among individuals with high-functioning autism spectrum disorders. J. Autism Dev. Disord. 2010, 40, 416–423. [Google Scholar] [CrossRef] [PubMed]
- Bölte, S.; Poustka, F. The relation between general cognitive level and adaptive behavior domains in individuals with autism with and without co-morbid mental retardation. Child Psychiatry Hum. Dev. 2002, 33, 165–172. [Google Scholar] [CrossRef] [PubMed]
- Kenworthy, L.E.; Black, D.O.; Wallace, G.L.; Ahluvalia, T.; Wagner, A.E.; Sirian, L.M. Disorganization: The forgotten executive dysfunction in high-functioning autism (HFA) spectrum disorders. Dev. Neuropsychol. 2005, 28, 809–827. [Google Scholar] [CrossRef] [PubMed]
- Liss, M.; Harel, B.; Fein, D.; Allen, D.; Dunn, M.; Feinstein, C.; Morris, R.; Waterhouse, L.; Rapin, I. Predictors and correlates of adaptive functioning in children with developmental disorders. J. Autism Dev. Disord. 2001, 31, 219–230. [Google Scholar] [CrossRef] [PubMed]
- Klin, A.; Saulnier, C.A.; Sparrow, S.S.; Cicchetti, D.V.; Volkmar, F.R.; Lord, C. Social and communication abilities and disabilities in higher functioning individuals with autism spectrum disorders: The Vineland and the ADOS. J. Autism Dev. Disord. 2007, 37, 748–759. [Google Scholar] [CrossRef] [PubMed]
- Joseph, R.M.; Tager-Flusberg, H.; Lord, C. Cognitive profiles and social-communicative functioning in children with autism spectrum disorder. J. Child Psychol. Psychiatry 2002, 43, 807–821. [Google Scholar] [CrossRef] [PubMed] [Green Version]
- Bruce, B.; Thernlund, G.; Nettelbladt, U. ADHD and language impairment. Eur. Child Adolesc. Psychiatry 2006, 15, 52–60. [Google Scholar] [CrossRef] [PubMed]
- Naglieri, J.A.; Goldstein, S.; Delauder, B.Y.; Schwebach, A. Relationships between the WISC-III and the cognitive assessment system with conners’ rating scales and continuous performance tests. Arch. Clin. Neuropsychol. 2005, 20, 385–401. [Google Scholar] [CrossRef] [PubMed]
- Ronald, A.; Happe, F.; Price, T.S.; Baron-Cohen, S.; Plomin, R. Phenotypic and genetic overlap between autistic traits at the extremes of the general population. J. Am. Acad. Child Adolesc. Psychiatry 2006, 45, 1206–1214. [Google Scholar] [CrossRef]


| Scales | Mean (SD) | 95% CI | |
|---|---|---|---|
| GARS-2 | GARS Autism Index | 74.18 (11.85) | [69.73, 78.59] |
| Stereotyped Behaviors—SS | 6.1 (2.66) | [5.10, 7.09] | |
| Stereotyped Behaviors—%ile | 15.46 (15.25) | [9.77, 21.16] | |
| Communication—SS | 4.26 (1.38) | [3.74, 4.78] | |
| Communication—%ile | 6.8 (3.41) | [5.52, 8.07] | |
| Social interaction-SS | 6.1 (1.56) | [5.51, 6.68] | |
| Social interaction—%ile | 11.7 (5.84) | [9.51, 13.88] | |
| Total Standard Score | 16.46 (4.42) | [14.81, 18.11] | |
| Rank Percent | 23.13 (15.59) | [17.31, 28.95] | |
| CPRS-R:S | ADHD Index | 60.83 (7.28) | [58.14, 63.55] |
| Oppositional | 54.97 (9.70) | [51.34, 58.59] | |
| Cognitive Problems/ Inattention | 60.40 (9.03) | [57.03, 63.77] | |
| Hyperactivity | 64.23 (11.59) | [59.91, 68.56] | |
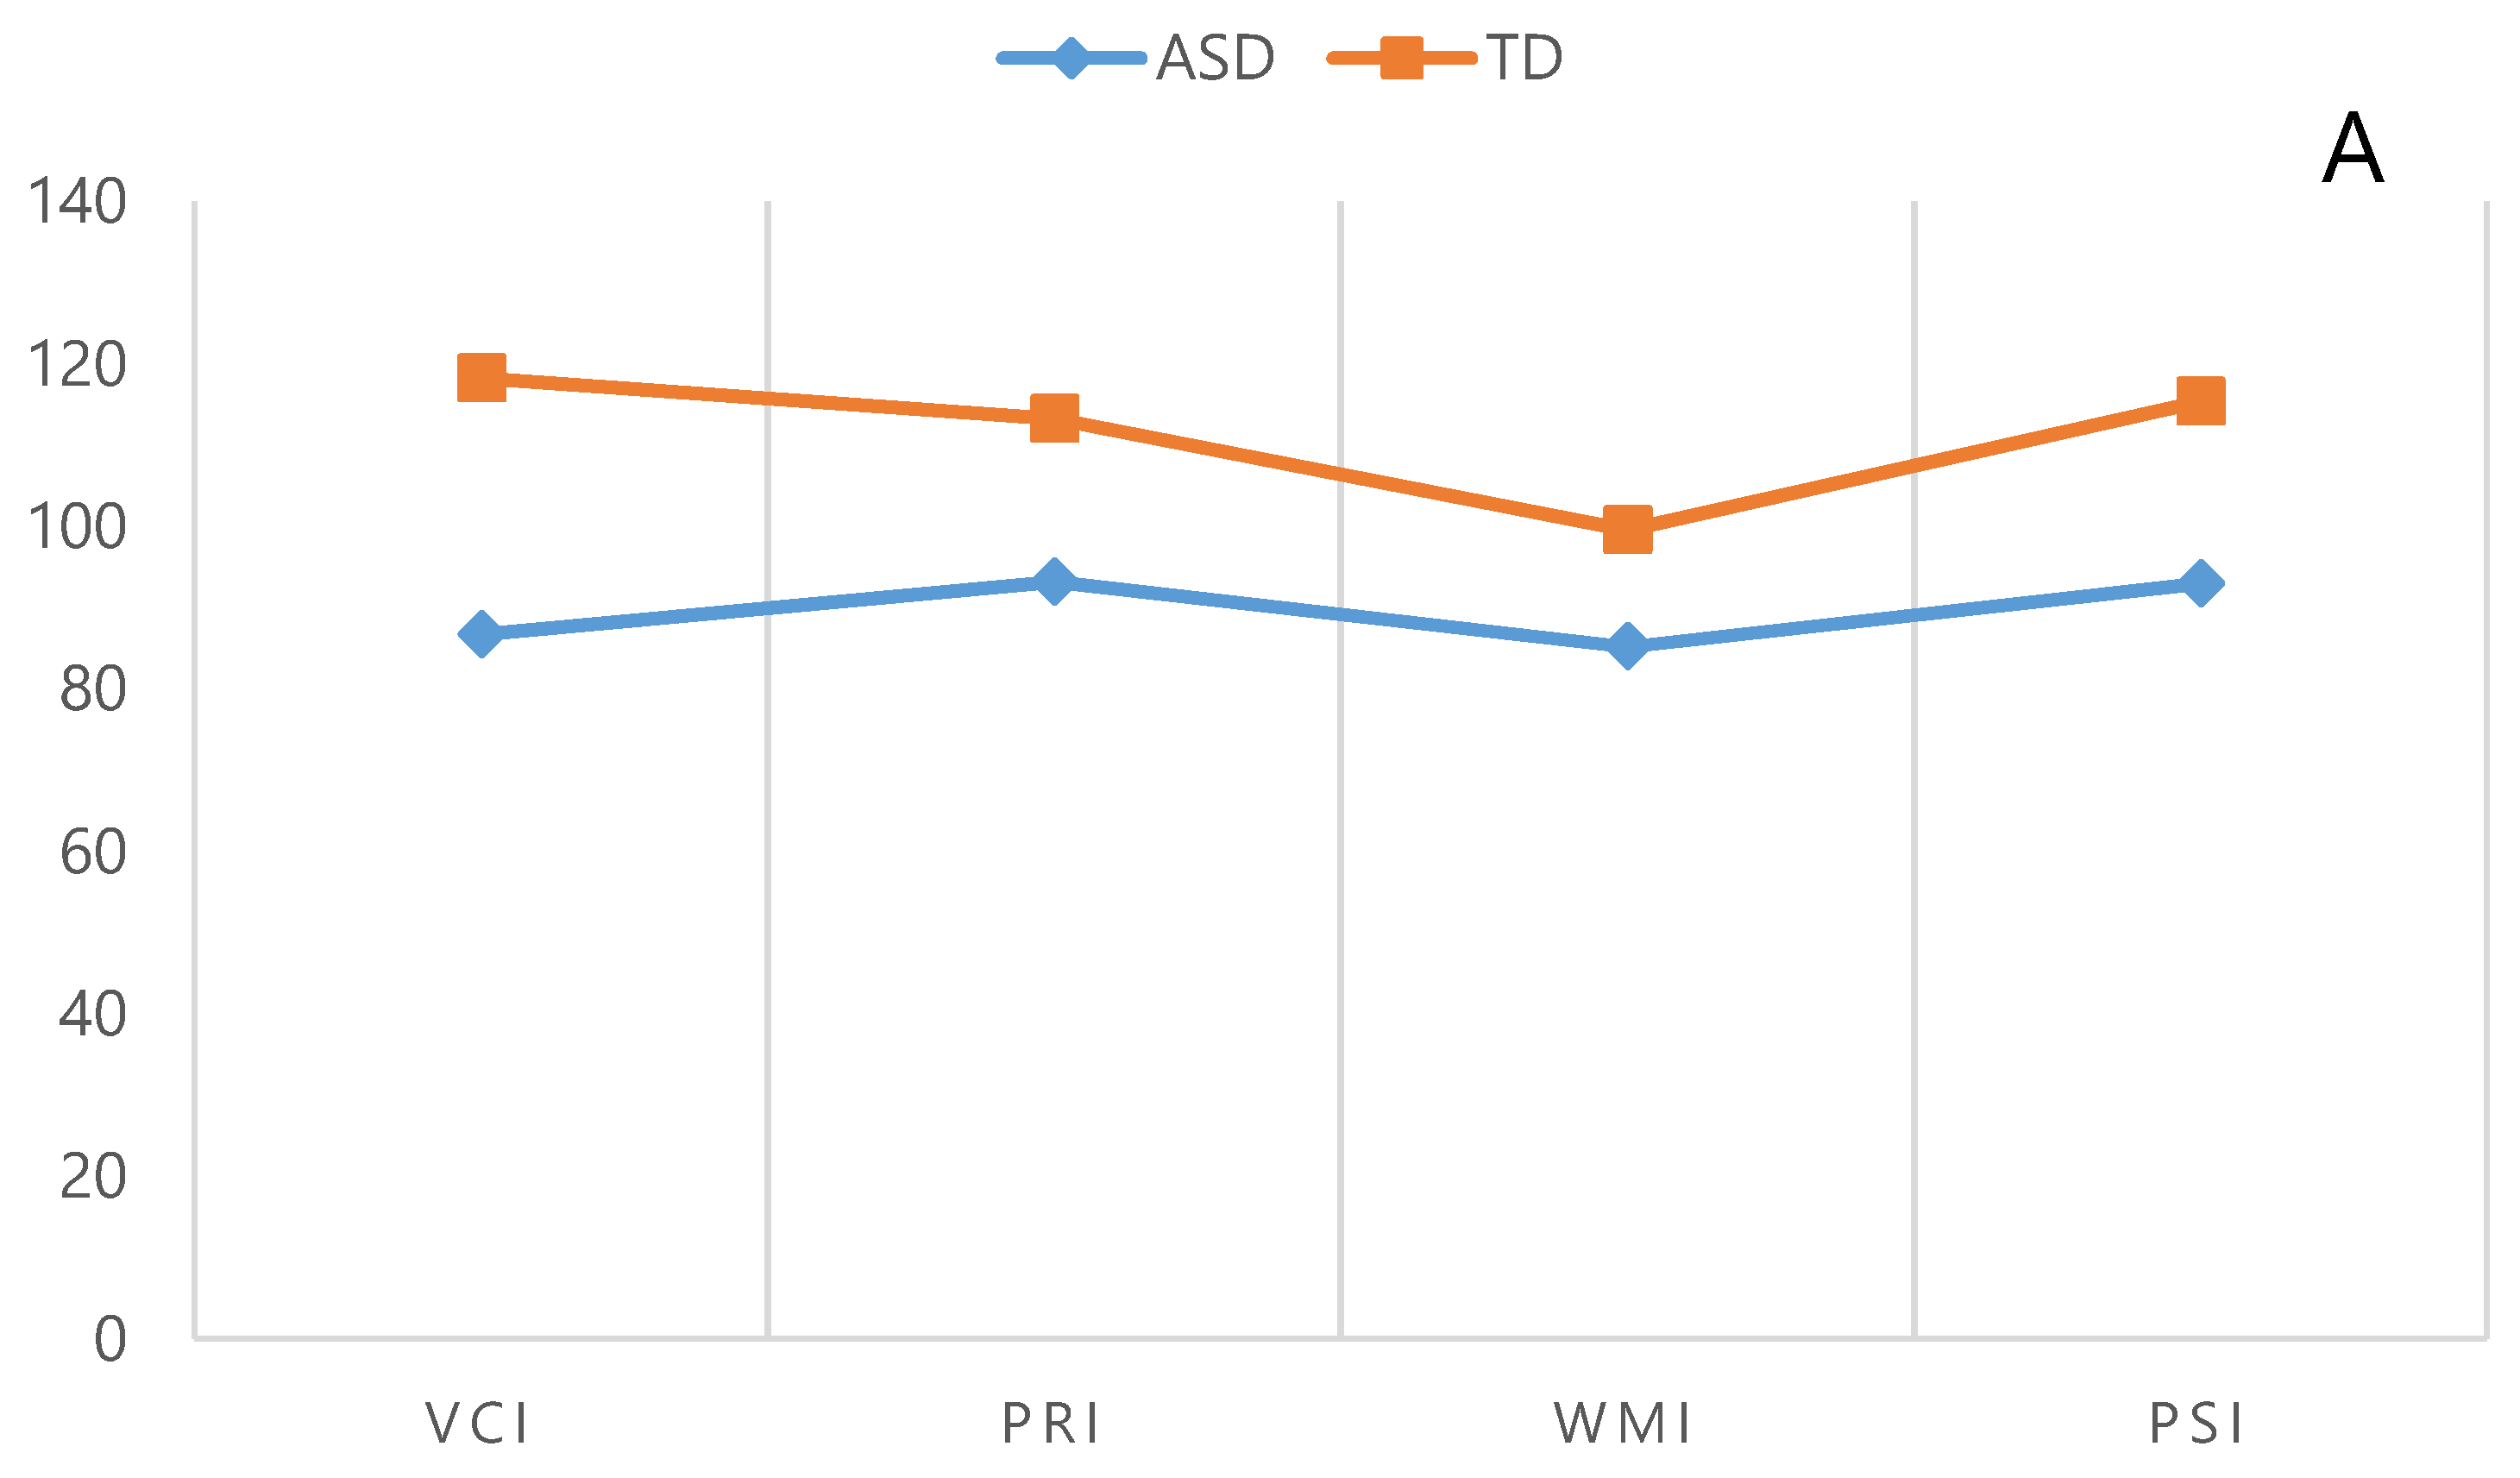
| Indices and the Subtests of the WISC-4 | FSIQ | ASD | TD | Intergroup Comparisons | |||
|---|---|---|---|---|---|---|---|
| Mean (SD) | 95% CI | Mean (SD) | 95% CI | P-Value | Cohens d | ||
| VCI | Not Matched | 86.70 (19.18) | [79.53, 93.86] | 118.27 (10.99) | [114.16, 122.37] | 0.001 | 2.01 |
| Matched | 100.31 (14.98) | [91.25, 109.36] | 111.38 (8.71) | [106.11, 116.65] | 0.030 | 0.90 | |
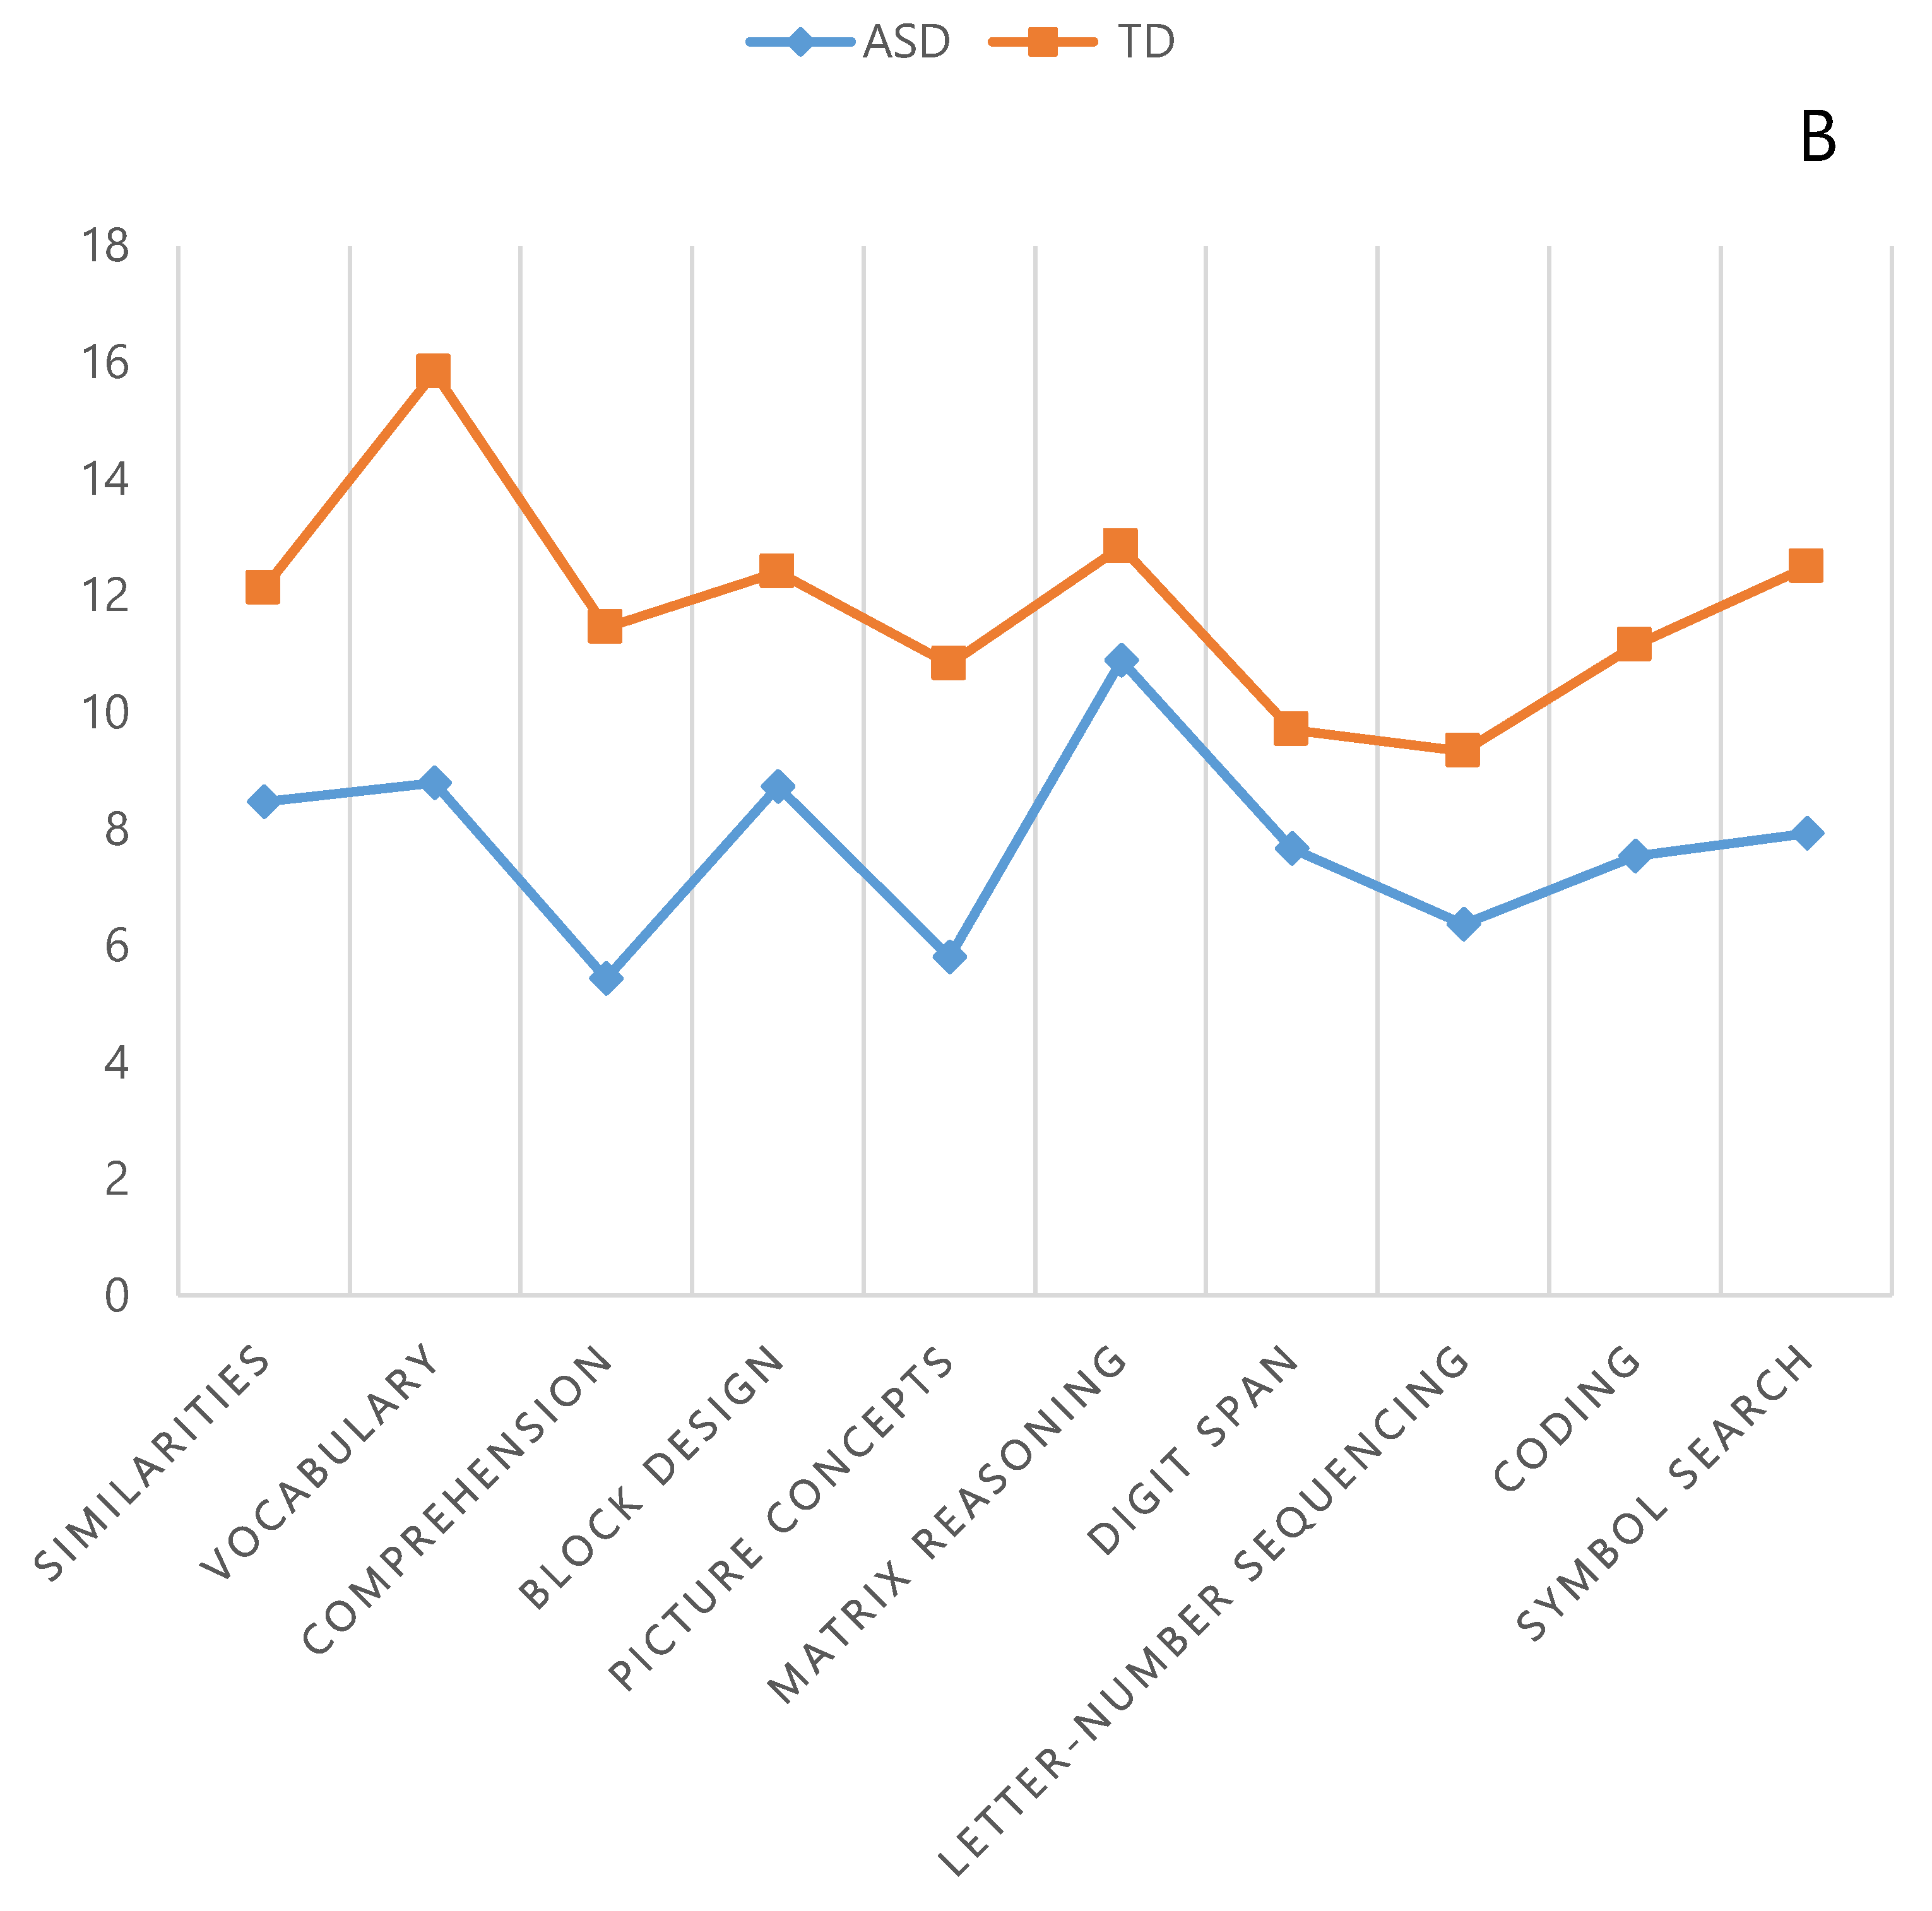
| Similarities | Not Matched | 8.20 (4.02) | [6.69, 9.70] | 11.96 (3.59) | [10.62, 13.30] | 0.001 | 0.98 |
| Matched | 9.92 (4.36) | [7.28, 12.56] | 9.53 (2.84) | [7.81, 11.25] | P > 0.05 | - | |
| Vocabulary | Not Matched | 8.43 (4.44) | [6.77, 10.09] | 15.83b(1.93) | [15.11, 16.55] | 0.001 | 2.16 |
| Matched | 12.15 (3.13) | [10.26, 14.04] | 14.84 (2.26) | [13.47, 16.21] | 0.019 | 0.98 | |
| Comprehension | Not Matched | 5.03 (3.46) | [3.73, 6.32] | 11.26 (3.00) | [10.14, 12.38] | 0.001 | 2.23 |
| Matched | 7.00 (3.26) | [5.02, 8.97] | 10.69 (1.75) | [9.63, 11.75] | 0.001 | 1.41 | |
| PRI | Not Matched | 93.20 (11.87) | [88.76, 97.63] | 113.23 (11.14) | [109.07, 117.39] | 0.001 | 1.74 |
| Matched | 100.23 (11.30) | [93.39, 107.06] | 103.54 (7.25) | [99.15, 107.92] | P > 0.05 | - | |
| Block Design | Not Matched | 8.93 (3.70) | [7.55, 10.31] | 12.10 (3.26) | [10.88, 13.31] | 0.001 | 0.90 |
| Matched | 9.61 (3.61) | [7.42, 11.80] | 9.46 (2.22) | [8.11, 10.80] | P > 0.05 | - | |
| Picture Concepts | Not Matched | 5.66 (2.30) | [4.80, 6.52] | 10.86 (1.79) | [10.19, 11.53] | 0.001 | 2.52 |
| Matched | 7.15 (1.51) | [6.23, 8.07] | 10.00 (1.73) | [8.95, 11.04] | 0.001 | 1.75 | |
| Matrix Reasoning | Not Matched | 10.76 (2.67) | [9.76, 11.76] | 12.73 (2.65) | [11.74, 13.72] | 0.006 | 0.74 |
| Matched | 12.15 (2.64) | [10.55, 13.74] | 11.23 (2.27) | [9.85, 12.60] | P > 0.05 | - | |
| WMI | Not Matched | 85.20 (15.43) | [79.43, 90.96] | 99.56 (9.78) | [95.91, 103.21] | 0.001 | 1.11 |
| Matched | 93.61 (15.58) | [84.20, 103.03] | 95.61 (7.77) | [90.91, 100.31] | P > 0.05 | - | |
| Digit Span | Not Matched | 7.60 (4.06) | [6.08, 9.11] | 9.46 (2.44) | [8.55, 10.37] | 0.035 | 0.55 |
| Matched | 9.76 (3.44) | [7.68, 11.85] | 8.92 (2.39) | [7.47, 10.37] | P > 0.05 | - | |
| Letter–Number Sequencing | Not Matched | 6.10 (2.72) | [5.08, 7.11] | 9.30 (2.33) | [8.42, 10.17] | 0.001 | 1.25 |
| Matched | 6.92 (3.30) | [4.92, 8.91] | 8.46 (2.02) | [7.23, 9.68] | P > 0.05 | - | |
| PSI | Not Matched | 93.00 (14.49) | [87.58, 98.41] | 115.43 (9.71) | [11.80, 119.06] | 0.001 | 1.81 |
| Matched | 102.62 (13.89) | [94.21, 11.01] | 108.08 (5.88) | [104.52, 11.63] | P > 0.05 | - | |
| Coding | Not Matched | 7.53 (3.49) | [6.22, 8.83] | 11.20 (2.23) | [10.36, 12.03] | 0.001 | 1.25 |
| Matched | 9.53 (3.59) | [7.36, 11.71] | 10.07 (1.75) | [9.01, 11.13] | P > 0.05 | - | |
| Symbol Search | Not Matched | 7.86 (2.37) | [6.98, 8.75] | 12.33 (2.23) | [11.49, 13.16] | 0.001 | 1.94 |
| Matched | 9.53 (3.59) | [7.36, 11.71] | 10.76 (1.42) | [9.90, 11.62] | 0.048 | 0.45 | |
| FSIG | Not Matched | 85.63 (12.51) | [80.96, 90.31] | 11.87 (9.62) | [108.27, 115,46] | 0.001 | 2.35 |
| Matched | 97.08 (9.06) | [91.60, 102.55] | 102.85 (5.04) | [99.80, 105.90] | P > 0.05 | - | |
| Age (months) | Not Matched | 133.17 (33.12) | [120.80, 14.53] | 134.43 (32.06) | [122.46, 146.41] | 0.881 | - |
| Matched | 146.62 (30.69) | [122.46, 151.39] | 127.23 (39.06) | [103.62, 150.84] | P > 0.05 | - | |
| Index | Group | FSIQ | VCI | PRI | WMI | PSI |
|---|---|---|---|---|---|---|
| FSIQ | ASD | |||||
| TD | ||||||
| VCI | ASD | 0.633 | ||||
| TD | 0.001 | |||||
| PRI | ASD | 0.001 | 0.068 | |||
| TD | 0.236 | 0.022 | ||||
| WMI | ASD | 0.839 | 0.682 | 0.006 | ||
| TD | 0.001 | 0.001 | 0.001 | |||
| PSI | ASD | 0.003 | 0.119 | 0.943 | 0.018 | |
| TD | 0.013 | 0.247 | 0.191 | 0.001 |
| Subtest | Group | Similarities | Vocabulary | Comprehension | Block Design | Picture Concepts | Matrix Reasoning | Digit Span | Letter–Number Sequencing | Coding | Symbol Search |
|---|---|---|---|---|---|---|---|---|---|---|---|
| Similarities | ASD | ||||||||||
| TD | |||||||||||
| Vocabulary | ASD | 0.734 | |||||||||
| TD | 0.001 | ||||||||||
| Comprehension | ASD | 0.001 | 0.001 | ||||||||
| TD | 0.507 | 0.001 | |||||||||
| Block Design | ASD | 0.434 | 0.611 | 0.001 | |||||||
| TD | 0.828 | 0.001 | 0.456 | ||||||||
| Picture Concepts | ASD | 0.004 | 0.001 | 0.314 | 0.001 | ||||||
| TD | 0.111 | 0.001 | 0.148 | 0.061 | |||||||
| Matrix Reasoning | ASD | 0.005 | 0.005 | 0.001 | 0.006 | 0.001 | |||||
| TD | 0.250 | 0.001 | 0.069 | 0.279 | 0.001 | ||||||
| Digit Span | ASD | 0.478 | 0.372 | 0.007 | 0.113 | 0.009 | 0.001 | ||||
| TD | 0.004 | 0.001 | 0.003 | 0.001 | 0.015 | 0.001 | |||||
| Letter–Number Sequencing | ASD | 0.005 | 0.013 | 0.157 | 0.003 | 0.447 | 0.001 | 0.061 | |||
| TD | 0.001 | 0.001 | 0.001 | 0.001 | 0.005 | 0.001 | 0.780 | ||||
| Coding | ASD | 0.515 | 0.322 | 0.007 | 0.139 | 0.004 | 0.001 | 0.940 | 0.064 | ||
| TD | 0.260 | 0.001 | 0.475 | 0.094 | 0.473 | 0.005 | 0.004 | 0.002 | |||
| Symbol Search | ASD | 0.660 | 0.474 | 0.001 | 0.128 | 0.001 | 0.001 | 0.708 | 0.006 | 0.533 | |
| TD | 0.603 | 0.001 | 0.192 | 0.667 | 0.003 | 0.475 | 0.001 | 0.001 | 0.029 |
| Scale | WISC-IV Index and Subtests | |||||||||||||||
|---|---|---|---|---|---|---|---|---|---|---|---|---|---|---|---|---|
| Similarities | Vocabulary | Comprehension | VCI | Block Design | Picture Concepts | Matrix Reasoning | PRI | Digit Span | Letter–Number Sequencing | WMI | Coding | Symbol Search | PSI | FSIQ | ||
| GARS-2 | GARS Autism Index | −0.154 | −0.238 | −0.320 | −0.273 | −0.235 | 0.078 | 0.010 | −0.096 | 0.243 | 0.089 | 0.218 | −0.027 | −0.044 | 0.071 | −0.118 |
| Stereotyped Behaviors | −0.191 | −0.126 | −0.347 | −0.252 | −0.181 | 0.045 | 0.047 | −0.057 | 0.242 | 0.079 | 0.209 | −0.045 | 0.062 | 0.132 | −0.131 | |
| Communication | −0.189 | −0.466 ** | −0.417 * | −0.410* | −0.151 | −0.230 | −0.196 | −0.267 | −0.072 | 0.020 | −0.041 | 0.039 | −0.345 | −0.204 | −0.378 * | |
| Social interaction | 0.057 | −0.071 | 0.031 | −0.001 | −0.148 | 0.363 * | 0.113 | 0.109 | 0.436 * | 0.144 | 0.393 * | −0.020 | 0.141 | 0.136 | 0.224 | |
| Total Standard Score | −0.154 | −0.247 | −0.329 | −0.281 | −0.208 | 0.083 | 0.007 | −0.080 | 0.277 | −0.105 | 0.252 | −0.022 | 0.056 | 0.063 | −0.114 | |
| Rank Percent | −0.149 | −0.233 | −0.316 | −0.264 | −0.254 | 0.053 | −0.016 | −0.127 | 0.196 | 0.076 | 0.177 | −0.032 | 0.036 | 0.078 | −0.129 | |
| CPRS-R:S | Oppositional | −0.146 | −0.065 | −0.191 | −0.155 | −0.112 | 0.044 | −0.047 | −0.071 | −0.003 | −0.084 | −0.044 | 0.118 | 0.158 | 0.215 | 0.014 |
| Cognitive Problems/Inattention | −0.345 | −0.390 * | −0.404 * | −0.423 * | −0.150 | −0.229 | −0.334 | −0.344 | −0.526 ** | −0.295 | −0.531 ** | 0.161 | −0.108 | −0.068 | −0.434 * | |
| Hyperactivity | −0.171 | −0.147 | −0.415 * | −0.282 | −0.126 | −0.015 | −0.025 | −0.089 | −0.089 | −0.108 | −0.128 | 0.131 | 0.134 | 0.230 | −0.097 | |
| ADHD Index | −0.264 | −0.162 | −0.383 * | −0.296 | −0.156 | −0.038 | −0.196 | −0.213 | −0.241 | −0.192 | −0.262 | 0.331 | −0.054 | 0.207 | −0.178 | |
© 2019 by the authors. Licensee MDPI, Basel, Switzerland. This article is an open access article distributed under the terms and conditions of the Creative Commons Attribution (CC BY) license (http://creativecommons.org/licenses/by/4.0/).
Share and Cite
Rabiee, A.; Samadi, S.A.; Vasaghi-Gharamaleki, B.; Hosseini, S.; Seyedin, S.; Keyhani, M.; Mahmoodizadeh, A.; Ranjbar Kermani, F. The Cognitive Profile of People with High-Functioning Autism Spectrum Disorders. Behav. Sci. 2019, 9, 20. https://doi.org/10.3390/bs9020020
Rabiee A, Samadi SA, Vasaghi-Gharamaleki B, Hosseini S, Seyedin S, Keyhani M, Mahmoodizadeh A, Ranjbar Kermani F. The Cognitive Profile of People with High-Functioning Autism Spectrum Disorders. Behavioral Sciences. 2019; 9(2):20. https://doi.org/10.3390/bs9020020
Chicago/Turabian StyleRabiee, Atusa, Sayyed Ali Samadi, Behnoosh Vasaghi-Gharamaleki, Soode Hosseini, Saba Seyedin, Mohammadreza Keyhani, Ameneh Mahmoodizadeh, and Fatemeh Ranjbar Kermani. 2019. "The Cognitive Profile of People with High-Functioning Autism Spectrum Disorders" Behavioral Sciences 9, no. 2: 20. https://doi.org/10.3390/bs9020020