Physiological Profile Assessment of Posture in Children and Adolescents with Autism Spectrum Disorder and Typically Developing Peers

 , , , , ,
  ,
,
Abstract
:1. Introduction
2. Materials and Methods
2.1. Participants
2.2. Physiological Profile Assessment
2.2.1. Vision
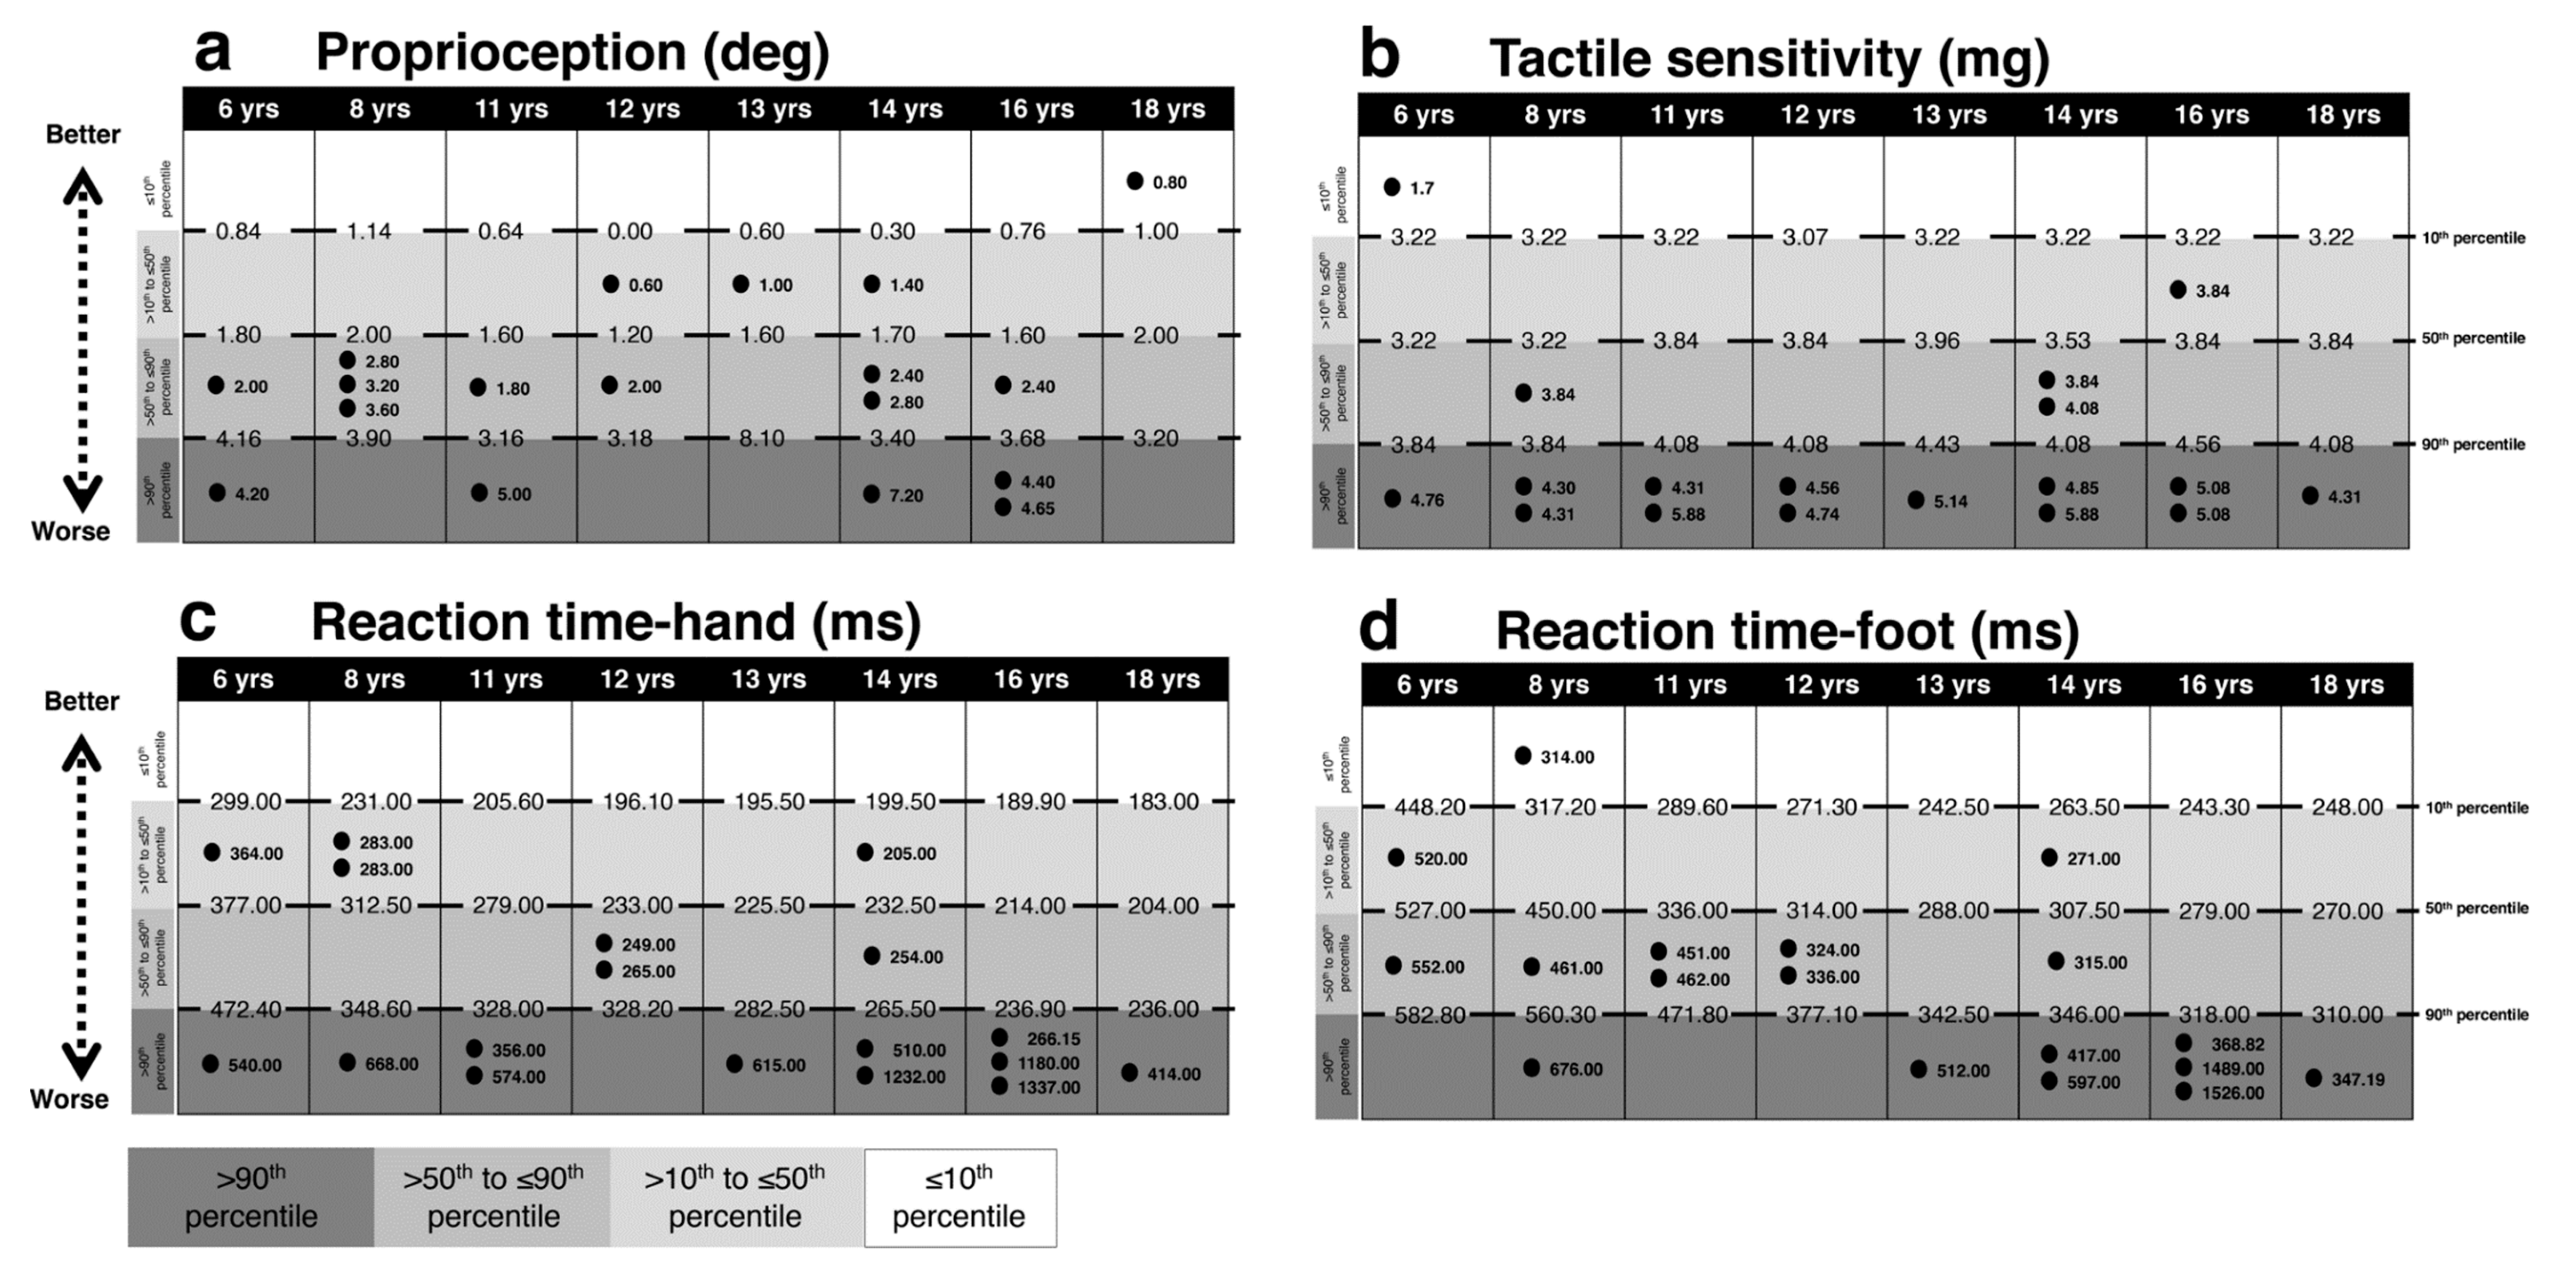
2.2.2. Peripheral Sensation
2.2.3. Reaction Time
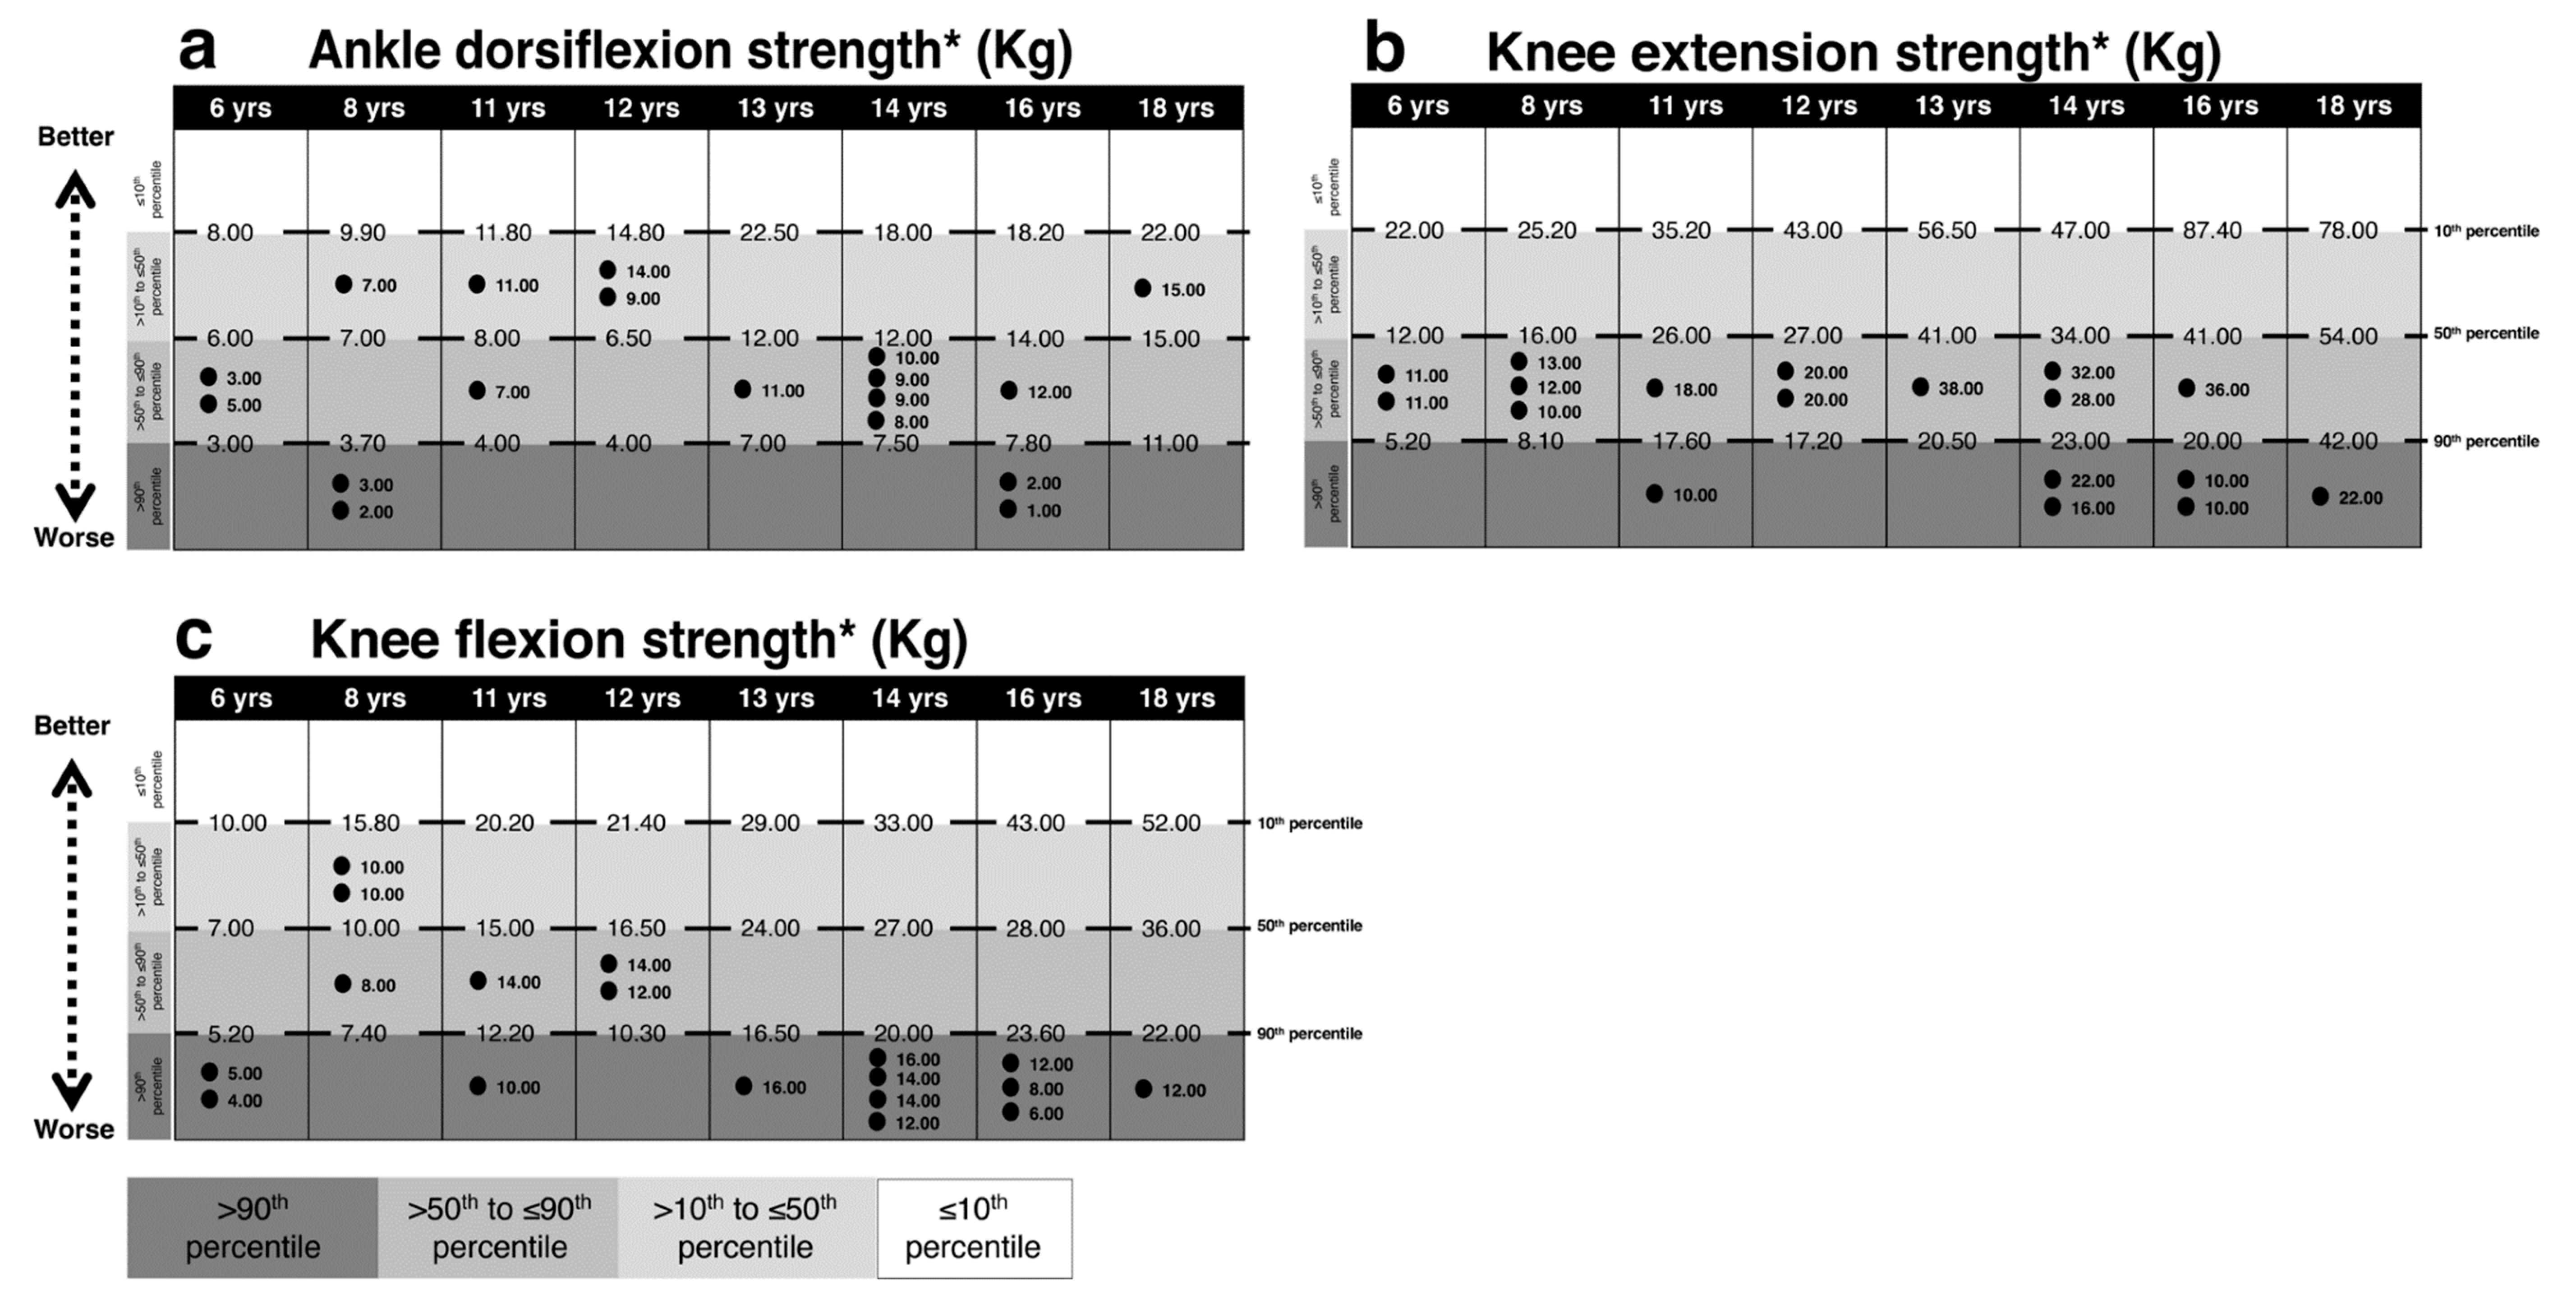
2.2.4. Lower Limb Muscle Strength
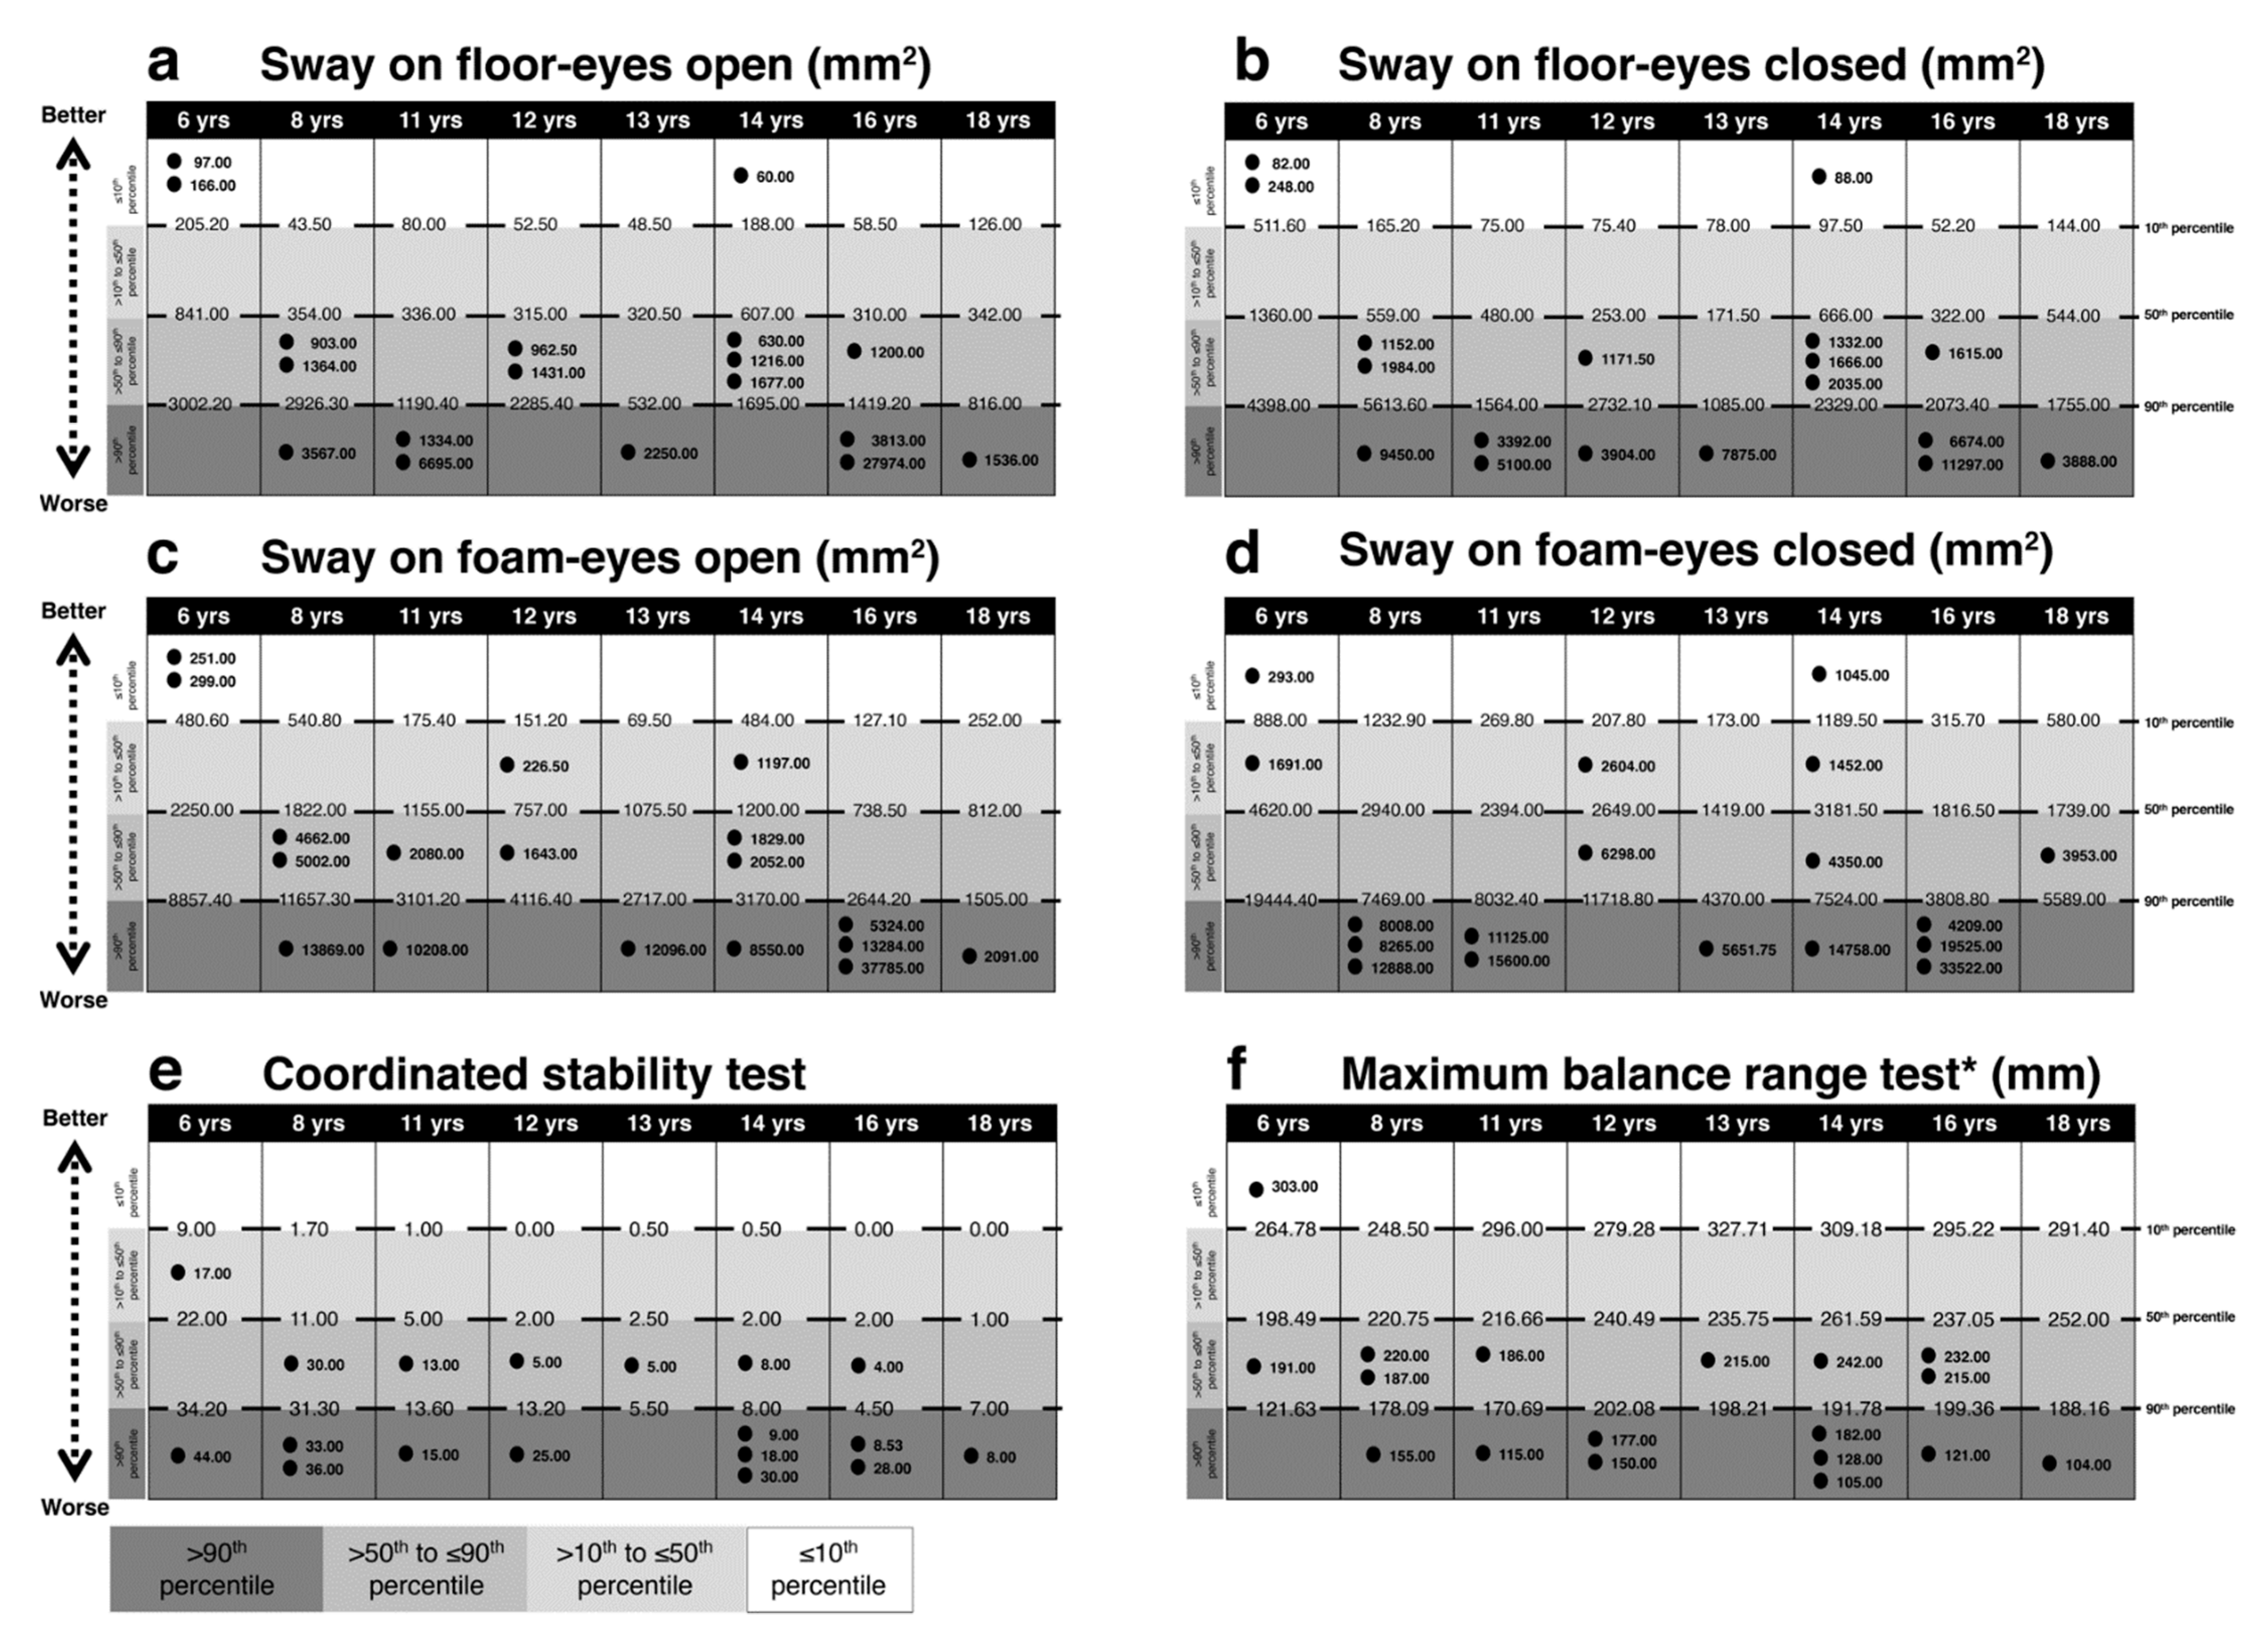
2.2.5. Balance
2.3. Statistical Analysis
3. Results
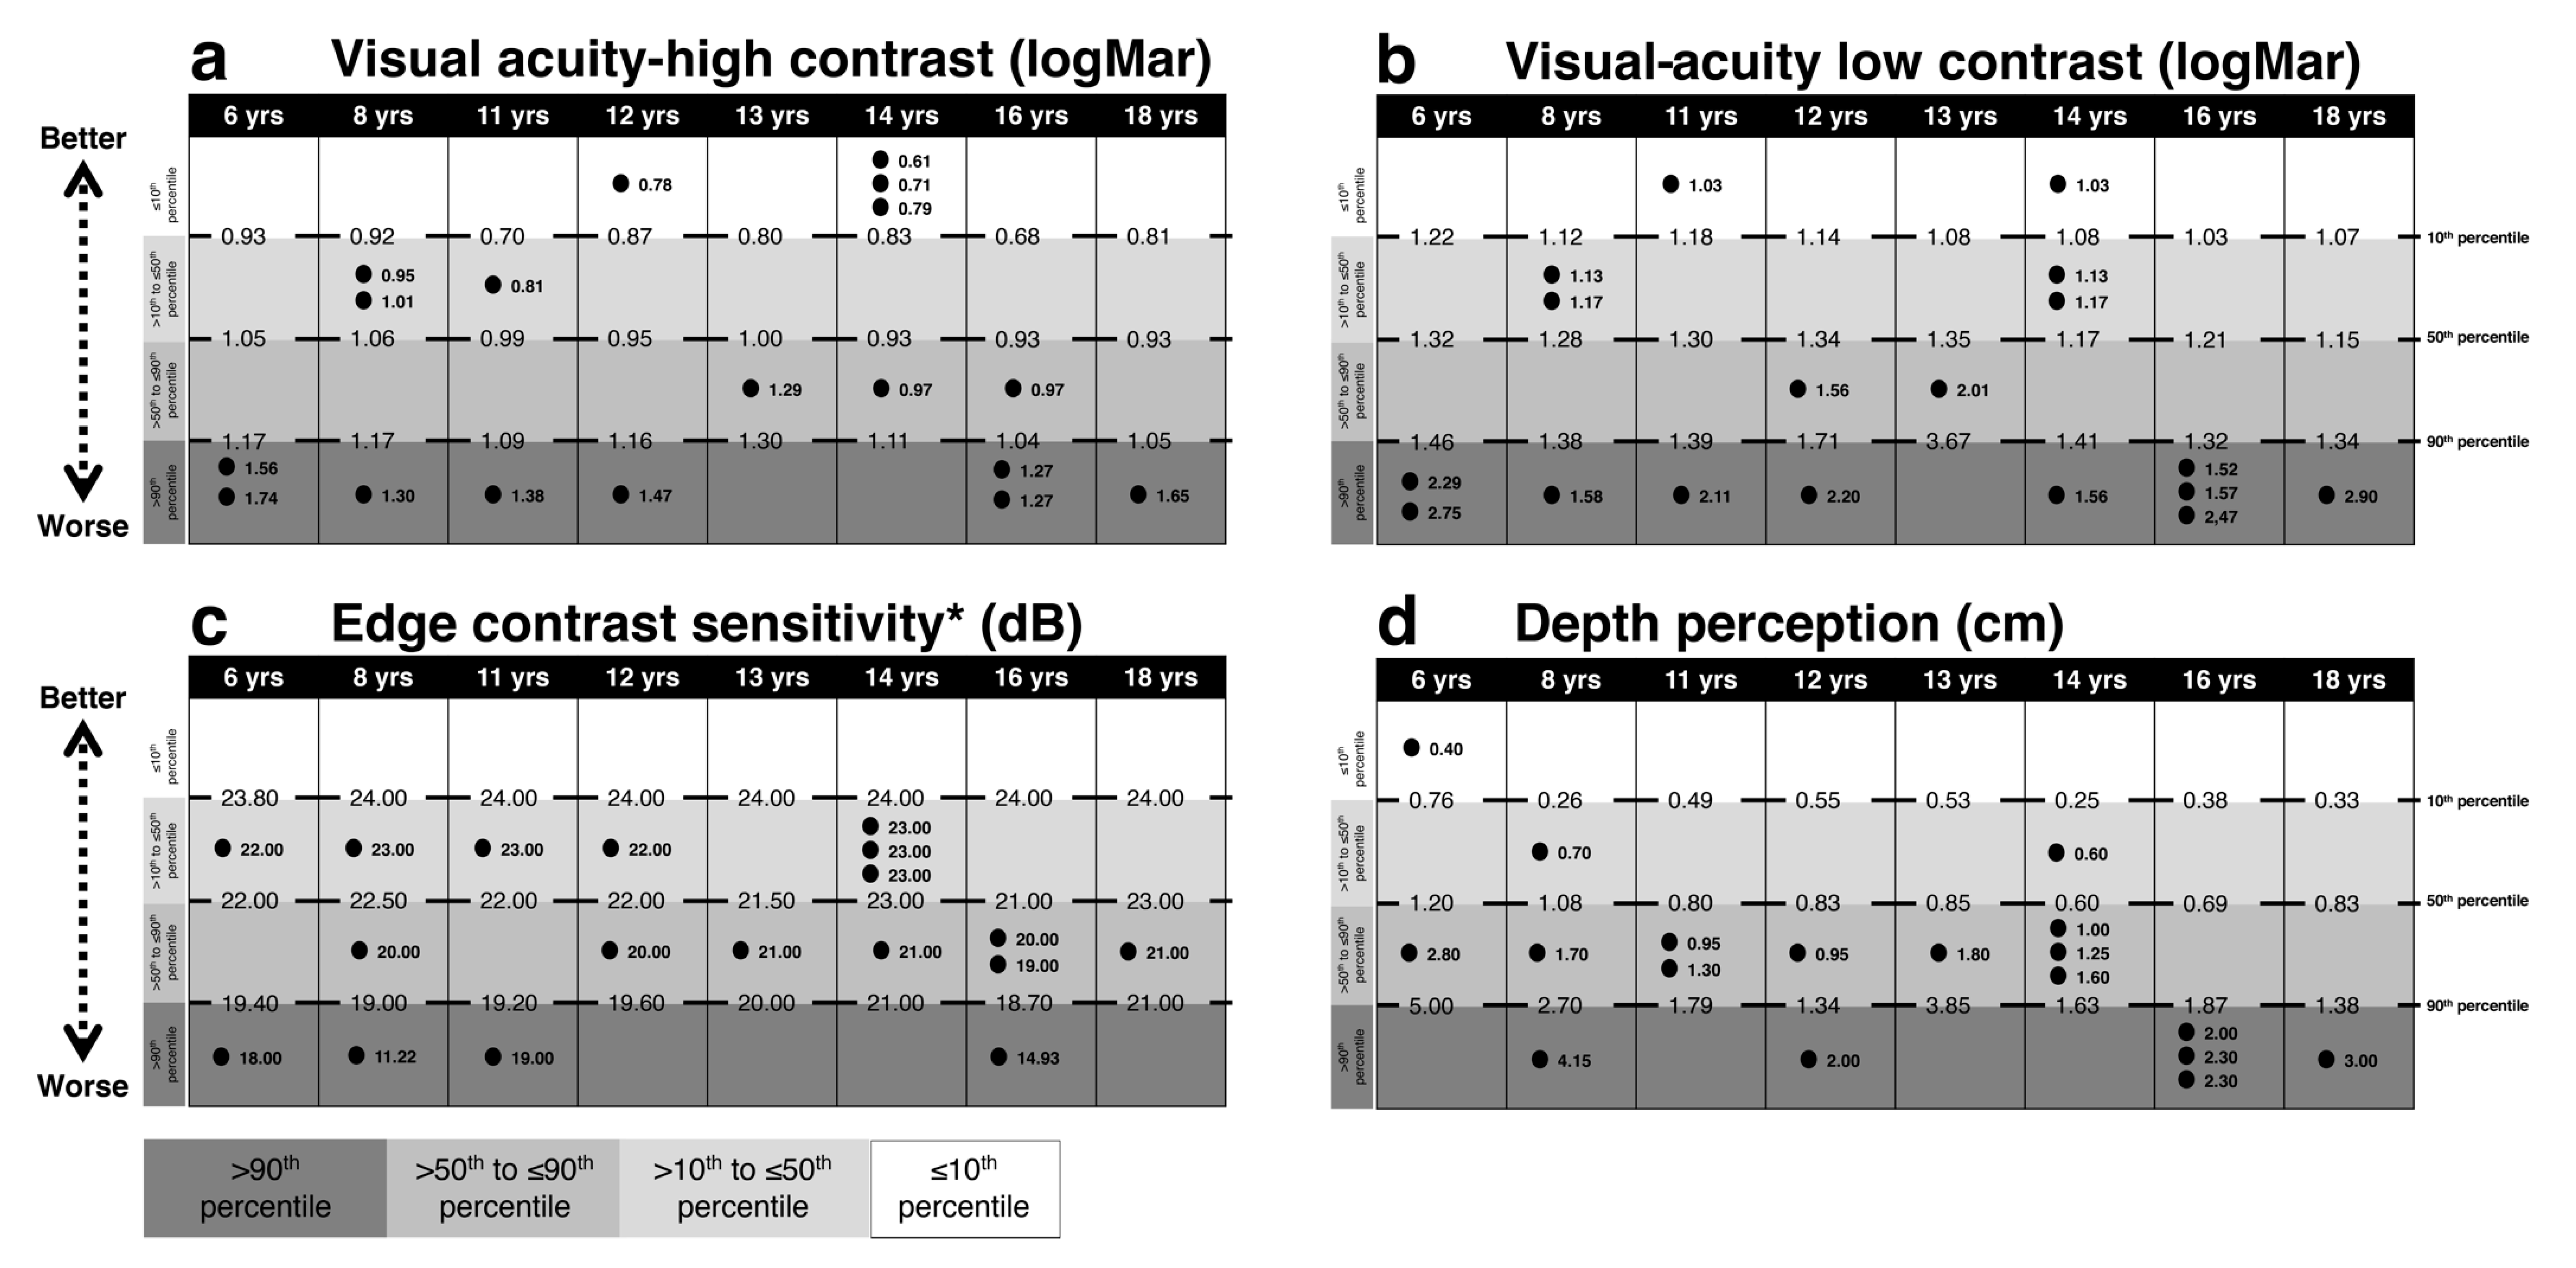
3.1. Vision
3.2. Reaction Time
3.3. Lower Limb Muscle Strength
3.4. Balance
3.5. Relationships between Test Performance and Age
4. Discussion
4.1. Vision
4.2. Peripheral Sensation
4.3. Reaction Time
4.4. Lower Limb Muscle Strength
4.5. Balance Tests
4.6. Correlation with Age
4.7. Limitations
5. Conclusions
Supplementary Materials
Author Contributions
Funding
Acknowledgments
Conflicts of Interest
Data Availability Statement:
References
- Baio, J.; Wiggins, L.; Christensen, D.L.; Maenner, M.J.; Daniels, J.; Warren, Z.; Kurzius-Spencer, M.; Zahorodny, W.; Robinson Rosenberg, C.; White, T.; et al. Prevalence of Autism Spectrum Disorder Among Children Aged 8 Years—Autism and Developmental Disabilities Monitoring Network, 11 Sites, United States, 2014. MMWR Surveill. Summ. 2018, 67, 1–23. [Google Scholar] [CrossRef]
- Narzisi, A.; Posada, M.; Barbieri, F.; Chericoni, N.; Ciuffolini, D.; Pinzino, M.; Romano, R.; Scattoni, M.L.; Tancredi, R.; Calderoni, S.; et al. Prevalence of Autism Spectrum Disorder in a large Italian catchment area: A school-based population study within the ASDEU project. Epidemiol. Psychiatr. Sci. 2018, 29, e5. [Google Scholar] [CrossRef]
- Association, A.P. Diagnostic and statistical manual of mental disorders. BMC Med. 2013, 17, 133–137. [Google Scholar]
- Provost, B.; Lopez, B.R.; Heimerl, S. A comparison of motor delays in young children: Autism spectrum disorder, developmental delay, and developmental concerns. J. Autism Dev. Disord. 2007, 37, 321–328. [Google Scholar] [CrossRef]
- Teitelbaum, P.; Teitelbaum, O.; Nye, J.; Fryman, J.; Maurer, R.G. Movement analysis in infancy may be useful for early diagnosis of autism. Proc. Natl. Acad. Sci. USA 1998, 95, 13982–13987. [Google Scholar] [CrossRef] [Green Version]
- Ghaziuddin, M.; Butler, E. Clumsiness in autism and Asperger syndrome: A further report. J. Intellect. Disabil. Res. 1998, 42 Pt 1, 43–48. [Google Scholar] [CrossRef]
- Mari, M.; Castiello, U.; Marks, D.; Marraffa, C.; Prior, M. The reach-to-grasp movement in children with autism spectrum disorder. Philos. Trans. R. Soc. Lond. B Biol. Sci. 2003, 358, 393–403. [Google Scholar] [CrossRef] [Green Version]
- Miyahara, M.; Tsujii, M.; Hori, M.; Nakanishi, K.; Kageyama, H.; Sugiyama, T. Brief report: Motor incoordination in children with Asperger syndrome and learning disabilities. J. Autism Dev. Disord. 1997, 27, 595–603. [Google Scholar] [CrossRef]
- Noterdaeme, M.; Mildenberger, K.; Minow, F.; Amorosa, H. Evaluation of neuromotor deficits in children with autism and children with a specific speech and language disorder. Eur. Child Adolesc. Psychiatry 2002, 11, 219–225. [Google Scholar] [CrossRef]
- Kindregan, D.; Gallagher, L.; Gormley, J. Gait deviations in children with autism spectrum disorders: A review. Autism Res. Treat. 2015, 2015, 741480. [Google Scholar] [CrossRef] [Green Version]
- Valagussa, G.; Balatti, V.; Trentin, L.; Piscitelli, D.; Yamagata, M.; Grossi, E. Relationship between tip-toe behavior and soleus—gastrocnemius muscle lengths in individuals with autism spectrum disorders. J. Orthop. 2020, 21, 444–448. [Google Scholar] [CrossRef]
- Ament, K.; Mejia, A.; Buhlman, R.; Erklin, S.; Caffo, B.; Mostofsky, S.; Wodka, E. Evidence for specificity of motor impairments in catching and balance in children with autism. J. Autism. Dev. Disord. 2015, 45, 742–751. [Google Scholar] [CrossRef] [Green Version]
- Fournier, K.A.; Kimberg, C.I.; Radonovich, K.J.; Tillman, M.D.; Chow, J.W.; Lewis, M.H.; Bodfish, J.W.; Hass, C.J. Decreased static and dynamic postural control in children with autism spectrum disorders. Gait Posture 2010, 32, 6–9. [Google Scholar] [CrossRef] [Green Version]
- Memari, A.H.; Ghanouni, P.; Shayestehfar, M.; Ghaheri, B. Postural control impairments in individuals with autism spectrum disorder: A critical review of current literature. Asian J. Sports Med. 2014, 5, e22963. [Google Scholar] [CrossRef] [Green Version]
- Ming, X.; Brimacombe, M.; Wagner, G.C. Prevalence of motor impairment in autism spectrum disorders. Brain Dev. 2007, 29, 565–570. [Google Scholar] [CrossRef]
- Minshew, N.J.; Sung, K.; Jones, B.L.; Furman, J.M. Underdevelopment of the postural control system in autism. Neurology 2004, 63, 2056–2061. [Google Scholar] [CrossRef]
- Vernazza-Martin, S.; Martin, N.; Vernazza, A.; Lepellec-Muller, A.; Rufo, M.; Massion, J.; Assaiante, C. Goal directed locomotion and balance control in autistic children. J. Autism Dev. Disord. 2005, 35, 91–102. [Google Scholar] [CrossRef]
- Horak, F.B. Postural orientation and equilibrium: What do we need to know about neural control of balance to prevent falls? Age Ageing 2006, 35 (Suppl. 2), ii7–ii11. [Google Scholar] [CrossRef] [Green Version]
- Peterka, R.J. Sensorimotor integration in human postural control. J. Neurophysiol. 2002, 88, 1097–1118. [Google Scholar] [CrossRef] [Green Version]
- Brockevelt, B.L.; Nissen, R.; Schweinle, W.E.; Kurtz, E.; Larson, K.J. A comparison of the Sensory Profile scores of children with autism and an age- and gender-matched sample. S. D. Med. 2013, 66, 463–465. [Google Scholar]
- Cascio, C.J. Somatosensory processing in neurodevelopmental disorders. J. Neurodev. Disord. 2010, 2, 62–69. [Google Scholar] [CrossRef] [Green Version]
- Lloyd, M.; MacDonald, M.; Lord, C. Motor skills of toddlers with autism spectrum disorders. Autism 2013, 17, 133–146. [Google Scholar] [CrossRef] [Green Version]
- Henderson, S.E.; Sugden, D.A.; Barnett, A.L. Movement Assessment Battery for Children-2 Second Edition [Movement ABC-2]; The Psychological Corporation: London, UK, 2007. [Google Scholar]
- Emck, C.; Bosscher, R.J.; Van Wieringen, P.C.; Doreleijers, T.; Beek, P.J. Gross motor performance and physical fitness in children with psychiatric disorders. Dev. Med. Child Neurol. 2011, 53, 150–155. [Google Scholar] [CrossRef]
- Largo, R.H.; Fischer, J.E.; Rousson, V. Neuromotor development from kindergarten age to adolescence: Developmental course and variability. Swiss Med. Wkly. 2003, 133, 193–199. [Google Scholar] [CrossRef] [PubMed]
- Denckla, M.B. Revised Neurological Examination for Subtle Signs (1985). Psychopharmacol. Bull. 1985, 21, 773–800. [Google Scholar] [PubMed]
- Chen, F.C.; Tsai, C.L. A light fingertip touch reduces postural sway in children with autism spectrum disorders. Gait Posture 2016, 43, 137–140. [Google Scholar] [CrossRef] [PubMed]
- Lim, Y.H.; Partridge, K.; Girdler, S.; Morris, S.L. Standing Postural Control in Individuals with Autism Spectrum Disorder: Systematic Review and Meta-analysis. J. Autism Dev. Disord. 2017, 47, 2238–2253. [Google Scholar] [CrossRef]
- Wang, Z.; Hallac, R.R.; Conroy, K.C.; White, S.P.; Kane, A.A.; Collinsworth, A.L.; Sweeney, J.A.; Mosconi, M.W. Postural orientation and equilibrium processes associated with increased postural sway in autism spectrum disorder (ASD). J. Neurodev. Disord. 2016, 8, 43. [Google Scholar] [CrossRef] [Green Version]
- Lord, S.R.; Menz, H.B.; Tiedemann, A. A physiological profile approach to falls risk assessment and prevention. Phys. Ther. 2003, 83, 237–252. [Google Scholar] [CrossRef]
- Phirom, K.; Kamnardsiri, T.; Sungkarat, S. Beneficial Effects of Interactive Physical-Cognitive Game-Based Training on Fall Risk and Cognitive Performance of Older Adults. Int. J. Environ. Res. Public Health 2020, 17, 6079. [Google Scholar] [CrossRef]
- Gunn, H.; Cameron, M.; Hoang, P.; Lord, S.; Shaw, S.; Freeman, J. Relationship Between Physiological and Perceived Fall Risk in People With Multiple Sclerosis: Implications for Assessment and Management. Arch. Phys. Med. Rehabil. 2018, 99, 2022–2029. [Google Scholar] [CrossRef] [PubMed]
- Lord, S.R.; Delbaere, K.; Gandevia, S.C. Use of a physiological profile to document motor impairment in ageing and in clinical groups. J. Physiol. 2016, 594, 4513–4523. [Google Scholar] [CrossRef] [PubMed] [Green Version]
- Hoang, P.D.; Baysan, M.; Gunn, H.; Cameron, M.; Freeman, J.; Nitz, J.; Low Choy, N.L.; Lord, S.R. Fall risk in people with MS: A Physiological Profile Assessment study. Mult. Scler. J. Exp. Transl. Clin. 2016, 2. [Google Scholar] [CrossRef] [PubMed] [Green Version]
- Rosa, N.M.; Queiroz, B.Z.; Lopes, R.A.; Sampaio, N.R.; Pereira, D.S.; Pereira, L.S. Risk of falls in Brazilian elders with and without low back pain assessed using the Physiological Profile Assessment: BACE study. Braz. J. Phys. Ther. 2016, 20, 502–509. [Google Scholar] [CrossRef] [Green Version]
- Piscitelli, D.; Pellicciari, L. Responsiveness: Is it time to move beyond ordinal scores and approach interval measurements? Clin. Rehabil. 2018, 32, 1426–1427. [Google Scholar] [CrossRef]
- Valagussa, G.; Trentin, L.; Terragni, E.; Cerri, C.; Gariboldi, V.; Perin, C.; Mauri, D.; Grossi, E. 164.188 Postural Control Assessment in Autism Using the Pediatric Balance Scale and the Fall Screen Assessment System: Results from a Pilot Study. In Proceedings of the International Meeting for Autism Research—IMFAR San Francisco, San Francisco, CA, USA, 10 May 2010. [Google Scholar]
- Lord, C.; Rutter, M.; DiLavore, P.C.; Risi, S.; Gotham, K.; Bishop, S.L.; Schedule, A.A.D.O. ADOS-2. In Manual (Part I): Modules 1-4; Western Psychological Services: Torrance, CA, USA, 2012. [Google Scholar]
- World Health Organization. WHO Child Growth Standards: Length/Height-for-Age, Weight-for-Age, Weight-for-Length, Weight-for-Height and Body Mass Index-For-Age: Methods and Development; World Health Organization: Geneva, Switzerland, 2006. [Google Scholar]
- Mergner, T. A neurological view on reactive human stance control. Annu. Rev. Control 2010, 34, 177–198. [Google Scholar] [CrossRef]
- Chan-Viquez, D.; Hasanbarani, F.; Zhang, L.; Anaby, D.; Turpin, N.A.; Lamontagne, A.; Feldman, A.G.; Levin, M.F. Development of vertical and forward jumping skills in typically developing children in the context of referent control of motor actions. Dev. Psychobiol. 2020, 62, 1–12. [Google Scholar] [CrossRef]
- Assaiante, C. Development of locomotor balance control in healthy children. Neurosci. Biobehav. Rev. 1998, 22, 527–532. [Google Scholar] [CrossRef]
- Newschaffer, C.J.; Croen, L.A.; Daniels, J.; Giarelli, E.; Grether, J.K.; Levy, S.E.; Mandell, D.S.; Miller, L.A.; Pinto-Martin, J.; Reaven, J.; et al. The epidemiology of autism spectrum disorders. Annu. Rev. Public Health 2007, 28, 235–258. [Google Scholar] [CrossRef] [Green Version]
- Bakroon, A.; Lakshminarayanan, V. Visual function in autism spectrum disorders: A critical review. Clin. Exp. Optom. 2016, 99, 297–308. [Google Scholar] [CrossRef] [Green Version]
- Bach, M.; Dakin, S.C. Regarding “Eagle-eyed visual acuity: An experimental investigation of enhanced perception in autism”. Biol. Psychiatry 2009, 66, e19–e20. [Google Scholar] [CrossRef] [PubMed]
- Dakin, S.; Frith, U. Vagaries of visual perception in autism. Neuron 2005, 48, 497–507. [Google Scholar] [CrossRef] [Green Version]
- Joseph, R.M.; Keehn, B.; Connolly, C.; Wolfe, J.M.; Horowitz, T.S. Why is visual search superior in autism spectrum disorder? Dev. Sci. 2009, 12, 1083–1096. [Google Scholar] [CrossRef] [PubMed]
- Simmons, D.R.; Robertson, A.E.; McKay, L.S.; Toal, E.; McAleer, P.; Pollick, F.E. Vision in autism spectrum disorders. Vis. Res. 2009, 49, 2705–2739. [Google Scholar] [CrossRef] [PubMed] [Green Version]
- Robertson, C.E.; Kravitz, D.J.; Freyberg, J.; Baron-Cohen, S.; Baker, C.I. Tunnel vision: Sharper gradient of spatial attention in autism. J. Neurosci. 2013, 33, 6776–6781. [Google Scholar] [CrossRef] [PubMed] [Green Version]
- Puts, N.A.; Wodka, E.L.; Tommerdahl, M.; Mostofsky, S.H.; Edden, R.A. Impaired tactile processing in children with autism spectrum disorder. J. Neurophysiol. 2014, 111, 1803–1811. [Google Scholar] [CrossRef] [PubMed]
- Tavassoli, T.; Bellesheim, K.; Tommerdahl, M.; Holden, J.M.; Kolevzon, A.; Buxbaum, J.D. Altered tactile processing in children with autism spectrum disorder. Autism Res. 2016, 9, 616–620. [Google Scholar] [CrossRef] [PubMed]
- Mikkelsen, M.; Wodka, E.L.; Mostofsky, S.H.; Puts, N.A.J. Autism spectrum disorder in the scope of tactile processing. Dev. Cogn. Neurosci. 2018, 29, 140–150. [Google Scholar] [CrossRef] [PubMed]
- Riquelme, I.; Hatem, S.M.; Montoya, P. Abnormal Pressure Pain, Touch Sensitivity, Proprioception, and Manual Dexterity in Children with Autism Spectrum Disorders. Neural Plast. 2016, 2016, 1723401. [Google Scholar] [CrossRef] [Green Version]
- Blanche, E.I.; Reinoso, G.; Chang, M.C.; Bodison, S. Proprioceptive processing difficulties among children with autism spectrum disorders and developmental disabilities. Am. J. Occup. Ther. 2012, 66, 621–624. [Google Scholar] [CrossRef] [Green Version]
- Fuentes, C.T.; Mostofsky, S.H.; Bastian, A.J. No proprioceptive deficits in autism despite movement-related sensory and execution impairments. J. Autism Dev. Disord. 2011, 41, 1352–1361. [Google Scholar] [CrossRef] [PubMed]
- Schmitz, N.; Daly, E.; Murphy, D. Frontal anatomy and reaction time in Autism. Neurosci. Lett. 2007, 412, 12–17. [Google Scholar] [CrossRef] [PubMed]
- Karalunas, S.L.; Geurts, H.M.; Konrad, K.; Bender, S.; Nigg, J.T. Annual research review: Reaction time variability in ADHD and autism spectrum disorders: Measurement and mechanisms of a proposed trans-diagnostic phenotype. J. Child Psychol. Psychiatry 2014, 55, 685–710. [Google Scholar] [CrossRef] [PubMed] [Green Version]
- Truedsson, E.; Bohlin, G.; Wahlstedt, C. The Specificity and Independent Contribution of Inhibition, Working Memory, and Reaction Time Variability in Relation to Symptoms of ADHD and ASD. J. Atten. Disord. 2020, 24, 1266–1275. [Google Scholar] [CrossRef] [PubMed]
- Tye, C.; Johnson, K.A.; Kelly, S.P.; Asherson, P.; Kuntsi, J.; Ashwood, K.L.; Azadi, B.; Bolton, P.; McLoughlin, G. Response time variability under slow and fast-incentive conditions in children with ASD, ADHD and ASD+ADHD. J. Child Psychol. Psychiatry 2016, 57, 1414–1423. [Google Scholar] [CrossRef] [Green Version]
- Eggleston, J.D.; Harry, J.R.; Hickman, R.A.; Dufek, J.S. Analysis of gait symmetry during over-ground walking in children with autism spectrum disorder. Gait Posture 2017, 55, 162–166. [Google Scholar] [CrossRef]
- Kern, J.K.; Geier, D.A.; Adams, J.B.; Troutman, M.R.; Davis, G.; King, P.G.; Young, J.L.; Geier, M.R. Autism severity and muscle strength: A correlation analysis. Res. Autism Spectr. Disord. 2011, 5, 1011–1015. [Google Scholar] [CrossRef]
- Doumas, M.; McKenna, R.; Murphy, B. Postural Control Deficits in Autism Spectrum Disorder: The Role of Sensory Integration. J. Autism Dev. Disord. 2016, 46, 853–861. [Google Scholar] [CrossRef] [Green Version]
- Molloy, C.A.; Dietrich, K.N.; Bhattacharya, A. Postural stability in children with autism spectrum disorder. J. Autism Dev. Disord. 2003, 33, 643–652. [Google Scholar] [CrossRef]
- Graham, S.A.; Abbott, A.E.; Nair, A.; Lincoln, A.J.; Muller, R.A.; Goble, D.J. The Influence of Task Difficulty and Participant Age on Balance Control in ASD. J. Autism Dev. Disord. 2015, 45, 1419–1427. [Google Scholar] [CrossRef]
- Stins, J.F.; Emck, C. Balance Performance in Autism: A Brief Overview. Front. Psychol. 2018, 9, 901. [Google Scholar] [CrossRef] [PubMed] [Green Version]
- Travers, B.G.; Mason, A.; Gruben, K.G.; Dean, D.C., 3rd; McLaughlin, K. Standing Balance on Unsteady Surfaces in Children on the Autism Spectrum: The Effects of IQ. Res. Autism Spectr. Disord. 2018, 51, 9–17. [Google Scholar] [CrossRef] [PubMed]
- Taylor, S.; McLean, B.; Falkmer, T.; Carey, L.; Girdler, S.; Elliott, C.; Blair, E. Does somatosensation change with age in children and adolescents? A systematic review. Child Care Health Dev. 2016, 42, 809–824. [Google Scholar] [CrossRef]
- Leat, S.J.; Yadav, N.K.; Irving, E.L. Development of visual acuity and contrast sensitivity in children. J. Optom. 2009, 2, 19–26. [Google Scholar] [CrossRef] [Green Version]
- Kail, R. Processing time decreases globally at an exponential rate during childhood and adolescence. J. Exp. Child Psychol. 1993, 56, 254–265. [Google Scholar] [CrossRef] [PubMed]
- Goble, D.J.; Lewis, C.A.; Hurvitz, E.A.; Brown, S.H. Development of upper limb proprioceptive accuracy in children and adolescents. Hum. Mov. Sci. 2005, 24, 155–170. [Google Scholar] [CrossRef] [PubMed]
- Holst-Wolf, J.M.; Yeh, I.L.; Konczak, J. Development of Proprioceptive Acuity in Typically Developing Children: Normative Data on Forearm Position Sense. Front. Hum. Neurosci. 2016, 10, 436. [Google Scholar] [CrossRef] [PubMed] [Green Version]


| ID | Age (yrs) | Sex | Intellectual Disability † | ASD Severity Level † | ADOS CSS |
|---|---|---|---|---|---|
| 1 | 6 | F | mild | 1 | 4 |
| 2 | 6 | F | mild | 1 | 4 |
| 3 | 8 | M | mild | 1 | 8 |
| 4 | 8 | M | mild | 1 | 7 |
| 5 | 8 | M | moderate | 2 | 6 |
| 6 | 11 | M | moderate | 2 | 8 |
| 7 | 11 | M | moderate | 2 | 7 |
| 8 | 12 | M | moderate | 1 | 5 |
| 9 | 12 | M | moderate | 2 | 7 |
| 10 | 13 | M | moderate | 1 | 4 |
| 11 | 14 | M | moderate | 1 | 4 |
| 12 | 14 | M | mild | 1 | 6 |
| 13 | 14 | M | moderate | 2 | 6 |
| 14 | 14 | M | moderate | 2 | 6 |
| 15 | 16 | M | moderate | 2 | 7 |
| 16 | 16 | M | severe | 3 | 8 |
| 17 | 16 | M | severe | 2 | 7 |
| 18 | 18 | M | moderate | 2 | 6 |
| ASD | TD | |
|---|---|---|
| Rho Spearman | Rho Spearman | |
| Visual acuity high-contrast | −0.254 | −0.415 ** |
| Visual acuity low-contrast | −0.021 | −0.455 ** |
| Edge contrast sensitivity | 0.069 | 0.066 |
| Depth perception | 0.273 | −0.294 ** |
| Proprioception | −0.072 | −0.053 |
| Tactile sensitivity | 0.219 | 0.275 ** |
| Ankle dorsiflexion force | 0.338 | 0.677 ** |
| Knee extensor muscle force | 0.383 | 0.765 ** |
| Knee flexors muscle force | 0.361 | 0.883 ** |
| Reaction time: hand | 0.105 | −0.698 ** |
| Reaction time: foot | −0.058 | −0.770 ** |
| Sway floor eyes open | 0.320 | −0.040 |
| Sway floor eyes closed | 0.330 | −0.123 |
| Sway foam eyes open | 0.317 | −0.319 ** |
| Sway foam eyes closed | 0.140 | −0.218 * |
| Coordinated stability test | −0.565 * | −0.596 ** |
| Maximum balance range test | −0.298 | 0.288 ** |
© 2020 by the authors. Licensee MDPI, Basel, Switzerland. This article is an open access article distributed under the terms and conditions of the Creative Commons Attribution (CC BY) license (http://creativecommons.org/licenses/by/4.0/).
Share and Cite
Perin, C.; Valagussa, G.; Mazzucchelli, M.; Gariboldi, V.; Cerri, C.G.; Meroni, R.; Grossi, E.; Cornaggia, C.M.; Menant, J.; Piscitelli, D. Physiological Profile Assessment of Posture in Children and Adolescents with Autism Spectrum Disorder and Typically Developing Peers. Brain Sci. 2020, 10, 681. https://doi.org/10.3390/brainsci10100681
Perin C, Valagussa G, Mazzucchelli M, Gariboldi V, Cerri CG, Meroni R, Grossi E, Cornaggia CM, Menant J, Piscitelli D. Physiological Profile Assessment of Posture in Children and Adolescents with Autism Spectrum Disorder and Typically Developing Peers. Brain Sciences. 2020; 10(10):681. https://doi.org/10.3390/brainsci10100681
Chicago/Turabian StylePerin, Cecilia, Giulio Valagussa, Miryam Mazzucchelli, Valentina Gariboldi, Cesare Giuseppe Cerri, Roberto Meroni, Enzo Grossi, Cesare Maria Cornaggia, Jasmine Menant, and Daniele Piscitelli. 2020. "Physiological Profile Assessment of Posture in Children and Adolescents with Autism Spectrum Disorder and Typically Developing Peers" Brain Sciences 10, no. 10: 681. https://doi.org/10.3390/brainsci10100681