Early visually evoked electrophysiological responses over the human brain (P1, N170) show stable patterns of face-sensitivity from 4 years to adulthood
Unité Cognition et Développement and Laboratoire de Neurophysiologie, Université Catholique de Louvain, Louvain-la-Neuve, Belgium
Whether the development of face recognition abilities truly reflects changes in how faces, specifically, are perceived, or rather can be attributed to more general perceptual or cognitive development, is debated. Event-related potential (ERP) recordings on the scalp offer promise for this issue because they allow brain responses to complex visual stimuli to be relatively well isolated from other sensory, cognitive and motor processes. ERP studies in 5- to 16-year-old children report large age-related changes in amplitude, latency (decreases) and topographical distribution of the early visual components, the P1 and the occipito-temporal N170. To test the face specificity of these effects, we recorded high-density ERPs to pictures of faces, cars, and their phase-scrambled versions from 72 children between the ages of 4 and 17, and a group of adults. We found that none of the previously reported age-dependent changes in amplitude, latency or topography of the P1 or N170 were specific to faces. Most importantly, when we controlled for age-related variations of the P1, the N170 appeared remarkably similar in amplitude and topography across development, with much smaller age-related decreases in latencies than previously reported. At all ages the N170 showed equivalent face-sensitivity: it had the same topography and right hemisphere dominance, it was absent for meaningless (scrambled) stimuli, and larger and earlier for faces than cars. The data also illustrate the large amount of inter-individual and inter-trial variance in young children’s data, which causes the N170 to merge with a later component, the N250, in grand-averaged data. Based on our observations, we suggest that the previously reported “bi-fid” N170 of young children is in fact the N250. Overall, our data indicate that the electrophysiological markers of face-sensitive perceptual processes are present from 4 years of age and do not appear to change throughout development.
The ability to recognize faces is perhaps the most developed of all visual perceptual skills of the human adult brain (Bruce and Young, 1998
). Despite an astonishing level of proficiency in face recognition abilities already in the first days (e.g., Maurer and Young, 1983
; Johnson et al., 1991
; Pascalis et al., 1995
; Valenza et al., 1996
; Simion et al., 1998
), months (e.g., Fagan, 1972
; Maurer and Salapatek, 1976
; for reviews, Johnson, 1997
; Simion et al., 1998
) or years (e.g., Tanaka et al., 1998
; Sangrigoli and De Schonen, 2004
; McKone and Boyer, 2006
; de Heering et al., 2007
) of life, behavioral studies have indicated that children’s ability to recognize faces shows marked development well into adolescence (e.g., Carey and Diamond, 1977
, 1994
; Blaney and Winograd, 1978
; Ellis and Flin, 1990
; for reviews, see Carey, 1992
; Chung and Thomson, 1995
). Yet, surprisingly little is known regarding the functional developments underlying this improvement and their neural correlates (e.g., Gathers et al., 2004
; Golarai et al., 2007
; McKone et al., 2009
).
Children’s improvement on perceptual face discrimination tasks, such as same-different judgments, suggests more than just memory development (e.g., Carey and Diamond, 1980
; Mondloch et al., 2002
, 2004
). However, many functions, such as vernier acuity (Skoczenski and Norcia, 2002
), sustained attention (Betts et al., 2006
), the ability to narrow the focus of visual attention (Pastò and Burack, 1997
), and the ability to use deliberate task strategies (Bjorklund and Douglas, 1997
), to name a few, have been shown to improve across childhood and even into adolescence in some cases (see also Flavell, 1985
). Consequently, whether age-related improvement on face processing tasks is specific to our ability to perceive faces per se (Carey and Diamond, 1977
; Carey, 1992
), or rather a product of age-related improvements in general sensory or cognitive functions, or general visual pattern recognition (Want et al., 2003
; Crookes and McKone, 2009
) is still highly debated.
Event-related potentials (ERPs) recorded from the scalp are particularly promising for clarifying this issue, and for understanding the developmental course of human face processing in particular (de Haan and Nelson, 1999
; de Haan et al., 2003
; Taylor et al., 2004
) for at least two reasons. First, a behavioral response reflects the output of a large number of sensory, perceptual, cognitive and motor processes, so that variations in response time (RT) and accuracy are difficult to attribute to variations in a specific process (e.g., high-level perceptual processes) (Luck, 2005
). In contrast, the excellent temporal resolution of ERPs provides a continuous measure of processing between a stimulus and a response, making it possible to more precisely determine which stage(s) of processing undergo changes with development. Second, ERPs can be recorded non-invasively in experiments that do not require complex task instructions, allowing experimenters to test of a wide age range of participants with the same experimental paradigm.
Since the pioneering work of Jeffreys (1989)
on the vertex positive potential (VPP) elicited by faces, studies recording ERPs to pictures of faces in adults have focused on a sequence of wellcharacterized posterior components, most notably the P1 and the N170. The visual P1 (or P100) is an early occipital component, peaking at around 100 ms following stimulus onset in adults, which is thought to originate from striate and extrastriate visual areas (e.g. Clark et al., 1995
; Di Russo et al., 2002
). It is known to be sensitive to many low-level properties of visual stimuli and is perhaps the most documented visual evoked potential (see Regan, 1989
). It is usually the first visually observed component, although it is sometimes preceded by an early response to large stimuli (C1, Jeffreys and Axford, 1972
). The P1 is followed by a N1 component, termed the N170 when elicited by face stimuli. The N170 is a more prominent occipito-temporal negative component, named for its peak latency of approximately 170 ms (Bentin et al., 1996
). Typically showing a pronounced right-hemisphere lateralization, the N170 clearly and consistently shows the largest amplitude to faces at lateral occipito-temporal electrode sites (Figure 1
; e.g., Bötzel et al., 1995
; Bentin et al., 1996
; for a review of N170 face-sensitivity, see Rossion and Jacques, 2008
). Some studies have also reported face-sensitive effects at the level of the earlier P1 component (e.g., Eimer, 1998
, 2000
; Itier and Taylor, 2004a
), but these early effects are less consistent and appear to reflect low-level systematic differences between faces and other complex visual stimuli (Rossion and Jacques, 2008
). The N170 thus remains the main focus of interest within the adult face-processing literature.
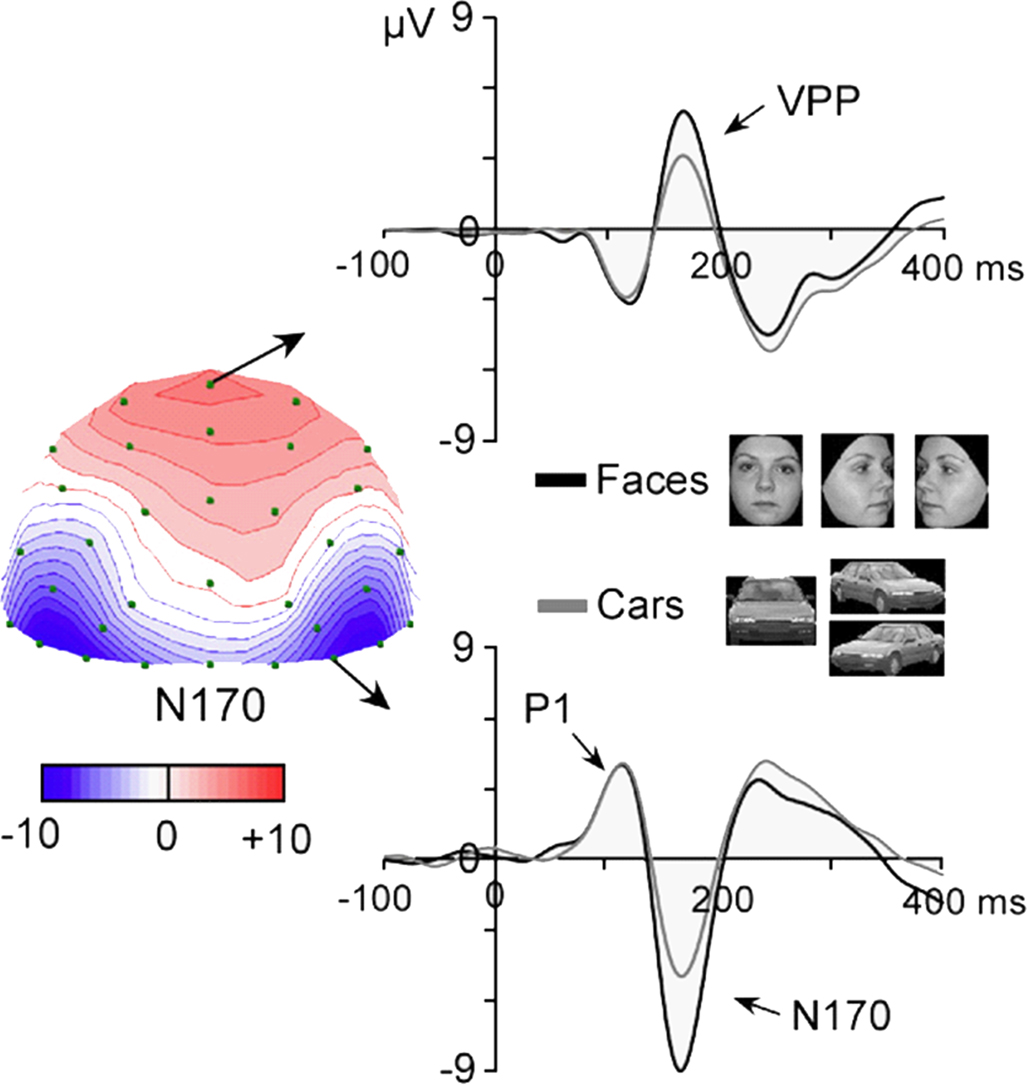
Figure 1. Adapted from Rossion and Jacques (2008)
. The N170 is a negative component recorded from posterior lateral electrode sites following the presentation of faces and object stimuli from various categories (here pictures of cars). It peaks at about 160–170 ms following stimulus onset and is recorded between 130 and 200 ms. It is most prominent at the lowest occipito-temporal electrode sites, usually maximal on channels P8(T6) or PO8, or lower channels in this area. The component is larger in response to faces than objects in both hemispheres, with usually a larger response in the right hemisphere. The N170 is associated with a temporally coincident positivity on the vertex (CZ), the vertex positive potential (VPP), which shows identical response properties and largely reflect the projection of the occipito-temporal dipolar sources to the vertex (see Joyce and Rossion, 2005
). The data presented are grand averages of 20 adult subjects presented with full-front and 3/4 profiles pictures averaged together.
To date, only a handful of ERP studies have investigated face processing in normal developing populations of children between the ages of 5 and 16 years. A meta analysis of four prominent studies (Taylor et al., 2001
; Itier and Taylor, 2004a
,b
; Batty and Taylor, 2006
) which recorded ERPs to faces in children described large decreases in P1 amplitude with age together with smaller, task dependent, decreases in the latency of the P1 across childhood (Taylor et al., 2004
). Important age-related changes in the amplitude, latency and scalp topography of the N170 were also reported. Specifically, latency of the N170 decreased with age, as much as 100 ms between 4–5 years and adulthood, with the steepest decrease occurring before 10–11 years. Amplitude of the N170, rather, was reported to have a “U” shaped developmental trajectory, being of least negative amplitude for children of 10–11 years. Children both older and younger than 10–11 years were reported to have larger (more negative) N170 amplitudes. Moreover, the topography of the N170 in children was marked by a dominant posterior positivity, rather than negativity, and adult-like topographical activity emerged starting in the mid-teenage years (Taylor et al., 2004
). It was also reported that the N170 was often bifid in young children, having both an early (N170a) and later (N170b) peak. In older children and adults, only a single N170 peak was observed.
The reported age-related changes in children’s raw ERPs to faces have been tentatively associated with developmental behavioral changes in the way children perceive faces. In particular, the developmental changes on the P1 have been associated with an increased ability to perceive faces holistically (Taylor et al., 2004
), i.e. as a global and integrated representation (Tanaka and Farah, 1993
; Rossion, 2008
, 2009
). Likewise, it was reported that in young children, the N170a and N170b were related to an increased reliance on holistic and configural processing strategies, respectively (Taylor et al., 2004
).
However, while previous ERP studies of face stimulation in childhood (see also Henderson et al., 2003
) indicate that visually evoked brain responses to faces change dramatically over the course of development, the magnitude of the changes reported by Taylor et al. (2004)
, in terms of latency and topography of the N170 in particular, is surprisingly large. Indeed, developmental studies with school age children looking at visually evoked ERPs to simple non-face stimuli have shown that both the amplitude and latency of P1 and N1 decrease across childhood (Buchsbaum et al., 1974
; Brecelj et al., 2002
), but the delay of latency compared to adult components is relatively small (10–20 ms), in particular for visual stimuli processed in the ventral stream (Coch et al., 2005
). In light of this evidence, the interpretations of Taylor et al. (2004)
should be subject to caution for several reasons. First, visual ERP parameters (latency, amplitude, topography) may undergo change throughout development and until adulthood due to age-related changes in any number of general factors that are unrelated to brain function (e.g., skin conductivity, skull thickness, head size, …) or to perceptual processes per se (e.g., EEG signal-to-noise ratio, attention, …). Second, even if these changes would reflect the development of perceptual processes, there has yet to be any direct evidence that they reflect face-specific perceptual processes rather than general improvements in visual pattern perception (Want et al., 2003
). In short, large age-related changes are observed for the amplitude, latency or topography of the P1 and N170 recorded to face stimuli, but the exact same age-related changes might also be observed for ERPs to non-face stimuli.
This issue is important because the face-specific perceptual development theory (Carey and Diamond, 1977
, 1980
; Carey, 1992
; Mondloch et al., 2002
) is based essentially on behavioral data, and argues that development of face recognition abilities results from specific, qualitative differences between children and adults’ face processing styles (but see Crookes and McKone, 2009
; McKone et al., 2009
). This theory assumes that we develop perceptual processes to utilize specifically for the identification and/or recognition of faces. These perceptual processes would not develop to the same extent, and therefore would not be as efficient, for the recognition of non-face visual objects.
With respect to supporting the face-specific perceptual development theory, previous developmental ERP studies of face processing appear to stop short in terms of control stimulation and analyses. Indeed, contrary to many studies performed with adults (e.g., Bötzel et al., 1995
; Bentin et al., 1996
; Rossion et al., 2000
) none of the existing studies of face perception in childhood have systematically compared ERPs recorded in response to faces with ERPs recorded in response to complex visual categories, or to simpler stimuli matched for low-level properties (e.g., in adults, Rousselet et al., 2007
). To our knowledge, only two previous developmental ERP studies presented non-face stimuli together with pictures of faces (Taylor et al., 1999
, 2001
). The first study used pictures of faces, cars and scrambled versions of these stimuli. However, the N170 in response to pictures of non-face stimuli was considered minimal and therefore not analyzed (Taylor et al., 1999
). Similarly, apart from describing a decrease of N170 latency to pictures of flowers (Taylor et al., 2001
), the second study did not focus on the specificity of these electrophysiological responses to faces.
Additionally, in terms of analyses, previous studies have compared ERP components directly across age groups without taking into account the potential confounds of such comparisons. For instance, amplitude of the P1 (or P100) may change substantially across development, even for very simple flashed or pattern reversal stimulation. For instance, Crognale (2002)
reported a P100 in response to chromatic and achromatic stimuli that increased in amplitude from infancy until about the age of 9 years, where it sometimes exceeded 50 μV. After 9 years, the P100 slowly decreased until adulthood, where it typically reached amplitudes of less than 10 μV. Thus, although changes in P1 amplitude in response to face stimuli have been interpreted as an increased refinement of the ability to process faces holistically (Taylor et al., 2004
), these changes may actually reflect only mere general developmental patterns that have nothing to do specifically with visual pattern perception, let alone face perception.
Furthermore, the general change in P1 amplitude over the course of development is highly problematic for the comparison of the N170 across age groups. Due to the temporal order of the visual evoked potentials, the amplitude of the P1 will inevitably influence the amplitude and topography of the subsequent components, including the N170. In fact, the report of Taylor et al. (2004)
that the N170 in children was marked by a dominant posterior positivity, could likely be explained by the large positivity of the P1 in the childhood years. Specifically, the first negative deflection following the P1, the N170, may not deflect below zero if the amplitude of the P1 is too large. A small P1, on the other hand, would ensure that any negative deflection would reach well below zero microvolt. Therefore, it seems important to take into account age-related variations of the preceding P1 activity to make direct comparisons of the N170 amplitude and topography across age groups.
In summary, while the seminal studies of Taylor, Itier and colleagues have provided a wealth of information concerning the electrophysiological markers of face processing and the development of these markers, the absence of systematic comparison between faces and nonface patterns, and the non-consideration of general P1 age-related differences when assessing modulations of the N170, when make it premature to assume that the large modifications in terms of amplitude, latency and brain topography of P1 and N170 responses to faces are face-specific, or even face-sensitive (i.e., larger to faces than other visual stimuli). Thus, it becomes apparent that any suggestions that developmental changes in ERP signal are related to the development of face specific perceptual processing (i.e. configural or holistic processing; Taylor et al., 2004
) were beyond the support of previously reported data and could be reconsidered.
The goal of the current study was to offer a stringent test of the face-specificity, or face-sensitivity, of the age-related changes of the two most commonly studies visual components in the face-processing literature, the P1 and the N170. To do that, we recorded ERPs from a higher density of channels than previous developmental studies of face processing (64 scalp electrodes as compared to ≈30 in Taylor et al., 2001
; Itier and Taylor, 2004a
,b
; Batty and Taylor, 2006
) from adults and children between the ages of 4 and 17 years, in response to faces and well-controlled visual stimuli, namely phase-scrambled faces. We also recorded ERPs to a familiar nonface object category (pictures of cars), to control for the effect of shape, and its scrambled counterpart. By recording ERPs to faces, cars and their respective scrambled counterparts, we aimed at isolating any face-specific responses, and characterizing their development over childhood and adolescence. Specifically, this paradigm allowed us to subtract the visual responses elicited by the phase scrambled stimuli from the visual responses recorded to faces and cars. This subtraction process serves to remove much of the response to faces and cars that could be attributed to low-level characteristics of the stimuli, leaving responses that were specific to the two stimulus categories. Furthermore, we focused on using methods of data reduction that would isolate, to the greatest extent possible, the N170 response from that of the preceding P1 in order to make reliable comparisons of the stimulus effects at the N170 across age groups.
Participants
Seventy-two child participants (36 females; age range 4–17 years old; 6 left-handed) and 11 adults (7 males, mean age 23, age range: 20–29, 1 left-handed) were included in the final sample (see Table 1
). ERP data from seven additional children were recorded but could not be used due to excessive artifacts contamination and low signal-to-noise ratio (SNR). All participants had normal or corrected vision. Written informed consent was obtained from each participant and/or one of their parents, and verbal consent was obtained from each participant prior to the experiment.
Stimuli
Two sets of 42 colored photographs of full front faces and cars were used (Figure 2
A). Faces were without glasses, facial hair or make-up, and posed a neutral expression. All pictures were trimmed to remove the background and, in the case of faces, the clothing and hairline. Two additional sets of stimuli were created by phase-scrambling the faces and the cars using a Fourier phase randomization procedure (Näsänen, 1999
) (Figure 2
A). The phase randomization procedure replaces the phase spectrum of the images with random values, keeping the amplitude spectrum of the image unaltered. It yields images that preserve global low-level properties of the original image (i.e., luminance, contrast, color distribution, spatial frequency spectrum) while entirely degrading shape information. Thus, the “scrambled” images used here are fundamentally different than the “scrambled” stimuli used by Taylor et al. (1999)
, which were made of original images divided into randomly organized squares. This latter manipulation disrupts shape as well, but introduces low-level differences (e.g. sharp edges) that may greatly influence early visual responses. Face and car stimuli were embedded in a light grey frame (lighter than the background) before the phase-randomization procedure so that these stimuli and their scrambled counterpart would stimulate an equal portion of the visual field. All stimuli of the present study subtended ∼3.15° × 4.30° of visual angle.
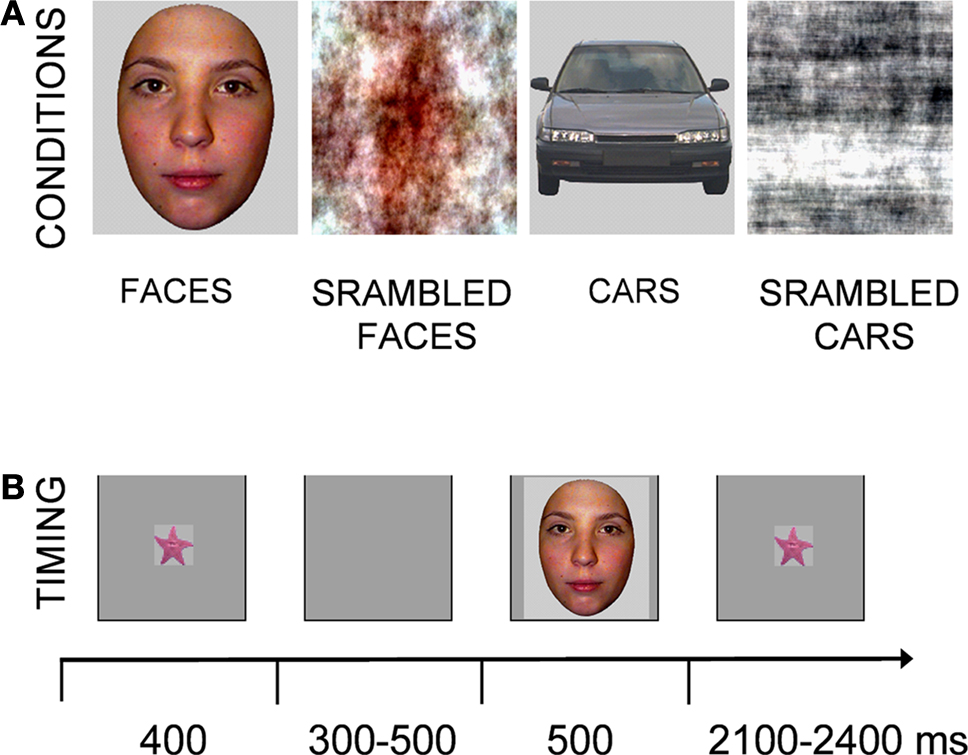
Figure 2. (A) Examples of stimuli used in this study, faces, phase-scrambled faces, cars and scrambled cars. (B) Timeline of the events during the recording of event-related potentials.
Procedure
After electrode-cap placement, subjects were seated at a viewing distance of 100 cm from a computer monitor. Stimuli were displayed on a grey background using E-prime 1.1. In each trial, a fixation point (a small starfish) appeared at the centre of the screen for 400 ms, followed approximately 400 ms (randomized between 300 and 500 ms) later by the presentation of the test stimulus for 500 ms. The offset of this stimulus was followed by an inter-trial interval of about 2250 ms (2100–2400 ms) (Figure 2
B). For the adult group, the timing values were slightly shorter (initial fixation 300 ms, delay 300 ms, stimulus 300 ms, intertrial interval between 1600 and 1800 ms), which was done to maintain participants’ attention during the task. Since this study’s interest was in the earliest responses to faces, before 300 ms, the shorter duration of visual stimulation in the adult group was not considered a potential problem for comparison of adult and child data. Participants were asked to judge whether each presented stimulus was an object (face or car) or a “texture” (scrambled versions), and gave their response by pressing either a left or a right keypad with their left or right hand. The hand associated with each response (object, texture) was counterbalanced across participants. Adults responded with two fingers of their dominant hand. Participants were instructed to fixate the centre of the screen for the duration of each block and to respond as quickly and accurately as possible. There were 84 trials per condition (42 stimuli in each set repeated two times each), broken in 14 blocks of 24 stimuli each. The order of conditions was randomized within each block. At the beginning of the experiment, all children completed a minimum of six training trials to ensure that they understood the task.
EEG recording
The EEG was recorded from 64 Ag/AgCl electrodes mounted in an electrode cap (Waveguard, ANT). Electrode positions included the standard 10–20 system locations and additional intermediate positions. Vertical and horizontal eye movements were monitored using four additional electrodes placed on the outer canthus of each eye and in the inferior and superior areas of the right orbit. During EEG recording, all electrodes were referenced to the left mastoid, and electrode impedances were kept below 10 kΩ. EEG was digitalized at a 1000 Hz sampling rate and a digital anti-aliasing filter of 0.27*sampling rate was applied at recording (at 1000 Hz sampling rate, the usable bandwidth is 0 to ∼270 Hz). After a 0.1 Hz high-pass and 30 Hz low-pass filtering of the EEG, trials contaminated with eye movements or other artifacts (≥ ± 80 μV) were marked and rejected. When there were too many blink artifacts (21 participants), a correction was applied using a principal component analyses method (Ille et al., 2002
). Incorrect trials and trials containing EEG artifacts were removed. The average number of trials remaining in each condition is reported separately for each age group in Table 1
. Due to a greater number of behavioral errors and artifacts in the EEG, slightly fewer trials were averaged for younger children (4–9 years old) than the older children (9–17 years old) and adults. Fewer trials may be a factor contributing to the lower SNR of the EEG for younger children compared to older children and adults. However, and most importantly, this was true for all four conditions, for which the average number of trials was almost identical in every group tested (Table 1
). If anything, this small general difference between groups could slightly enhance or reduce general age-related changes, for which we completely replicated previous observations, but not age-related differences between conditions, the main focus of the present study.
Participant averages were baseline corrected using the 200 ms pre-stimulus epoch and then re-referenced to a common average reference.
Electrophysiology
Following visual stimulation, we observed both the P1, which was largest on bilateral lateral occipital electrodes (O1/O2, or PO7/PO8) and peaked at around 100 ms for all age groups (see Figure 3
), and the following N170, which, in adults, had an occipito-temporal topography to faces and cars and peaked at about 150 ms, being maximal on lateral electrode sites (P7/P8), with a right hemisphere advantage (see Figure 4
).
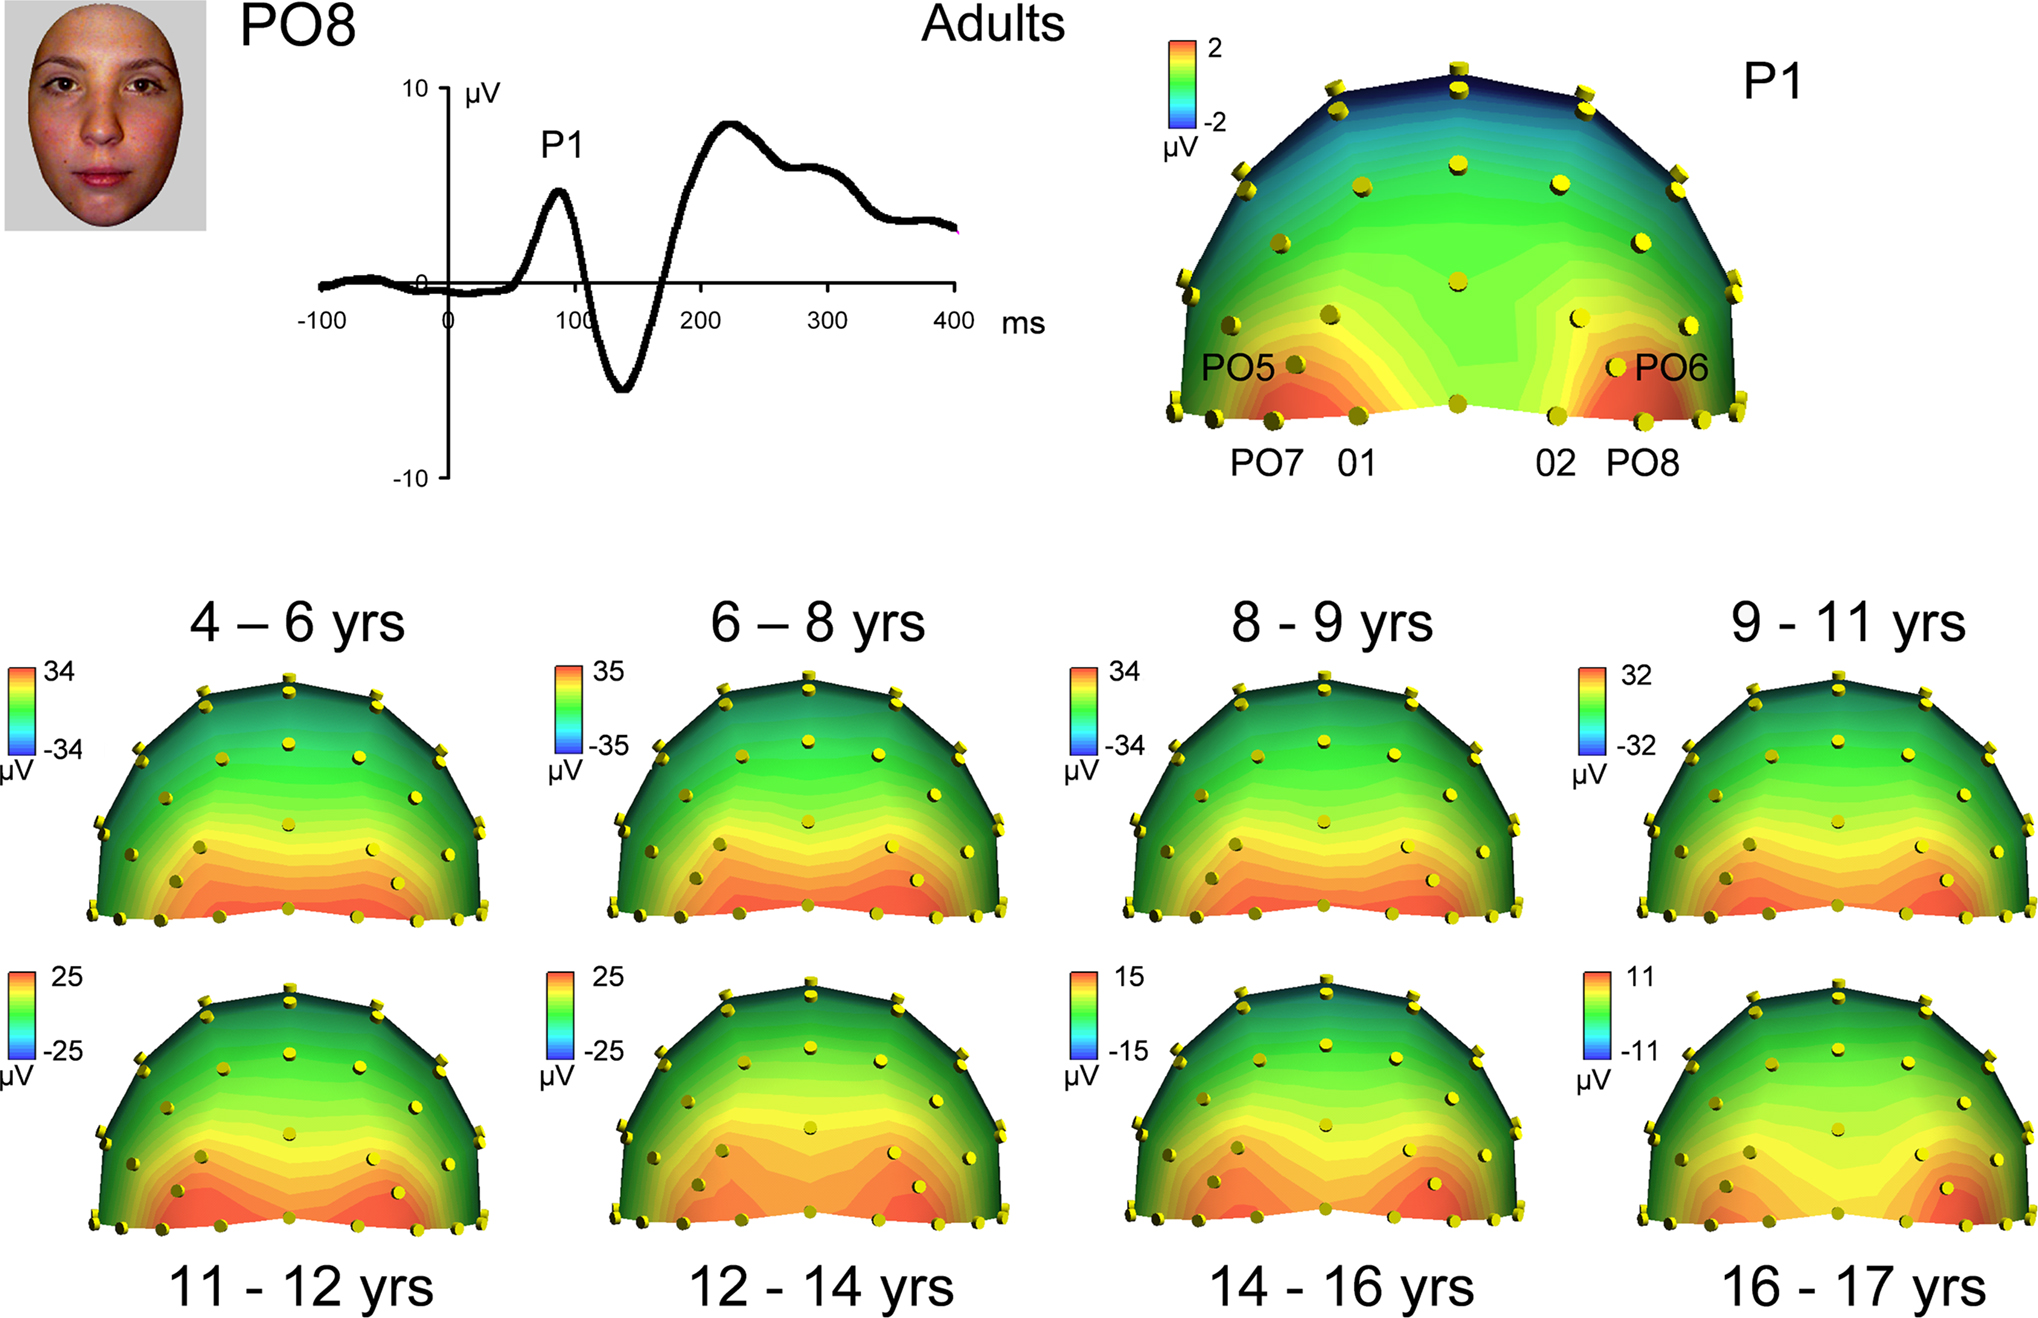
Figure 3. Scalp topographies at the peak of the visual P1 component in responses to faces in adults (top) and all age groups. Note the increasing separation of the lateral occipital sources generating the P1.This variation may be due to changes in head size across development. The topographic plots are snapshots of the P1 response at 90 ms for adults, and at the following latencies for the youngest to oldest age groups, respectively: 109, 108, 111, 104, 105, 108, 95 and 102 ms.
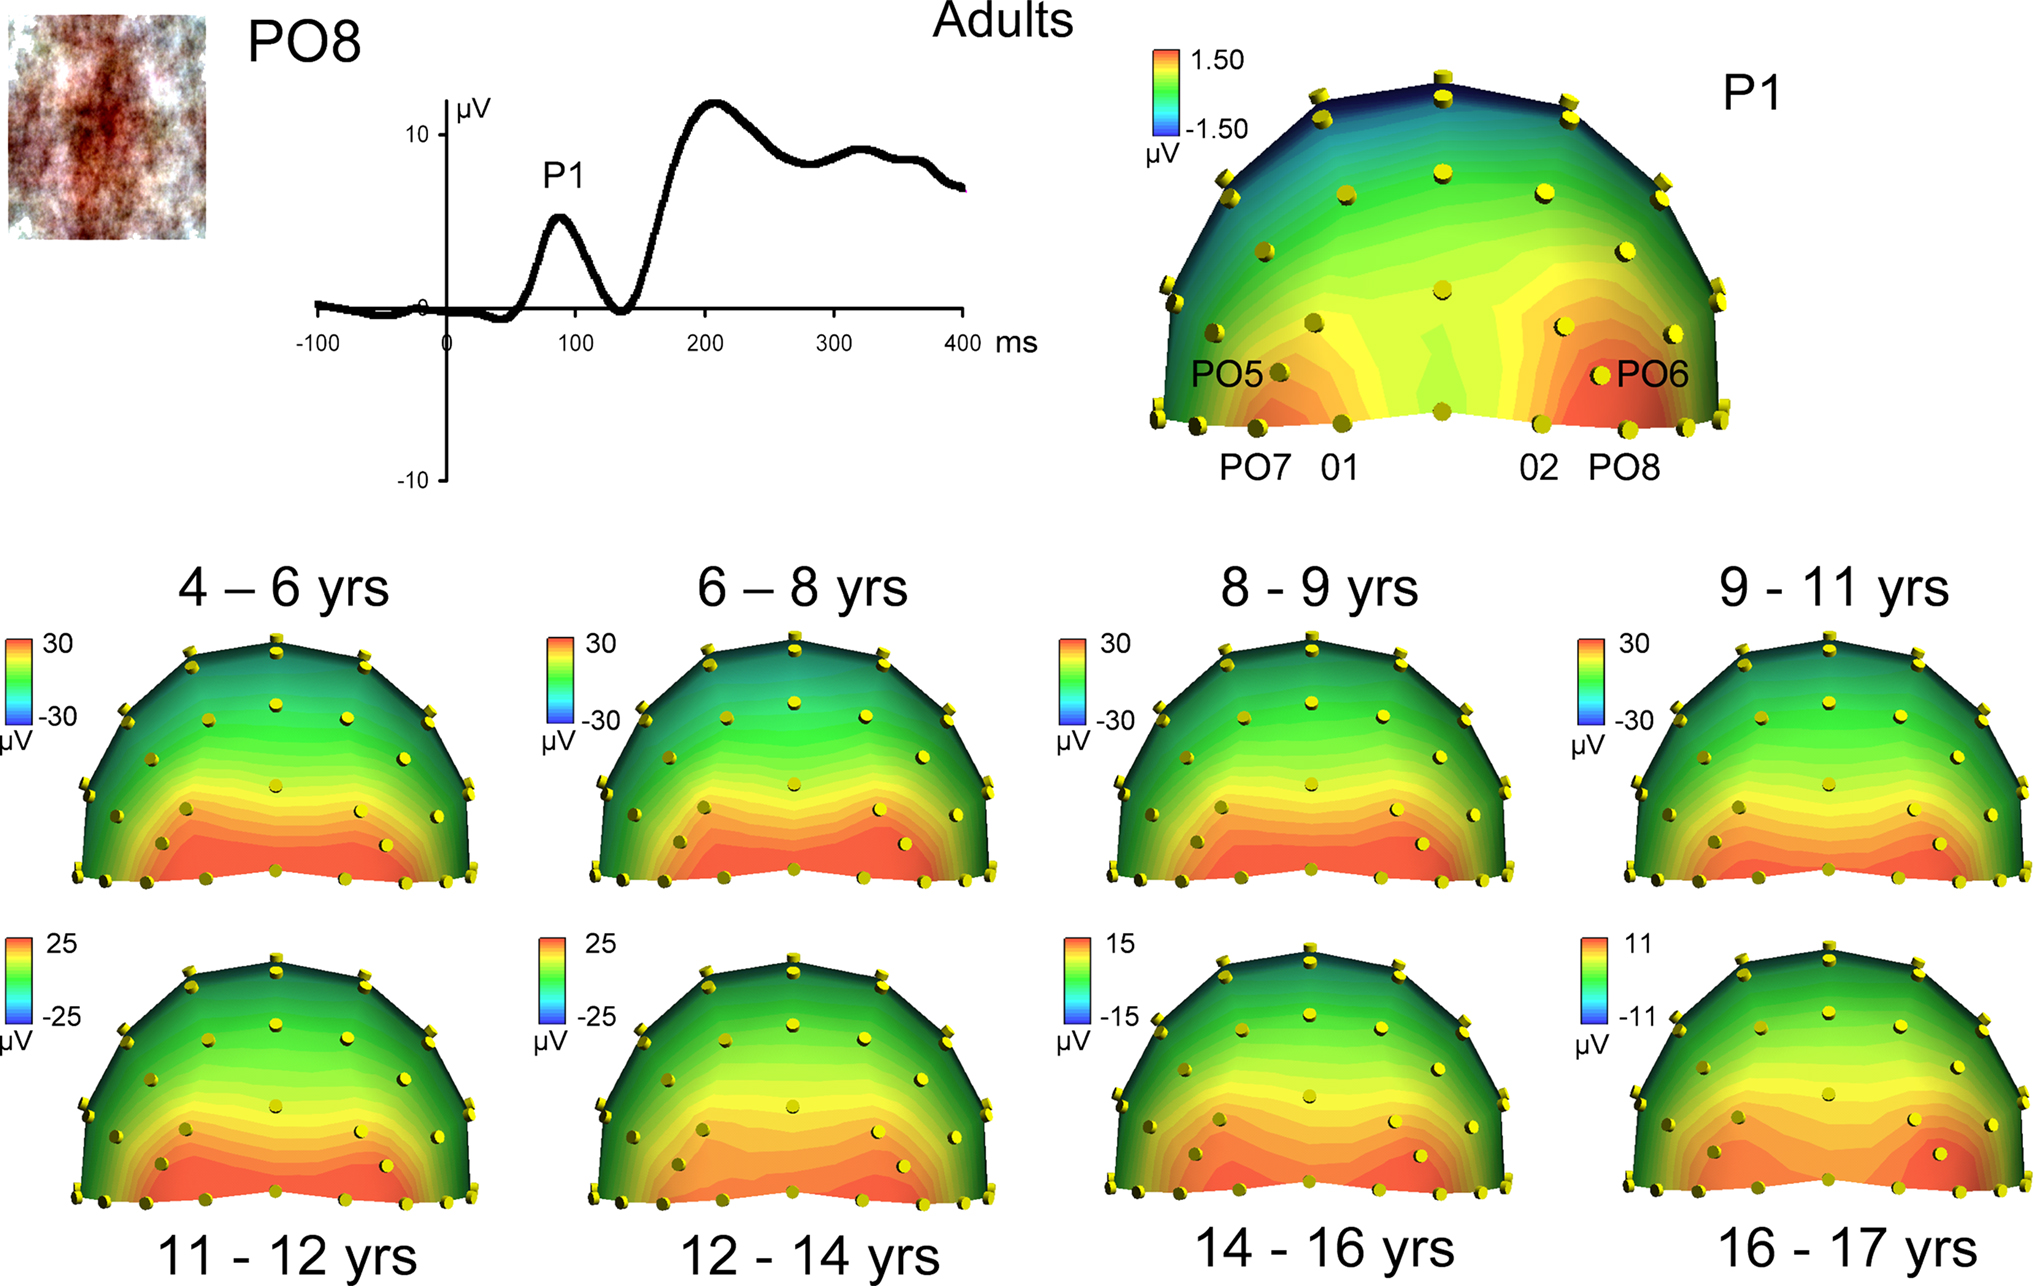
Figure 4. Scalp topographies at the peak of the visual P1 component in responses to scrambled faces in adults (top) and all age groups. Note the increasing separation of the lateral occipital sources generating the P1, and the general similarity with the changes observed for faces (Figure 3
). The topographic plots are snapshots of the P1 response at 100 ms for adults, and at the following latencies for the youngest to oldest age groups, respectively: 116, 113, 115, 111, 111, 109, 99 and 110 ms.
Amplitude values of these two components were measured at different pairs of occipito-temporal electrodes in the left and right hemisphere where they were the most prominent (for the P1: O1/2, PO5/6, PO7/8; for the N170: P7/8, PO7/8) (Figures 3 and 4
). Amplitude and latency of the P1 was quantified for each condition and each subject as the peak of the component. Given the large variance in component latency across subjects, the P1 peak was defined as the maximum voltage within a ∼50 ms window which was defined separately for each subject by visual inspection of the waveforms (e.g., between 80 and 130 ms in adults). The same temporal window was used for all conditions in each subject. While the P1 peak was quite easy to identify in all participants and conditions, the N170 amplitude and latency values were much more difficult to measure. In fact, the N170 was extremely small for the conditions in which scrambled pictures were presented, and peak measures were not reliable in individual participants. Therefore, we measured this component only for the face and car conditions. Moreover, due to the presence of a “bifid” N170 in the three youngest age groups, as previously reported (Taylor et al., 2004
), the identification of the N170 was ambiguous in the grand-averaged data. Importantly though, for a large majority of individual subjects, the first negative deflection following the P1 was clearly visible, and even when it was smaller in amplitude than the second deflection, we considered the N170 to be the first negative deflection following the P1 peak.
Statistical analyses comparing age groups were performed by dividing the child participants into nine age-groups of an equal number of nine participants (see Table 1
). All effects with two or more degrees of freedom were adjusted for violations of sphericity using the Greenhouse-Geisser correction when appropriate. Even though data were grouped for statistical analyses and for the sake of clarity, they were also displayed at the individual level in several illustrations.
Behavioral Results
Behavioral accuracy rates and RTs to correct responses in the face/car vs. scrambled stimuli classification were analyzed in an ANOVA with within-subject factors of Shape (non-scrambled, scramled) and Category (face, car) and the between subject factor of Age Group (nine levels). Analyses of Accuracy revealed a main effect of Category (F1,74 = 18.29, p < 0.001), due to higher (∼1.0%) accuracy for faces/scrambled faces than car/scrambled cars, as well as a significant interaction between Shape and Category (F1,74 = 10.07, p < 0.002) driven by the fact that accuracy was lower for cars than for the other three stimulus types, which did not differ in accuracy. There was also a main effect of Age Group (F1,74 = 5.75, p < 0.001), because accuracy for the youngest group (4–6 years) was significantly lower than for the older age groups, starting with the 3rd age group, (8–9 years), (86.4% vs. >96.1%). Accuracy did not differ between any other age groups. There were no interactions involving the factor Age Group.
Analyses of RTs revealed main effects of Category (F1,74 = 15.95, p < 0.001), due to faster RTs (∼10 ms) for faces/scrambled faces than car/scrambled cars, and Shape (F1,74 = 5.76, p < 0.019), due to faster RTs (∼12 ms) to the scrambled stimuli compared to the non-scrambled stimuli. These main effects were qualified by a significant interaction between the two factors (F1,74 = 6.04, p < 0.016) which was driven by an RT advantage for scrambled stimuli over non-scrambled stimuli which was much greater for the car category (∼18 ms) than the face category (∼5 ms) due to the slow RTs to the intact car stimuli. There was also a main effect of Age Group due to the general decrease in RTs with age, which stabilized, however, in the 11- to 12-year-old group. In short, the classification task – which was intended mainly to maintain heightened levels of attention to the stimuli throughout the experiment – was performed easily by participants of all age groups.
Event-Related Potentials
Visual component P1
Topographical distribution of components on the scalp. The first consistent brain response to visual stimulation that can be observed on the human scalp, the P1, was observed in all participants for all conditions. Visual inspection of the data showed that the topography of the P1 in response to faces appeared to change across development. Specifically, in young children, P1 activity was widespread across occipital electrodes, showing the strongest activation at electrodes O1 and O2 (Figure 3
). However, from visual inspection, it is apparent that by about 14–15 years of age, the P1 shows more focused, lateral activation as the maximum focus of P1 activity shifts away from O1 and O2, and moves to lateral electrodes PO7 and PO8 (Figure 3
). Importantly, this increased lateralization with age was found for each of the other conditions (cars, scrambled faces and scrambled cars, Figure 4 and Figures S1 and S2 in Supplementary Material).
To provide more substance to these observations, we computed a Pearson correlation between the P1 to faces and each of the other three conditions, separately for each age group (3 correlations × 9 age groups; correlation based on 64 electrode amplitude values at the peak of the component). All of the correlation coefficients were highly significant, ranging from 0.95 to 0.99. This result indicates that the scalp topography, i.e. the distribution of electrophysiological responses on the scalp, at the time of the P1, was virtually identical for faces and nonface stimuli in every age group. Moreover, the topography of the P1 for faces in adults (and therefore for all c onditions) was highly correlated with the topography of the P1 of each age group (8 correlation values ranging from 0.87 to 0.92).
Latency. Visual inspection of the data revealed moderate decreases in P1 latency with age, with the most significant decrease apparent between 9 and 12 years. On average the P1 peaks at about 114 ms in the youngest age group, and 90 ms in adults (Figure 5
). This was true for scrambled faces also (Figure 5
B) as well as for pictures of cars and scrambled cars (Figures S3 and S4 in Supplementary Material). The decrease in latency was fairly linear in all four conditions.
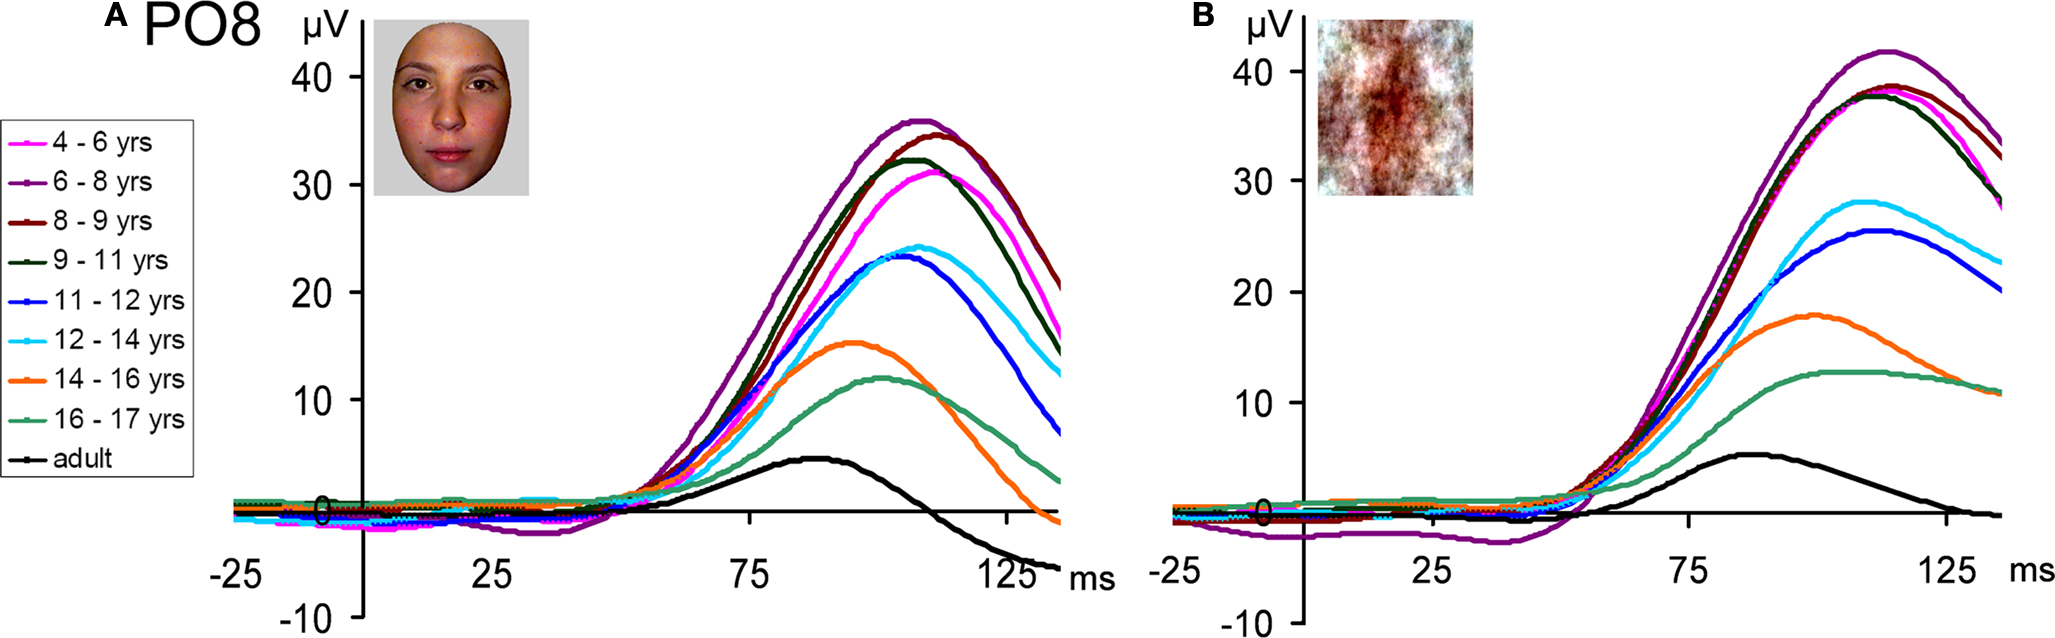
Figure 5. The P1 recorded from PO8 (right lateral occipital site) for the 8 age groups and adults, illustrating the large changes in latency (linear decrease) and amplitude (overall decrease). (A) In response to faces. (B) In response to scrambled faces. Note the larger amplitude to scrambled faces, and the overall similarity of developmental changes for faces and scrambled faces. A 30-Hz low-pass filter has been applied to each waveform in this figure.
Statistical analyses largely confirmed these observations on P1 latency. An ANOVA with four within-subject factors, (Electrode (O1/2, PO5/6, PO7/8), Hemisphere (right, left), Shape (non-scrambled, scrambled), Category (faces, cars) and one between subject factor, Age Group (9 levels) showed main effects of Category (F1,74 = 13.16, p < 0.001), due to slightly faster (∼1.7 ms) response to faces/scrambled faces than car/scrambled cars, and of Hemisphere (∼2 ms faster in the right than the left hemisphere; F1,74 = 4.95, p < 0.029). Additionally, the overall decrease in latency was confirmed by a main effect of Age Group (F1,148 = 9.50, p < 0.001).
There were two-way significant interactions between Category and Shape (F1,74 = 7.13, p < 0.009) resulting from faster response to faces than all other three visual stimuli (∼2.3 ms); Shape and Electrode (F1,148 = 4.78, p < 0.009, faster at O1/O2 for non-scrambled stimuli but not for scrambled stimuli); and Hemisphere and Electrode (F1,148 = 5.80, p < 0.01) due to faster (∼3 ms) responses in the right vs. left hemisphere but only on more lateral channels (PO8 vs. PO7, but not vs. PO6 vs. PO5).
The only significant interaction involving Age Group was a triple interaction between Shape, Electrode and Age Group (F1,148 = 2.23, p < 0.016) (all other p-values >0.08). This was found because responses were faster to meaningful stimuli in the first six age groups on O1/O2, but not in the last three age groups. Most importantly, Category, and Shape did not interact with Age Group (p = 0.78), and these three factors did not interact with Hemisphere (p = 0.77), or Electrode (p = 0.79). The five way interaction between these factors was also non-significant (p = 0.51). This indicates that the P1 latency did not show a specific developmental course for faces: it decreased substantially between 4 years old and adulthood (∼20 ms), but equally so for faces, cars and their scrambled counterparts (Figure 5
; Figure S4 in Supplementary Material).
Amplitude. Visual inspection of the P1 amplitude in response to faces revealed dramatic changes with age, as indicated by the different scales on Figure 3 and the different age group waveforms on Figure 5
A. There was a general decrease in the amplitude of the P1 with age. The largest decreases are visible between the 9–11 year olds and 11–12 year olds, and again between the 12–14 year olds and the 16–17 year olds. The P1 amplitude decreased even further, until adulthood. Importantly, this pattern of amplitude decrease was also found for scrambled faces (Figure 6
), and the nonface conditions (Figure S5 in Supplementary Material). The P1 also appeared slightly larger in response to scrambled faces than faces in all age groups (Figure 6
), but roughly equal for faces and cars (Figure S6 in Supplementary Material).
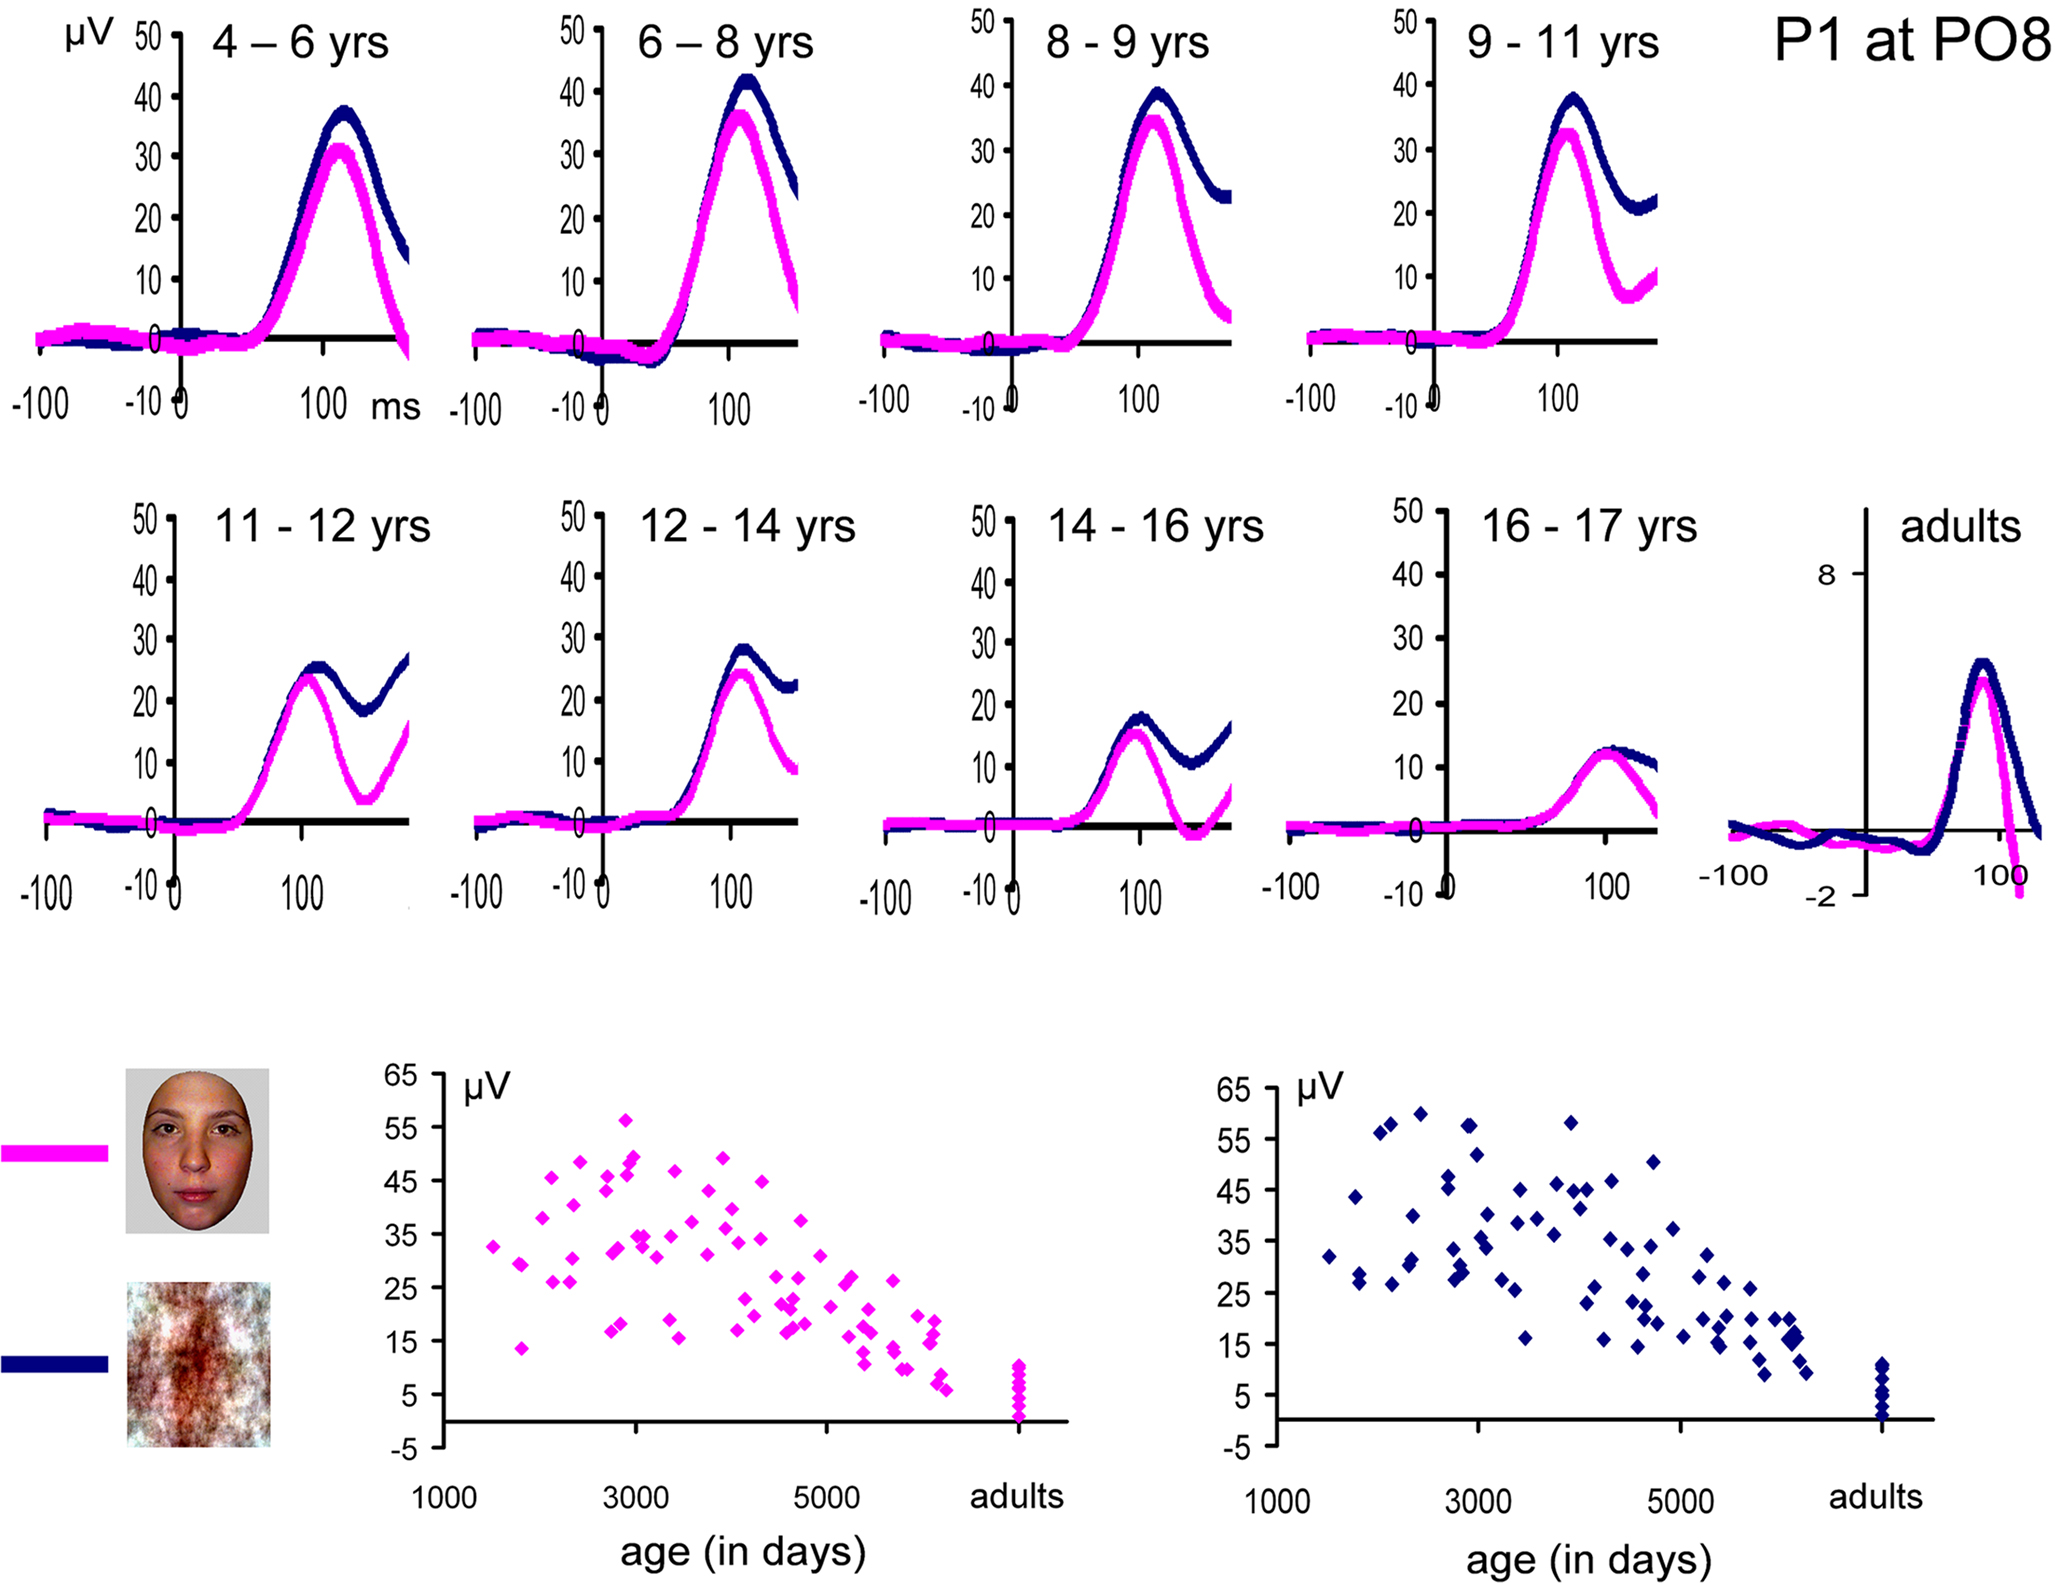
Figure 6. The P1 recorded from PO8 (right lateral occipital site) for the 8 age groups and adults, illustrating the larger response to scrambled faces as compared to faces, which remained constant all along development. The waveforms above are based on grand-averaged data from nine subjects in each group, while the individual data of each participant in the study are shown below. Children’s data is plotted according to participant age in days at the time of test. Note the progressive decrease in amplitude with age, both for faces and scrambled faces, and the inter-individual variance in amplitude of the component. A 30-Hz low-pass filter has been applied to each waveform in this figure.
Statistical analyses largely confirmed these observations. An ANOVA with four within-subject factors [(Electrode (3), Hemisphere (2), Shape (2), Category (2)] and one between subject factor (Age Group, nine levels) showed main effects of Category (F1,74 = 22.64, p < 0.001), due to larger (∼1.0 μV) responses to faces/scrambled faces than car/scrambled cars, Shape (F1,74 = 42.19, p < 0.001) due to larger (∼2.1 μV) responses for the scrambled compared to the non-scrambled stimuli, Hemisphere (∼3 μV larger in the right than the left hemisphere; F1,74 = 20.51, p < 0.001), and electrode (amplitude 3–4 μV larger at O1/O2 and PO7/PO8 compared to PO5/PO6). Additionally, the overall decrease in amplitude with age was confirmed by a main effect of Age Group (F1,148 = 22.72, p < 0.001).
There were significant two-way interactions between Shape and Hemisphere (F1,74 = 14.36, p < 0.001) due to the amplitude advantage for scrambled stimuli being greater in the right (∼2.7 μV) vs. left hemisphere (∼1.5 μV); Hemisphere and Electrode (F1,148 = 18.69, p < 0.001) for larger (∼2.5–4.5 μV) responses in the right vs. left hemisphere but only on more lateral channels (PO8/PO6 vs. PO7/PO5); Category and Electrode (F1,148 = 34.18, p < 0.001) for larger responses to faces/scrambled faces than cars/scrambled cars only on more lateral channels (PO8/PO6 vs. PO7/PO5); and Shape and Electrode (F1,148 = 34.18, p < 0.001) for larger responses to scrambled faces than non-scrambled stimuli on all channels but more on the most lateral channels (PO8/P07).
There were two significant two-way interactions involving the factor Age Group. The first, Shape by Age Group (F1,74 = 3.95, p < 0.001), was due to scrambled stimuli having a greater amplitude advantage compared to non-scrambled stimuli only in the youngest age groups (Figure 6
; Figure S5 in Supplementary Material). However, as far as face stimuli were considered (Figure 6
), the larger P1 amplitude to scrambled images was of equal magnitude in all age groups when taking into account the percentages of increases (e.g., 5 μV increase in children who have a 50 μV P1 can be considered as equal as a 0.5 μV increase in adults having a 5 μV P1; Figure S7 in Supplementary Material). The second interaction, Electrode by Age Group, (F1,148 = 3.29, p < 0.001), was due to a smaller response at PO5/PO6, compared to the more medial electrodes, only in children under 12 years of age.
Finally, there was a significant triple interaction involving the factors Category, Shape, and Hemisphere (F1,74 = 4.37, p < 0.04), due to the fact that while in the left hemisphere the amplitude advantage for both faces and scrambled faces over cars and scrambled cars was of equal magnitude (∼1.0 μV), in the right hemisphere the advantage for scrambled faces over scrambled cars was greater (∼1.3 μV) than the advantage of intact faces over intact cars (∼0.4 μV). There were also two significant triple interactions involving the factor electrode: Category, Electrode, and Hemisphere (F1,74 = 7.2, p < 0.002), because the larger responses to faces/scrambled faces than cars/scrambled cars was not found in the right hemisphere for the occipital channels (O1/02); and Shape, Electrode, and Hemisphere (F1,74 = 7.2, p < 0.002), because the smaller responses to non-scrambled than scrambled stimuli was not as strong at occipital channels (O1/02).
Most importantly, there was no interaction between Category, Shape and Age Group (p = 0.853), or of these three factors with Hemisphere (p = 0.256), or Electrode (p = 0.43), or all five factors (five-way interaction, p = 0.22). This indicates that the P1 amplitude did not show a specific developmental course for faces.
In summary, there were large changes across development on the first visually evoked response to flashed photographs of faces over lateral and central posterior electrodes, the visual P1 evoked potential: it decreased linearly in latency with age, decreased (non-linearly) with age in amplitude, and its topography evolved from central-occipital to lateral-occipital or occipito-temporal channels. However, none of these latency, amplitude and topographical changes associated with development were specific to faces: these changes also took place for pictures of cars, and even for the meaningless visual control stimuli. Hence, development of the P1 response is not face-specific. Interestingly, there were some stable responses across age for the P1, such as its right lateralization, which is found even in the youngest age group. There were also some differences between categories and shape in P1 amplitude, such as the larger responses to scrambled stimuli over non-scrambled stimuli. However, once again, this effect was constant across age.
N170
At visual inspection, the N170 to faces, identified as the large negative deflection following the P1 at occipito-temporal sites, was observed to change dramatically across development (Figure 7
). These changes concern its scalp distribution (Figure 7
), amplitude (the largest in adults and in the youngest age group), and latency (decreasing with age) (Figure 8
). It also appears to change in width or frequency range, being particularly wide for the youngest age groups (Figure 8
). These observations are not novel and, as we will see below, largely replicate previous observations (Taylor et al., 2004
). However, the question of interest of the present study is whether these N170 modulations with age are face-specific, or rather reflect general developmental effects.
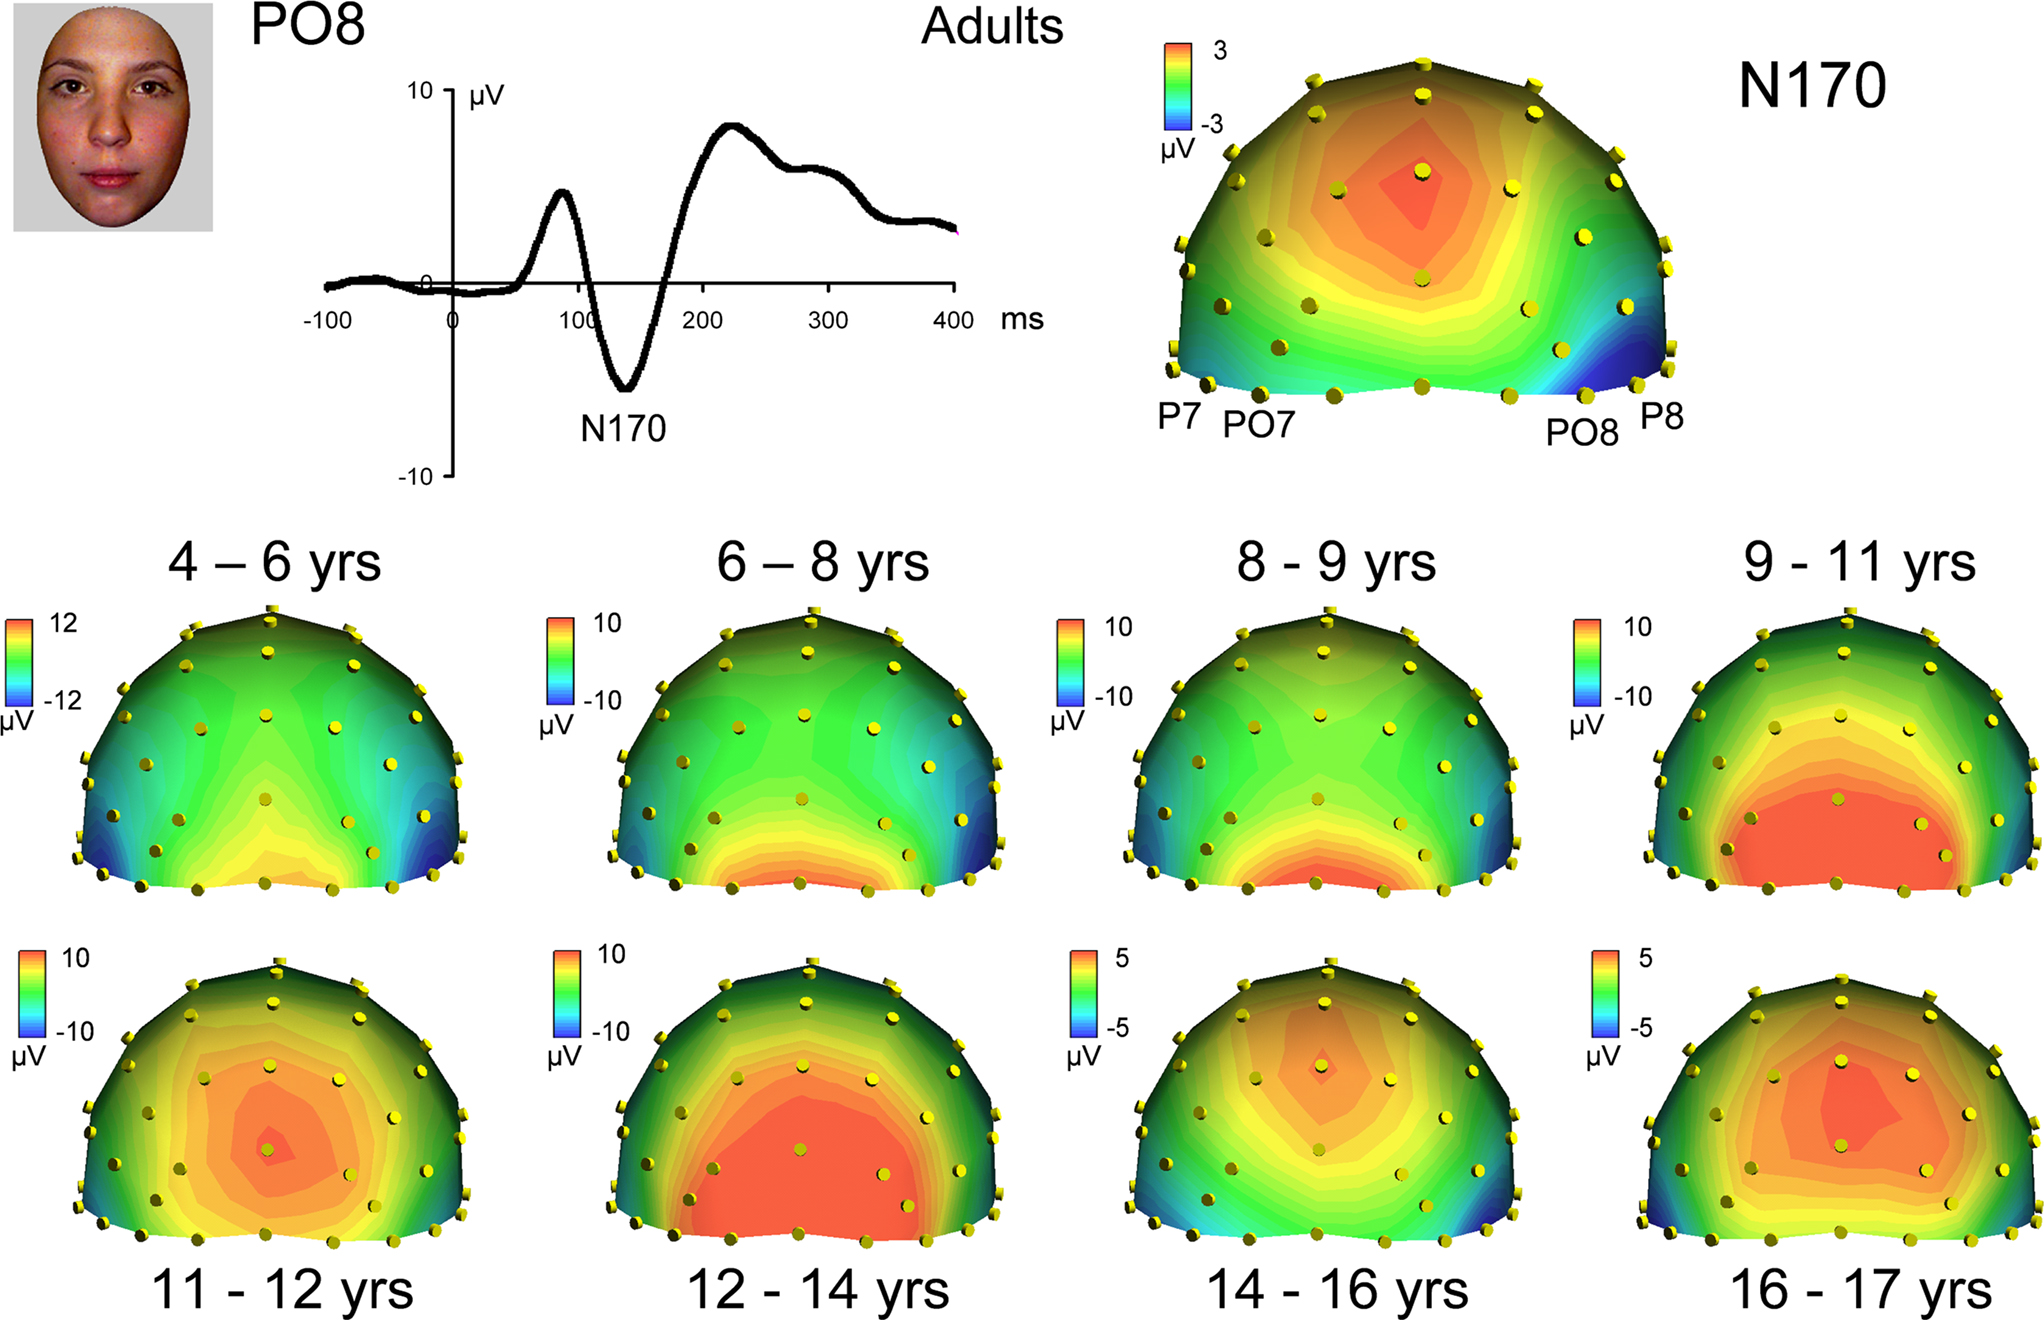
Figure 7. Scalp topographies at the peak of the visual face-sensitive N170 component in responses to faces in adults (top) and all age groups. Note the large variations in scalp distribution of the raw N170 component, which becomes adult-like at about 14–16 years old only. Right lateralization is clear only in adult data on this topography. The topographic plots are snapshots of the N170 response at 139 ms for adults, and at the following latencies for the youngest to oldest age groups, respectively: 166, 180, 185, 156, 150, 153, 143 and 148 ms.
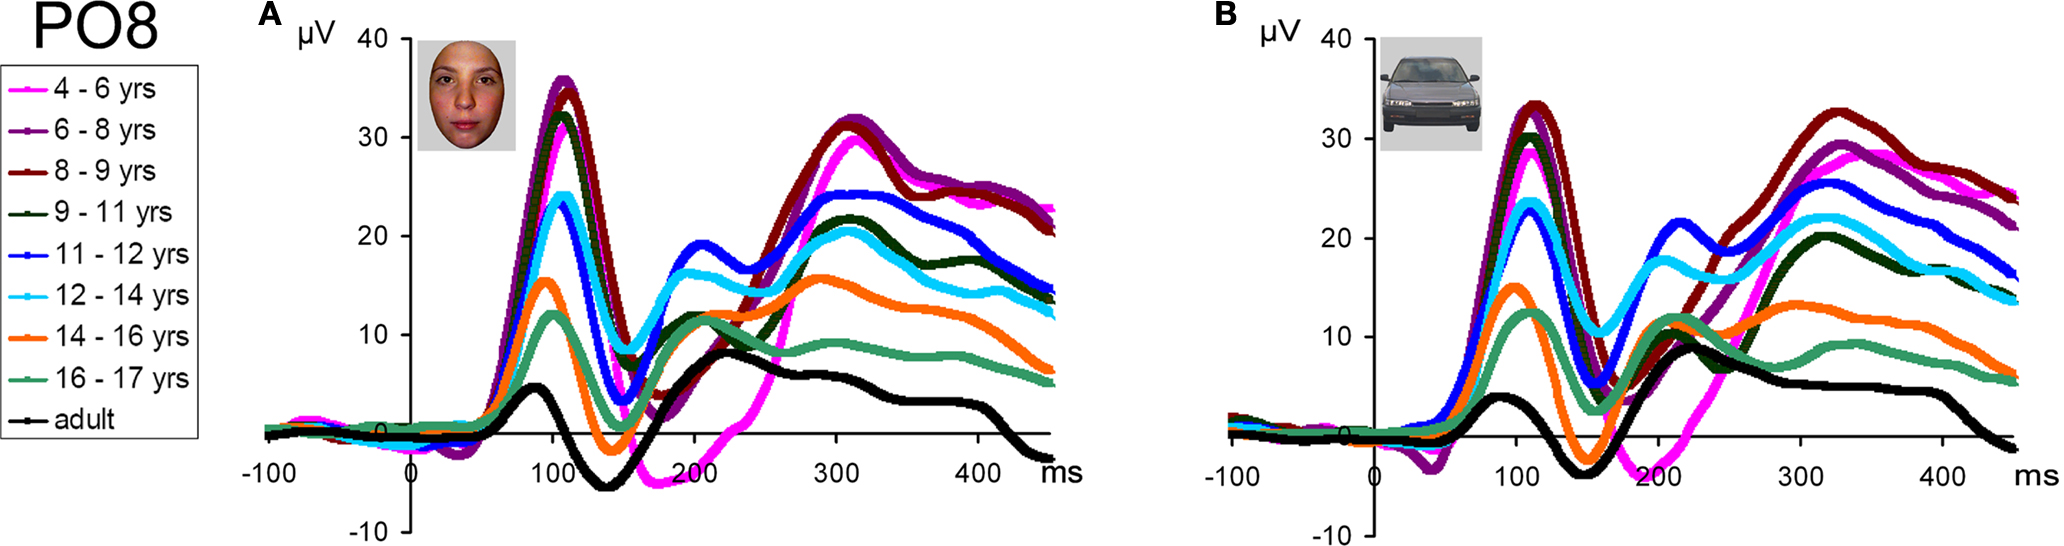
Figure 8. Grand-average waveform in response to (A) faces and (B) cars in all age groups and adults (in black) illustrating the dramatic differences of amplitude, latency and width of the N170 component. Note that, especially evident for the face stimuli, in the three youngest age groups the component is particularly wide due to the merging in grand-averaged data of the N170 with a late negative deflection. This phenomenon can be clearly observed on individual data (Figure 11
). A 30-Hz low-pass filter has been applied to each waveform in this figure.
As indicated in the introduction, there are a number of issues to consider when addressing this question, in particular we must take into account the variations that are common to all conditions of visual stimulation, as well as the variations in P1 parameters that can affect the N170 component differently across age groups. We approached our analyses of the N170 with an awareness of several potential problems. First, since there are large variations of P1 parameters across age, the raw measurements of the N170 parameters will be affected indirectly. For instance, the N170 does not cross the zero baseline in many children, due to the large P1, affecting the measure of absolute amplitude and topographies on the scalp (Figures 7 and 8
). However, the absolute amplitude of the negative deflection could be substantial in these children, and a complementary peak-to-peak measurement and analysis is warranted to characterize the developmental changes of the N170. Second, while the N170 was clearly visible in all children for the conditions where a meaningful shape (face or car) was presented, there was only a small negative deflection for scrambled stimuli at that latency (e.g., Figures S8 and S9 in Supplementary Material). Thus, the N170 was not measured for these conditions. Finally, due to the presence of a “bifid” N170 in the three youngest age groups, identification of the N170 was ambiguous in grand-averaged data. In the large majority of individual subjects however, the first deflection was visible, and even when it was smaller in amplitude than the second one, for consistency across age groups, we considered the N170 to be the first negative deflection following the P1.
Topographical distribution on the scalp. The topography of the raw N170 in response to faces appears to change dramatically across development (Figure 7
). Specifically, in adults it appears as a bilateral occipito-temporal negativity with a strong right hemisphere advantage, associated with a positivity at centro-parietal sites (VPP; Jeffreys, 1989
), replicating the usual N170 pattern (Figure 1
). In children however, the N170 was not always visible on the topographical maps and appeared hidden/dominated by a large occipital positive potential, which was particularly prominent for the 9- to 14-year-old children; Figure 7
). The right lateralization of the N170 was not clear at all, and it is only in the 14–15 year olds that the N170 appeared adult-like. Strangely, it appeared less adult-like in the oldest children tested (16–17 years).
However, the critical question is whether or not these changes in the N170 parameters are specific to faces. We must keep in mind that variations in terms of the topography of the N170 may be caused by general variations in ERP activation with age. These variations can be removed, and the N170 isolated, by subtracting out the general low amplitude responses evoked by scrambled faces from the responses evoked by faces. Therefore, we first removed the amplitude responses to low-level stimuli to understand if there are general developmental changes occurring with the topography of the N170. After removing the general low-level responses from the responses to both faces and cars, we were able to compare these two stimulus categories in order to determine if any developmental changes we may observe would be specific to faces.
When the scrambled face response is subtracted from the face response, the N170 topography appears remarkably similar across development, i.e. as a clear negative deflection centered on occipito-temporal sites (Figure 9
). Like for the P1, it is much more lateralized in adults than in the non-mature brain, being concentrated on occipito-temporal channels rather than central occipital channels. The N170 shows a right hemisphere advantage, which may be larger in some age groups than others, but without a systematic developmental trend (Figure 9
).
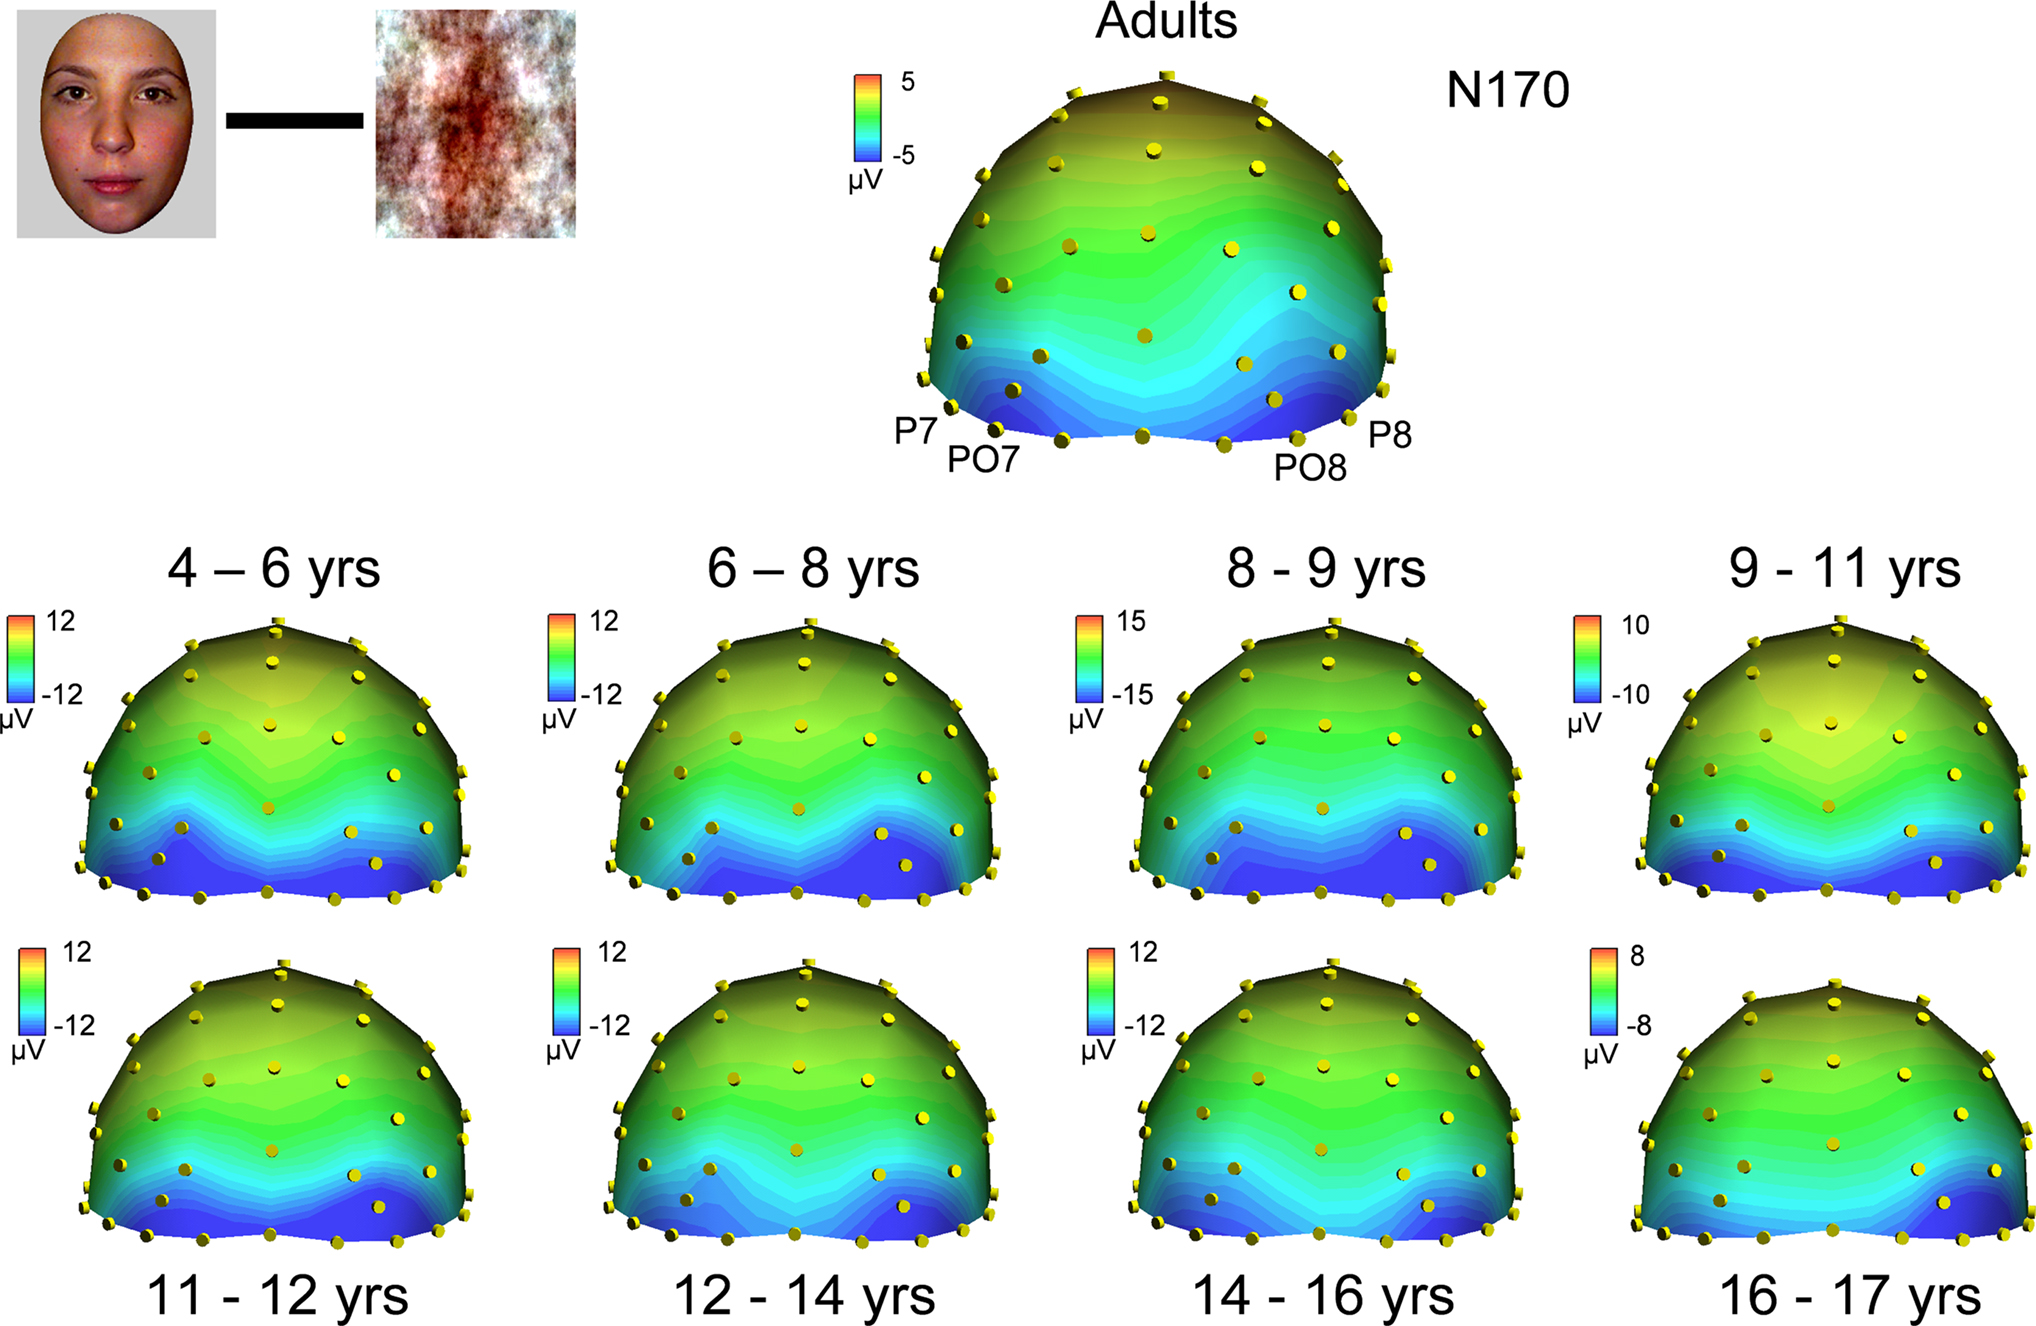
Figure 9. Scalp topographies at the peak of the visual face-sensitive N170 component in responses to faces in adults (top) and all age groups, when the response to scrambled faces at that latency is subtracted out. Compared to the large variations in scalp distribution of the raw N170 component (Figure 7
), the N170 shows a remarkable stability in terms of topography across all age groups, with a very small refinement with age. Note that the right hemisphere dominance, characteristic of the adult face N170, is visible in most age groups, at least from 6 to 8 years old. The topographic plots are snapshots of the (face – scrambled face) subtracted N170 response at 180 ms for adults, and at the following latencies for the youngest to oldest age groups, respectively: 166, 180, 190, 148, 150, 163, 143 and 159 ms.
Thus by subtracting from faces the responses evoked by scrambled faces, the N170 topography appeared much more similar across age groups, as well as more adult-like at all ages. Correlation analyses between topographies substantiated these observations. Pearson correlation values between the raw topography to face stimuli for each age group and the group of adults ranged between 0.085 (NS) and 0.84 (Figure S10A in Supplementary Material). However, correlation values of the topographies of the N170 resulting from the subtraction (faces – scrambled faces) were all much higher and ranged between 0.87 and 0.96 (Figure S10A in Supplementary Material; all significant at p < 0.0001). These correlation values based on differential activities increased with age, being maximal for the oldest age group. This indicates a small increase in the adult-like scalp distribution of electrophysiological activity across development at the time window of the N170, which cannot be accounted for by developmental changes to low-level visual stimulation.
Importantly, the same correlation analysis performed on the N170 for pictures of cars compared to the correlation performed on the subtraction (cars – scrambled cars) showed a similar pattern
1
(Figure S10B in Supplementary Material). Correlations of the child and adult topographies to pictures of cars were quite low for most age groups (ranging between 0.02 and 0.87, but lower than 0.60 for all but one age group) but improved substantially in all age groups when the variations due to low-level stimuli were removed via the subtraction. If anything, the “adult-likeness” of the N170 topography increased significantly more for pictures of cars than faces across development (Figure S10B in Supplementary Material), an observation that counters the idea that the scalp distribution of electrophysiological activity during the N170 time-window undergoes face-specific developmental changes during the course of development. The topographies of cars – scrambled cars across age groups support this statement (Figure S11 in Supplementary Material).
N170 latency. If one considers the grand-averaged data by age group, the N170 latency to faces appears to decrease with age, peaking at about 200 ms in the youngest age group and reaching about 150 ms in adulthood (Figure 8
). However, when measured in individual participants, the decrease of N170 latency was much smaller. In fact, mean latencies ranged from about 170 to 145 ms (Figure 10
), revealing only a 25 ms difference between the youngest age group and adults. In both the grand averaged waveform and the data extracted from individual subjects, the decrease did not appear to be linear, but was substantial between the three youngest age groups (4–9 years old) and the older participants (Figure 10
A).
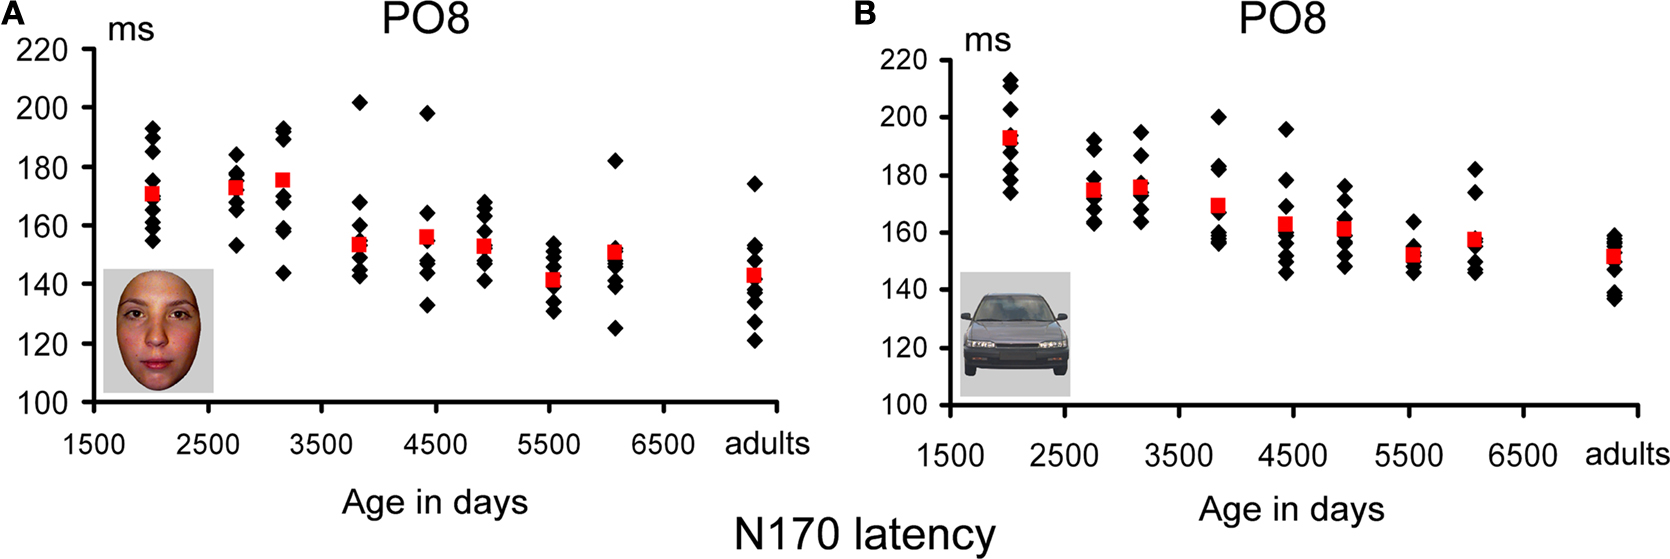
Figure 10. Peak latency of the N170 in response to pictures of faces (A) and cars (B). Individual data points are plotted according to the mean age (in days) of each age group. Mean latency for each age group is shown in red. The overall latency delay for cars was found across all age groups, and the developmental decrease of latency appears to follow a similar pattern for faces and cars. Note the longer latency of the N170 in the three youngest age groups compared to the others, but also the generally smaller variability (25 ms at most). The N170 latency appears to reach an adult-like level at 14–16 years old, both for faces and cars.
This pattern reflects in part the fact that, in the three youngest age groups, the measure of N170 latency was complicated by the merging of the first negative deflection (what we refer to as the real N170) following the P1 with a second negative deflection (Figure 8
). While Taylor et al. (2004)
referred to the second negative deflection as the N170b, we propose that it may actually be the N250. The N250 is negative mid-latency ERP which, in adults, is larger for repeated compared to unrepeated faces over temporal scalp regions, in particular for familiar faces (“N250r”, e.g. Begleiter et al., 1995
; Schweinberger et al., 1995
; Tanaka et al., 2006
). We believe that the large amounts of inter-trial variance in young children’s data caused these two components to appear to have less temporal separation in the averaged waveform compared to being quite distinct in older child and adult averages. The merging of the N170 and N250 was particularly clear on the grand-averaged data from the three youngest age groups (Figure 8
). However, in individual participants, even in the youngest age groups, the two negative components could be more easily distinguished, and thus the first negative deflection, identified as the N170, was measured appropriately in our sample (Figure 11
).
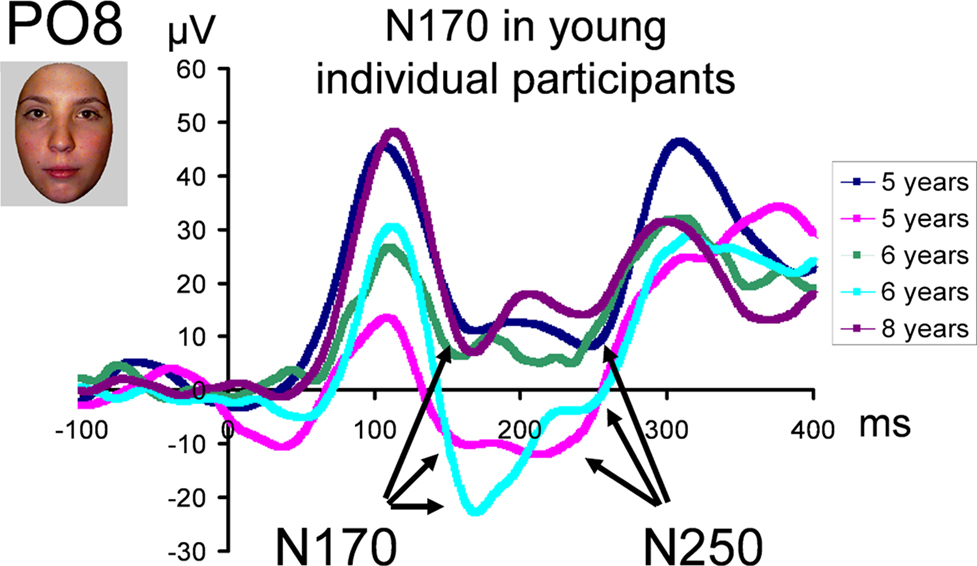
Figure 11. Illustration of young individual participant waveforms showing the two negative deflections which are merged on grand averaged data (Figure 8
). The second peak may correspond to the N250 in older populations (see text and Supplementary Material). A 30-Hz low-pass filter has been applied to each waveform in this figure.
Importantly, all of these observations were also true of the responses to cars, and were thus not specific to faces (Figures 8
B and 10
B).
The statistical analysis on the N170 latency was performed with the within subjects factors of Electrode (PO7/PO8, P7/P8), Hemisphere (right, left), Category (faces, cars) and the between subjects factor Age Group (nine levels).
The ANOVA showed main effects of Category (F1,74 = 87.43, p < 0.001), due to faster (∼8 ms) response to faces than cars. Additionally, the overall decrease in latency with age was confirmed by a main effect of Age Group (F8,74 = 15, p < 0.001) which was driven by decreases in latency between age groups 3 and 5 (8–12 year olds), with latencies remaining unchanged from the 11–12 years to adulthood.
The only significant interaction which involved Age Group was a triple interaction between Category, Electrode and Age Group (F1,148 = 2.48, p < 0.019) (all other p-values involving Age Group, p > 0.15). This triple interaction appeared to be caused by differences between age groups 2 and 3 vs. all other age groups: for the children of age groups 2 and 3, the most lateral channels (P7/P8), showed earlier peak latency for cars than faces, while the posterior channels (PO7/PO8) showed the opposite pattern. However, ANOVAs comparing the group of adults to each age group of children showed only non-significant trend for a Category × Electrode × Age Group for age groups 2 (p = 0.06) and 3 (p = 0.073) (all other p-values p > 0.18).
N170 latency delay with respect to P1: peak-to-peak analysis. We performed the same statistical analysis with the factors electrode (two levels: PO7/PO8; P7/P8), Hemisphere (two levels, right and left), Category (two levels, faces and cars) and Age Group (nine levels) on the measure of the difference in milliseconds between the peak of the N170 and the peak of the P1. This analysis revealed a main effect of Category (F1,74 = 29.21, p < 0.001) due to a longer (∼5 ms) peak-to-peak difference for cars than for faces. There was a main effect of the factor Age Group (F8,73 = 3.77, p < 0.001), driven by a moderate decrease in peak-to-peak N170 latency (Figure 13
A). In total, the peak-to-peak latency of the N170 for faces decreased from 58 ms (youngest age group) to 44 ms (adults), but this decrease was entirely due to the three first age groups. There were no further significant decreases in latency from age group 4 until adulthood (Figure 12
A). The same developmental trajectory was present for cars, with the only exception of the data of the first age group, for which the peak-to-peak latency was particularly long in response to cars (Figure 12
B). Nevertheless, interaction between Age Group and Category was not significant.
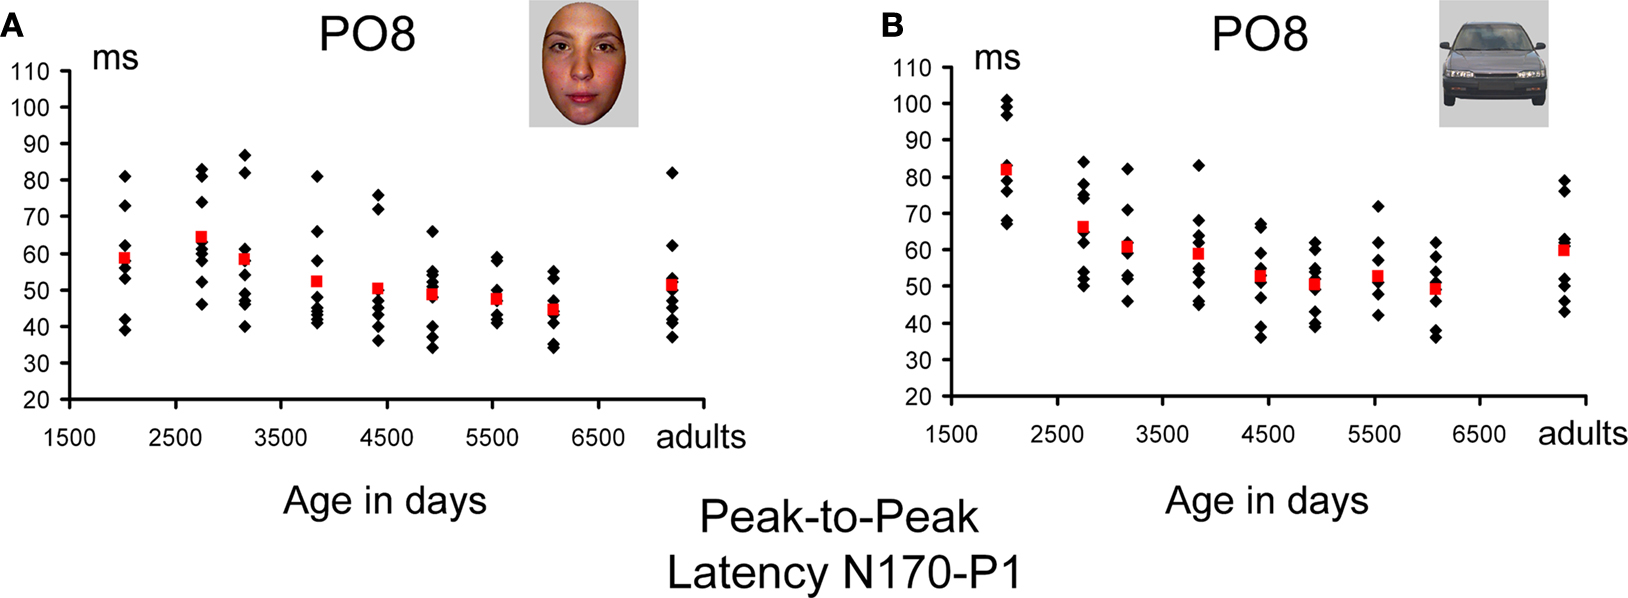
Figure 12. Peak-to-peak latency measurements of the N170 vs. P1 for faces (A) and cars (B). Individual data points are plotted according to the mean age (in days) of each age group. Mean measurements for each age group are shown in red. If anything, the changes of latency with age were larger for pictures of cars (due to the youngest children). For faces, the peak-to-peak difference in latency between the P1 and N170 was of 10–15 ms at most.
There was also an interaction between Electrode and Group (F8,74 = 3.77, p < 0.001) due to the fact that the peak to peak differences was smaller at P7/P8 than PO7/PO8 for the youngest children (∼6 ms), was roughly equal for the two sets of electrodes for age groups 2–7 (6–16 years), and was smaller at PO7/PO8 for the oldest children and adults (groups 8 and 9; ∼9 and 5 ms, respectively). The interactions of interest, namely those involving Category and Age Group, were not significant (Category × Age Group, p > 0.32; Category × Age Group × Hemisphere: p > 0.47; Category × Electrode × Hemisphere: p > 0.29; Category × Age Group × Hemisphere × Electrode: p > 0.19).
In summary, we found that the absolute N170 latency in response to faces decreased with age, but to a much lesser degree than previously reported (Taylor et al., 2004
), i.e. within a range of 25 ms here. These variations with age were even smaller (about 15 ms) when accounting for P1 latency differences, and were found only when comparing the three first age groups (4–9 year old children) to the older participants. However, this was possibly due to the larger variance in the youngest age groups (Figure 12
), which may have been caused by the merging of a later occipito-temporal negativity with the N170 for some participants. In any case, this relatively small decrease of N170 latency was found for both faces and cars, and if anything there was a smaller age-related change (i.e., decrease of latency) for faces than cars when considering age group 1.
N170 amplitude. If one considers the grand-averaged data by age group, the N170 amplitude to faces appears to vary with age, but in a non-systematic way (Figure 8
). This observation is also true when measured in individual participants (Figure 13
). In both the grand averaged waveform and the data extracted from individual subjects, the amplitude modulation took a form similar to the inverted “U”-shaped function (Figure 13
), previously described by Taylor et al. (2004)
. This reflects in part the fact that, like latency, in the three youngest age groups, the measure of N170 amplitude was complicated by the merging of the first negative deflection following the P1 (what we refer to as the real N170) with a second negative deflection taking place later (referred to as N170b by Taylor et al., 2004)
. Again, the confusion between the two negative deflections was particularly clear on grand-averaged data (Figure 8
), while, in individual participants of the youngest age groups, the two negative components could be more easily distinguished, and thus the first negative deflection, identified as the N170, measured appropriately (Figure 10
).
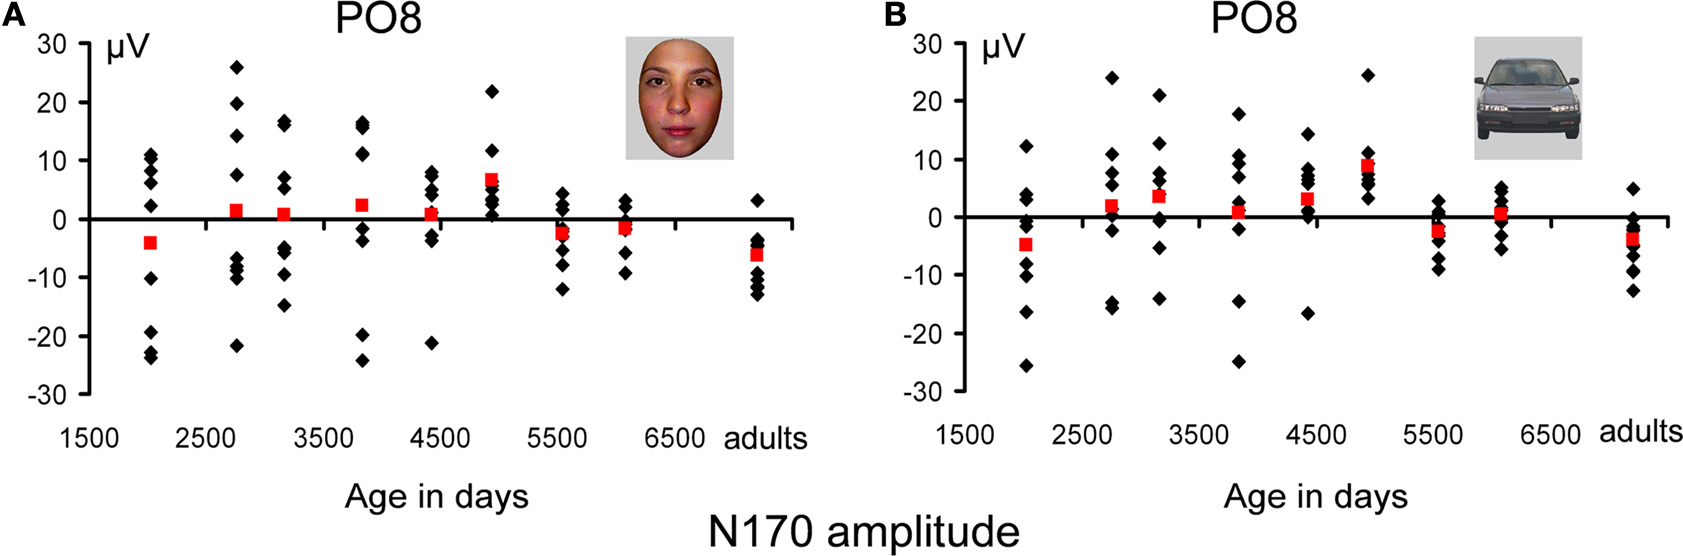
Figure 13. Amplitude measurements of the N170 for faces (A) and cars (B). Individual data points are plotted according to the mean age (in days) of each age group. Mean measurements for each age group are shown in red. The U-shape function of N170 amplitude is not so clear on the figure due to the large scale used to display individual participant’s data. Note the remarkable similarity between the amplitude variations of faces and cars with age.
Importantly, again, all of these observations concerning amplitude modulations were also made for the waveforms recorded to pictures of cars, and were thus not specific to faces (Figure 13
B).
The statistical analysis on the N170 amplitude was performed with the factors Electrode (PO7/PO8; P7/P8), Hemisphere (right and left), Category (faces and cars) and Age Group (nine levels). The ANOVA showed a trend for an effect of Category (F1,74 = 3.26, p < 0.075), due to larger (∼0.7 μV) response to faces than cars. Additionally, a main effect of Age Group (F8,74 = 3.5, p < 0.002) which was due to the negativity first decreasing with age and then increasing again (Figure 7
). There was also a main of Electrode (F8,74 = 173.37, p < 0.0001) for a larger N170 at P7/P8.
The only significant interaction which involved age group was a two-way interaction between Electrode and Age Group (F1,148 = 5.71, p < 0.001) (all other p-values involving the factor Age Group p > 0.15), which was due to the N170 decreasing in amplitude on P7/P8. There were also a number of significant interactions involving the factor electrode, but no interaction with age group (Electrode × Category × Hemisphere: F1,148 = 6.71, p < 0.012; Hemisphere × Electrode: F1,148 = 6.15, p < 0.015).
N170 amplitude with respect to P1: peak-to-peak analysis. To take into account P1 variations, we performed the same statistical analysis with the factors Electrodes (two levels: PO7/PO8; P7/P8), Hemisphere (two levels, right and left), Category (two levels, faces and cars) and Age Group (nine levels) on the measure of the difference in amplitude between the peak of the N170 and the P1. This analysis revealed a main effect of Category (F1,74 = 16.93, p < 0.001) due to a larger peak to peak difference for faces than for cars (face – car difference ≈2 μV). There were also main effects of the factors Hemisphere (F1,74 = 11.54, p < 0.001) due to a greater amplitude difference in the right than the left hemisphere (2.7 μV), and Electrode (F1,74 = 124.58, p < 0.001), due to a larger difference in amplitude at more posterior channels (PO7/PO8 vs. P7/P8). Finally, there was a main effect of Age Group (F8,73 = 17.08, p < 0.001), driven by a significant, marked decrease in peak-to-peak amplitude difference until the 5th age group (11–12 years), with further more modest decrease until adulthood (Figure 14
).
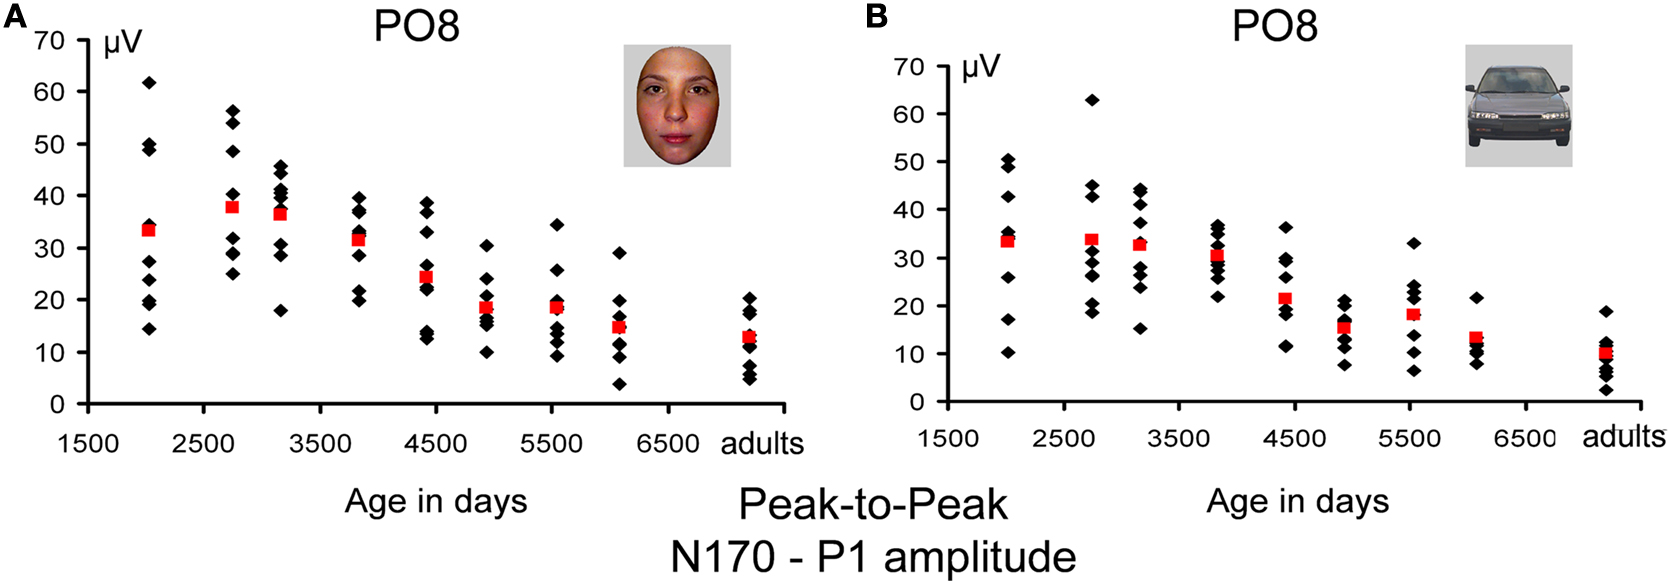
Figure 14. Amplitude measurements of the N170 – P1 for faces (A) and cars (B) (absolute values). Individual data points are plotted according to the mean age (in days) of each age group. Mean measurements for each age group are shown in red. The U-shape function of N170 amplitude is no longer there, and the age-related variations reflecting the processes taking place following the P1 show only a slight decrease with age, similar for faces and cars.
There was also an interaction between Electrode and Age Group (F8,74 = 5.367, p < 0.001) due to the fact that the peak-to-peak differences were largest at PO7/PO8 for the youngest age group (4–6 years) and then decreased monotonically (but no significant difference between 16–17 year olds and adults). The interactions of interest, namely those involving Category and Age Group, were not significant (Category × Age Group: p > 0.82; Category × Age Group × Hemisphere: p > 0.72; Category × Electrode × Age Group: p > 0.31; Category × Age Group × Hemisphere × Electrode p > 0.81).
In summary, we observed a larger N170 for pictures of faces than cars in all age groups, and this was clearer on the peak-to-peak analysis, thanks to the fact that differences of the opposite polarity at the level of the P1 were subtracted out. The right hemisphere showed larger amplitude than the left hemisphere, an effect which was again largely significant in the peak-to-peak analysis. These two effects were found in all age groups. The U-shaped function of the N170 amplitude with development was found for both faces and cars, but could, in fact, be attributed to variations at the level of the P1. Rather, peak-to-peak analyses were performed, we observed a small linear decrease of amplitude with age until adulthood, again of the same magnitude for pictures of faces and cars (Figure 14
).
The goal of the present study was to assess whether the large age-related variations in latency, amplitude and scalp topography characterizing visually evoked components in response to simple face stimulation, the P1 and N170, can be taken as evidence for face-specific developmental changes in perceptual processes. This issue is of importance because the nature of the vast improvements of face recognition abilities throughout childhood and until adulthood is still highly debated (Crookes and McKone, 2009
). On one hand, it has long been proposed that age-related improvements on face processing tasks are specific to our ability to perceive faces per se, particularly the relationships between facial features (holistic/configural processing), which would develop slowly as we accumulate an increasing amount of visual experience with faces (Carey and Diamond, 1977
; Carey, 1992
; Mondloch et al., 2002
). On the other hand, age-related improvement on face processing tasks until adulthood could result from improvements in general sensory or cognitive factors, or in visual pattern recognition in general (Want et al., 2003
; Crookes and McKone, 2009
).
As we stated in the introduction, although challenging and rarely done, recording ERPs in developmental populations is potentially invaluable in resolving this debate. Using ERPs, perceptual processes reflected by visual components on the scalp can be relatively well isolated (in time, and space to a lesser extent) from other processes taking place at different moments in the time course of face processing. For instance, the N170 has been associated with early access to high-level representations in the human brain, with a particular sensitivity to faces, while the preceding P1 may show a lesser degree of face-sensitivity that is based on low-level visual features (Rossion and Jacques, 2008
, 2010
). In contrast, later components (e.g., N250, P3) are generally related to associative and decisional processes. Moreover, differential ERP responses evoked by faces and objects in the adult population have been well characterized, and these effects could be assessed in developmental populations.
However, previous developmental ERP studies reported general (large) changes of early brain responses to face stimuli, without considering whether these changes were specific to faces, or at least substantially different for faces than other visual categories. That is, the extent to which modifications of the parameters of the P1 and N170 can be taken as evidence that perceptual processes for faces change specifically with age (Carey, 1992
) remained unknown.
Here, in a study in which we used several non-face visual stimuli in addition to faces, relied on a high-density recording system, topographical and peak-to-peak analyses, and made use of displays of individual ERP data, we made three types of observations:
1. General age-related changes in amplitude of the P1 and N170 in response to faces exist, replicating previous studies. However, decreases in the component latencies with age were much smaller than previously reported, and variations in topographies were minimal when taking each stage of processing into account independently.
2. Differences between conditions (faces vs. objects; shapes vs. non-shapes) in the P1 and N170 parameters were found as early as 4 years. Face-sensitivity on the P1 can be explained by low-level differences between faces and objects (i.e., it was equally large for scrambled stimuli and meaningful stimuli). There was a near absence of N170 to phase-scrambled stimuli, and a larger and earlier N170 to faces than cars. There was a right hemisphere dominance for N170 for meaningful stimuli, with occipito-temporal topography for both faces and cars. The fact that these effects were found as early as 4 years is an original contribution of the present study.
3. None of the differences between conditions (faces vs. objects; shapes vs. non-shapes) in the parameters of the P1 and N170 changed across development. These differences thus can not be related to well-known behavioral performance variations in face recognition.
Altogether, our findings do not offer any electrophysiological evidence that perceptual processes change specifically, or even to a different extent, for faces than non-face visual patterns across development. This does not rule out the qualitative view of the development of face perception, as we discuss below, but indicates that previous evidence seemingly in favor of this view (e.g., Taylor et al., 2004
) should be qualified. In addition, throughout the course of our analyses, we identified a number of methodological issues that may be important to consider for future investigations in this area of research. We will now turn to these points in more detail.
General Age-Related Changes in P1 and N170 Parameters
With respect to general age-related changes of both the P1 and N170, we largely replicated previously reported observations (Taylor et al., 1999
, 2001
, 2004
; Itier and Taylor, 2004a
,b
). The P1 decreases dramatically in amplitude with age, and shows modest decreases in latency. With respect to the “raw” N170 amplitude, we observed a similar inverted “U” shaped development previously reported by Taylor and colleagues, with the N170 being of least negative amplitude around 10–12 years of age, but of larger amplitude in younger and older children and adults. In terms of latency, the changes we found on the N170 were much less drastic than those previously reported (Taylor et al., 2004
). We also reported general changes of P1 and N170 topography with age with more spatial precision, due in part to our use of a much higher density of electrodes (64 as compared to 32 at most in previous developmental studies, with some studies having even fewer channels, e.g. Taylor et al., 1999
; Henderson et al., 2003
). While the P1 topography was not much different across age groups, becoming fully adult-like at 16–17 years (Figure 3
), the N170 topography was dramatically different across development, but stabilized around the same age as the P1 (Figure 7
).
P1 age-related general changes
The P1 was clearly identifiable in all subjects’ data for all four conditions. The latency and amplitude decreases observed with age (Figures 3
–6
) did not differ for the four types of stimuli, indicating that this decrease reflects a general developmental trend. These developmental variations in P1 latency and amplitude are not novel, having been previously reported for simple visual stimuli (e.g., Buchsbaum et al., 1974
; Brecelj et al., 2002
; Crognale, 2002
). The variations in P1 latency suggest increasing general speed and efficiency in early visual processing across childhood and may reflect increasing myelinisation in visual cortical areas (Yakovlev and Lecours, 1967
; Nelson, 1997
). Although the reasons for changes in P1 amplitude are not entirely clear, it has been documented that absolute EEG power decreases between the ages of 10 and 20 years, with especially marked declines of power in the slow-wave band below 7.5 Hz (Matousek and Petersen, 1973
). This decrease in neural activity has been related to changes in brain structure over adolescence, with the age-related reduction of slow-wave activity mirroring an age-related reduction in gray matter volume (Whitford et al., 2007
), and synaptic density in particular (Huttenlocher, 1990
). However, these amplitude variations may also be due to changes in conductivity of underlying tissues (bone, subcutaneous fat thickness and blood circulation, skin), cortical convolution and position of the sulci and gyri relative to external electrodes, general level of brain activity, and increases in head size. For instance, children’s skull tissue normally contains a larger amount of ions and water and may thus have a higher conductivity than the adults calcified cranial bones (Lai et al., 2005
).
We also observed, for all conditions, an increasing distinction of the lateral P1 distributions on the scalp, with an increasing lateralization with age. We suggest that this phenomenon is due to an increase in head size with age rather than the generating sources of the P1 becoming more separated with development. In fact, transforming the grand-averaged data in scalp current source density (CSD, Perrin et al., 1989
; Tenke and Kayser, 2005
), spatially enhancing the representation of the direction, location, and intensity of current generators that underlie an ERP topography, suggested the presence of two quite focal and distinct sources in each hemisphere generating the P1 for all age groups (Figure S12 in Supplementary Material).
N170 age-related general changes
General age-related variations of the N170 parameters were in agreement with what has been previously reported for amplitude and topography (Taylor et al., 2004
), but were much less spectacular than previously described for latency.
While as previously reported (Taylor et al., 2004
), the N170 amplitude variations with age showed a U-shaped function, subtracting out the large baseline variations of P1 amplitude revealed a more progressive change in peak-to-peak amplitude of the N170 with age. More precisely, the N170 was large and stable in amplitude until 9 years and then decreased steadily until adulthood (Figure 15
). This was found for both faces and cars and may be related to a maturation of shape-related processes or general age-related structural and functional brain changes, as discussed for the P1.
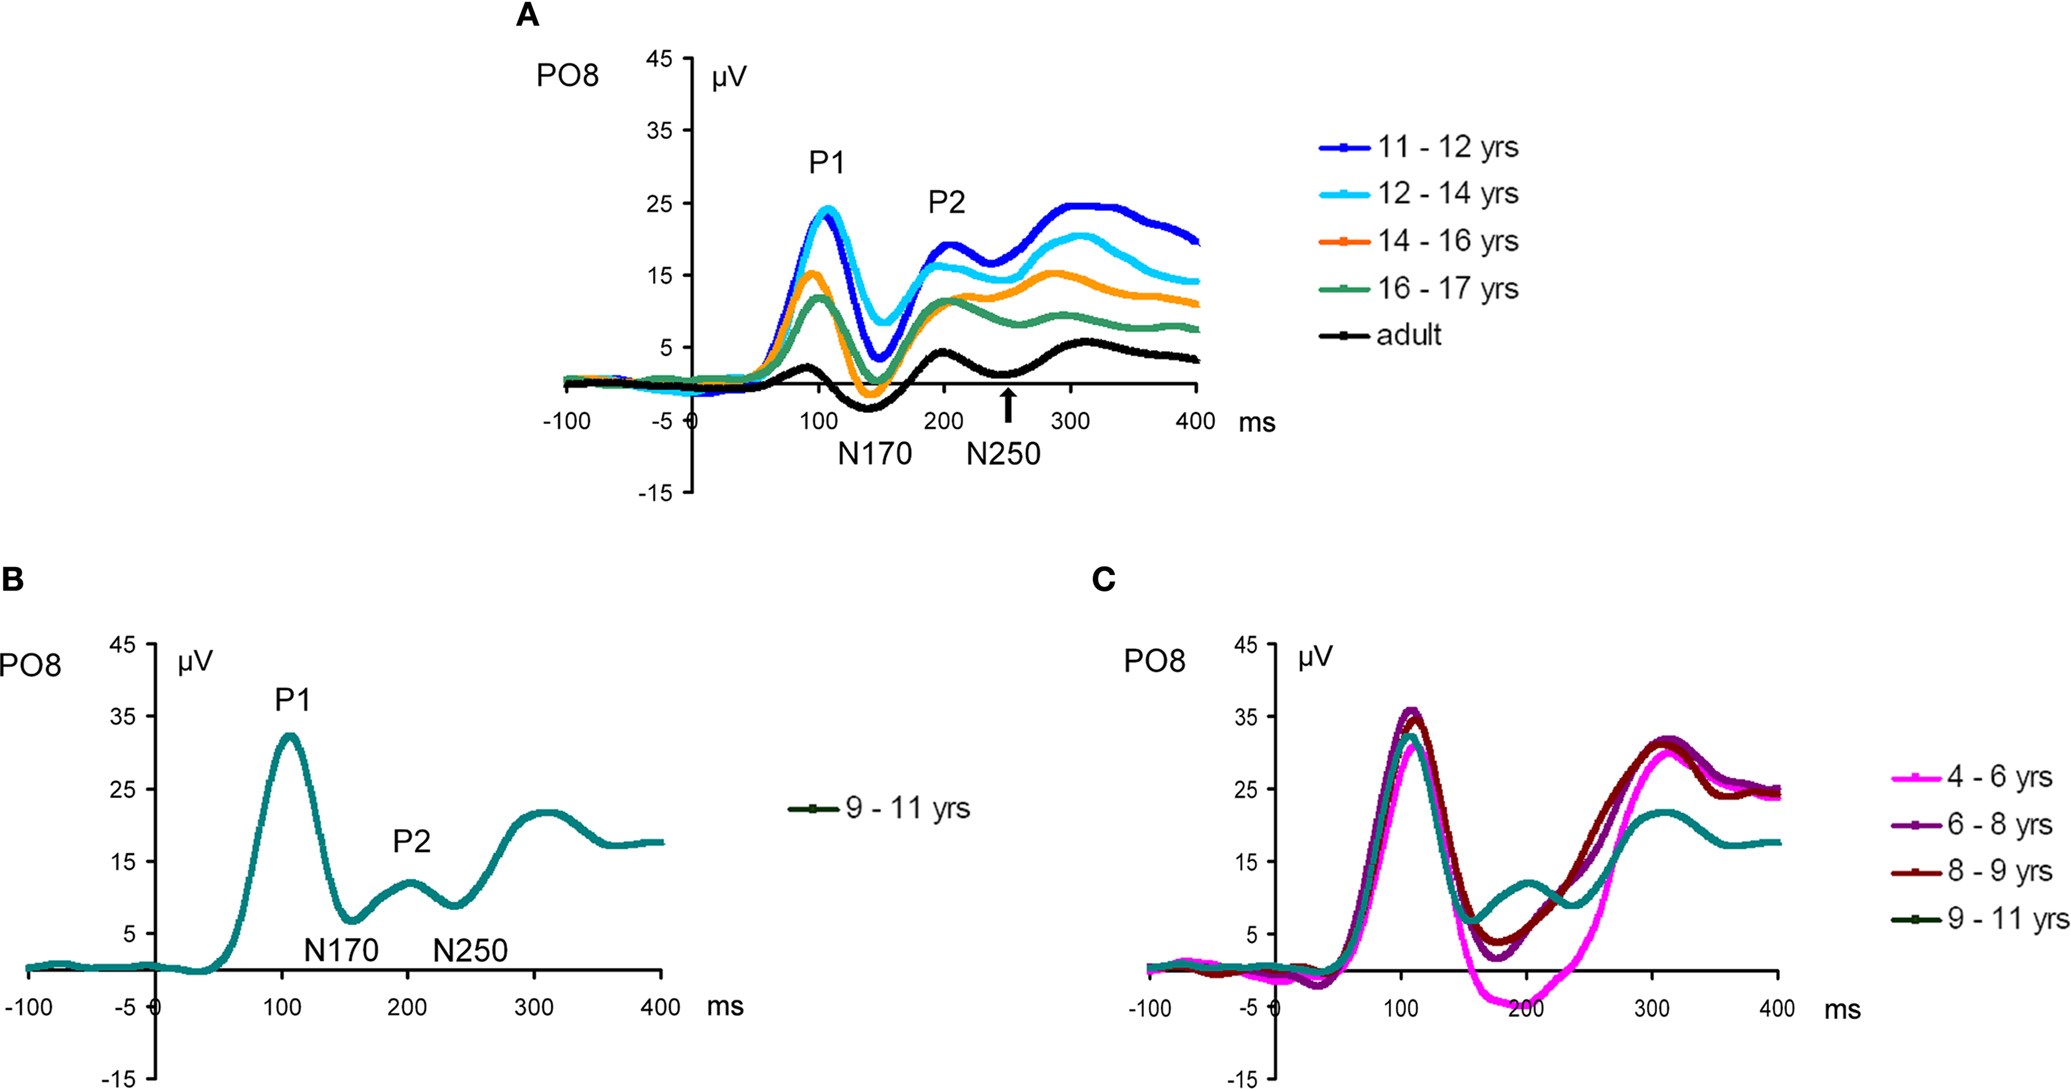
Figure 15. (A) Grand-average waveform recorded at PO8 in response to faces in the four oldest age groups and adults. Note the separation of the N170 and N250 by the clear presence of the P2. (B) The grand-average waveform for the 9–11 year olds. Note that the P2 is less pronounced for this age group. (C) Grand-average waveforms recorded at PO8 in response to faces in the three youngest age groups (4–6 years, 6–8 years, 8–9 years) compared to the 9–11 year olds. Note that there is no P2 in the three youngest groups and that the “N170”, as evident from the grand means, encompasses both the N170 and N250 of the older age group. The peak of the N170 for these three youngest age groups falls close to where the Peak of the P2 is for 9–11 year olds. This leads us to believe that in the grand averaged data, the N170 and N250 are merged in the three youngest age groups due to large inter-subject variability and the absence of a pronounced P2.
When age-related P1 variations are subtracted out, the N170 in response to both faces and cars appears to have a highly similar topography (i.e., occipito-temporal negativity with a right lateralization) across all age groups, even when comparing the youngest age group to adults.
When P1 variations in latencies are subtracted out (peak-to-peak analysis), the decrease of latency of the N170 from 4 years to adulthood is not spectacular, being of 10–15 ms at most, and remaining unchanged from the 4th age group (9–11 years) to adults. This indicates that the transition between the first early visual response detectable on the scalp (P1) over the mid-central and lateral occipital cortices, and the occipito-temporal shape-related processes (N170), undergo only a tiny decrease in time over development, and is stable by about 9 years of age. This is perfectly understandable: while P1 latency variations with age reflect the accumulation of the delay of response of visual pathways from the retina to the striate and extrastriate areas (e.g., Brecelj et al., 2002
; Brecelj, 2003
), the transition between P1 and N170 should not concern a great deal of visual processing stages or synaptic relays in the visual cortex. In addition, the smaller head size in young children may certainly compensate for age-related delays in speed of transmission of information between visual areas.
Twin Peaks
This short latency delay between P1 and N170 in the present study was also found because, contrary to previous studies (Taylor et al., 2001
, 2004
), we measured the N170 consistently in all age groups as the first negative deflection following the P1. In the three youngest age groups, grand-average data showed a very late and wide N170 (Figure 8
) compared to the other age-groups. This observation is not new, it was made by Taylor et al. (2001
, 2004
). In their review paper, they measured the “real N170” at the second peak in younger children, hence describing an extremely late N170 latency in these age groups. However, in our study, we were able to determine the peak of the first negative component in individual data. It seems clear from our data that this “bifid” N170 phenomenon arises from the merging of two negative peaks, the N170 and the N250 (Figures 11 and 15
).
The definition of the N170 at a much earlier latency than previously reported, resolves discrepancies between the Taylor et al. (2004) and other developmental studies in which the N1 to visual stimuli activating the ventral pathway is only slightly delayed for 6–8 year olds compared to adults (e.g., Brecelj et al., 2002
; Coch et al., 2005
). Moreover, it has been reported that sensitivity to faces emerges as early as 290 ms in 12 month old infants (N290, de Haan et al., 2003
), a component which, in conjunction with the later occurring P400, has been characterized as a possible precursor to the N170. According to the report of Taylor et al. (2004)
of a 270 ms “N170” latency in 4- to 5-year-old children, face-sensitivity would have shifted only 20 ms between age 1 and 4, and then about 100 ms until adulthood, a paradox which was difficult to understand (de Haan et al., 2003
). In fact, our data resolve this paradox and suggest the opposite: the latency of face-sensitivity effects decreases dramatically between 1 year of age and 4–5 years of age, but then only moderately until 9–10 years, where it is almost adult-like.
Furthermore, while Taylor et al. (2004)
referred to the two peaks of the “bifid” N170 as the N170a and N170b, associating them with distinct face processes (holistic and configural respectively), our present observations lead to us to disagree with this view. Rather, based on topography, latency and right lateralization, we would like to argue that the first negative deflection, which arises relatively early following the P1 even in young children, corresponds to the N170 component in all age groups. The second peak is present in all age groups, including adults. However, in between these negative peaks, one can see the emergence of an increasingly sharper P2 component with age, which clearly distinguishes the two negative components at older ages (Figure 15
). The second negative peak, the N170b of Taylor et al. (2004)
appears to correspond rather to the adult N250, a negative mid-latency ERP which, in adults, is larger for repeated compared to unrepeated faces around 250 ms over temporal scalp regions, in particular for familiar faces (“N250r”, e.g. Begleiter et al., 1995
; Schweinberger et al., 1995
; Tanaka et al., 2006
). If this hypothesis is correct, future developmental ERP studies should be able to test – and perhaps demonstrate – the presence of such familiarity-dependent identity repetition effects for faces or objects of expertise in childhood.
Stable (Adult-Like) Differences between Conditions in the Parameters of Early Visual Responses
An important and novel aspect of the current study lies in the fact that we measured the electrophysiological responses not only to faces, but also to phase-scrambled faces, pictures of cars and phase-scrambled cars as well. For the first time, we were able to describe adult-like face-sensitivity of P1 and N170 across development.
P1 stable variations
First, with respect to amplitude, even though this effect is not always found (e.g., Rossion et al., 2003
; Boutsen et al., 2006
; Rousselet et al., 2007
), previous studies in adults have reported larger P1 (or M1 in MEG) in response to faces than to objects (e.g. Eimer, 1998
; Eimer and Holmes, 2002
; Goffaux et al., 2003
; Itier and Taylor, 2004c
). Here we observed a larger P1 in response to pictures of faces than cars, replicating the latter observations. However, for the first time to our knowledge, we were able to demonstrate that this effect is, as previously suggested (Rossion and Jacques, 2008
), entirely accountable by low-level visual differences between faces and cars, since it was also found for phase-scrambled versions of these stimuli. Most importantly, the larger low-level-related amplitude of the P1 for faces is observed from 4 years to adulthood, which indicates that the sensitivity of the visual system to low-level visual properties of faces, an aspect which certainly plays a critical role in the speed of face detection (e.g., VanRullen, 2006
) is present at 4 years of age. Furthermore, the relative magnitude of this face-related P1 increase appeared to remain constant across development.
Second, independently of the category, we also observed a larger P1 response to scrambled stimuli than non-scrambled stimuli, which, again, did not show any significant change with age. Such increases to scrambled visual stimuli in low-level visual regions of the brain have been reported previously in fMRI studies of object processing (e.g., Malach et al., 1995
) as well as in ERP/MEG studies (Tanskanen et al., 2005
; Rousselet et al., 2008
). This may reflect no more than a spread of information across the whole (rectangular) area of the visual stimulus when using phase-scrambled or pixilated images (Figure 2
).
Stable N170 differences between faces and cars
Across all age groups, we found that the N170 was large in response to shapes (faces and cars) compared to meaningless versions of stimuli conveying the same low-level visual properties. Neither of the two scrambled stimuli elicited a very robust N170, an observation that has been previously made for adults (Tanskanen et al., 2005
; Rousselet et al., 2008
) and children (Taylor et al., 1999
), and supports the interpretation of the N170 as a component reflecting high-level visual processes, particularly sensitive to faces (Rossion and Jacques, 2008
, 2010
). This indicates that, across all age groups, the N170 reflects in large part high-level visual processes, contrary to the P1.
As stated above, when considering the raw N170 amplitude, we replicated the finding of an inverted “U” shape developmental trajectory (Figure 14
), with widely varying topographies across age groups (Figure 7
). However, this finding was true for both faces and cars. Despite the small size of the N170 responses to scrambled stimuli, we used these responses to compute new waveforms for each subject, subtracting the responses of scrambled faces and cars from their meaningful non-scrambled stimulus counterpart. This subtraction process served to remove much of the response to faces and cars that could be attributed to low-level characteristics of the stimuli, leaving responses that were specific to the two stimulus categories. It also removed much of the P1 variations, which were furthermore taken into account by peak-to-peak analyses. These complementary analyses were, to our knowledge, not performed in previous ERP studies of the development of face processing.
When considering the N170, subtracting a portion of the response that can be attributed to low-level characteristics of the stimuli seems fundamental given that the P1, which is highly sensitive to low-level characteristics as discussed above, varies so greatly with age. Thus, to have a true measure of age-related changes on the N170, it was important to subtract the age-related changes happening on the P1. In order to directly take into account the variations of the P1, we analyzed both the amplitude and latency of the peak-to-peak (N170 to P1) values for both faces and cars. This measure is a reflection of the magnitude of amplitude or latency change between the peak of the P1 and the peak of the N170.
While these measures revealed general decreases in peak-to-peak latency and amplitude with increasing age, the decreases were no more pronounced for faces than for cars. Importantly, analyses of the subtraction waveforms revealed highly similar N170 topographical distributions across all age groups. In fact, correlation values with the adult N170 (P1 subtracted topography) were above 0.86 for all age groups, while the same correlation values for the raw N170 topographies were much smaller, and varied greatly by age group (Figure S10 in Supplementary Material).
Besides general changes at the level of the N170, we reported, for the first time to our knowledge, larger amplitude (in particular when taking into account low-level and P1-related variations) and shorter latency to faces than cars, both remaining stable across age. N170 amplitude for faces was not much larger than for cars in this study (see Rossion and Jacques, 2008
for a discussion of this issue) but significantly so at all ages, which extends the well-known adult face-sensitivity of this component to children as young as 4 years. The shorter latency to faces is sometimes also reported in the adult ERP literature (e.g., Carmel and Bentin, 2002
), but not consistently (e.g., Rossion et al., 2000
). Remarkably, again, these effects were found here across all ages, and were of equal magnitude.
No evidence for interactions between development and face-sensitivity of early components
The use of multiple stimuli and peak-to-peak analyses allowed us to compare the responses across conditions to understand if any of the observed developmental changes were unique to faces or were also shared with these other stimuli. Our response to this question is clear: all age-related variations in the parameters of the P1 and N170 were not specific to faces. Furthermore, these age-related variations were not at all larger for faces than other visual stimuli.
Overall, these data do not offer any support for the view that perceptual aspects of the face processing system change specifically with development (Carey, 1992
). In fact, they do not even support the view that the speed of these processes may change specifically for face stimuli (Crookes and McKone, 2009
). Nevertheless, our data do not rule out the possibility of observing evidence from ERPs in favor of a qualitative view of the development of face processing in future studies testing sensitivity of these responses to individual faces (see below).
With respect to the P1, we found either massive changes with development that concerned all conditions equally, or differences between conditions that remained stable across development. These observations make it highly unlikely that P1 variations across age reflect specific changes in face processes, such as the ability to process faces as a whole pattern (holistic processing, Tanaka and Farah, 1993
), as previously suggested (Taylor et al., 2004
). As a matter of fact, recent ERP studies in adults, and behavioral evidence in children support this claim. For example, other P1 amplitude and latency variations in adults, for instance in response to inverted faces (e.g. Linkenkaer-Hansen et al., 1998
) appear to be driven mainly by low-level parameters (e.g. subject’s gaze fixation, Jacques and Rossion, 2009b
), and, contrary to the N170, do not correlate with behavioral effects (Jacques and Rossion, 2007
). Additionally, behavioral studies suggest that holistic processes are present at 4–6 years of age (e.g., Tanaka et al., 1998
; de Heering et al., 2007
) or even earlier in life (Cohen and Cashon, 2001
), and may not evolve quantitatively throughout development (Crookes and McKone, 2009
).
Basic-Level Face Categorization is Stable between 4 Years Old and Adulthood
The lack of face-specific, or even face-sensitive, changes across development at the level of the N170, by far the most widely investigated response to face stimuli (Rossion and Jacques, 2008
, 2010
), has several implications for our understanding of the neurofunctional development of face processing, and for future studies in this area of research.
While face recognition abilities improve tremendously with age, one has to be reminded that this concerns the ability of the system to distinguish novel from previously seen individual faces, or discriminate photographs of unfamiliar individual faces. However, as far as we know, there are no massive age-related improvements reported in the ability to categorize a visual stimulus as a face, i.e. to distinguish it from other visual categories. Improvements in figure-background segmentation and closure (Mooney, 1957
) may be observed with development, but again, they would reflect general visual recognition improvements rather than being face-specific. Hence, the observation of a stable ERP difference between faces and nonface objects across development, as reported here, is not that surprising. In particular, there is ample evidence indicating that the N170 represents the first stage of access to high-level face representations (Rossion and Jacques, 2008
). The present data indicate that this access may be slightly delayed in the youngest age groups, just as for other visually meaningful patterns. Yet, this basic-level face categorization appears functionally and qualitatively equivalent to what is observed in adults.
The observation of a stable N170 face effect across development stands, however, in contrast to the increase of the size of an area responding preferentially to faces in the right middle fusiform gyrus (fusiform face area, FFA; Sergent et al., 1992
; Kanwisher et al., 1997
) as reported in recent fMRI studies (Golarai et al., 2007
; see also Aylward et al., 2005
; Scherf et al., 2007
), for children between 7 and 16 years old. However, a recent fMRI study reported in this journal showed that face-sensitivity in the right FFA was mature at 7 years of age (Pelphrey et al., 2009
), an observation which is in line with our ERP findings. If, rather, a late maturation of the FFA is supported by future fMRI studies, it would suggests either that the right FFA does not contribute much to the N170 recorded on the scalp, or that the age-related effects observed in fMRI reflect late processes taking place in this area, rather than early access to face representations. Even though the N170 certainly originates from many cortical sources interlocked in time in the visual cortex, a large number of source localization studies indicate an important contribution of the middle fusiform gyrus (e.g., Rossion et al., 2003
; Deffke et al., 2007
; Henson et al., 2007
), making the first possibility very unlikely. Our data thus points to a relatively late, differential age-related contribution of the right FFA in face processing that is not captured by the early N170 response. In other words, the significant correlation between the size of the right FFA and recognition memory for faces may be due to memory or attention for faces rather than changes to early perceptual face processes.
Finally, even though our electrophysiological data do not offer any support for the qualitative view of the development of perceptual face processes, they should not be taken as a categorical rejection of this view, and should not dissuade others using ERPs to tackle this issue in the future. While some authors preferentially address this issue by testing the variations of the N170 parameters with simple stimulus variations such as inversion and negation, or isolation of facial features (e.g., Taylor et al., 2001
; Itier and Taylor, 2004b
), we would rather recommend measuring the sensitivity of the N170 component (isolated from other general age-related variations) in paradigms which can be more directly related to individual face perception abilities. In line with this suggestion, a number of relatively recent ERP studies have shown that the N170 does not only mark early access to face representations in the human brain, but is sensitive for individual face representation (Jacques and Rossion, 2006
). In particular, using face identity adaptation, it has been shown that the N170 is sensitive to the repetition of individual faces for upright but not inverted faces (Jacques et al., 2007
; Ewbank et al. 2008
), with a certain degree of generalization across viewpoint (Caharel et al., 2009a
), and based on 3D shape rather than 2D surface-related (texture, color) variations (Caharel et al., 2009b
). More pointedly, this early sensitivity to individual faces appears to be due to an early holistic perception of the face stimulus (using the composite face effect, Jacques and Rossion, 2009a
), a fundamental aspect of face perception that is at the heart of the debate about the qualitative view of the development of face perception in the human brain (Crookes and McKone, 2009
).
In other words, the present observations rule out the interpretation of developmental changes in the basic P1/N170 responses, and their face-sensitivity, as supporting age-related improvements in face processing. They do not at all, however, rule out the possibility that modulations of these responses by, for example, stimulus inversion (Taylor et al., 2001
; Itier and Taylor, 2004b
), or face identity repetition, show age-related changes that could be related to improvements of face recognition abilities during development. In fact, we would argue that the present work provides a better platform to test these hypotheses, and thus investigate the development of face recognition. In carrying out such studies however, one must be aware of a number of methodological issues and complications that arise during the analysis and interpretation of children’s data, in particular the huge amount of variance in amplitude, and latency of raw ERP responses that is evident particularly in young children’s data.
The authors declare that the research was conducted in the absence of any commercial or financial relationships that could be construed as a potential conflict of interest.
This work was supported by a grant from Communauté Française de Belgique – Actions de Recherche Concertées [07/12-007] Bruno Rossion, Dana Kuefner, Adélaïde de Heering and Corentin Jacques are supported by the Belgian National Fund for Scientific Research (Fonds de la Recherche Scientifique – FNRS). We thank two anonymous reviewers for their careful reading and commentaries on a previous version of the manuscript.
The Supplementary Material for this article can be found online at http://www.frontiersin.org/humanneuroscience/paper/10.3389/neuro.09/067.2009/
- ^ Given the small N170 latency delay in response to cars compared to faces (see latency analysis) which also concerned the small N170 responses to scrambled stimuli, we did not perform a direct subtraction of faces and cars, but compared these conditions indirectly through subtraction of their scrambled counterparts.
Jacques, C., d’Arripe, O., and Rossion, B. (2007). The time course of the inversion effect during individual face discrimination. J. Vis. 7, 3, 1–9, Available at: https://wwwofvision.org/7/8/3/
, doi: 10.1167/7.8.3.
Jacques, C., and Rossion, B. (2009a). The initial representation of individual faces in the right occipito-temporal cortex is holistic: electrophysiological evidence from the composite face illusion. J. Vis. 9, 8, 1–16, Available at: https://wwwofvision.org/9/6/8/
, doi: 10.1167/9.6.8.
Jacques, C., and Rossion, B. (2009b). Spatio-temporal dissociation between low- and high-level effects of stimulus inversion on early face-sensitive electrophysiological responses [Abstract]. J. Vis. 9, 533, 533a, Available at: https://wwwofvision.org/9/8/533/
, doi: 10.1167/9.8.533.
Lai, Y., van Drongelen, W., Ding, L., Hecox, K. E., Towle, V. L., Frim, D. M., and He, B. (2005). Estimation of in vivo human brain-to-skull conductivity ratio from simultaneous extra- and intra-cranial electrical potential recordings. Clin. Neurophysiol. 116, 456–465. doi: 10.1016/j.clinph.2004.08.017.
Malach, R., Reppas, J. B., Benson, R. R., Kwong, K. K., Jiang, H., Kennedy, W. A., Ledden, P. J., Brady, T. J., Rossen, B. R., and Tootel, R. B. (1995). Object-related activity revealed by functional magnetic resonance imaging in the human occipital cortex. Proc. Natl. Acad. Sci. U.S.A. 92, 8135–8139.
Rossion, B., Gauthier, I., Tarr, M. J., Despland, P., Bruyer, R., Linotte, S., and Crommelinck, M. (2000). The N170 occipito-temporal component is delayed and enhanced to inverted faces but not to inverted objects: an electrophysiological account of face-specific rocesses in the human brain. Neuroreport 11, 69–74.
Want, S. C., Pascalis, O., Coleman, M., and Blades, M. (2003). Face facts: is the development of face recognition in early and middle childhood really so special? In The Development of Face Processing in Infancy and Early Childhood, O. Pascalis and A. Slater, eds (New York, Nova Science Publishers), pp. 207–221.