Combined effects of attention and motivation on visual task performance: transient and sustained motivational effects
1
Department of Psychiatry and Behavioral Sciences, Emory University, Atlanta, GA, USA
2
Department of Psychological and Brain Sciences, Indiana University, Bloomington, IN, USA
We investigated how the brain integrates motivational and attentional signals by using a neuroimaging paradigm that provided separate estimates for transient cue- and target-related signals, in addition to sustained block-related responses. Participants performed a Posner-type task in which an endogenous cue predicted target location on 70% of trials, while motivation was manipulated by varying magnitude and valence of a cash incentive linked to task performance. Our findings revealed increased detection performance (d′) as a function of incentive value. In parallel, brain signals revealed that increases in absolute incentive magnitude led to cue- and target-specific response modulations that were independent of sustained state effects across visual cortex, fronto-parietal regions, and subcortical regions. Interestingly, state-like effects of incentive were observed in several of these brain regions, too, suggesting that both transient and sustained fMRI signals may contribute to task performance. For both cue and block periods, the effects of administering incentives were correlated with individual trait measures of reward sensitivity. Taken together, our findings support the notion that motivation improves behavioral performance in a demanding attention task by enhancing evoked responses across a distributed set of anatomical sites, many of which have been previously implicated in attentional processing. However, the effect of motivation was not simply additive as the impact of absolute incentive was greater during invalid than valid trials in several brain regions, possibly because motivation had a larger effect on reorienting than orienting attentional mechanisms at these sites.
At any point in time, adaptive behavior necessitates the selection of the most relevant information at hand. Visual attention is a key determinant of the selection of items that will ultimately impact behavior. Behavior is also shaped by motivational factors, which are often closely tied to reward and punishment. A growing body of evidence indicates that attention and motivation are intimately tied. Evidence for attention–motivation interactions is suggested by findings that stimuli carrying motivational significance preferentially engage attention, including stimuli with positive emotional valence (Anderson, 2005
; LaBar et al., 2001
; Mogg et al., 1998
, 2003
; Most et al., 2007
). Furthermore, findings from recent electrophysiological studies suggest that structures known to be involved in attention, such as the monkey lateral intraparietal area, also process information related to reward contingencies (Platt and Glimcher, 1999
; Sugrue et al., 2004
) and may be involved in the integration of attention and motivation (Bendiksby and Platt, 2006
). Finally, recent neuroimaging studies have started to probe the neural correlates of attention–motivation interactions in humans (Mohanty et al., 2008
; Small et al., 2005
). In spite of these recent advances, important gaps remain in our understanding of how attention and motivation contribute to behavioral performance. Indeed, despite intense recent interest in understanding the neural bases of motivation (Breiter et al., 2001
; Knutson et al., 2001
, 2005
; Schultz, 2000
), how motivation impacts fronto-parietal brain regions recruited during cognitive tasks to enhance performance has received scarce attention.
In a recent behavioral study, we reported that visual sensitivity increased as a function of absolute monetary incentive value, revealing that motivation enhanced detection sensitivity during a challenging attention task (Engelmann and Pessoa, 2007
). Based on these results, we proposed that increased motivation enhances attention, thus maximizing reward. More generally, we hypothesize that reward will lead to the calibration, or fine-tuning, of attention, leading to process-specific effects (e.g., increases in d′; Pessoa, 2009
; see also Libera and Chelazzi, 2006
). An important challenge when studying the contributions of motivation to evoked brain responses is to disentangle specific effects of motivation from relatively unspecific effects of arousal or effort. Here, we attempted to investigate this question by employing a hybrid experimental design that allowed us to estimate both transient and sustained response components (Visscher et al., 2003
). Participants performed a Posner-type task in which an endogenous cue predicted target location on 70% of the trials (Figure 1
A). Motivation was parametrically manipulated in a blocked fashion by varying the magnitude and the valence of a monetary incentive linked to task performance. Thus, transient components of the design corresponded to events associated with the processing of briefly presented cue and target stimuli. At the same time, sustained components corresponded to events that were maintained for the duration of the blocks. We hypothesized that, in addition to leading to sustained effects, motivation would selectively enhance cue- and/or target-related activity during task execution. We therefore employed an experimental design that allowed us to estimate the separate contributions of motivation on cue- and target-related processing, unlike in previous studies in which cue and target processing were not extricated from one another (e.g., Small et al., 2005
). Furthermore, by utilizing both valid and invalid spatial cues, we investigated the interaction between the validity of the spatial prediction and monetary incentive during the target phase of the task. Finally, because sensitivity to reward varies considerably across individuals, we hypothesized that the effects of incentive on brain responses would be largest in individuals with greater sensitivity to reward.
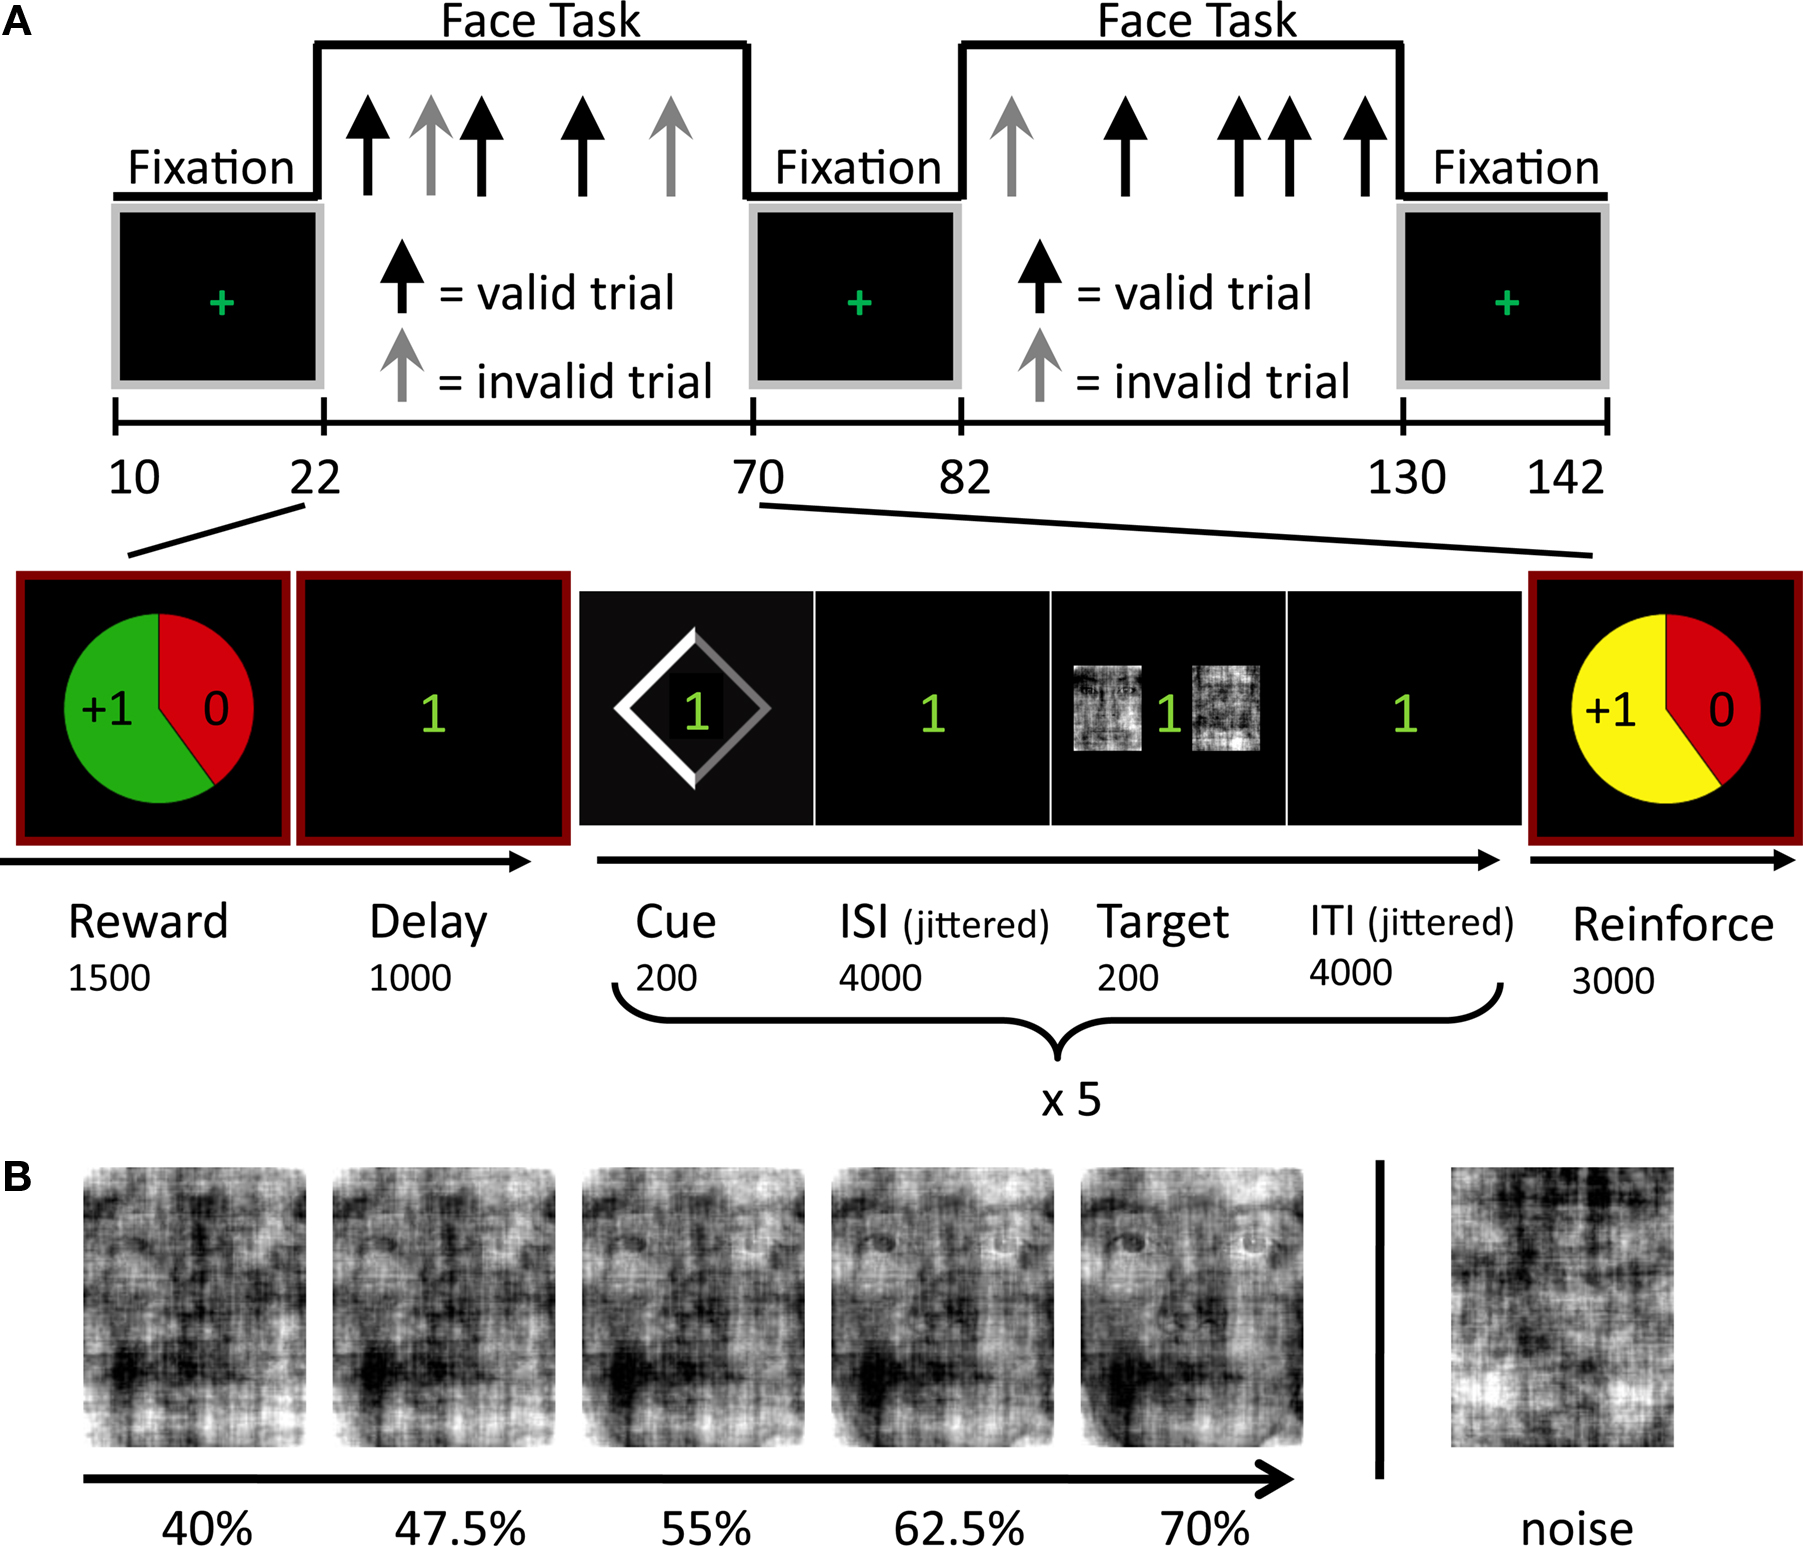
Figure 1. Experimental paradigm. (A) Face-task blocks, which alternated with simple fixation periods, included randomly intermixed valid and invalid trials. The block structure is displayed at the bottom row and included five face-localization trials. The cue stimulus validly indicated the location of the face stimulus in 70% of the trials. Note that both the interstimulus interval (ISI) and the intertrial interval (ITI) had variable durations ranging from 3000 to 8000 ms (average 4000 ms), to allow for the separate estimation of cue- and target-related evoked responses. (B) Example series of degraded faces employed during the behavioral session outside the scanner. The image on the right displays a “noise” image.
Participants
Twenty right-handed, healthy volunteers (25 ± 6 years old; 11 females) participated in the study, which was approved by the Indiana University Institutional Review Board. All participants gave written informed consent, had normal/corrected vision, and were in good health with no history of neurological or psychiatric disorders as assessed by a brief neuropsychiatric interview (MINI, 2002; Sheehan et al., 1998
).
Personality Inventories
Before fMRI scanning, participants completed the Behavioral Activation System (BAS) scale, which assesses multiple personality characteristics related to sensitivity to reward (Carver and White, 1994
). We were particularly interested in probing whether BAS scores would be correlated with transient (cue/target) and/or sustained responses, when incentive magnitude was varied. The BAS scale comprises three subscales and structural equation modeling has indicated that they do not form a unitary measure and should be treated separately (Ross et al., 2002
). In our analyses, we employed the BAS-drive subscale, which has the highest internal reliability (Carver and White, 1994
; Jorm et al., 1998
), has been suggested to be the strongest predictor of positive affective responses to reward (Beaver et al., 2006
), and has been proposed to be a clear measure of appetitive motivation and approach behavior (Dawe and Loxton, 2004
; Dawe et al., 2004
). Most correlations reported here were significant or approached significance when BAS “total” was considered.
Stimuli
The image database consisted of 200 gray-level faces that differed in identity and 300 gray-level random noise images (width = 4°; height = 5.5°). Noise images were generated by using phase information of random gray-level images, with amplitude information equated to the mean amplitude spectrum obtained from face images (Sadr and Sinha, 2001
, 2004
). Degraded face images were generated using linear interpolation between k% of the phase spectra of original face images and (100 − k)% of random phase spectra, followed by inverse Fourier transformation of the interpolated phase spectrum such that the mean amplitude spectrum was maintained. The resulting images were thus equated for overall spatial frequency and luminance/contrast given that only phase spectrum information was altered (Liu et al., 2002
; Sadr and Sinha, 2004
). For each facial identity, 20 levels of degradation were created at 1.5% steps, such that the final face images retained 40–70% of the original phase spectrum (Figure 1
B). Target stimuli comprised faces whose level of degradation was determined by a staircase procedure during training (see below). Distractor stimuli involved noise images.
Threshold Estimation Procedure During Training
Each participant’s approximate 79% correct perceptual threshold was assessed in a separate training session outside the scanner, which determined face degradation levels. The training session was conducted inside a “mock” scanner that simulated the actual scanning environment using visual presentation equipment identical to that used during scanning. Procedures employed during training were equivalent to those during the actual experiment, except that reaction time (RT) and accuracy feedback were provided on each trial, and participants did not receive additional cash for the incentives accumulated during the session.
An adaptive “one-up-three-down” staircase procedure was used to approximately track the 79% correct level for valid and, separately, invalid trials for each participant. To avoid subject expectancies, two staircase algorithms were employed per condition (i.e., two for valid and two for invalid trials), one starting at the highest degradation level and one starting at the lowest degradation level. The training session was terminated after all 4 staircases completed 12 reversals, or after 160 blocks (800 trials) were completed. The degradation values of the two same-condition staircases were then averaged. These degradation levels were used as starting points for additional training sessions conducted during the anatomical scan of each of the two subsequent fMRI sessions. The resulting final values remained fixed throughout the testing procedure, unless a participant’s performance was <70% correct during two subsequent runs within a session, which resulted in manual adjustment of degradation levels.
Behavioral Paradigm
Participants were instructed that the goal of the task was to win as much money as possible. The behavioral task is depicted in Figure 1
A. At the beginning of each block, participants were informed about reward/punishment contingencies via pie charts that reflected reward probability, reward magnitude, and valence. Participants were told that they had a 60% chance of winning (green background), or avoiding to lose (red background) an incentive whose value was indicated in the pie chart if they maintained adequate levels of accuracy and RT; the probability of winning was fixed throughout the experiment. Winning thus depended on a combination of chance and average performance. Specifically, participants were required to maintain 80% correct performance and mean response times below 755 ms during a block (the latter reflected the mean RT plus 3 standard deviations as obtained in pilot studies; if RT was slow during two consecutive runs of a session, this value was increased to 1000 ms). Participants could win either $1 or $4 and avoid losing $2.5 in a block. Zero-dollar blocks (no cash won/lost) were used as the neutral control condition. At the end of each block, participants were informed about the outcome via an animated pie chart presented together with the updated account total. At the end of the second fMRI session, participants were paid their earnings in addition to their base pay of $25/h. They received an average of $27 in additional earnings.
Within each blocked incentive condition, endogenous attention was manipulated on a trial-by-trial basis. Each one of five trials began with a 200-ms symbolic spatial cue, which correctly predicted target location on 70% of the trials (Figure 1
A, bottom). The diamond-shaped cue was presented just off of central fixation and consisted of a thinner gray and a thicker white side (width = 1.5°, height = 1.8°), the latter of which indicated target location. Cue offset was followed by a variable duration interstimulus interval (ISI) after which a degraded face-noise stimulus pair was shown for 200 ms to the left and right of fixation (4° eccentricity). Location was varied randomly and counterbalanced and images were repeated an equal number of times in each location and experimental condition. A variable duration intertrial interval (ITI) concluded the trial. Both ISI and ITI duration were jittered by drawing the interval from an exponential distribution with a mean of 4000 ms (range 3000–8000 ms). Responses occurred during the ITI; participants were given 1500 ms to respond. Participants were asked to report the target location as quickly and accurately as possible by pressing a button with their index finger when the target was on the left and another button with the middle finger when the target was on the right. Buttons were not counterbalanced to avoid spatial conflict. Participants were instructed to maintain fixation throughout the experiment. Stimuli were presented via Presentation software (Neurobehavioral Systems, Albany, CA, USA), which also recorded responses. Finally, visual stimuli were projected onto a frosted glass screen, which the subject viewed through an angled mirror mounted on the head coil.
Behavioral Performance
Trials with RT faster than 100 ms were excluded from the analysis. The sensitivity measure d′ (Green and Swets, 1966
) was used to characterize behavioral performance, as done in our recent behavioral study of motivation and exogenous attention (Engelmann and Pessoa, 2007
). Briefly, hits and false alarms were defined in terms of targets appearing on the left side of the display: hit rate was defined as the conditional probability that the subject responded “left” given that the target T was on the left, PHIT = P(“Target Left” | < T Left > ), and false alarm rate was defined as the conditional probability that the subject responded “left” given that the target was on the right, PFA = P(“Target Left” | < T Right > ), as suggested for spatial paradigms (Green and Swets, 1966
; Macmillan and Creelman, 1991
). D′ scores were obtained by entering hit and false alarm rates into the following equation:
where H and F are the hit and false alarm rate, respectively, and z(x) is the cumulative normal probability distribution function (i.e., left tail z-scores). Note that defining hits and false alarms in terms of the right side of the display leads to identical results given the symmetry of the trial definitions.
Image Acquisition and Data Analysis
MRI data were acquired using a 3 Tesla Siemens Magnetron Trio whole-body scanner (Siemens Medical Systems, Erlangen, Germany). For each subject, a 3-D high-resolution T1-weighted anatomical image was acquired using Siemens’ magnetization prepared rapid acquisition gradient echo sequence (TR of 1900 ms, TE of 4.15 ms, TI of 1100 ms, 1 mm isotropic voxels and a 256-mm FOV). Each subject performed 17–24 8-min runs in two sessions on separate days. During each run 194 EPI volumes were acquired (TR = 2500 ms, TE = 30 ms), each one consisting of 42 axial slices with 3-mm thickness and 3 mm × 3 mm in-plane resolution. In homogeneities in the magnetic field introduced by the participant were minimized with a standard 2-D head shimming protocol before each run.
Imaging data were preprocessed using AFNI
1
(Cox, 1996
). To allow for T1 equilibrium effects, the first four volumes from each run were removed. All the remaining volumes underwent slice-time correction using Fourier interpolation. The functional data from the first-session were spatially aligned to the volume acquired closest to each subject’s anatomical image acquired during that session. Next, a transformation matrix was determined that aligned the second-session anatomical data to those of the first-session. The functional data from the second-session were then co-registered to those of the first-session by employing the transformation matrix obtained from the anatomical data. All of the above steps employed the 3dvolreg tool from AFNI. Runs with excessive motion (1.5 times the voxel size) were removed, leaving 13–24 runs per subject. First- and second-session data were then concatenated. The functional datasets then underwent outlier processing and spatial smoothing with a 6-mm (full-width half-maximum) Gaussian filter. Subsequently, each voxel’s signal intensity was scaled to a mean of 100.
Voxelwise fMRI Analysis
Statistical analysis followed a multiple regression model. Sustained activity was modeled in terms of INCENTIVE (−$2.5, $0, $1, $4) as a box-car function spanning the onset of the first trial (i.e., following the first two displays of the block; see Figure 1
A) and the end of the last trial in the block. Event-related regressors included cue and target events. Cue-related activity was also modeled in terms of INCENTIVE (−$2.5, $0, $1, $4). To capture the potentially sustained response to the cues, which were shown for 200 ms and followed by a 3–8 s ISI, the entire duration of cue plus ISI was modeled. Target-related activity was modeled in terms of cue VALIDITY (valid, invalid) and INCENTIVE, too. Reinforcement-related activity was modeled in terms of outcome (won, lost, underperformed; the latter included all blocks that subjects did not maintain 80% correct performance and adequate RTs; see above). Instruction period-related activity was modeled in terms of INCENTIVE. Finally, error trials were modeled separately. All regressors of interest were convolved with a canonical hemodynamic response (Cohen, 1997
). For each run, constant, linear, and nonlinear terms modeled slow signal drifts. All contrasts reported involved correct trials only. As instruction and outcome-related activity were not the main focus of our study, they are not discussed further.
We optimized our design to allow for adequate estimation of cue- and target-related responses (Birn et al., 2002
). To do so, an “optimal” experimental sequence was obtained by randomly generating a large number (i.e., 10,000) of experimental sequences and choosing the top 24 (each sequence was used for a separate run) in terms of statistical efficiency. Because we were interested in investigating specific effects of motivation on attention, we orthogonalized both cue- and target-related regressors relative to the block-sustained regressors of the same incentive condition, which were thus uncontaminated by potential effects of arousal or effort; see also (Braver et al., 2003
). In addition, the correlations between the orthogonalized cue- and target-related regressors were negligible (r < 0.1). Because of the orthogonalization procedure, whereas sustained responses are indicated in percent signal change (Figures 4 and 5
), cue- and target-related responses are given in arbitrary units. To avoid confusion between fMRI responses that were sustained during cue processing (i.e., during the cue-target interval) and those that were sustained during blocks (i.e., state effects), we refer to the former as “cue-sustained”.
A standard two-stage mixed-effects, group analysis was performed in which regression coefficients for each condition of interest estimated at the first level were tested across subjects according to repeated-measures ANOVAs. To perform this group analysis, statistical images were initially normalized to Talairach space in AFNI (Talairach and Tournoux, 1988
). Furthermore, because we were interested in brain signals parametrically linked to our incentive manipulation, we probed cue-, target-, and block-related responses that increased as a function of absolute incentive value. To do so, we tested for a linear trend in the fMRI data because our previous behavioral data were well described by this relationship (Engelmann and Pessoa, 2007
). In particular, like in our previous experiment, working to avoid a punishment produced an effect with the same direction as positive incentives; see also (Kim et al., 2006
; Small et al., 2005
)
To deal with the multiple comparisons problem, we adopted the following approach. We initially created an activation mask that included all voxels significantly activated by any task component (i.e., cue + target + block vs. rest) at the 0.01 level corrected for multiple comparisons based on the false discovery rate (FDR; Genovese et al., 2002
). Within the activated set of voxels, we then searched for voxels based on repeated-measures ANOVAs. Activations shown in Table 2
are those that survived a 0.05 threshold with FDR correction based on the search space defined by the activation mask. One exception to this procedure concerned the reporting of VALIDITY by INCENTIVE interactions. Because the investigation of attention by motivation interactions was of theoretical interest, and because no significant voxels were observed when the FDR procedure was carried out, we also investigated activations detected at a threshold of 0.005 uncorrected (cluster extent: five voxels) – again, tests were only performed on voxels exhibiting significant task-related activation (i.e., within the general activation mask). Although the latter procedure does not control Type I error rate as completely as the first method, it may be viewed as a reasonable compromise in the context of minimizing Type II errors.
Region of Interest Analysis
We also probed how reward-related individual trait measures were correlated with evoked brain responses. To do so, we first created region of interests (ROIs) for regions containing voxels that exhibited a main effect of INCENTIVE that also followed a linear trend. This was done separately for each task phase (cue, target, and block). Only voxels that survived an FDR-corrected level of 0.05 were included in the ROIs, whose coordinate centers are provided in Table 2 and had a 6-mm radius. Linear trend coefficients were then averaged for all voxels within the ROI and the resulting value was correlated with an individual’s BAS-drive score. The correlation values shown in Table 2
are those for ROIs whose correlations were significant at the 0.05 level of statistical significance.
The maps shown in Figure 3
illustrate voxels exhibiting significant main effects of INCENTIVE at different task phases. To illustrate our results as a function of VALIDITY and INCENTIVE levels for key brain regions, we created ROIs for those regions in a manner analogous to that described above. To illustrate sustained activity throughout the block, the time series of the entire block were averaged across blocks and participants (“Sustained” panels of Figures 4 and 5
, and left panels of Figure 8
). In Figure 8
(right panels), sustained information is also shown in terms of the parameter estimates obtained from multiple regression for the block phase so as further illustrate parametric changes as a function of INCENTIVE. It is important to emphasize that the ROI results shown in Figures 4
,5
, and 8
are illustrative only so as to showcase the observed patterns of results. In other words, the results are not to be considered inferential, as these are provided by the statistical maps; see (Vul et al., in press) for some spirited comments on this issue.
Eye-Movement Data
We were able to acquire eye-movement data during fMRI data collection for four participants. Eye data were collected at 60 Hz via an Applied Sciences Laboratories (Bedford, MA, USA) eye tracker (ET6 long-range optics). Because our paradigm involved both valid and invalid trials, which could lead to differential eye movements, we assessed eye movements during the viewing of the target stimulus (e.g., eye movements might have occurred during an invalid trial to “correct” for the misleading cue information). To do so, for each trial, the horizontal and vertical eye position was inspected for the 200-ms duration of target presentation to see if fixation was maintained. Eye data confined to a radius of 1.8° from central fixation (obtained via calibration) was deemed to be proper fixation (trials involving eye blinks or noise contamination were discarded); otherwise, the trial was considered to involve an eye movement. Although we did not have enough subjects to run a statistical analysis, for each subject, the percentage of (artifact-free) trials containing eye movements was very similar for valid and invalid trials: S1: valid 7.1%; invalid 9.5%; S2: valid 11.7%; invalid 14.9%; S3: valid 31.0%; invalid 29.7% (note that this subject had a relatively high proportion of artifact-containing trials); S4: valid 1.1%; invalid 1.5%. Furthermore, eye movements did not increase as a function of absolute INCENTIVE for any of the four subjects (average $0: 14.4%, $1: 12.4%, $2.5: 12.4, $4: 8.6%).
Behavioral Results
Behavioral results were analyzed by submitting sensitivity scores (d′) to a 2 VALIDITY (valid, invalid) × 4 INCENTIVE (−$2.5, $0, $1, $4) repeated-measures ANOVA, which revealed main effects of VALIDITY [F(1,19) = 26.69, p < 0.001] and INCENTIVE [F(3,57) = 4.30, p < 0.01]. The VALIDITY × INCENTIVE statistical interaction was not statistically significant [F(3,57) = 1.83, p = 0.15]. The behavioral results thus indicate that INCENTIVE improved sensitivity (Figure 2
A). As in our previous behavioral experiment (Engelmann and Pessoa, 2007
), performance increased as a function of absolute incentive magnitude as indicated by a significant linear trend of incentive [F(1,19) = 10.78, p < 0.005), such that the −$2.5 condition behaved in the same direction as the positive incentives (note that, in this condition, participants worked to avoid losing money).
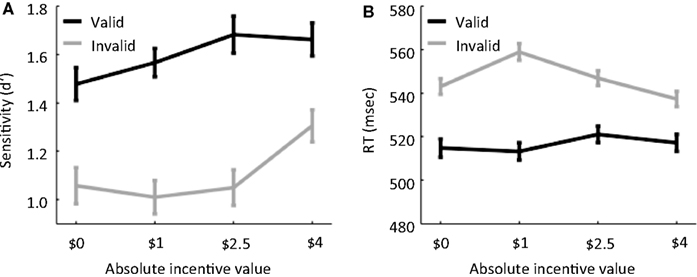
Figure 2. Behavioral results. (A) Sensitivity, measured via the signal detection theory measure d′, is plotted as a function of absolute INCENTIVE magnitude for both valid and invalid trials. (B) Reaction time is plotted as a function of absolute INCENTIVE magnitude for both valid and invalid trials. Error bars denote the standard within-subject error term (Loftus and Masson, 1994
).
Because our fMRI analyses employed correct trials only, we focused the behavioral analysis of RT on these trials, which revealed significant main effects of VALIDITY [F(1,19) = 39.68, p < 0.001] and INCENTIVE [F(3,57) = 3.48, p < .05]. As anticipated, subjects exhibited slower RTs during invalid (547 ms) relative to valid trials (516 ms). A significant VALIDITY × INCENTIVE statistical interaction was also observed [F(1,19) = 7.30, p < 0.001]; see Figure 2
B. To investigate the nature of this interaction, paired comparisons were conducted between the control and incentive conditions for each of the validity conditions. During valid trials, no significant differences between the control and the incentive conditions were observed [$0 vs. $1: t(19) = 0.31; $0 vs. −$2.5: t(19) = 1.20; $0 vs. $4: t(19) = −0.54], while during invalid trials, RTs were significantly slower during the $1 condition compared to the control condition only [$0 vs. $1: t(19) = −3.75, p < 0.001; $0 vs. −$2.5: t(19) = 0.96, p = 0.35; $0 vs. $4: t(19) = 1.49, p = 0.15]. In addition, during invalid trials, RT decreased from $1 to −$2.5 [t(19) = 3.27, p < 0.005] and from −$2.5 to $4 [t(19) = 2.76, p < 0.05].
To assess the possibility that subjects simply slowed down to improve detection performance in the higher-incentive conditions, we investigated speed/accuracy trade-offs. As done in our behavioral study (Engelmann and Pessoa, 2007
), each subject’s d′ scores were correlated with his or her RTs within each VALIDITY and INCENTIVE condition. No significant correlations were obtained (all p-values >0.2) suggesting that improvements in behavioral performance as a function of INCENTIVE were not associated with increased time-on-task (Table 1
).
Cue-Related Results
fMRI data were analyzed in a voxelwise manner via repeated-measures ANOVAs. Cue and block-related responses were assessed via one-way ANOVAs with four INCENTIVE levels (−$2.5, $0, $1, $4); target-related responses were evaluated via a 2 VALIDITY (valid, invalid) × 4 INCENTIVE (−$2.5, $0, $1, $4) ANOVA. Some of the representative results are shown in Figure 3 and a complete list of activation sites is provided in Table 2
. We will discuss cue-related findings first; target-related and block-sustained results will be discussed next.
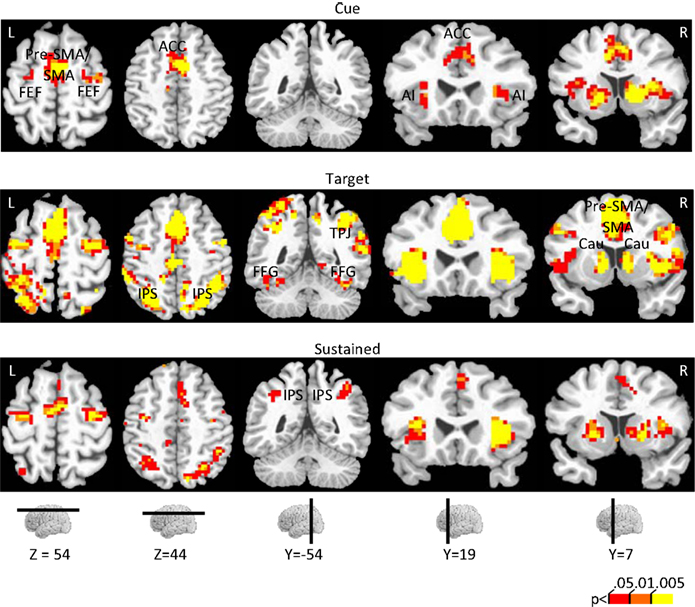
Figure 3. Effect of incentive on cue-related, target-related, and sustained responses. The color scale represents p-values corrected for false discovery rate. ACC, anterior cingulate cortex; AI, anterior insula; Cau, caudate; FFG, fusiform gyrus; FEF, frontal eye field; IPS, intraparietal sulcus; pre-SMA/SMA, pre-supplementary motor area/supplementary motor area.
A main effect of INCENTIVE during the cue period was observed in, among other regions, left posterior intraparietal sulcus (IPS), left middle frontal gyrus (MFG), right substantia nigra (SN)/midbrain, and, bilaterally, anterior cingulate cortex (ACC), pre-supplementary motor area/supplementary motor area (pre-SMA/SMA), frontal eye field (FEF), anterior insula, posterior cingulate cortex (PCC), caudate, putamen, and thalamus. To investigate the relationship between INCENTIVE level and evoked responses, we performed a linear trend analysis in terms of absolute incentive values, as done with the behavioral results and in our previous study (Engelmann and Pessoa, 2007
). All regions that exhibited a main effect of INCENTIVE during the cue phase, exhibited significant linear trends (see Table 2
). The results are illustrated for the FEF (Figure 4
A), ACC (Figure 4
D), and caudate (Figure 5
A). Some evidence of cue-related responses that increased with absolute INCENTIVE level was also observed in the fusiform gyrus (Figure 5
G), although these failed to reach statistical significance.
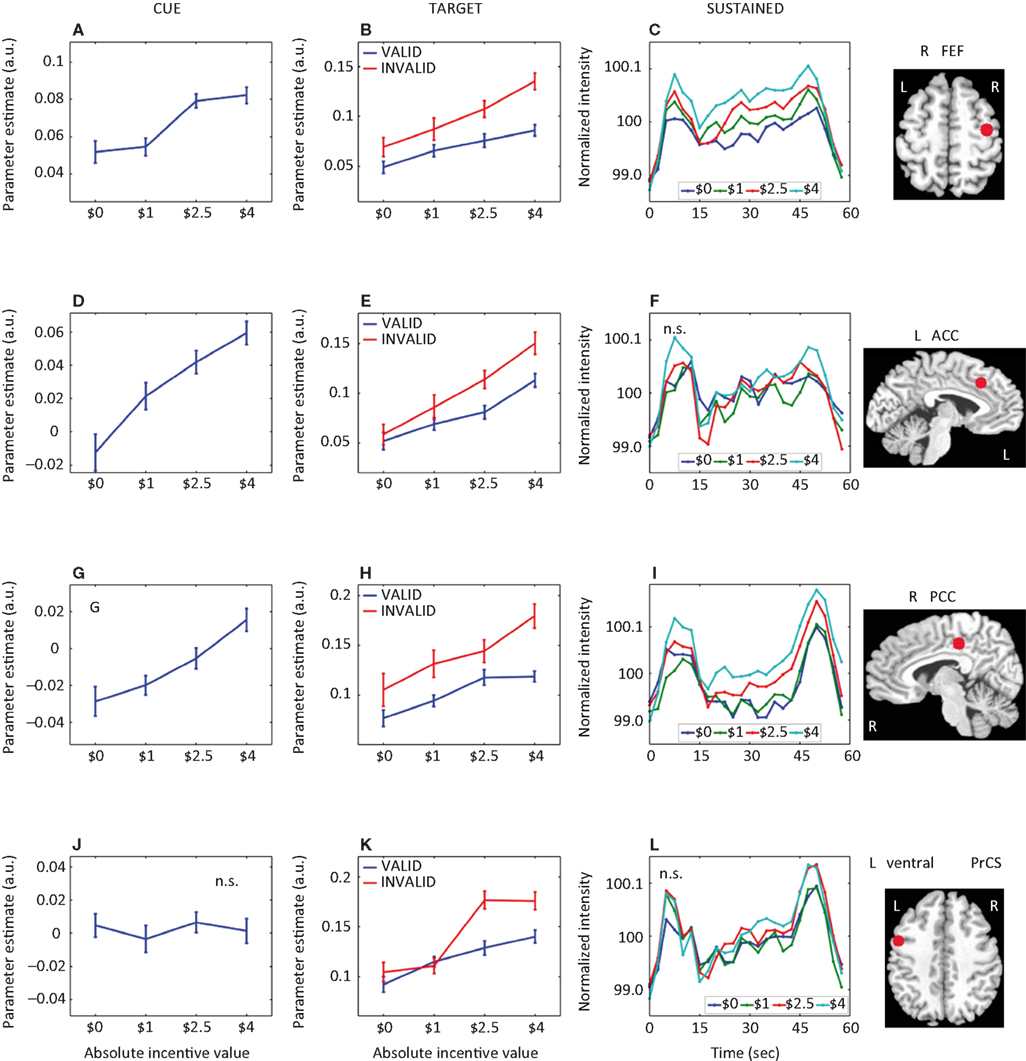
Figure 4. Parametric effects of absolute incentive magnitude on transient and sustained responses. The insets represent the location of the ROI from which the data plots are based. These plots illustrate the parametric effects observed in Figure 3
. Although error bars (standard within-subject error term; Loftus and Masson, 1994
), are included, the results should not be interpreted inferentially. ACC, anterior cingulate cortex; FEF, frontal eye field; PCC, posterior cingulate cortex; PrCS, precentral sulcus; A.U., arbitrary units; N.S., not significant.
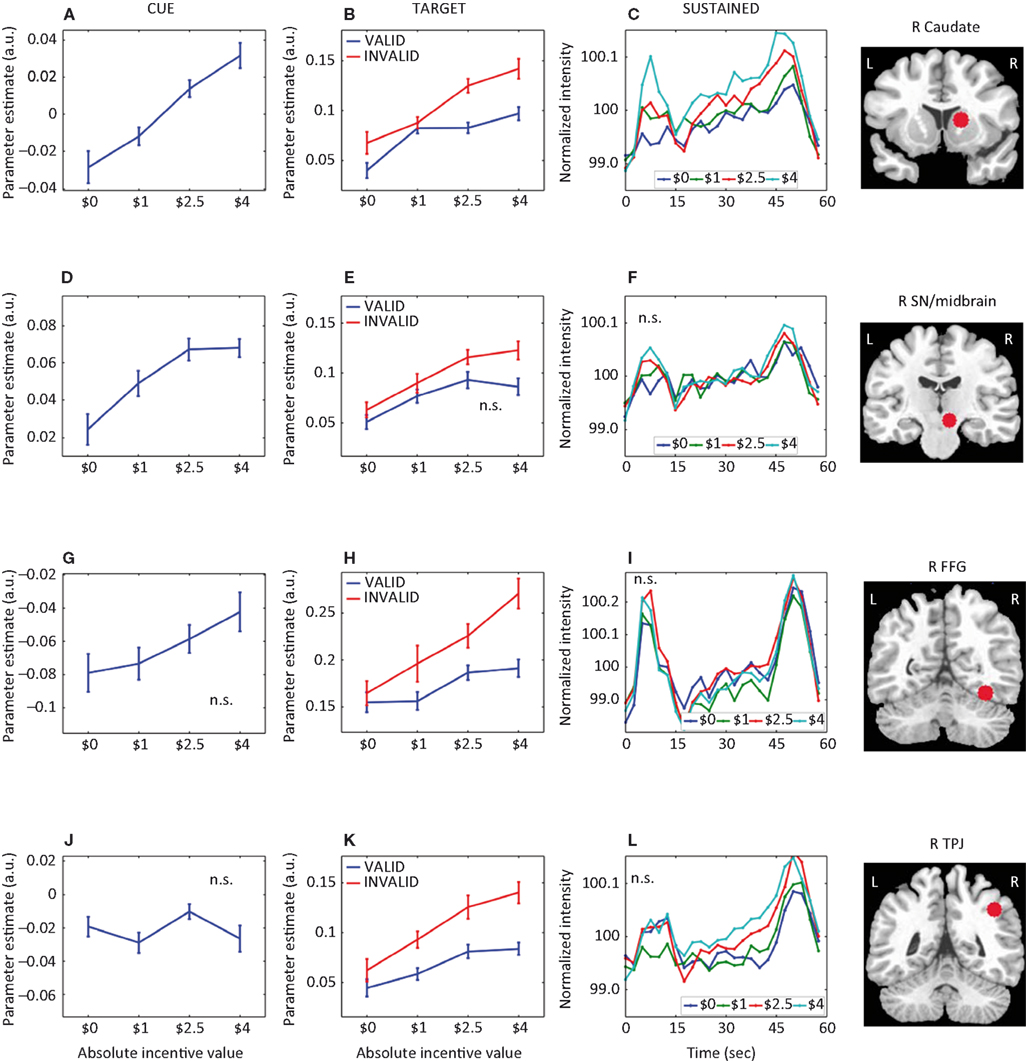
Figure 5. Parametric effects of absolute incentive magnitude on transient and sustained responses. The insets represent the location of the ROI from which the data plots are based. These plots illustrate the parametric effects observed in Figure 3
. Although error bars (standard within-subject error term; Loftus and Masson, 1994
), are included, the results should not be interpreted inferentially. FFG, fusiform gyrus; TPJ, temporo-parietal junction; SN, substantia nigra. A.U., arbitrary units; N.S., not significant.
Figure 6
illustrates the sustained nature of cue-related responses in the pre-SMA/SMA and FEF. To more clearly illustrate cue-sustained signals, we considered trials with ISIs of 5 s or longer (mean of 6 s) between the cue and target presentations. Given the timing of the cue and target stimuli, and the normal time course of hemodynamic responses (Boynton et al., 1996
), activation at 7.5 s reflected mainly cue-related signals that were sustained during the ISI (the effect of the 200-ms cue itself would be expected to peak around 4–6 s after cue onset; the effect of the target stimulus would be expected to start 2–4 s after target onset, roughly at 8–10 s after trial onset, on average). The time courses thus help illustrate that the strength of the cue-sustained activation was proportional to the absolute magnitude of INCENTIVE.
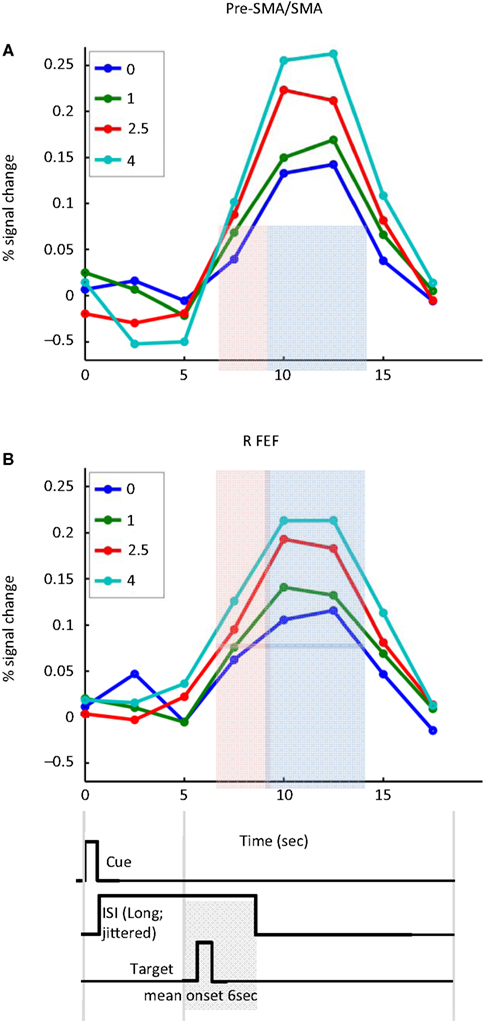
Figure 6. Cue-sustained responses. Estimated cue-related responses are shown for the left pre-supplementary motor area/supplementary motor area (pre-SMA/SMA) (A) and right frontal eye field (FEF) (B) for trials with long cue-target ISIs (average of 6 s). The light red shaded area indicates the time point that would be expected to reflect cue-sustained signals (based on the canonical hemodynamic response). Because the target stimulus was shown on average 6 s following trial onset (and no earlier than 5 s), the impact of the target would be expected to be observed during the time points indicated in light blue. Note that sustained cue responses were sensitive to absolute incentive magnitude. No assumptions about hemodynamic shape were made in the estimation of the time course. The timing diagram of the events is approximate and cue/target ISIs were “long” (5–8 s; mean target onset time is diagrammed).
Target-Related Signals
Target-related activation that exhibited a main effect of INCENTIVE was quite extensive, as illustrated in Figure 3
(Table 2
list all sites, including the main effect of VALIDITY). Parameter estimates as a function of INCENTIVE are illustrated for several regions in Figures 4 and 5
. Interestingly, target-related responses parametrically modulated by absolute INCENTIVE magnitude were observed throughout visual cortex, including right V1/V2 and, bilaterally, inferior occipital gyrus (IOG), middle occipital gyrus, fusiform gyrus (Figure 5
H), and inferior temporal gyrus. Parametric effects of INCENTIVE were also observed in the right temporo-parietal junction (TPJ), a region that is implicated in the reorienting of attention (Corbetta et al., 2000
; Kincade et al., 2005
; Thiel et al., 2004
). Because attention was manipulated by the inclusion of valid and invalid trials, we sought to investigate the interaction between motivation and attention during target processing. Interactions were observed in several regions, including right IOG, bilateral fusiform gyrus (Figure 5
H), left ventral precentral sulcus (Figure 4
K), left anterior insula, and left caudate (Table 2
). For these regions, the effect of INCENTIVE was stronger during invalid trials.
It is important to note that the effects of incentive on cue- or target-related responses are not simply explained by the pattern of RT results (i.e., time-on-task effects). For instance, $4 trials evoked the largest (or close to the largest) fMRI responses in most regions but were not associated with the longest RT (see Figure 2
); see also the evaluation of speed/accuracy trade-offs above. Furthermore, no significant fMRI differences between valid and invalid trials were observed during the control $0 condition (even when p = 0.2, FDR correction). In contrast, RTs were different for valid and invalid trials during the $0 control condition (Figure 2
B). Collectively, these results suggest that target-related responses are not explained by RT results. The absence of an fMRI difference for valid and invalid trials for the $0 condition also indicates that slight stimulus differences during the target period (due to the independent staircases for valid and invalid trials; see Section “Materials and Methods”) did not confound evoked responses in visual cortex.
Block-Sustained Signals
Next, we investigated how responses sustained throughout the block were modulated by incentives (Figure 3
). Except for one region, all sites that exhibited a main effect of INCENTIVE also exhibited significant linear trends (Table 2
). These included bilateral IPS, bilateral FEF (Figure 4
C), right ventral precentral sulcus (Figure 4
L), right MFG, and bilateral anterior insula. Inspection of Table 2
also clarifies whether regions that showed transient signals that were modulated by INCENTIVE also exhibited sustained responses that increased with motivation. For instance, for the right FEF (Figures 4
A–C), both transient (cue and target) and sustained responses increased as a function of INCENTIVE. For the left ACC (Figures 4
D–F), however, block-sustained signals were unaffected by INCENTIVE level. Conversely, the IPS did not exhibit cue-related responses that parametrically increased with absolute INCENTIVE level, but block-sustained responses exhibited such modulation. In general, there appears to be at least a partial dissociation between the effects of motivation on transient and sustained responses.
The investigation of block-sustained signals also revealed considerable “deactivations” that varied as a function of absolute INCENTIVE level (Figure 7
; Table 2
, Default Network). In fact, linear trend analysis revealed significant negative slopes for all the regions, including ventromedial prefrontal cortex (PFC) (Figure 8
A), PCC (Figure 8
B), and middle temporal gyrus bilaterally (Figure 8
C).
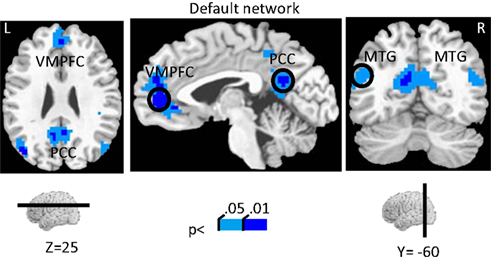
Figure 7. Effect of incentive on sustained responses in the default network. The color scale represents p-values corrected for false discovery rate. The circles outline the approximate locations of the ROI results shown in Figure 8
. MTG, middle temporal gyrus; PCC, posterior cingulate cortex; VMPFC, ventromedial prefrontal cortex.
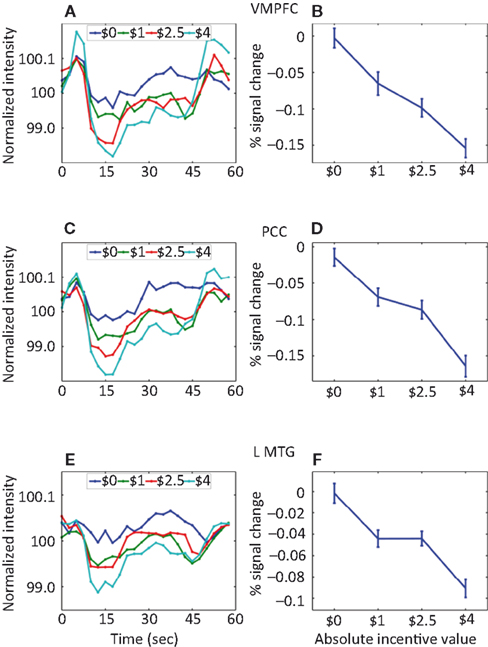
Figure 8. Parametric effects of absolute incentive magnitude on sustained responses in the default network. These plots illustrate the parametric effects observed ROIs of the default network. (A,C,E) Average time course during the block. (B,D,F) The parametric effect of incentive is illustrated in terms of coefficients obtained from multiple regression fits. Although error bars (standard within-subject error term; Loftus and Masson, 1994
) are included, the results should not be interpreted inferentially. MTG, middle temporal gyrus; PCC, posterior cingulate cortex; VMPFC, ventromedial prefrontal cortex.
Personality-Related Signals
Finally, we also probed how reward-related individual trait measures were correlated with evoked brain responses. To maximize statistical power, we performed these analyses in an ROI-based fashion (see Section “Materials and Methods”) and correlated BAS-drive scores with the linear trend estimates of the cue, target, or block periods. The results for the cue and block periods are shown in Table 2
as no significant correlations were observed during the target period. Significant correlations between BAS-drive and cue-related activity were observed in bilateral FEF (Figure 9
A), bilateral PCC, bilateral ACC, pre-SMA/SMA, and left anterior insula. In the FEF, a median split of the data also illustrates that the relationship was considerably enhanced for the group of participants with “high” compared to “low” BAS-drive scores. Significant correlations between BAS-drive and block-sustained activity were observed in the left MCC, pre-SMA/SMA (Figure 9
B), left FEF, and bilateral anterior insula. Again, in the pre-SMA/SMA a median split of the data illustrates that the relationship was robust for “high”- but not “low”-BAS individuals.
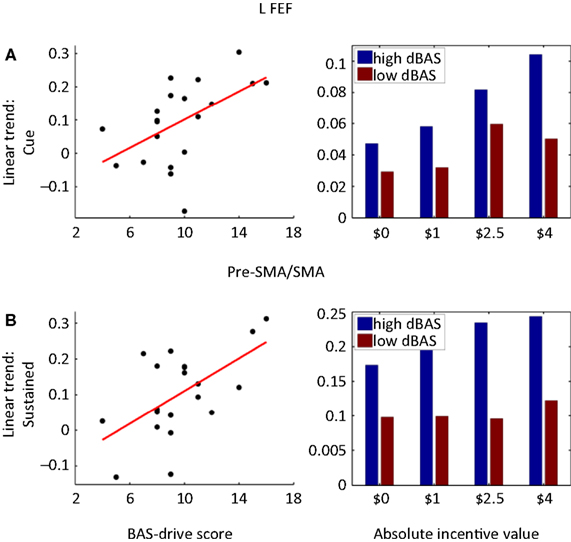
Figure 9. Brain responses and reward sensitivity. (A) Correlation between BAS-drive scores and the linear trend estimate (as a function of incentive magnitude) for cue-related responses in the left frontal eye field (FEF). (B) A median split of the participants in terms of BAS-drive scores indicates that cue-related responses increased as a function of absolute incentive for high BAS-drive individuals, but less so for low BAS-drive individuals. (C) Correlation between BAS-drive scores and the linear trend estimate (as a function of incentive magnitude) for sustained (i.e., block-related) responses in the pre-SMA/SMA. (D) A median split of the participants in terms of BAS-drive scores indicates that sustained responses increased as a function of absolute incentive for high BAS-drive individuals, but not for low BAS-drive individuals.
In the present study, we investigated the combined effects of attention and motivation during a challenging visual task. Behaviorally, sensitivity to target faces increased as a function of absolute incentive magnitude. In a parallel fashion, brain signals revealed that increases in absolute incentive led to cue- and target-specific response modulations that were independent of sustained state effects. State-like effects of incentive were observed in many brain regions, too. For both cue and block periods, the effects of administering incentives were correlated with individual trait measures of reward sensitivity. Taken together, our findings support the notion that motivation improves behavioral performance by enhancing evoked responses across a distributed set of anatomical sites. However, the impact of motivation was not always additive, as evaluated by explicitly testing for attention by motivation interactions during the target period of the task. In all cases, incentive had a steeper effect on transient responses evoked during invalid vs. valid trials, suggesting that motivation may have had a greater effect on reorienting than orienting mechanisms at these sites.
Behavior
Attention shapes behavior by selecting stimuli that are task-relevant at the expense of task-irrelevant information (in the case of endogenous attention). Motivation shapes behavior by reinforcing those actions that are thought to increase an organism’s fitness in the environment. In the present study, motivation was parametrically varied as a function of the magnitude and the valence of cash incentives during the performance of a difficult visual task. Our behavioral findings revealed selective effects of motivation on attention, namely, target-detection performance improved with higher-incentive magnitude – note that behavioral performance did not improve at the expense of an increase in false alarms (i.e., reporting face stimuli at noise-stimuli locations). Furthermore, performance was not simply better because participants slowed down responses in an attempt to make fewer errors during higher-incentive conditions. In fact, during invalid trials, RTs were fastest during the high-incentive $4 condition (no significant differences in RT were observed during valid trials). Taken together, our behavioral findings suggest that motivation sharpens the effects of visual attention, increasing the behavioral benefit of attention during endogenous attention conditions.
One aspect of the behavioral results that deserves further discussion is that a validity by incentive interaction was observed for the RT data. Furthermore, during invalid trials, RTs decreased from $1 to $2.5, and from $2.5 to $4 (in terms of absolute incentive levels). Because RTs are customarily thought to reflect the cost of using the invalid attentional cue, the more the cue information is utilized, the higher the anticipated RT cost would be (Posner and Cohen, 1984
). From this perspective, the RT results would suggest that motivation decreases cue processing, which would constitute evidence counter to our assertion above that motivation enhances attention. However, because RTs pool together multiple processes, an alternative explanation is that more efficient overall processing is observed during invalid trials as a function of incentive level resulting in a net decrease of RT. For instance, one plausible mechanism through which incentives might decrease RT during invalid trials may be by enhancing participants’ efficiency to disengage from an invalidly cued location. Although in need of further corroboration, this interpretation is consistent with the neuroimaging results (see below) that showed increases in both cue- and target-related evoked responses as a function of absolute incentive level – and with the increased d′ scores observed.
Relatively few studies have probed the effects of motivation during attention tasks. Derryberry found no effects of positive or negative non-monetary incentives (“points” that could be earned) on the orienting of visual attention, although current-trial incentive interacted with the behavioral outcome (success/failure) of the previous trial (Derryberry, 1989
). In contrast, in an earlier study, we observed motivation effects on both orienting (valid trials) and reorienting (invalid trials) of exogenous spatial attention (Engelmann and Pessoa, 2007
). Participants were asked to indicate the location of a peripherally cued target while ignoring a distracter (70% validity). Motivation was manipulated by varying the magnitude and valence of a cash incentive linked to task performance. Like in the present experiment, performance was assessed via the sensitivity measure d′. Increases in sensitivity were observed as positive ($0 to $4) and negative ($0 to −$2) incentives increased in absolute magnitude during both valid and invalid trials. In a related fashion, Libera and Chelazzi (2006) showed that the efficacy of visual attention was modulated by cash rewards. In particular, inhibition of distractors was robust after high rewards and poor after low rewards. Taken together with the present behavioral results, these findings provide converging evidence that motivation enhances attention during challenging visual performance (Pessoa, 2009
).
Neuroimaging
In the present study, we were also interested in investigating selective effects of motivation on brain responses during task performance. To do so, we investigated cue- and target-related activity, while removing block-sustained effects that may have been driven by arousal or effort. The timing of cue and target stimuli was jittered to allow for robust estimation of process-specific contributions to the fMRI signal. In addition, we searched for activations that were parametrically modulated by absolute incentive magnitude during both the cue and target task phases. It should be emphasized, however, that because our design did not include an explicit “neutral” (i.e., spatially uninformative) cue condition, our paradigm did not allow us to explicitly evaluate attention by motivation interactions during cue processing, namely, during the anticipatory allocation of attention (compare to other recent studies, e.g., Mohanty et al., 2008
; Small et al., 2005
). However, the use of both valid and invalid trials, allowed us to probe attention by motivation interactions during target processing, which involves the orienting of attention, among other functions.
Like in the study by Small et al. (2005)
, similar effects were observed during conditions involving winning or avoiding to lose money. Regions that exhibited robust incentive modulation of cue-related responses included the posterior IPS, ACC, pre-SMA/SMA, FEF, MFG, and anterior insula. All of these regions are important nodes of the fronto-parietal attentional network, and have been shown to exhibit cue-related activity (Hopfinger et al., 2000
; Kastner et al., 1999
). Previous studies have shown that top-down signals are sustained during the temporal gap between the cue and the target stimuli (Hopfinger et al., 2000
; Kastner et al., 1999
; Shulman et al., 1999
). Our findings are consistent with the notion that cue-related responses during top-down attentional control are sustained and, critically, show that these signals carry motivational value. Interestingly, related modulations of delay-period cell firing reflecting reward magnitude have been observed in monkey dorsolateral PFC (DLPFC), too (Leon and Shadlen, 1999
; Watanabe, 1996
). Finally, several subcortical areas exhibited cue-related responses that were parametrically modulated by absolute incentive level, including the caudate, putamen, thalamus, and SN/midbrain. These results are of special interest because several of these structures are intimately involved in the processing and encoding of reward in the brain (Cromwell et al., 2005
; Hollerman and Schultz, 1998
; O’Doherty et al., 2004
). In particular, the SN is a key dopaminergic center and is an important modulator of PFC cortical activity during motivated behavior (Alexander et al., 1986
; Hollerman et al., 2000
). Note that although the coordinates for the midbrain site that we observed are consistent with the SN (Seymour et al., 2004
; Tobler et al., 2007
), this link must remain speculative because of the spatial resolution of fMRI and the size of this structure.
We observed target-related responses that were modulated by motivation throughout the brain. In particular, we observed a parametric increase of target-evoked signals in the TPJ, which has been identified as an important region involved in exogenous attention mechanisms, especially during the redirection of attention upon the processing of an invalid spatial cue (Corbetta et al., 2000
; Kincade et al., 2005
; Thiel et al., 2004
). Our findings extend previous results by suggesting that these regions may be involved in the generation of reorienting signals, whose strength is parametrically boosted by motivational signals. Interestingly, in general, we observed a trend for stronger responses during invalid relative to valid trials, consistent with previous studies showing increased responses during attentional reorienting (Arrington et al., 2000
; Kincade et al., 2005
). In a related fashion, validity by incentive interactions were observed in several regions, including ventral precentral sulcus, anterior insula, caudate, and fusiform gyrus. Successful behavior in our task depended on a difficult face detection task. Because the fusiform gyrus may have been the recipient of reorienting signals that increased as a function of absolute incentive value, a stronger effect of motivation may have been observed during invalid than valid trials.
We employed an experimental design in which incentive was manipulated in a blocked fashion, allowing us to investigate sustained responses throughout the block and how they were modulated by motivation. State-like effects were observed in several brain regions, including the PCC, IPS, pre-SMA/SMA, FEF, ventral precentral sulcus, MFG, IFG, and anterior insula. Although relatively little is known about sustained motivational signals, in a recent study, Locke and Braver (2008). reported increased sustained activity during rewarded blocks of a cognitive control task in a network of regions including the right lateral PFC, right parietal cortex, and dorsal medial frontal cortex. Interestingly, in the present study, several regions thought to belong to the “default network” (Fox and Raichle, 2007
) were also modulated by incentives, but in a negative fashion. In other words, greater levels of absolute incentive level led to larger decreases of evoked responses relative to baseline. In addition, regions of the default network did not exhibit significant effects of incentive during transient task phases.
Taken together, our study revealed that motivation had parametric effects on both transient and sustained responses in several brain regions. In particular, our results suggest that regions involved in the control of attention, including the IPS, ACC, pre-SMA/SMA, FEF, MFG, and anterior insula are modulated by incentives in at least two ways. First, by increasing their sustained levels of activation in proportion to incentive values, and second by boosting transient, evoked responses in a way that also increases as a function of motivation. For instance, the right FEF showed clear evidence of sustained blocked activity that increased with absolute incentive value. Superimposed on the sustained responses, transient responses to both the cue and the target were also observed to be parametrically modulated by incentive. However, the effects of motivation on transient and sustained responses also revealed dissociations. For instance, bilateral ACC and left MFG exhibited transient responses that parametrically increased with incentive level, while no systematic relationship between sustained-response magnitude and incentive value was observed.
In the present experiment, we were unable to measure eye movements during task execution, except in a limited number of participants. Therefore, it is conceivable that some of the cue-and/or target-related activations reflected increased eye movements and not an increase in absolute incentive value. This may have occurred because subjects may have employed anticipatory eye movements in an attempt to improve target detection, especially during higher-incentive conditions. Note, however, that for the four subjects for whom eye date were acquired, similar proportions of eye movements were made during valid and invalid trials and these did not increase as a function of incentive level.
Previous research has demonstrated that individual differences in stable personality traits, such as appetitive motivation, extraversion, and neuroticism, exhibit a modulatory influence on neural activations in a number of experimental settings. A consistent result is the modulation of neural responses to emotional stimuli by individual differences in personality, such as images depicting food items (Beaver et al., 2006
), positively and negatively valenced faces (Canli et al., 2001
, 2002
; Reuter et al., 2004
) and faces depicting aggressive expressions (Beaver et al., 2008
). A modulatory role of personality has also been demonstrated in the context of cognitive tasks used to investigate working memory (Gray and Braver, 2002
; Gray et al., 2005
), cognitive control (Locke and Braver, 2008
), fear and reward learning (Hooker et al., 2008
), and decision-making involving risk (Cohen et al., 2005
; Leland et al., 2006
; Paulus et al., 2003
). In our attentional task, several brain regions showed correlations between linear increases in cue-related processing with reward with an individual’s appetitive motivation and approach behavior, as indexed by the drive subscale of the BAS scale. Important fronto-parietal regions exhibiting significant correlations included the ACC, pre-SMA/SMA, FEF, and anterior insula. In other words, the effect of incentive magnitude on cue-related responses was greater for participants with high reward sensitivity (high BAS-drive scores) relative to those with low reward sensitivity (low BAS-drive scores). These results illustrate that trait motivation levels affect the extent to which cue processing is enhanced by monetary incentives. Surprisingly, no effect of reward sensitivity was observed during the target period of the task. Finally, reward sensitivity was also correlated with block-sustained responses in several brain regions, including the pre-SMA/SMA, FEF, and anterior insula.
A wealth of human neuroimaging studies has described brain regions that are involved in the representation of reward (Breiter et al., 2001
; Knutson et al., 2001
, 2005
; Schultz, 2000
). However, how motivation impacts other brain regions that contribute to improving behavioral performance, has received much less attention; see (Braver et al., 2007
; Pessoa, 2009
). Important steps in attempting to fill in this gap have been taken in recent years. For instance, Pochon et al. (2002) reported increases in activation in common DLPFC sites due to increased working memory demands (3-back vs. 1-back task) and to increased reward. In another working memory study, recall performance was higher during rewarded than during unrewarded trials, as was the level of DLPFC activation during a delay interval (Gilbert and Fiez, 2004
). Recent fMRI studies have started to investigate the neural bases of attention–motivation interactions, too. For instance, Small et al. (2005)
employed a Posner-type task in which target detection occurred under three incentive conditions (reward, punishment, and neutral; see also Bagurdes et al., 2008
). Activation in the PCC was correlated with cue benefit (i.e., faster RTs during valid relative to non-directional cues), and winning and avoiding to lose money enhanced this relationship. In addition, activity in the inferior parietal lobule was correlated with disengagement (the degree to which invalid cues compromised performance), and this relationship was also enhanced by monetary incentives. In a subsequent study, Mohanty et al. (2008)
measured fMRI responses to central cues predicting locations of peripheral targets that were motivationally relevant (food) or not (tools). Posterior parietal cortex, posterior cingulate, and the orbitofrontal cortex displayed correlations with the speed of attentional shifts that were sensitive not just to motivational state (hunger/satiety), but also to the motivational value of the target (i.e., food items during hunger). An intriguing suggestion from the above studies by Mesulam and colleagues is that the PCC may constitute an important site for the integration of motivational and spatial attention information. In the present study, the PCC also exhibited motivation and attention signals. Indeed, not only did the PCC exhibit cue-, target-, and block-related responses that increased with absolute incentive value, but increases in cue-related and block-sustained responses with incentive were correlated with BAS-drive scores.
The present findings add to the growing literature that investigates how motivation interacts with attention to determine an item’s impact on behavior. In particular, our results add several pieces of information. First, they allowed us to parse the contributions of motivation on cue and target responses. While target-related effects were pervasive, cue-related contributions were observed in a more restricted set of regions. Of particular importance, several structures believed to be involved in the top-down control of attention, including ACC and FEF, were parametrically modulated by incentive magnitude. This suggests that “control” signals evoked in these structures take into account the motivational significance of an upcoming target when deploying processing resources toward that item. Second, our design allowed us to investigate how motivation impacts the processing of target stimuli following either valid or invalid cues. Whereas most regions exhibited similar effects of motivation on target processing during both trial types, specific sites revealed differential contributions of incentives on evoked responses. Steeper slopes during invalid relative to valid trials were observed in the IOG, fusiform gyrus, ventral precentral sulcus, and caudate. These results demonstrate an interaction between attention and motivation and are consistent with the notion that incentives operate more vigorously on these structures during the reorienting of attention than during orienting processes (note, however, that invalid trials involve not only the reorienting of attention, but also several other functions, including expectation violation, inhibition, etc.). Third, our study allowed us to parse the contributions of motivation on both transient and sustained task components. This is particularly noteworthy given that previous studies may have confounded unspecific effects of motivation and more process-specific ones. In particular, our findings revealed that state-like effects were present in several brain regions, including those that exhibit transient effects of motivation. Such was the case for the FEF, a key attentional region, which exhibited parametric increases in response strength during all three main experimental periods (i.e., cue, target, and block). At the same time, dissociations were noted, illustrating that while the effects of motivation are multifaceted, they are distinct across brain regions. Finally, our results also support the notion that cognitive and motivational mechanisms may produce a common effect upon visual cortex (Small et al., 2005
) to enhance processing that is relevant to the behavioral goal at hand.
The authors declare that the research was conducted in the absence of any commercial or financial relationships that could be construed as a potential conflict of interest.
This work was supported in part by the National Institute of Mental Health (award 1R01 MH071589 to Luiz Pessoa) and by a grant from the American Psychological Association (to Jan B. Engelmann). We would like to thank Andrew Bauer for assistance with figures. In addition, the reviewers are to be thanked for feedback and critiques that substantially improved the present paper.
Braver, T. S., Gray, J. R., and Burgess, G. C. (2007). Explaining the many varieties of working memory variation: dual mechanisms of cognitive control. In Variation in Working Memory, A. R. A. Conway, C. Jarrold, M. J. Kane, A. Miyake and J. N. Towse, eds (Oxford, Oxford University Press), pp. 76–106.
Sheehan, D. V., Lecrubier, Y., Sheehan, K. H., Amorim, P., Janavs, J., Weiller, E., Hergueta, T., Baker, R., and Dunbar, G. C. (1998). The Mini-International Neuropsychiatric Interview (M.I.N.I.): the development and validation of a structured diagnostic psychiatric interview for DSM-IV and ICD-10. J. Clin. Psychiatry 59(Suppl. 20), 22–33; quiz 34–57.