 Ottavia M. Epifania
 Pasquale Anselmi
 Egidio Robusto
- Department of Philosophy, Sociology, Pedagogy, and Applied Psychology, University of Padova, Padua, Italy
Several options are available for computing the most common score for the Implicit Association Test, the so-called D-score. However, all these options come with some drawbacks, related to either the need for a license, for being tailored on a specific administration procedure, or for requiring a degree of familiarity with programming. By using the R shiny package, a user-friendly, interactive, and open source web application (DscoreApp) has been created for the D-score computation. This app provides different options for computing the D-score algorithms and for applying different cleaning criteria. Beyond making the D-score computation easier, DscoreApp offers the chance to have an immediate glimpse on the results and to see how they change according to different settings configurations. The resulting D-scores are immediately available and can be seen in easy-readable and interactive graphs, along with meaningful descriptive statistics. Graphical representations, data sets containing the D-scores, and other information on participants' performance are downloadable. In this work, the use of DscoreApp is illustrated on an empirical data set.
1. Introduction
The Implicit Association Test (IAT; Greenwald et al., 1998) is one of the most common measures for assessing the strength of automatically activated associations between concepts. The resistance to self-presentation strategies (Egloff and Schmukle, 2002; Greenwald et al., 2009) and its ease of adaptation to different topics (Zogmaister and Castelli, 2006) make the IAT broadly used in studies on various issues, ranging from consumers behaviors (e.g., Karnal et al., 2016) and addiction behaviors (e.g., Chen et al., 2018) to self–esteem (e.g., Dentale et al., 2019) and personality traits (e.g., Steffens, 2004). Given its ability of overcoming self–presentation biases, the IAT finds many applications in social cognition studies, where it is employed for assessing implicit attitudes toward different social groups (e.g., Anselmi et al., 2015).
A convenient measure of the strength and direction of the implicit association assessed by the IAT is the D-score algorithm (Greenwald et al., 2003), for which different variations are available. The differences between each of the algorithms mainly concern the treatment for error and fast responses, while the core procedure for its computation is the same.
Despite many options are available for the D-score computation, like SPSS syntaxes, R packages, Inquisit scripts, they all come with some drawbacks. The use of SPSS syntaxes requires the SPSS license, programming skills are required for using R packages, and Inquisit scripts are tailored on Inquisit administration procedure. The aim of this study is to present an interactive Web Application for the computation of the D-score able to combine an easy and intuitive User Interface (UI) with the computational power of R, while being completely Open Source.
2. The Implicit Association Test—IAT
The IAT procedure (depicted in Table 1) is typically composed of seven different blocks, and is based on the speed and accuracy with which different type of stimuli (appearing sequentially at the center of the screen) are sorted in their reference categories (displayed at the top corners of the screen). Three blocks (Blocks 1, 2, and 5) are practice blocks, in which either object stimuli (e.g., images of flowers and insects in a Flowers-Insects IAT) or attribute stimuli (e.g., Positive and Negative words) are sorted in their reference categories. In the first associative condition (Blocks 3 and 4), flowers images and positive words are mapped with the same response key, while insects images and negative words are mapped with the opposite response key. In the second associative condition (Blocks 6 and 7), the labels for categorizing flowers and insects stimuli switch their positions on the screen. Thus, flowers images and negative words are mapped with the same response key, and insects images and positive words are mapped with the other response key. The categorization task is supposed to be easier in the condition consistent with respondents' automatically activated association (the so-called “compatible condition”) than in the condition against their automatically activated association (the so-called “incompatible condition”). In a more general fashion, the two associative conditions can be arbitrarily identified as Mapping A (e.g., Blocks 3 and 4) and Mapping B (e.g., Blocks 6 and 7). The difference between respondents' performance in the two conditions results in the IAT effect that can be easily interpreted by means of the D-score.
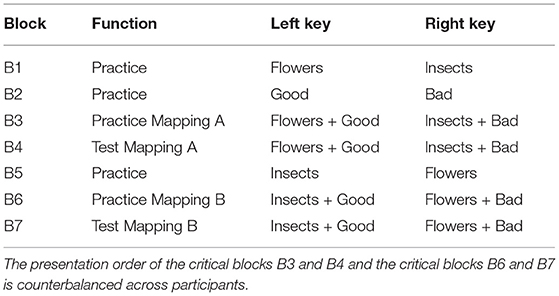
Table 1. IAT blocks and conditions, adapted from Greenwald et al. (2003).
The IAT administration procedure might include a feedback strategy, for which a red cross appears on the screen every time a stimulus is incorrectly categorized. Participants are then asked to correct their response to continue the experiment.
2.1. The D-Score
The D-score algorithms result from the combination of the various error correction and lower tail treatment strategies (“Error inflation” and “Lower tail treatment” in Table 2).
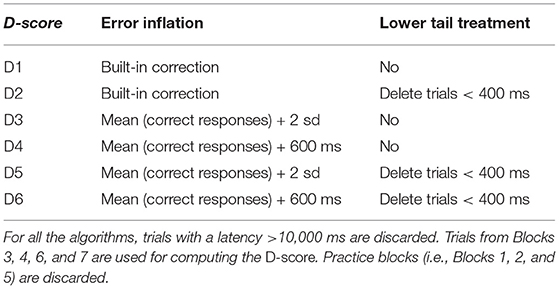
Table 2. Overview of the D-score algorithms.
Grounding on the IAT administration procedure, the error correction may apply either a built-in or an ex post correction. In the former case (D1 and D2), the response time considered for the D-score computation is the time at the first incorrect response increased by the time required to correct it. In the latter case (D3, D4, D5, and D6), the error response is replaced by the average response time of the block in which the error occurred, increased by a fixed penalty (i.e., either 600 ms or two times the standard deviation of the block response time). The D-score algorithms differ also according to the lower tail treatment, which concerns the decision to discard fast trials (< 400 ms) or not. Once the treatments for the error and fast responses have been applied according to the chosen algorithm, the D-score can be computed. Firstly, the D-scores for associative practice blocks (Equation 1) and associative test blocks (Equation 2) are computed:
and
In both cases, the difference in the average response times between the two critical blocks is divided by the standard deviation computed on the pooled trials of both blocks. Once the D-scores for practice and test blocks are obtained, it is possible to compute the actual D-score:
The blocks order in Equations (1) and (2) is arbitrary, and can be reversed. The interpretation of the D-score clearly follows the order with which the subtraction between the blocks is computed. For instance, if the D-score of the Flowers-Insects IAT illustrated in Table 1 is computed following the blocks order in Equation 1 (MB6 − MB3) and Equation 2 (MB7 − MB4), a positive score would stand for a possible preference for flowers over insects (that is, faster responses would have been observed in B3 and B4 compared with B6 and B7). Vice versa, if the order of the blocks in Equation 1 and in Equation 2 is reversed (MB3 − MB6 and MB4 − MB7, respectively), a positive score would stand for a possible preference for insects over flowers.
Several options (illustrated in Table 3) are available for computing the D-score, namely Inquisit scripts, SPSS syntaxes, and R packages.
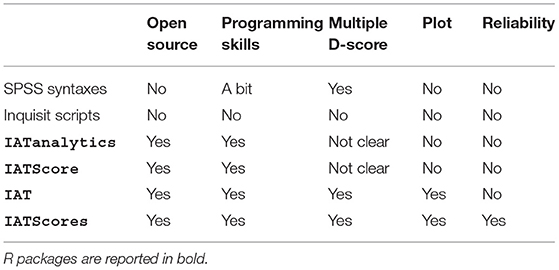
Table 3. Overview of the available options for computing the D-score.
Inquisit scripts are probably the most straightforward way for obtaining the D-score since they compute it right after the IAT administration procedure and store the result along with other information on participants' performance (e.g., response time for each IAT trial, correct and incorrect responses). Nonetheless, these scripts work only when associated with the Inquisit administration procedure, and they can compute just one of the available D-score algorithms. Finally, Inquisit requires a license to be used.
SPSS syntaxes provides several information on participants' performance, and they are not tied to a specific administration software. Nonetheless, their use requires a certain degree of expertise with SPSS language, and SPSS license.
R provides the open-source alternative to both Inquisit scripts and SPSS syntaxes. Both IATanalytics and IATScore packages by Storage (2018a) and Storage (2018b) provide the users with just the function for computing the D-score. IATScore gives the chance to compute the score also for Brief-IAT (B-IAT; Sriram and Greenwald, 2009). Both IAT and IATScores provide functions for cleaning the original data set, for plotting the data, and for computing the different D-score algorithms. So far, only IATScores has built-in functions for computing IAT reliability (i.e., split–half and the test–retest IAT reliability).
Regardless of the specific R package one wants to use, the data preparation is not straightforward and easy. For some of the packages (e.g., IATanalytics), the columns identifying the variables for the computation of the D-score have to follow a specific order, otherwise the computation will fail. Also the coding of the variables might result counterintuitive: For example, in IAT package, error responses have to be coded as 1 and correct responses have to be coded as 0. Moreover, in both IATanalytics and IATScore it is possible to compute the D-score for just one participant at a time, and it is not well specified which D-score is computed. None of the above mentioned options provides the users with graphical representations of the D-scores.
An interactive tool able to combine a user–friendly interface with the computational power of R and its open source philosophy could represent an optimal solution for the D-score computation, also for researchers with no experience with coding. Additionally, this tool might be of convenience for researchers more experienced in coding and data analysis that want to obtain a quick overview of IAT results.
In the next sections, the functioning of DscoreApp is illustrated through a practical example.
3. The Chocolate-IAT Data Set
Data comes from the responses of 152 participants (F = 63.82%, Age = 24.03 ± 2.82) to a Dark-Milk Chocolate IAT. This IAT was developed for the assessment of dark and milk chocolate implicit preference. It followed the structure depicted in Table 1. The two critical conditions were made out of 60 trials each (i.e., 20 trials in each associative practice block and 40 trials in each associative test block). The associative condition in which Milk chocolate was associated with negative words and Dark chocolate was associated with positive words was identified as Mapping A (i.e., .Milkbad in Figure 1). Vice versa, the associative condition in which Dark chocolate was associated with negative words and Milk chocolate was associated with positive words was identified as Mapping B (i.e., .Milkgood in Figure 1). In case of an erroneous stimulus categorization, participants received no feedback. Results obtained from this data have been previously published in Epifania et al. (in press).
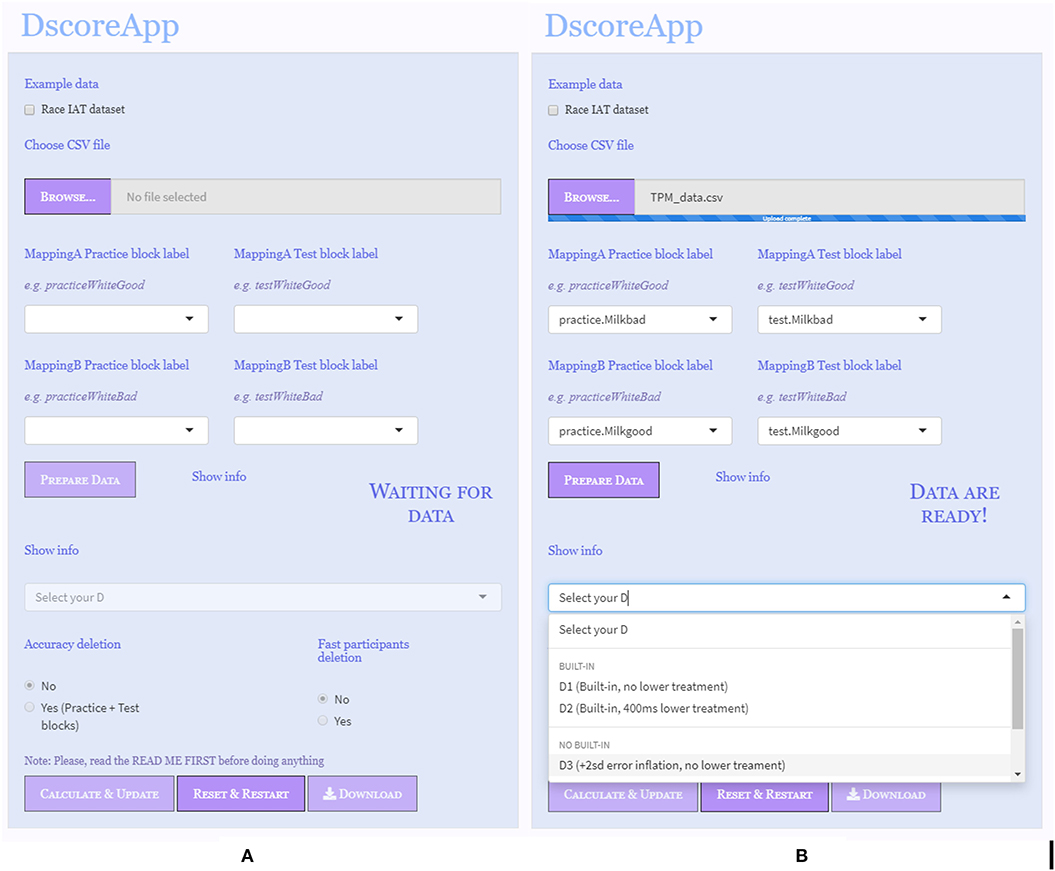
Figure 1. Input panel. (A) Data correctly uploaded. (B) Data ready for computation.
4. DscoreApp
DscoreApp was developed in R (R Core Team, 2018) by using shiny (Chang et al., 2018) and shinyjs (Attali, 2018) packages. DscoreApp can be retrieved at the URL: https://fisppa.psy.unipd.it/DscoreApp/, and its source code is available on GitHub. DscoreApp is platform independent, and is distributed under a MIT license. The UI is designed to be as clear and straightforward as possible, and the pop–up menus for the different functions are meant to make the use of the app more intuitive and interactive. The app is organized in different panels (i.e., “Input,” “Read me first,” “D-score results,” and “Descriptive statistics”) that will be presented in the next sections.
4.1. Read Me First Panel
The “Read Me First” panel includes important information regarding the app functioning. The interactive structure allows the users to jump directly to the instructions section they are interested in, making the information on the different app functions easily accessible. The Download Template button can be used to download a CSV template suggested for using the app. However, it is not strictly necessary to use the provided CSV template, or to specify the variables in the same order as in the template. As long as the uploaded file is in a CSV format (with comma set as separator) and contains the variables for the D-score computation with the same names as the variables in the CSV template, the app will work. Specifically, the data frame must contain a variable identifying participants' IDs (participant), the labels identifying the four critical blocks of the IAT (block), the latency of the responses expressed in milliseconds (latency), and the variable identifying the accuracy responses (correct).
The pure practice blocks (Blocks 1, 2, and 5) must be removed before using the app. If they are not removed, the app will throw an error. The block variable must be a character string that uniquely identify the four critical blocks of the IAT. This variable contains the information for distinguishing between the practice and test blocks of the two mapping conditions, such as “practiceMappingA,” “praticeMappingB,” “testMappingA,” and “testMappingB.” The specific name of each level is not important, as it is not important the order with which they have been presented to participants. In case the blocks labels are not unique, the app will throw an error. If the IAT administration procedure included a built-in correction, the latency variable must contain the already inflated response times. Otherwise, it must contain the raw response times. Finally, the correct variable must be a numeric variable with just two possible values, namely 0 identifying incorrect responses and 1 identifying correct responses. Usually, accuracy responses are automatically coded as 0 for incorrect and 1 for correct responses by the software for the IAT administration, unless otherwise specified by the users.
The “Read me first” panel also provides information about the different D-score algorithms, the blocks order for the D-score computation (i.e., MappingB−MappingA), and the downloadable file that can be retrieved at the end of the computation. Further details on the downloadable file are given in Section 4.5. The blocks order for the D-score computation can be changed by reversing the Mapping A and Mapping B labels (see section 4.2).
4.2. Input Panel
In the starting state of the app, none of the buttons are enabled, and the input drop-down menus for labeling the blocks are empty. The app comes with a toy data set that can be used to familiarize with the app functions, and that can be uploaded by clicking on the checkbox Race IAT dataset. Users can upload their own data by means of the Browse button.
Two different states of the “Input Panel” are illustrated in Figure 1.
Figure 1A depicts the app state when the data set has been correctly uploaded and read by the app. The name of the uploaded file and its extension appear right next to the Browse button. The labels of the four different blocks, as they are named in the data frame, are shown into their—alleged—positions (i.e., “MappingA practice block label,” “MappingA test block label,” “MappingB practice block label,” “MappingB test block label” in Figure 1A). In case the uploaded data set has some problems, like it uses another column separator than the comma, the app will not be able to distinguish between the columns, and the drop-down menus for the assignment of the blocks labels will be empty. Users can redefine the labels for each block by clicking and selecting from the drop-down menus. To reverse the direction of the D-score, and hence the interpretation of its meaning, users can switch the labels for Mapping A and Mapping B. The Prepare Data button becomes active when the data are correctly uploaded and the labels for each level of the IAT blocks are defined. Once the Prepare Data button has been clicked and data are ready for the D-score computation, the alert message “Waiting for data” becomes “Data are ready,” and the Select your D drop-down menu is enabled (Figure 1B). A brief description of the D-score algorithms is given next to each option.
The IAT administration procedure of the example data set did not include a built-in correction strategy, and hence a D-score algorithm with an ex post strategy for the error responses was chosen, specifically the D3 one. Since the default direction for the D-score computation is (MappingB−MappingA), positive scores stand for faster response times in associating Milk chocolate with negative words and Dark chocolate with positive words.
The Calculate & Update button and the Graphic display options become active after a D-score has been selected, as well as the Accuracy cleaning option and the Fast participants cleaning option. The Accuracy cleaning option refers to the elimination of participants with an high percentage of incorrect responses in at least one of the two associative conditions, either Mapping A or Mapping B (Nosek et al., 2002). The default threshold is set at 25%, and participants with an error percentage exceeding this threshold are discarded. Users can modify the default threshold via the Error percentage option (active only when the “Yes” option of Accuracy Cleaning is selected). The Fast participants cleaning refers to the elimination of participants with more than 10% of trials with responses faster than 300 ms (Greenwald et al., 2003). If one of these options is selected, the results of the participants meeting these elimination criteria are not displayed in the “D-Score results” panel, but their D-scores, and the information on their performance, will still be available in the downloadable file.
The Download button is enabled after the first D-score is computed.
4.3. D-Score Results Panel
When the Calculate & Update button is clicked, results appear in the “D-score results” panel (Figure 2). The Calculate & Update button must be clicked every time users want to make a settings change effective, otherwise the app will not be updated.
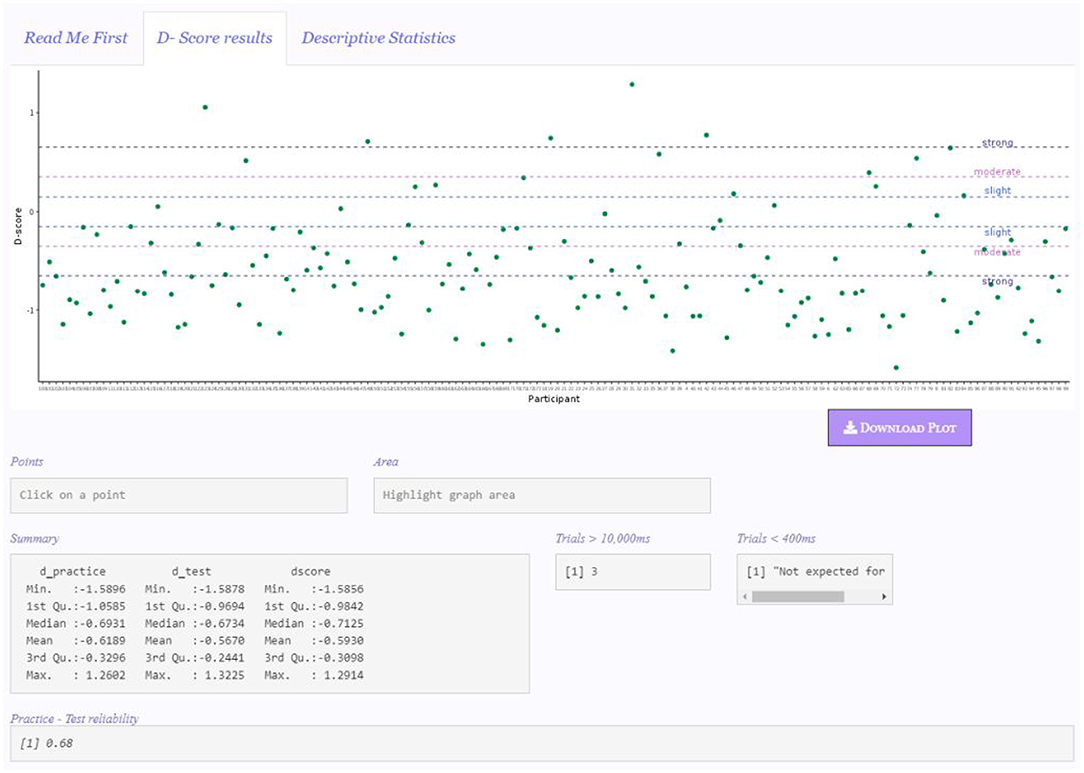
Figure 2. Results panel.
Despite not shown in Figure 2, the “Input Panel” remains visible on the left side, so that users can constantly check the specific configuration for the computation of the D-score.
The first object appearing in this panel is the graphical representation of the results, for which various options are available (“Points,” “Histogram,” “Density,” “Histogram + Density,” see section 4.3.1 for further details). The functioning of the Points and Area boxes is illustrated in section 4.3.1 as well. The default graph appearing is a points graph depicting each participant's D-score.
In the Summary box, the descriptive statistics (i.e., Minimum, First Quartile, Median, Mean, Third quartile, and Maximum) of D-practice, D-test, and D-score are presented. The Trials >10, 000 ms box reports the number of trials discarded because of a response time higher than 10,000 ms. If no trials meet this elimination criterion, the message “None” is displayed. When a D-score algorithm that eliminates trials faster than 400 ms (i.e., D2, D5, D6) is selected, the Trials < 400 ms box reports the number of discarded trials, otherwise the “Not expected for this D” message is shown, as in the example. Finally, the Practice-Test reliability box shows the IAT reliability computed as the correlation between Dpractice and Dtest across all participants (Gawronski et al., 2017).
Figure 2 depicts the app appearance when the default settings are used (e.g., no participants are discarded, the plot of the D-score is the default representation plot). However, users are given the chance to customize the settings configuration for the D-score computation, and the display of the results, according to various criteria. For instance, if the Accuracy cleaning option is selected, the box Accuracy deletion would appear, reporting the number of participants with an error percentage higher than the selected threshold (if any). Likewise, if the Fast participants cleaning option is selected, the box Participants < 300 ms appears, reporting the number of participants with more than 10% of responses with latency faster than 300 ms (if any).
By looking at the graphical representation and the summary statistics of the results, it pops out that respondents' tended to have a preference (dislike) for Milk (Dark) chocolate, since they tended to be faster in Mapping B associative condition (i.e., the condition in which Milk chocolate was associated with positive words and Dark chocolate was associated with negative words). Moreover, the majority of the D-scores tended to have a strong effect (see section 4.3.1).
4.3.1. Graphic Display
DscoreApp provides the possibility to visually inspect the D-score results (Figure 3), both at the individual level (Figure 3A) and at the sample level (Figures 3B–D). The lines for interpreting the D-scores effect sizes are drawn at ±0.15 (“slight”), at ±0.35 (“moderate”), and at ±0.65 (“strong”), consistently with the guidelines in Project Implicit Website.
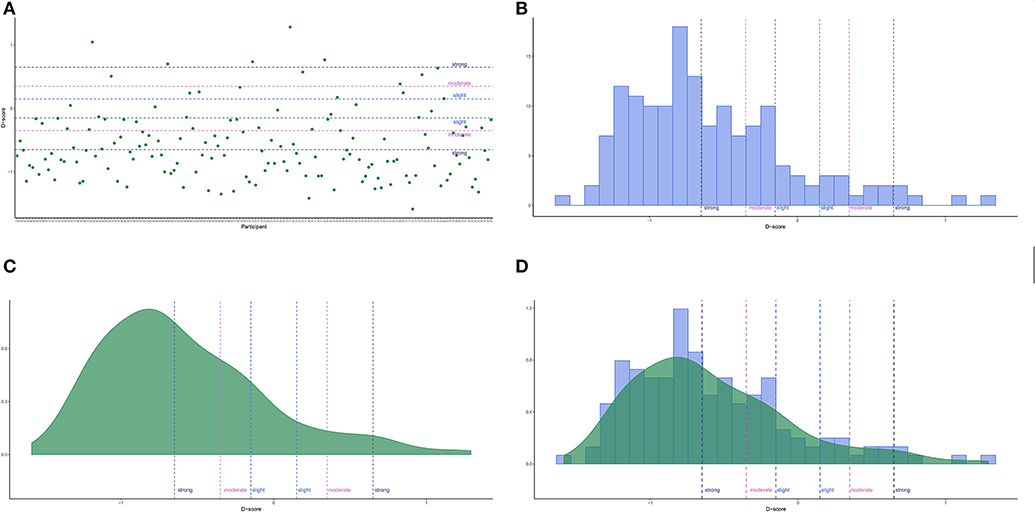
Figure 3. Shiny App graphical representations. (A) Points (default). (B) Histogram. (C) Density. (D) Histogram and Density.
Users can customize the graphs to have a better inspection of the results. For instance, in the point graph participants order can be arranged by changing the options in the Point graph drop-down menu. The default representation (“None”) follows the order participants had in the original data frame, while the “D-score: Increasing” and “D-score: Decreasing” options arrange participants by increasing or decreasing D-score, respectively. In the graphs including the histogram representation (Figures 3B,D), users can set the number of displayed bins by means of a slider, which appears only when either the “Histogram” or the “Histogram + Density” options are selected.
Graphical representation is a convenient way for inspecting the results, particularly for identifying extreme scores. However, it might be difficult to pinpoint a particular score in the graph, and then to link it to the corresponding participant in the data set. DscoreApp provides two useful and handy tools for linking specific points or area of the graphs to the corresponding participants and their D-scores. By clicking on a point in the points graph, the ID and the D-score of the participant corresponding to that point will appear in the Point box. By selecting an area in any of the graphs, the IDs and D-scores of the participants in the selected area will appear in the Area box.
All the graphs are downloadable by clicking on the Download graph button, which will be active only after the first graph is displayed. The default name of the graph will contain the type of graph and the specific D-score it shows. In the example in Figure 2, the default name will be “PointDefaultDscore3.pdf.” All the graphs have a.pdf extension.
In the depicted example, five participants showed a D-score far from other participants' D-scores. By using the area highlighter, as illustrated in Figure 4, it is possible to immediately and conveniently identify the IDs of these participants (see Area box in the figure), and to check for any particular response pattern resulting in these scores in the original data set. Within these five participants, it is possible to note that there is also the participant obtaining the maximum D-score of the sample, namely Participant 31 (see Summary box in Figure 2).
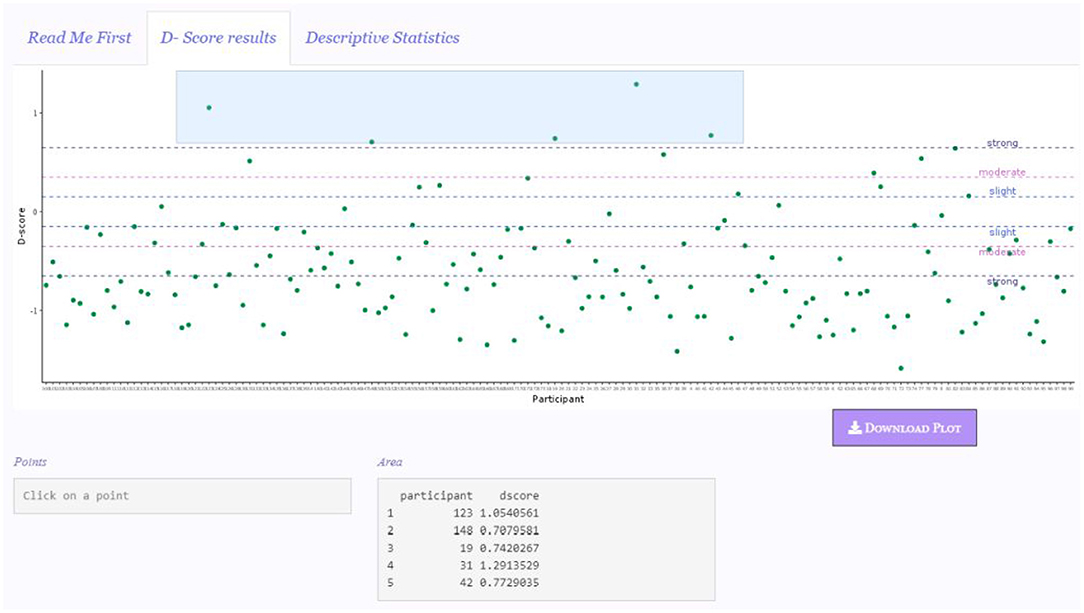
Figure 4. Area highlighter for detecting participants' D-score.
4.4. Descriptive Statistics Panel
Figure 5 depicts the appearance of the “Descriptive statistics” panel.
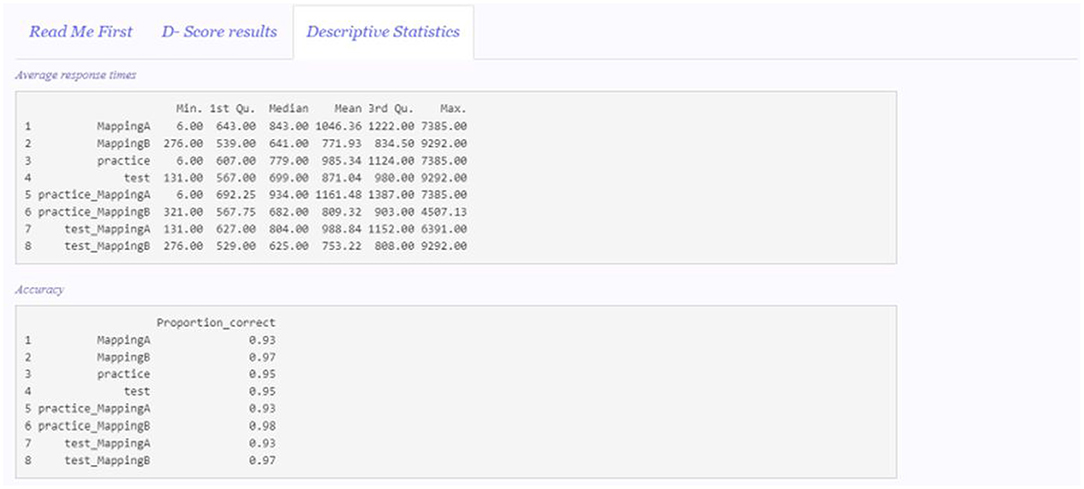
Figure 5. Descriptive statistics panel.
The average response times and the proportion of correct responses in each of the mapping conditions and blocks of the IAT are reported. MappingA and MappingB include all the trials in both practiceMappingA and testMappingA and practiceMappingB and testMappingB, respectively. Practice blocks trials (practiceMappingA and practiceMappingB) compose practice, while test blocks trials (testMappingA and testMappingB) compose test. All the other categories (i.e., practiceMappingA, practiceMappingB, testMappingA, and testMappingB) are composed by their respective number of trials in users' original data set.
The descriptive statistics are computed on the same data set on which the D-score is computed. For instance, if a D-score algorithm with the lower tail treatment is selected, the descriptive statistics are computed without considering the discarded trials. Likewise, if participants cleaning is selected, the descriptive statistics will not include the discarded participants.
4.5. Downloadable File
At the end of the computation, users can download a CSV file containing the last computed D-score. The default name of the file will contain the number of the selected D-score algorithm. The variables contained in the downloadable file are illustrated in Table 4.
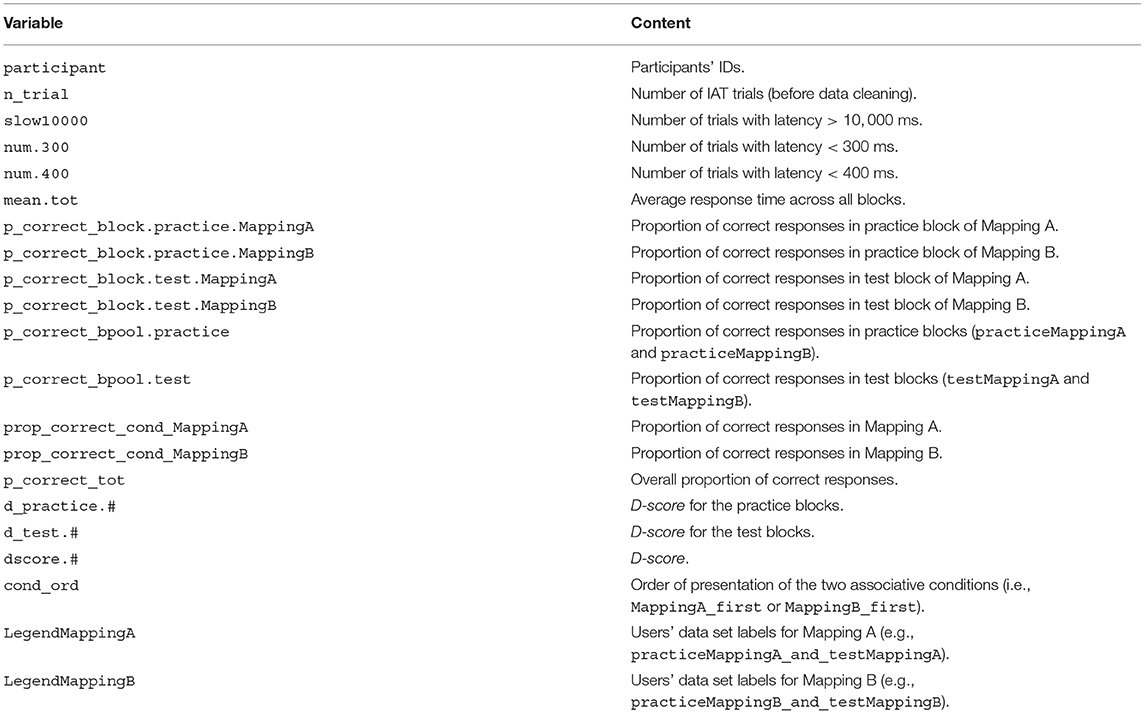
Table 4. Content of the Downloadable File.
The value in each column refers to the observed value for each participant. The # represents the number corresponding to the selected D-score algorithm.
In the depicted example, the default file name will be “ShinyAPPDscore3.csv.”
5. Final Remarks
The user-friendly and intuitive interface of DscoreApp makes its use straightforward, with no need for programming skills. Furthermore, the preparation of the data set for the analyses does not require any particular software or skill.
Beyond making the D-score computation easier, DscoreApp provides unique features that are not accessible with the available options for the D-score computation. First, DscoreApp provides the ability to immediately see the results and how they change in response to users' configurations. Additionally, since all the important information on participants performance and IAT functioning are available at the same time (e.g., D-scores, number of fast trials, IAT reliability), this app allows for grasping a complete overview of the functioning of the IAT. For instance, it allows for an immediate glimpse of how fast trials or inaccurate participants influence the results, and to identify critical aspects of the IAT that might deserve further investigation. Moreover, the preparation of the data set itself is particularly easy: Users will just have to eliminate the pure practice blocks and to rename the columns according to the instructions.
The downloadable file contains all the information that might be needed for further analysis on the IAT, or for plotting the results according to users' needs.
DscoreApp is constantly updated by the Authors, and new functions that are not present in this paper might be available in the future (e.g., other IAT reliability indexes). DscoreApp has been tested on several browsers (i.e., Google Chrome, Safari, Firefox, and Internet Explorer), and it has been found to have a reliable functioning. Problems encountered when using these browsers might be attributable to browsers security settings and/or poor internet connection.
Data Availability Statement
The code used for the development of Dscore app can be found at OttaviaE/DscoreApp.
Ethics Statement
Ethical review and approval was not required for the study on human participants in accordance with the local legislation and institutional requirements. The patients/participants provided their written informed consent to participate in this study.
Author Contributions
OE was responsible for DscoreApp development and for the initial draft of the contribution. PA and ER revised the initial draft of the paper and provided useful comments for the final version.
Conflict of Interest
The authors declare that the research was conducted in the absence of any commercial or financial relationships that could be construed as a potential conflict of interest.
The reviewer AC declared a shared affiliation, with no collaboration, with the authors to the handling editor at the time of the review.
References
Anselmi, P., Voci, A., Vianello, M., and Robusto, E. (2015). Implicit and explicit sexual attitudes across genders and sexual orientations. J. Bisexual. 15, 40–56. doi: 10.1080/15299716.2014.986597
Attali, D. (2018). shinyjs: Easily Improve the User Experience of Your Shiny Apps in Seconds. R package version 1.0.
Chang, W., Cheng, J., Allaire, J., Xie, Y., and McPherson, J. (2018). shiny: Web Application Framework for R. R package version 1.2.0.
Chen, L., Zhou, H., Gu, Y., Wang, S., Wang, J., Tian, L., et al. (2018). The neural correlates of implicit cognitive bias towards internet-related cues in internet addiction: an ERP study. Front. Psychiatry 9:421. doi: 10.3389/fpsyt.2018.00421
Dentale, F., Vecchione, M., Ghezzi, V., and Barbaranelli, C. (2019). Applying the latent state-trait analysis to decompose state, trait, and error components of the Self-Esteem Implicit Association Test. Eur. J. Psychol. Assess. 35, 78–85. doi: 10.1027/1015-5759/a000378
Egloff, B., and Schmukle, S. C. (2002). Predictive validity of an implicit association test for assessing anxiety. J. Pers. Soc. Psychol. 83:1441. doi: 10.1037//0022-3514.83.6.1441
Epifania, O. M., Anselmi, P., and Robusto, E. (in press). A fairer comparison between the implicit association test the single category - implicit association test. Test. Psychometrics Methodol. Appl. Psychol.
Gawronski, B., Morrison, M., Phills, C. E., and Galdi, S. (2017). Temporal stability of implicit and explicit measures: a longitudinal analysis. Pers. Soc. Psychol. Bull. 43, 300–312. doi: 10.1177/0146167216684131
Greenwald, A. G., McGhee, D. E., and Schwartz, J. L. K. (1998). Measuring individual differences in implicit cognition: the implicit association test. J. Pers. Soc. Psychol. 74, 1464–1480. doi: 10.1037/0022-3514.74.6.1464
Greenwald, A. G., Nosek, B. A., and Banaji, M. R. (2003). Understanding and using the implicit association test: I. An improved scoring algorithm. J. Pers. Soc. Psychol. 85, 197–216. doi: 10.1037/0022-3514.85.2.197
Greenwald, A. G., Poehlman, T. A., Uhlmann, E. L., and Banaji, M. R. (2009). Understanding and using the implicit association test: III. Meta-analysis of predictive validity. J. Pers. Soc. Psychol. 97:17. doi: 10.1037/a0015575
Karnal, N., Machiels, C. J., Orth, U. R., and Mai, R. (2016). Healthy by design, but only when in focus: communicating non-verbal health cues through symbolic meaning in packaging. Food Qual. Preferen. 52, 106–119. doi: 10.1016/j.foodqual.2016.04.004
Nosek, B. A., Banaji, M. R., and Greenwald, A. G. (2002). Harvesting implicit group attitudes and beliefs from a demonstration web site. Group Dyn. 6, 101–115. doi: 10.1037/1089-2699.6.1.101
Sriram, N., and Greenwald, A. G. (2009). The brief implicit association test. Exp. Psychol. 56, 283–294. doi: 10.1027/1618-3169.56.4.283
Steffens, M. C. (2004). Is the implicit association test immune to faking? Exp. Psychol. 51, 165–179. doi: 10.1027/1618-3169.51.3.165
Storage, D. (2018a). IATanalytics: Compute Effect Sizes and Reliability for Implicit Association Test (IAT) Data. R package version 0.1.1.
Storage, D. (2018b). IATScore: Scoring Algorithm for the Implicit Association Test (IAT). R package version 0.1.1.
Keywords: implicit association test, implicit measures, shiny, web application, D-score, user-friendly, social cognition
Citation: Epifania OM, Anselmi P and Robusto E (2020) DscoreApp: A Shiny Web Application for the Computation of the Implicit Association Test D-Score. Front. Psychol. 10:2938. doi: 10.3389/fpsyg.2019.02938
Received: 01 August 2019; Accepted: 11 December 2019;
Published: 10 January 2020.
Edited by:
Pietro Cipresso, Italian Auxological Institute (IRCCS), ItalyReviewed by:
Antonio Calcagnì, University of Padova, ItalyLena Nadarevic, Universität Mannheim, Germany
Copyright © 2020 Epifania, Anselmi and Robusto. This is an open-access article distributed under the terms of the Creative Commons Attribution License (CC BY). The use, distribution or reproduction in other forums is permitted, provided the original author(s) and the copyright owner(s) are credited and that the original publication in this journal is cited, in accordance with accepted academic practice. No use, distribution or reproduction is permitted which does not comply with these terms.
*Correspondence: Ottavia M. Epifania, marinaottavia.epifania@phd.unipd.it