 Maria Larsson
 Carlos Tirado
 Stefan Wiens
- Gösta Ekman Laboratory, Department of Psychology, Stockholm University, Stockholm, Sweden
Autism Spectrum Disorders (ASD) are often accompanied by atypical visual, auditory, and tactile sensory behavior. Evidence also suggests alterations of the olfactory system, but the pattern of findings appears mixed. To quantify this pattern systematically, we conducted a meta-analysis. Studies were included if they examined olfactory function (i.e., odor threshold, or odor identification) in ASD compared with healthy age-matched control groups. We also coded for the potential moderators gender, age, and IQ. Articles were identified through computerized literature search using Web of Science, PubMed, and Scopus databases. A total of 11 articles compared odor threshold and/or odor identification between cases and controls (for threshold, n = 143 ASD and 148 controls; and for identification, n = 132 ASD and 139 controls). Effects sizes showed a substantial heterogeneity. As a result, the 95% prediction intervals were wide and ranged between a large negative and a large positive effect size for odor threshold, [-1.86, 2.05], and for odor identification, [-1.51, 2.52]. Exploratory analyses suggested that age and IQ may be potential moderators. To conclude, the large heterogeneity is consistent with the notion of both hyposensitivity and hypersensitivity in individuals with ASD. However, future research needs to predict and test the specific direction of the effect to provide convincing evidence for atypical olfactory functions in ASD.
Introduction
Autism Spectrum Disorders (ASD) are characterized by social and communication difficulties, alongside repetitive behaviors and special interests (American Psychiatric Association, 2013). In addition, ASD is often accompanied by atypical sensory behavior (hyper- or hyporeactivity) for visual, tactile, and auditory information (Jones et al., 2003; Rogers et al., 2003). Given its high prevalence among individuals with ASD, unusual sensory processing was recently included in the DSM-5 diagnostic criteria for ASD (American Psychiatric Association, 2016).
Available evidence also suggests alterations of the olfactory system in ASD, but the pattern of findings is mixed. Inconsistent observations are reported for both sensory-driven olfactory tasks (e.g., odor threshold) and higher-order olfactory functions (e.g., odor identification). Although some studies reported either enhanced olfactory sensitivity in ASD (Ashwin et al., 2014) or impaired sensitivity (Dudova et al., 2011), most studies reported no significant differences between individuals with ASD and controls in olfactory threshold (Suzuki et al., 2003; Tavassoli and Baron-Cohen, 2012; Galle et al., 2013). Likewise, available evidence on odor identification is unclear, as some studies reported identification impairments (Suzuki et al., 2003; Wicker et al., 2016) whereas others reported no significant group differences (Dudova et al., 2011; Luisier et al., 2015).
Some degree of heterogeneity may be expected because previous studies used different methods, had small sample sizes, and may have sampled from different populations (e.g., age and gender). However, to determine if there is actual heterogeneity among the effect sizes that is not simply due to chance, we conducted a meta-analysis of existing studies examining olfactory function in individuals with ASD. We examined olfactory threshold and odor identification in ASD as compared with healthy age-matched control groups. Further, in an exploratory meta-regression, we investigated the potentially moderating role of available variables (i.e., gender, age, and IQ) upon the observed olfactory differences between ASD and controls.
Materials and Methods
Literature Search Strategy
Published studies were identified through computerized literature searches in Web of Science, PubMed, and Scopus databases for relevant studies targeting human olfaction in ASD, ASC (Autism Spectrum Condition), HFA (High-Functioning Autism), and AS (Asperger Syndrome). The search keywords were: autism and olfaction∗, ASD and olfaction∗, ASC and olfaction∗, HFA and olfaction∗, and AS and olfaction∗. The search was limited to English language articles. In addition, a manual review of articles was performed using cross-references from the original articles and reviews.
Study Selection Criteria
Studies that were included in the meta-analysis focused on standard or experimental tasks of olfactory function in ASD, and had an age-matched control group of healthy participants without ASD (see Figure 7). Based on these criteria, two of the authors (ML and CT) and one research assistant independently reviewed and extracted data from each potential study. Disagreements were resolved via discussion of all authors until a consensus decision was reached. A total of 11 studies were included (see Tables 1, 2), and 15 studies were excluded (Table 3).
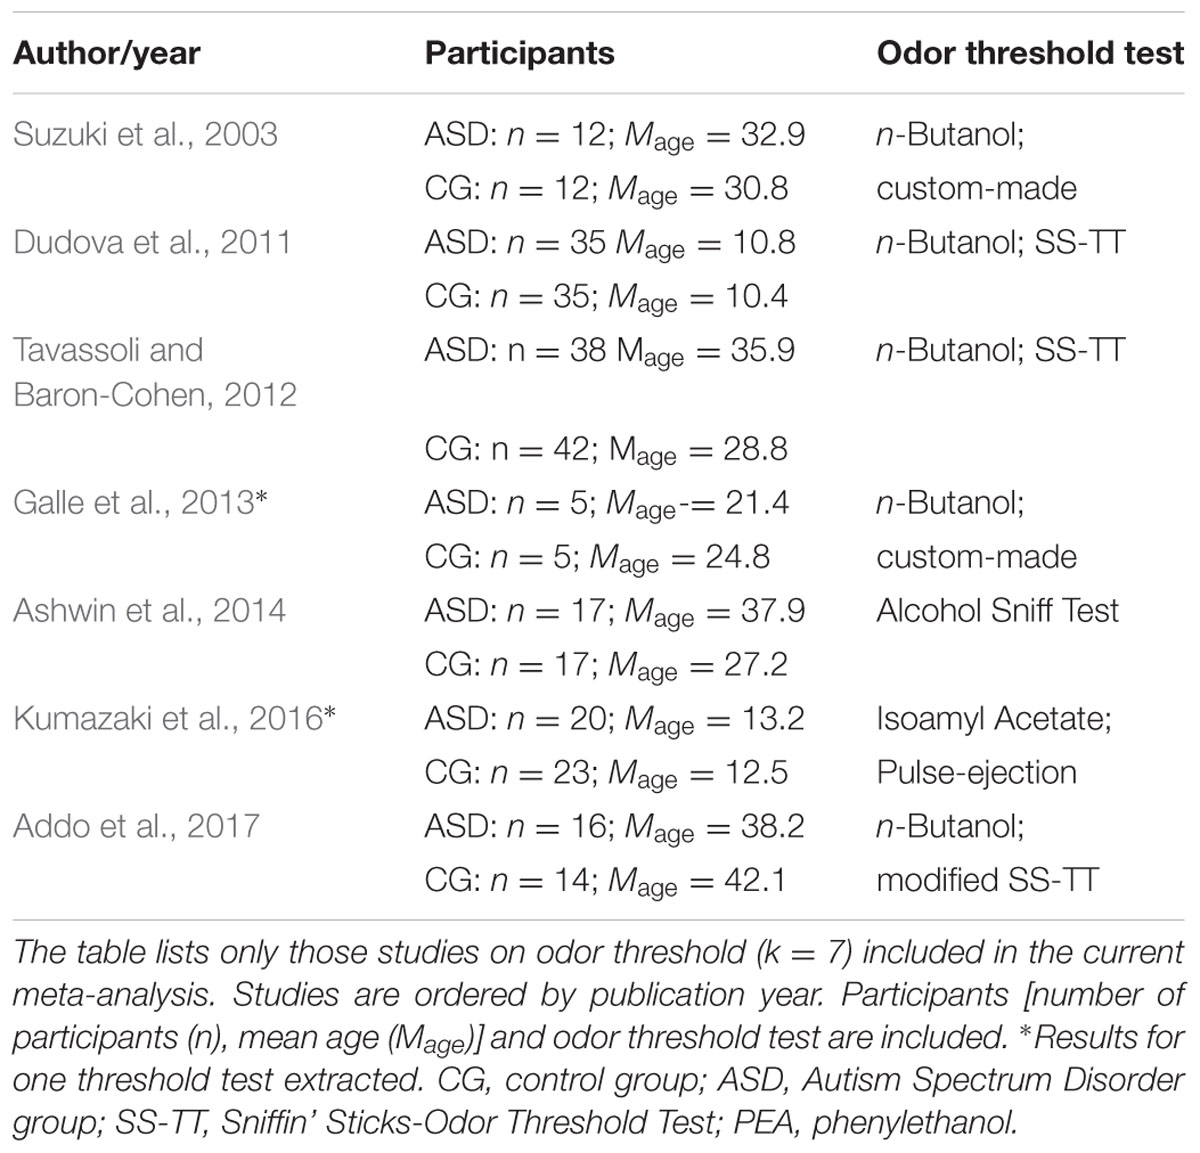
TABLE 1. Included olfactory threshold studies of Autism Spectrum Disorders
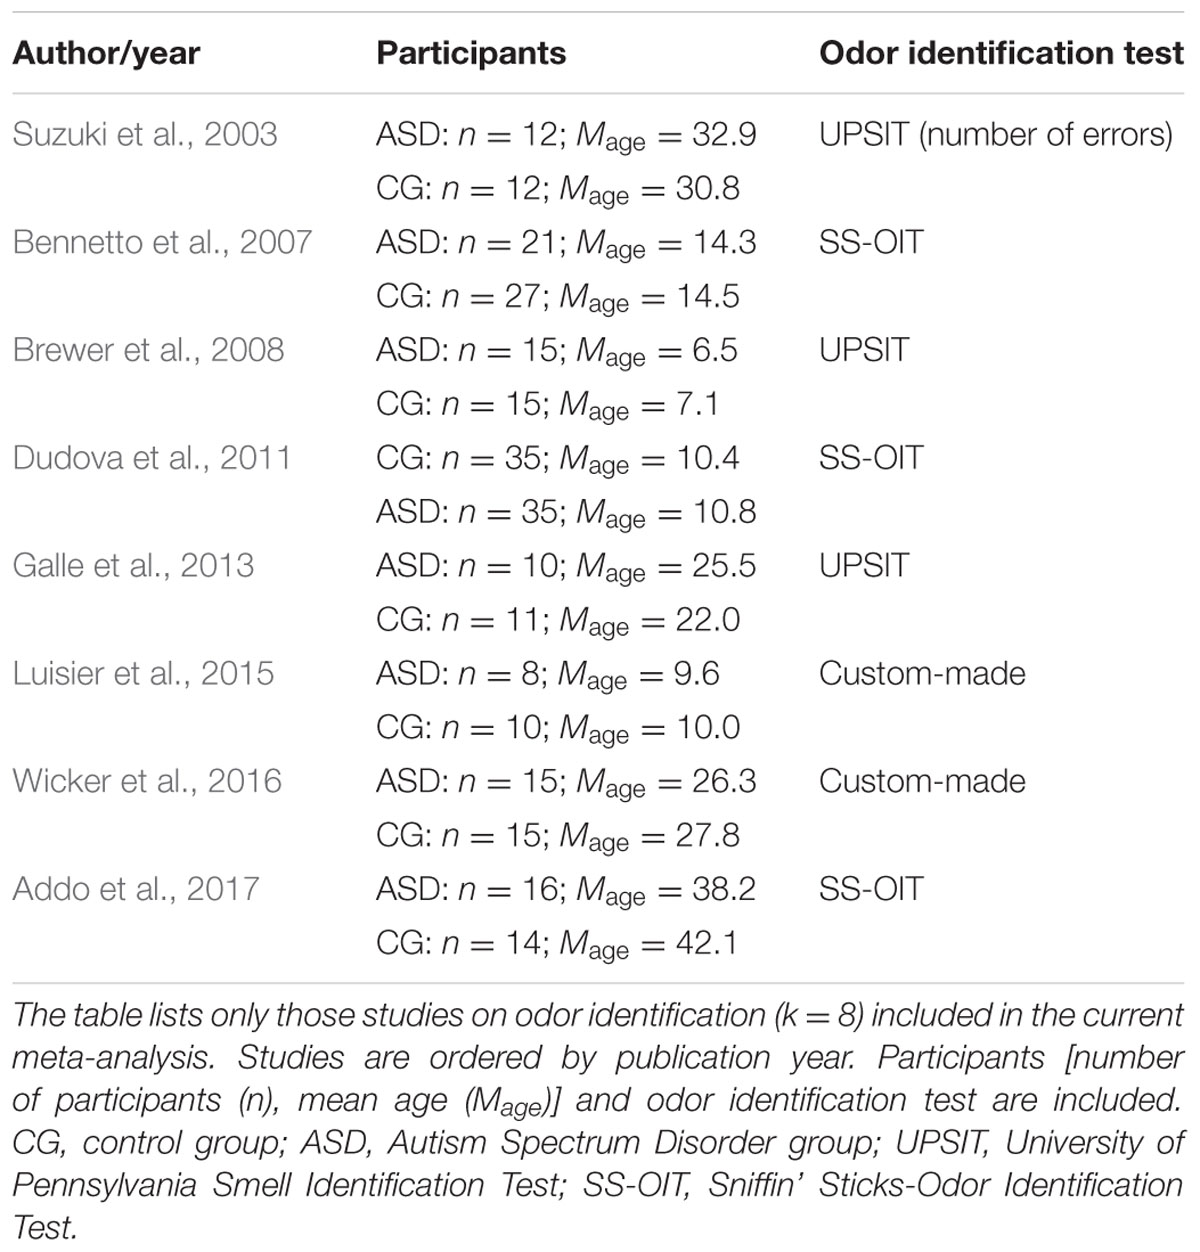
TABLE 2. Included odor identification studies of Autism Spectrum Disorders.
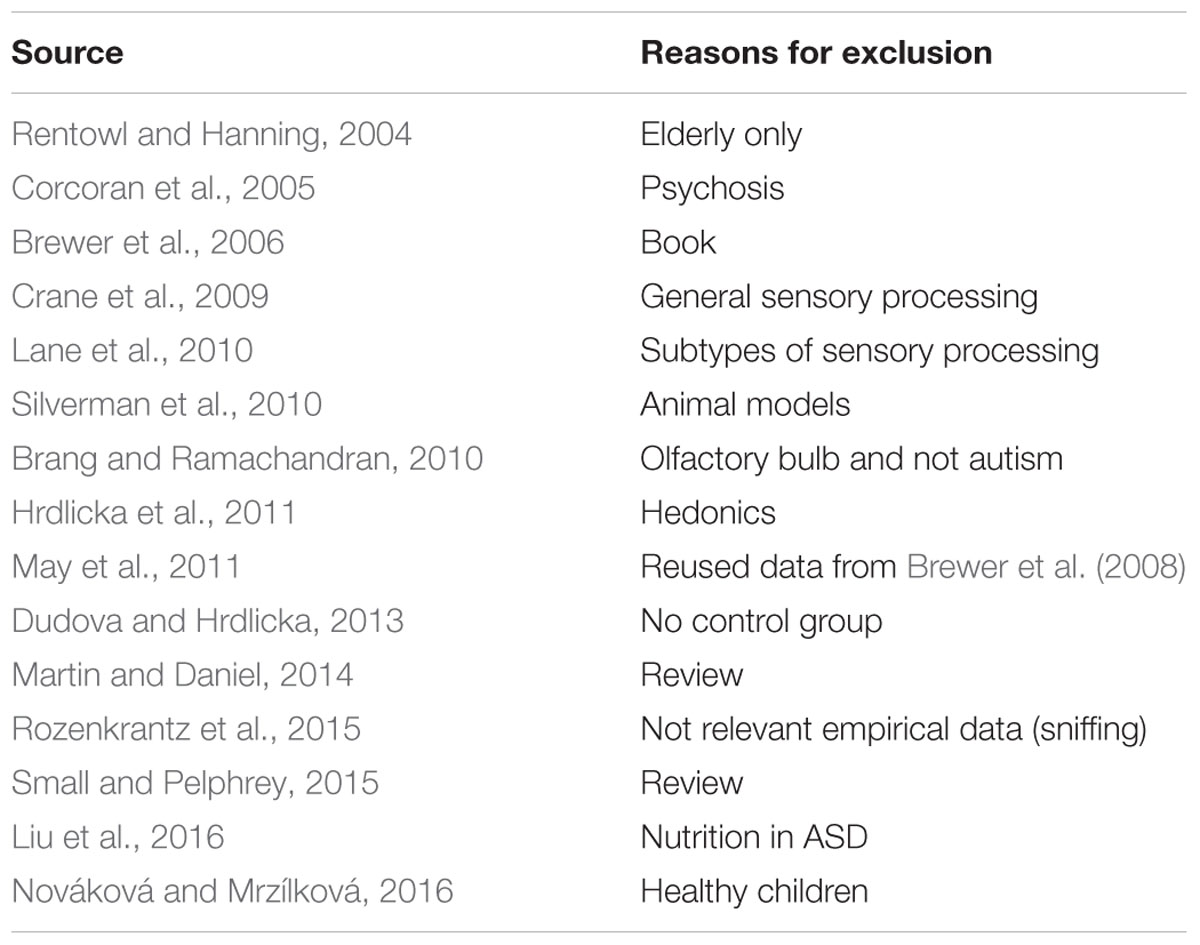
TABLE 3. List of excluded studies.
We targeted effect sizes for two basic olfactory domains: odor detection threshold and odor identification. For identification, most studies used the University of Pennsylvania Identification Test (UPSIT; Doty et al., 1984) or the Sniffin’ Sticks-Odor Identification Test (SS-OIT; Hummel et al., 1997). Both tests are standardized and widely used. In each task, each odor item is accompanied with four written label alternatives (one target and three foils), and the task is to pick the label that matches the presented odor. Of the selected studies, seven studies included a threshold test and eight studies used an identification test. Also, when available, we collected aggregated data on demographic (age and gender) variables and IQ.
Statistical Analyses
Performance on the odor threshold task and on the odor identification task was compared between ASD and control groups. For each study, we extracted the relevant mean, standard deviation (or standard error), and sample size for each group. Because the studies used different measures, we computed the standardized, unbiased effect size estimate Hedges’ g (Lakens, 2013). If the necessary data were unavailable (for identification, k = 3), we used the reported inferential statistics to compute Hedges’ g. Hedges’ g and its estimated variance were computed (Lakens, 2013; Del Re, 2015) and then processed in the R toolbox meta (version 4.6-0) to perform the meta-analysis (Schwarzer, 2007; Schwarzer et al., 2015). Because study design and sampled population varied between the studies, a random-effects analysis was used to allow for heterogeneity of the true effect sizes among the studies, and this heterogeneity was estimated with DerSimonion–Laird estimator for T2 (Borenstein et al., 2009). The degree of heterogeneity was assessed with common measures such as Q, I2, and the prediction interval (Borenstein et al., 2009). We also performed exploratory meta-regressions in the R toolbox meta to investigate the potentially moderating role of several predictors. All data, R scripts, and results are available at Figshare (10.17045/sthlmuni.4801834) and OSF (10.17605/OSF.IO/V24NE), as recommended (Lakens et al., 2016).
Results
Figure 1 shows the forest plot for the threshold task. Across studies, heterogeneity was substantial. Heterogeneity differed significantly from chance, Q(df = 6) = 34.73, p < 0.0001, T = 0.70, and about 83% of the observed variance reflected actual differences in the effect sizes, I2 = 82.7, 95% CI [65.7, 91.3]. The predicted effect size of a future study ranges between a large negative and a large positive effect size, as shown by the 95% prediction interval [-1.86, 2.05]. Consistent with this heterogeneity, the 95% CI of the mean estimate of the random-effects model was wide and overlapped zero, [-0.49, 0.68]. As shown in Figure 2, the heterogeneity is also illustrated in the contour-enhanced funnel plot (Schwarzer et al., 2015). Most studies had low precision and varied widely in either direction. The figure suggests that there was no particularly bias toward significant findings, which would be apparent if the studies fell mainly in the gray area (i.e., were significant at two-tailed alpha = 5%).
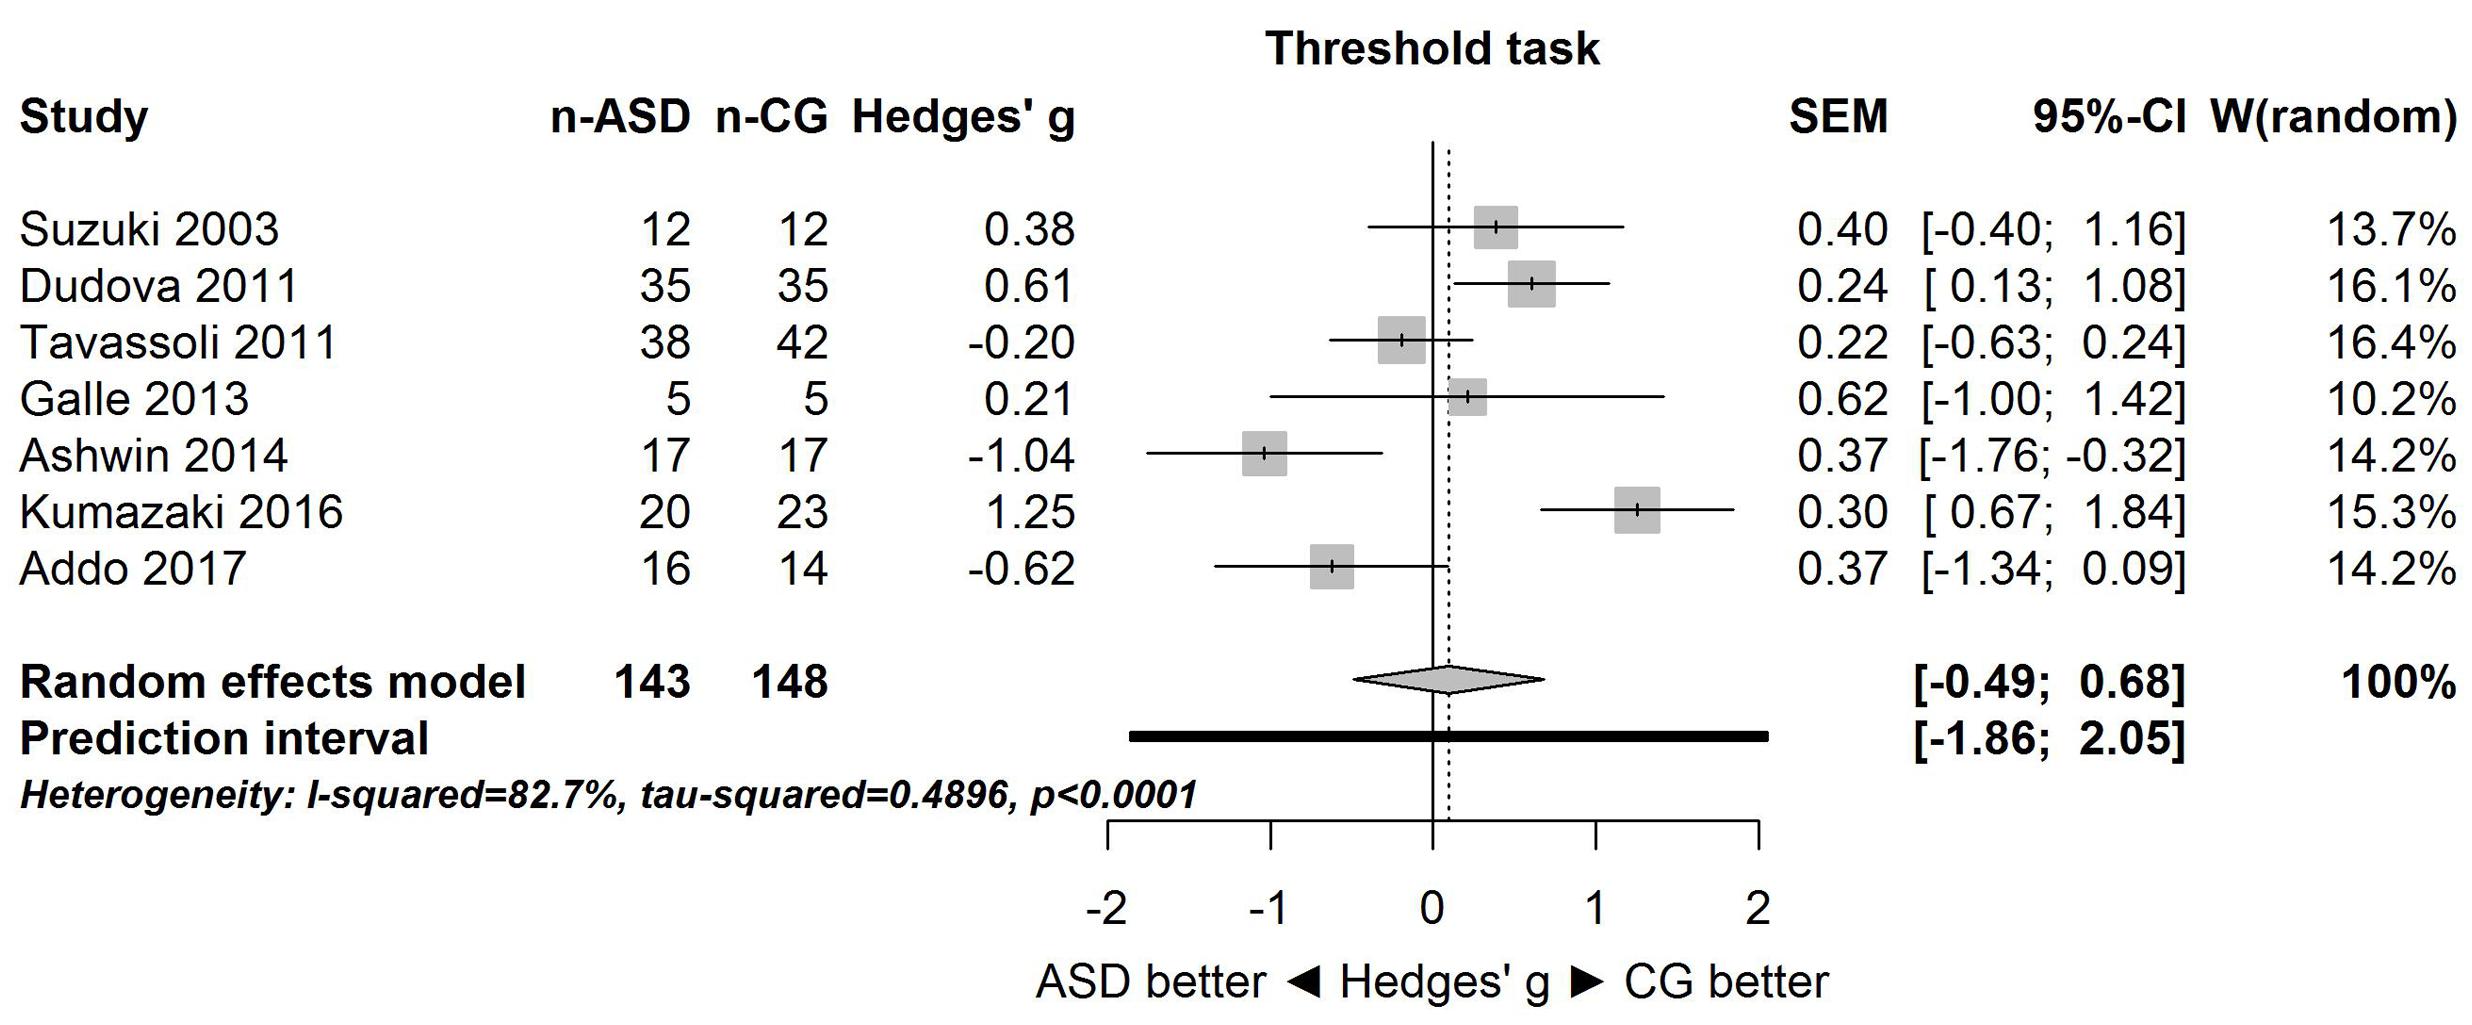
FIGURE 1. Forest plot of performance on the odor threshold task in seven studies. The prediction interval captures the expected true effect for a future study. For positive values, CG was better than ASD, and vice versa. ASD, autism spectrum disorder group; CG, control group. W(random) is the weight of each study in the random-effects model.
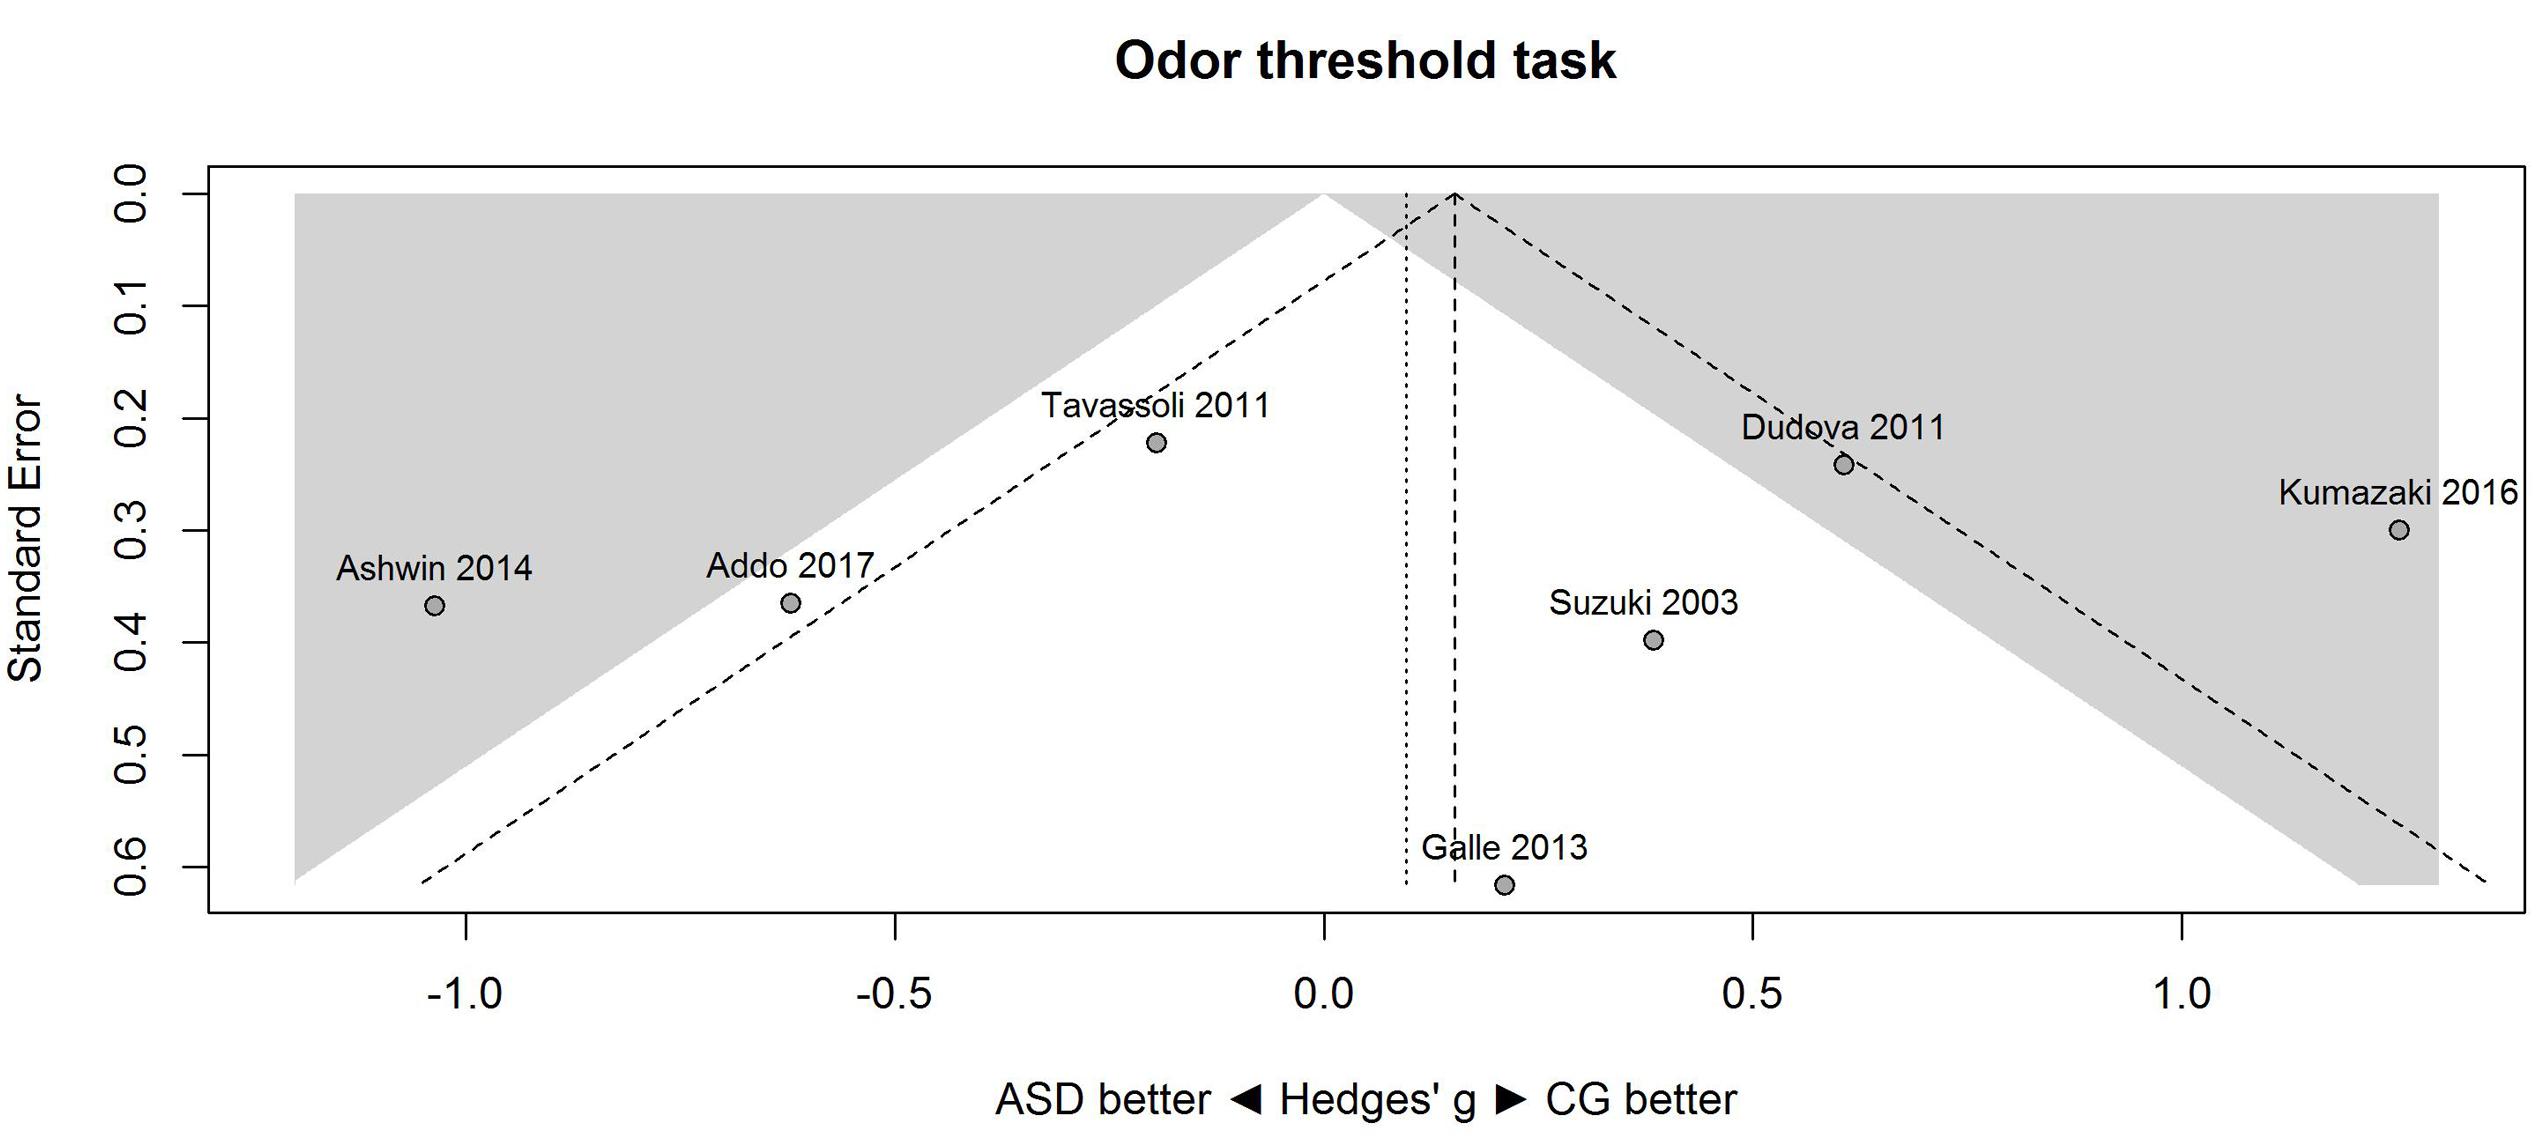
FIGURE 2. Contour-enhanced funnel plot of performance on the odor threshold task in seven studies. Studies that fall in the gray area are significant (at two-tailed alpha = 0.05). For positive values, CG was better than ASD, and vice versa. ASD, autism spectrum disorder group; CG, control group.
A similar pattern of results was obtained for the identification task. Figure 3 shows the forest plot for the identification task. Across studies, heterogeneity was substantial. Heterogeneity differed significantly from chance, Q(df = 7) = 38.87, p < 0.0001, T = 0.77, and about 82% of the observed variance reflected actual differences in the effect sizes, I2 = 81.9, 95% CI [65.7, 90.5]. The prediction interval ranged between a large negative and a large positive effect size, [-1.51, 2.52]. Consistent with this heterogeneity, the 95% CI of the mean estimate of the random-effects model was wide and overlapped zero, [-0.09, 1.10]. The heterogeneity is also illustrated in the contour-enhanced funnel plot (Figure 4). Most studies had low precision and varied widely. The figure suggests that there was no particularly bias toward significant findings.
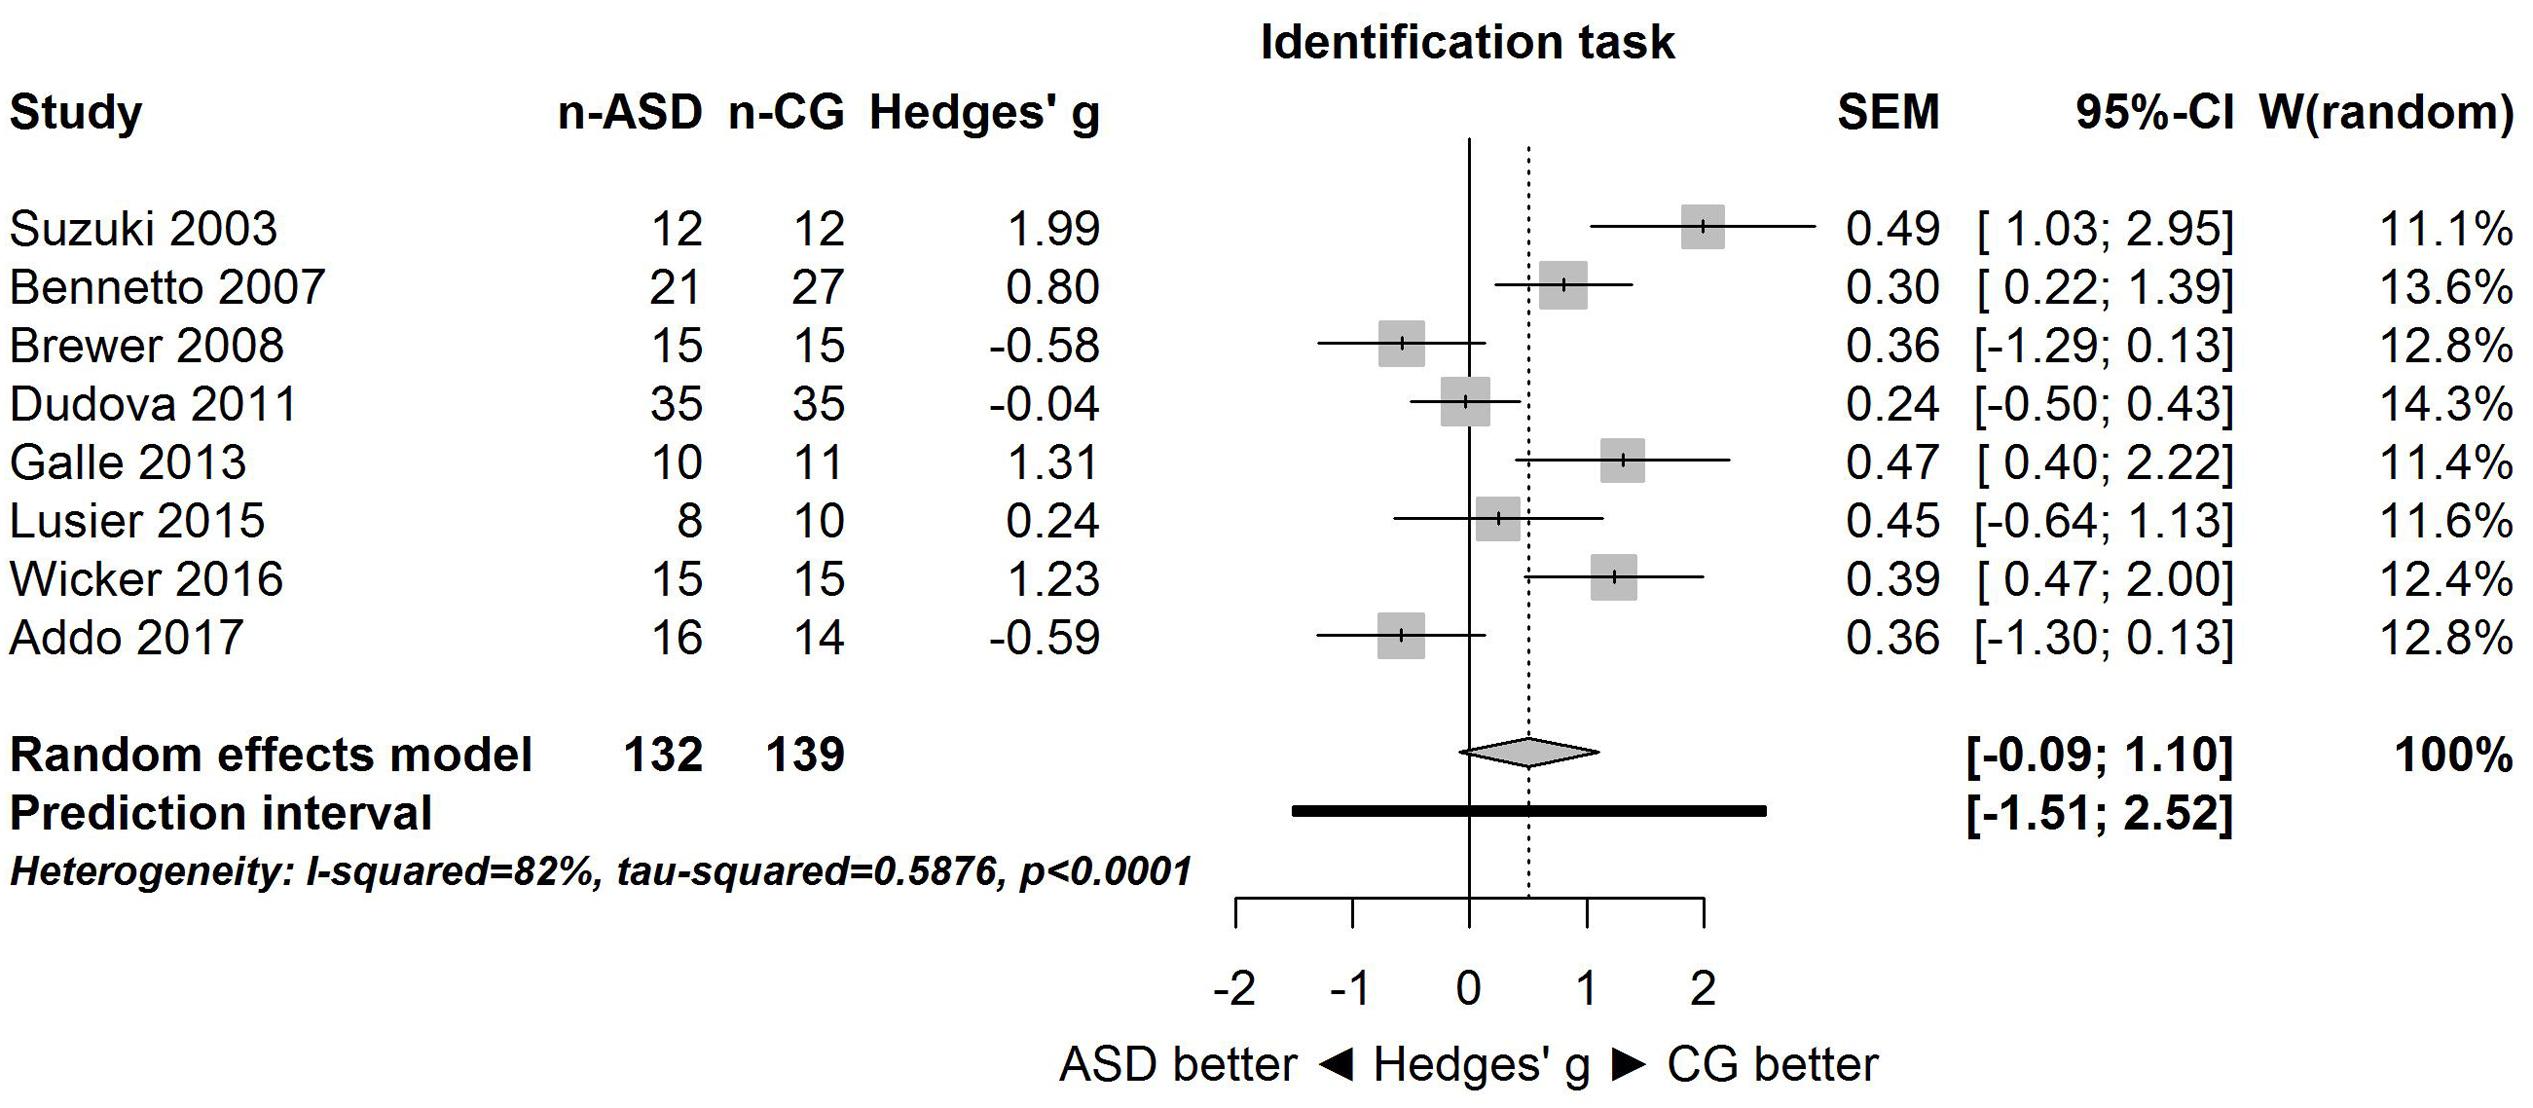
FIGURE 3. Forest plot of performance on the odor identification task in eight studies. The prediction interval captures the expected true effect for a future study. For positive values, CG was better than ASD, and vice versa. ASD, autism spectrum disorder group; CG, control group. W(random) is the weight of each study in the random-effects model.
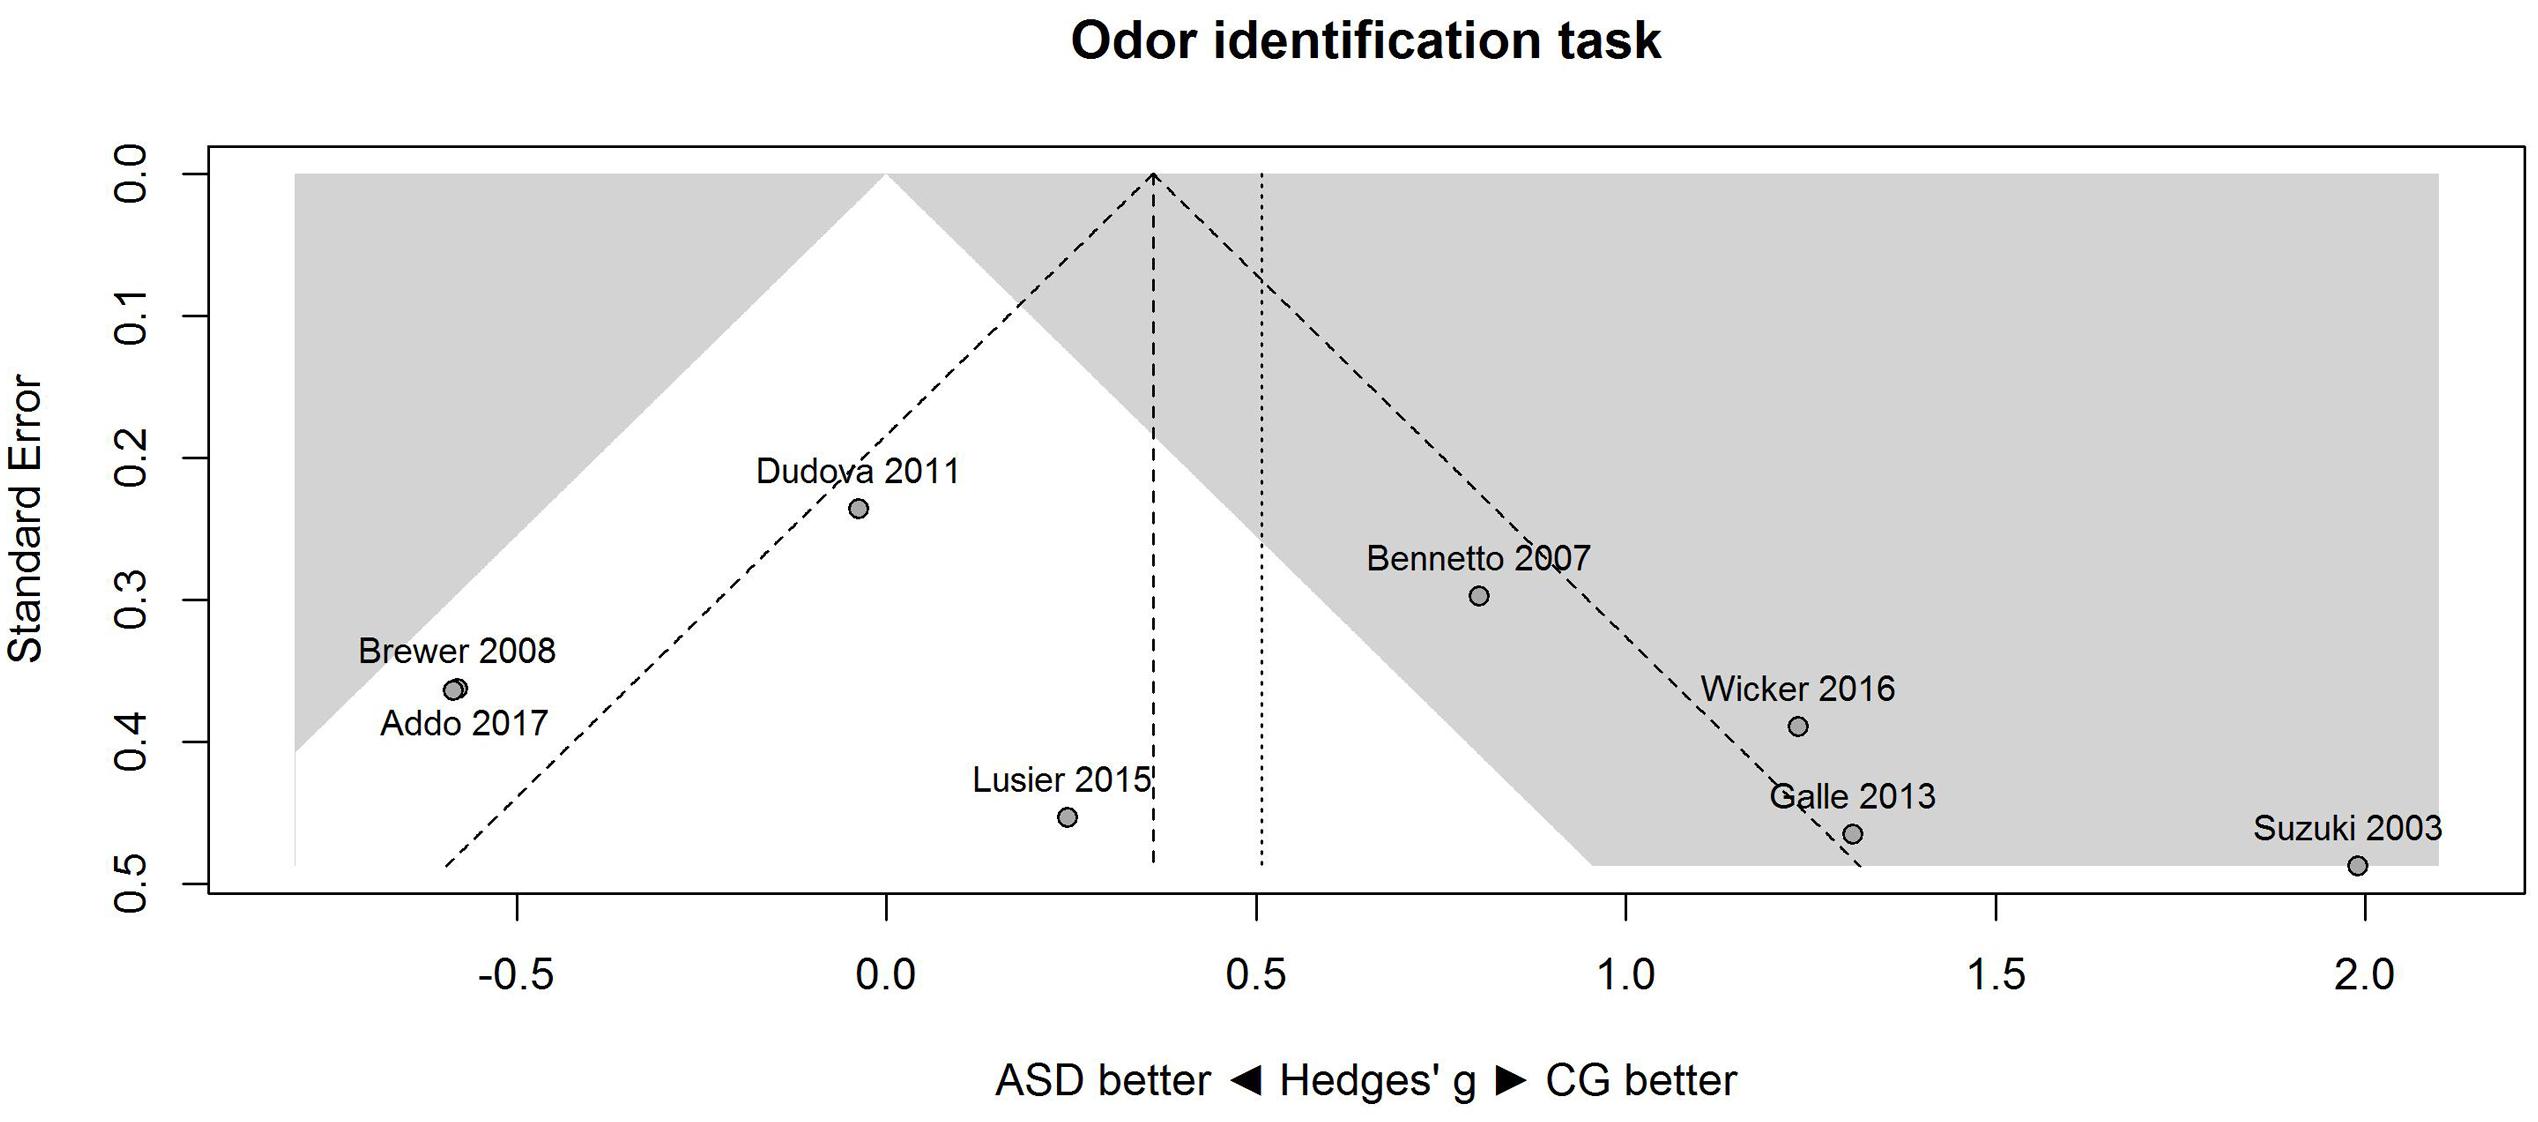
FIGURE 4. Contour-enhanced funnel plot of performance on the odor identification task in eight studies. Studies that fall in the gray area are significant (at two-tailed alpha = 0.05). For positive values, CG was better than ASD, and vice versa. ASD, autism spectrum disorder group; CG, control group.
Because for the identification task, one study (Suzuki et al., 2003) had a large effect size (Hedges’ g = 1.99), the above analysis was repeated without this study (i.e., sensitivity analysis). Results were unaffected: the large heterogeneity remained, Q(df = 6) = 26.94, p = 0.0001, T = 0.65, I2 = 77.7, 95% CI [53.7, 89.3], and 95% prediction interval, [-1.50, 2.14]. Consistent with this heterogeneity, the 95% CI of the mean estimate of the random-effects model was wide and overlapped zero, [-0.24, 0.87], although it was centered closer to zero than in the analysis of all studies.
Taken together, results showed that effect sizes varied substantially among the studies on both threshold and identification tasks. These results are consistent with the notion that ASD may lead to both hyposensitivity and hypersensitivity on these tasks. To identify potential moderators of the direction of this effect, we explored the contributions of three variables that we could extract from the studies in explaining the variability among effect sizes: proportion of males, mean age, and mean IQ score in the ASD group.
Results of these exploratory meta-regressions showed that for threshold (Figure 5), proportion of males showed no clear relationship with sensitivity, B = 0.01, 95% CI [-0.02, 0.03], R2 < 0.01. In contrast, mean age and mean IQ tended to be associated with the performance difference between ASD and control group. For mean age, B = -0.05, 95% CI [-0.08, -0.02], R2 = 0.80; and for mean IQ, B = -0.10, 95% CI [-0.14, -0.06], R2 = 1.00. As shown in Figure 5, for younger participants (below 30), the ASD group (vs. the control group) showed hyposensitivity, whereas for older participants (above 35), the ASD group showed hypersensitivity. Similarly, for participants with IQs below 113, the ASD group showed hyposensitivity, whereas for participants with IQs above 113, the ASD group showed hypersensitivity. However, mean age and mean IQ correlated with each other (r = 0.72). Given the small number of studies, the unique contribution of each variable cannot be estimated.
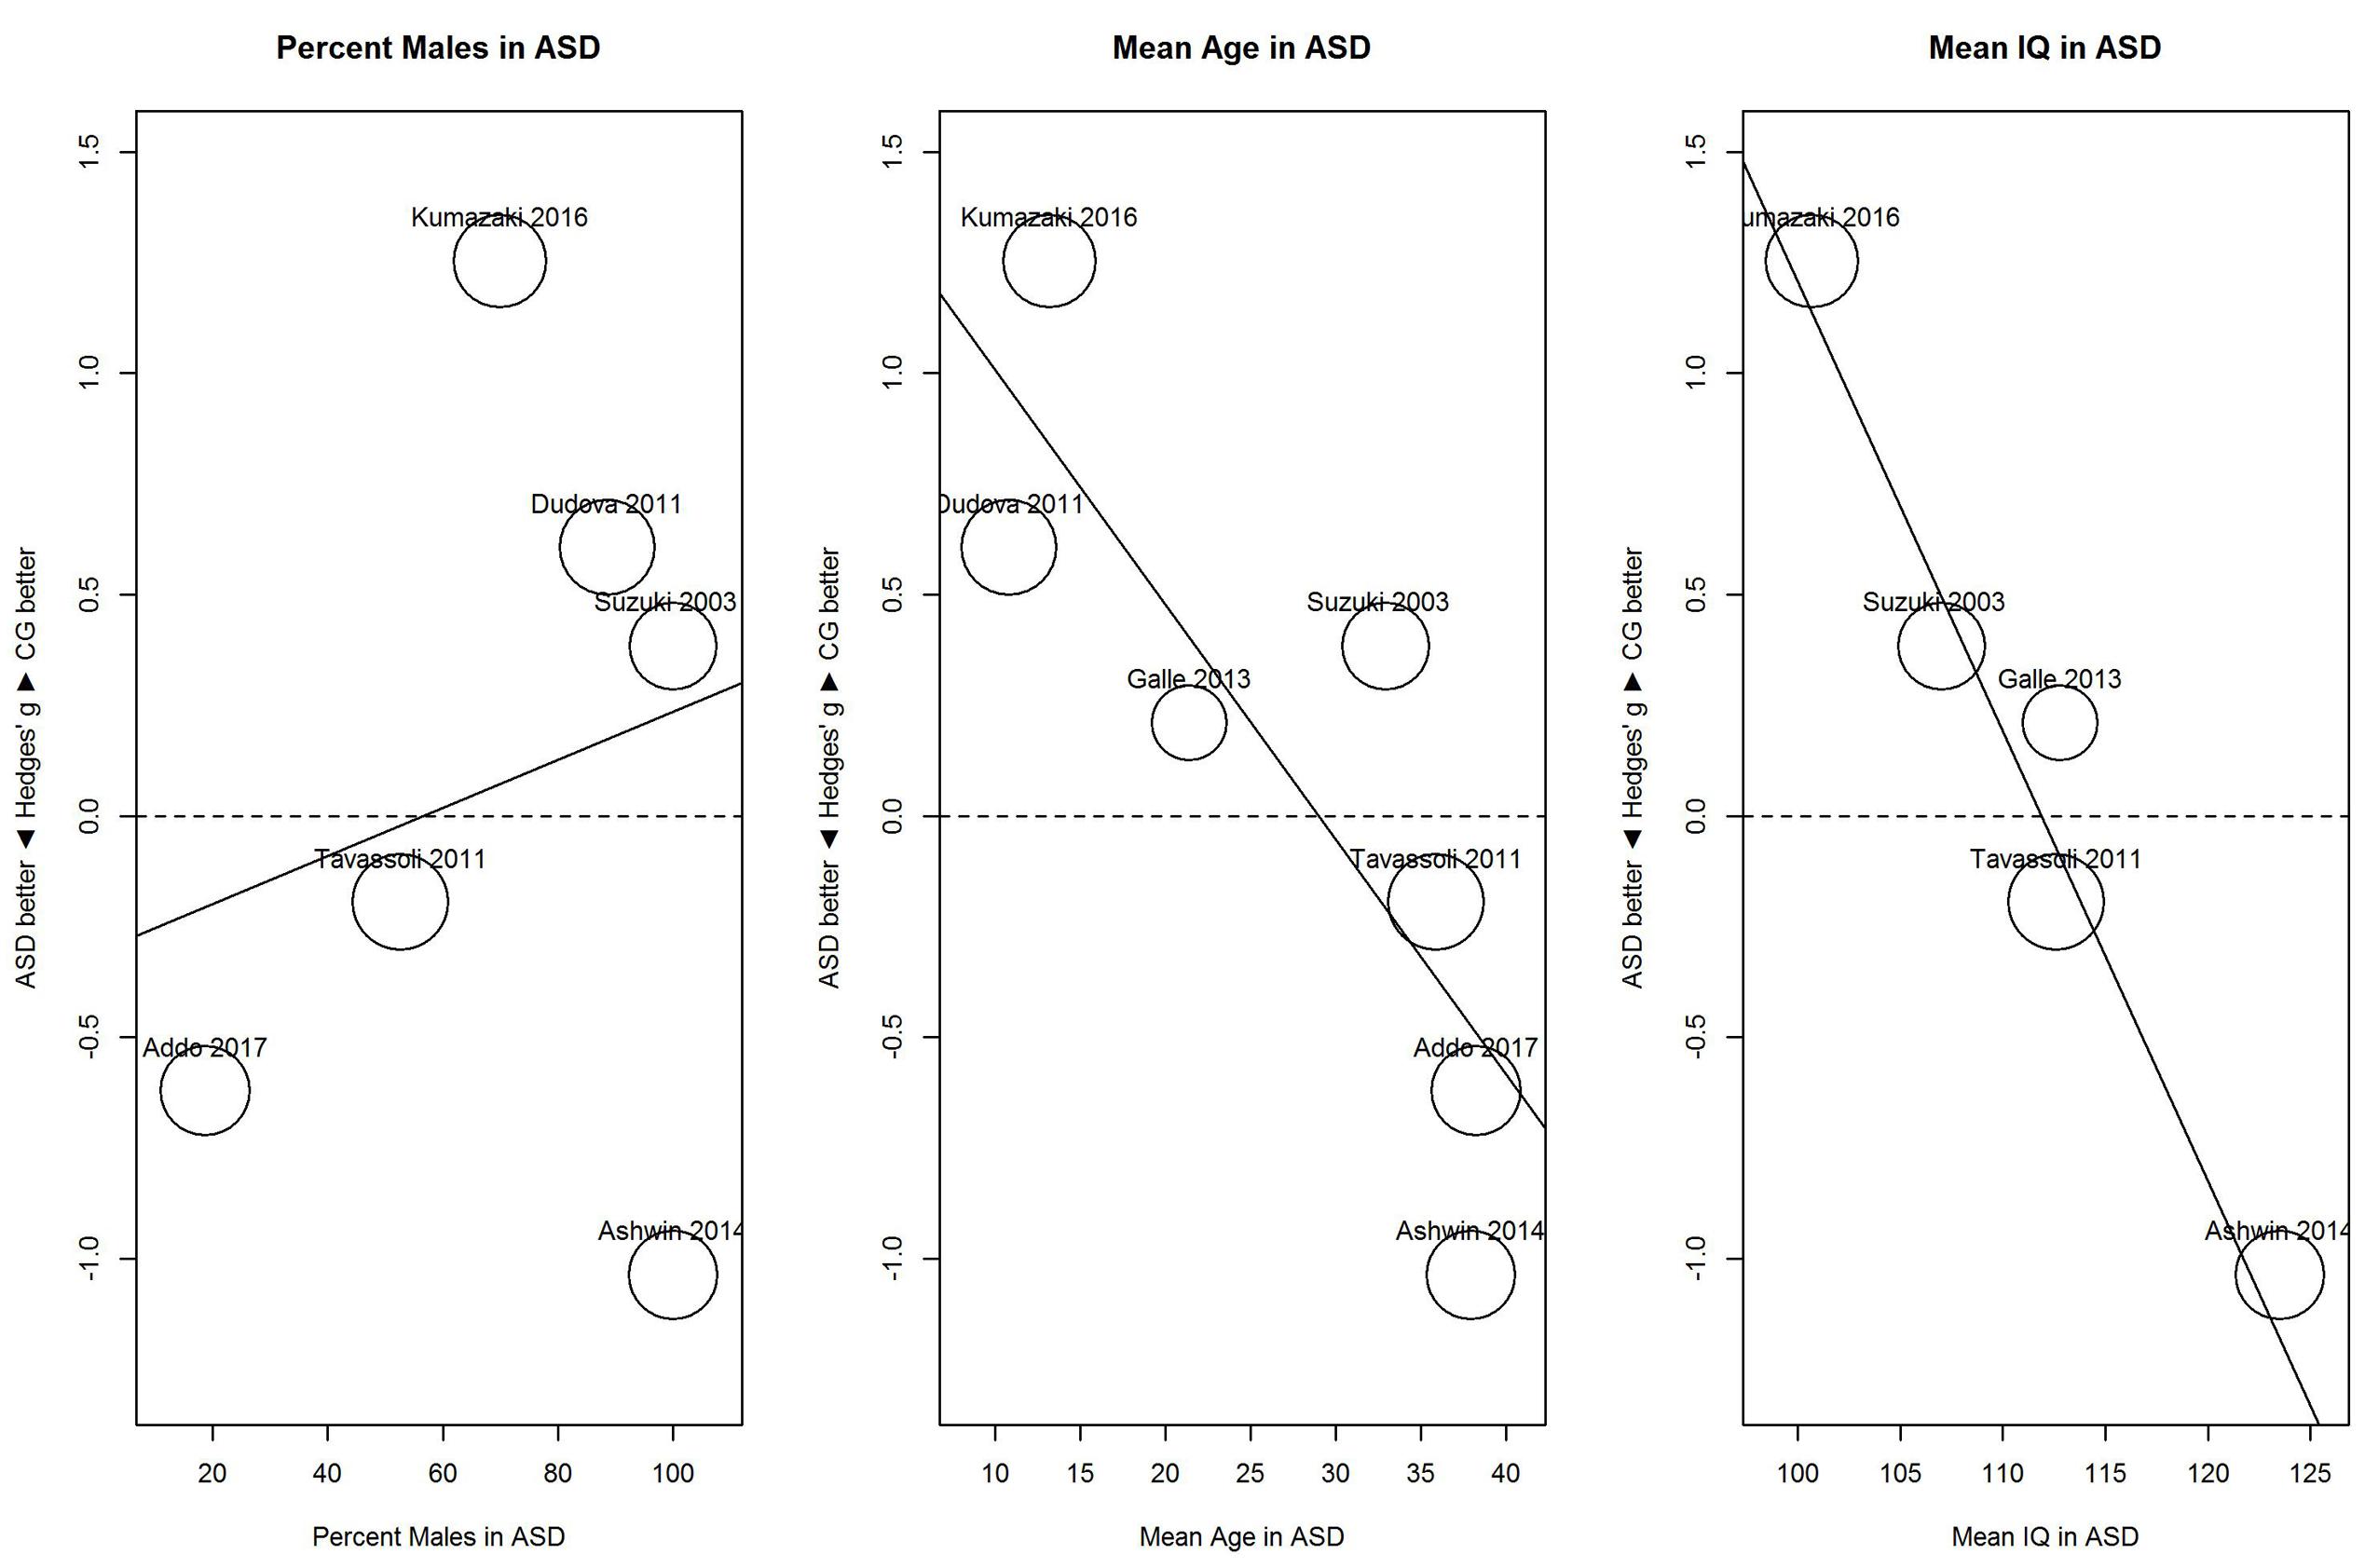
FIGURE 5. Scatterplots of the relation with performance on the odor threshold task in terms of percent males in the ASD group (left panel), mean age in the ASD group (middle panel), and mean IQ in the ASD group (right panel). For positive performance values, CG was better than ASD, and vice versa. ASD, autism spectrum disorder group; CG, control group.
For identification (Figure 6), proportion of males and mean age showed no clear relationship with sensitivity; for proportion of males, B = 0.02, 95% CI [-0.01, 0.04], R2 = 0.03; and for mean age, B = 0.03, 95% CI [-0.03, 0.08], R2 < 0.01. In contrast, mean IQ tended to be associated with the performance difference between ASD and control group; for mean IQ, B = 0.10, 95% CI [-0.01, 0.21], R2 = 0.45. As shown in Figure 6, with increases in mean IQ, the ASD group increased in hyposensitivity.
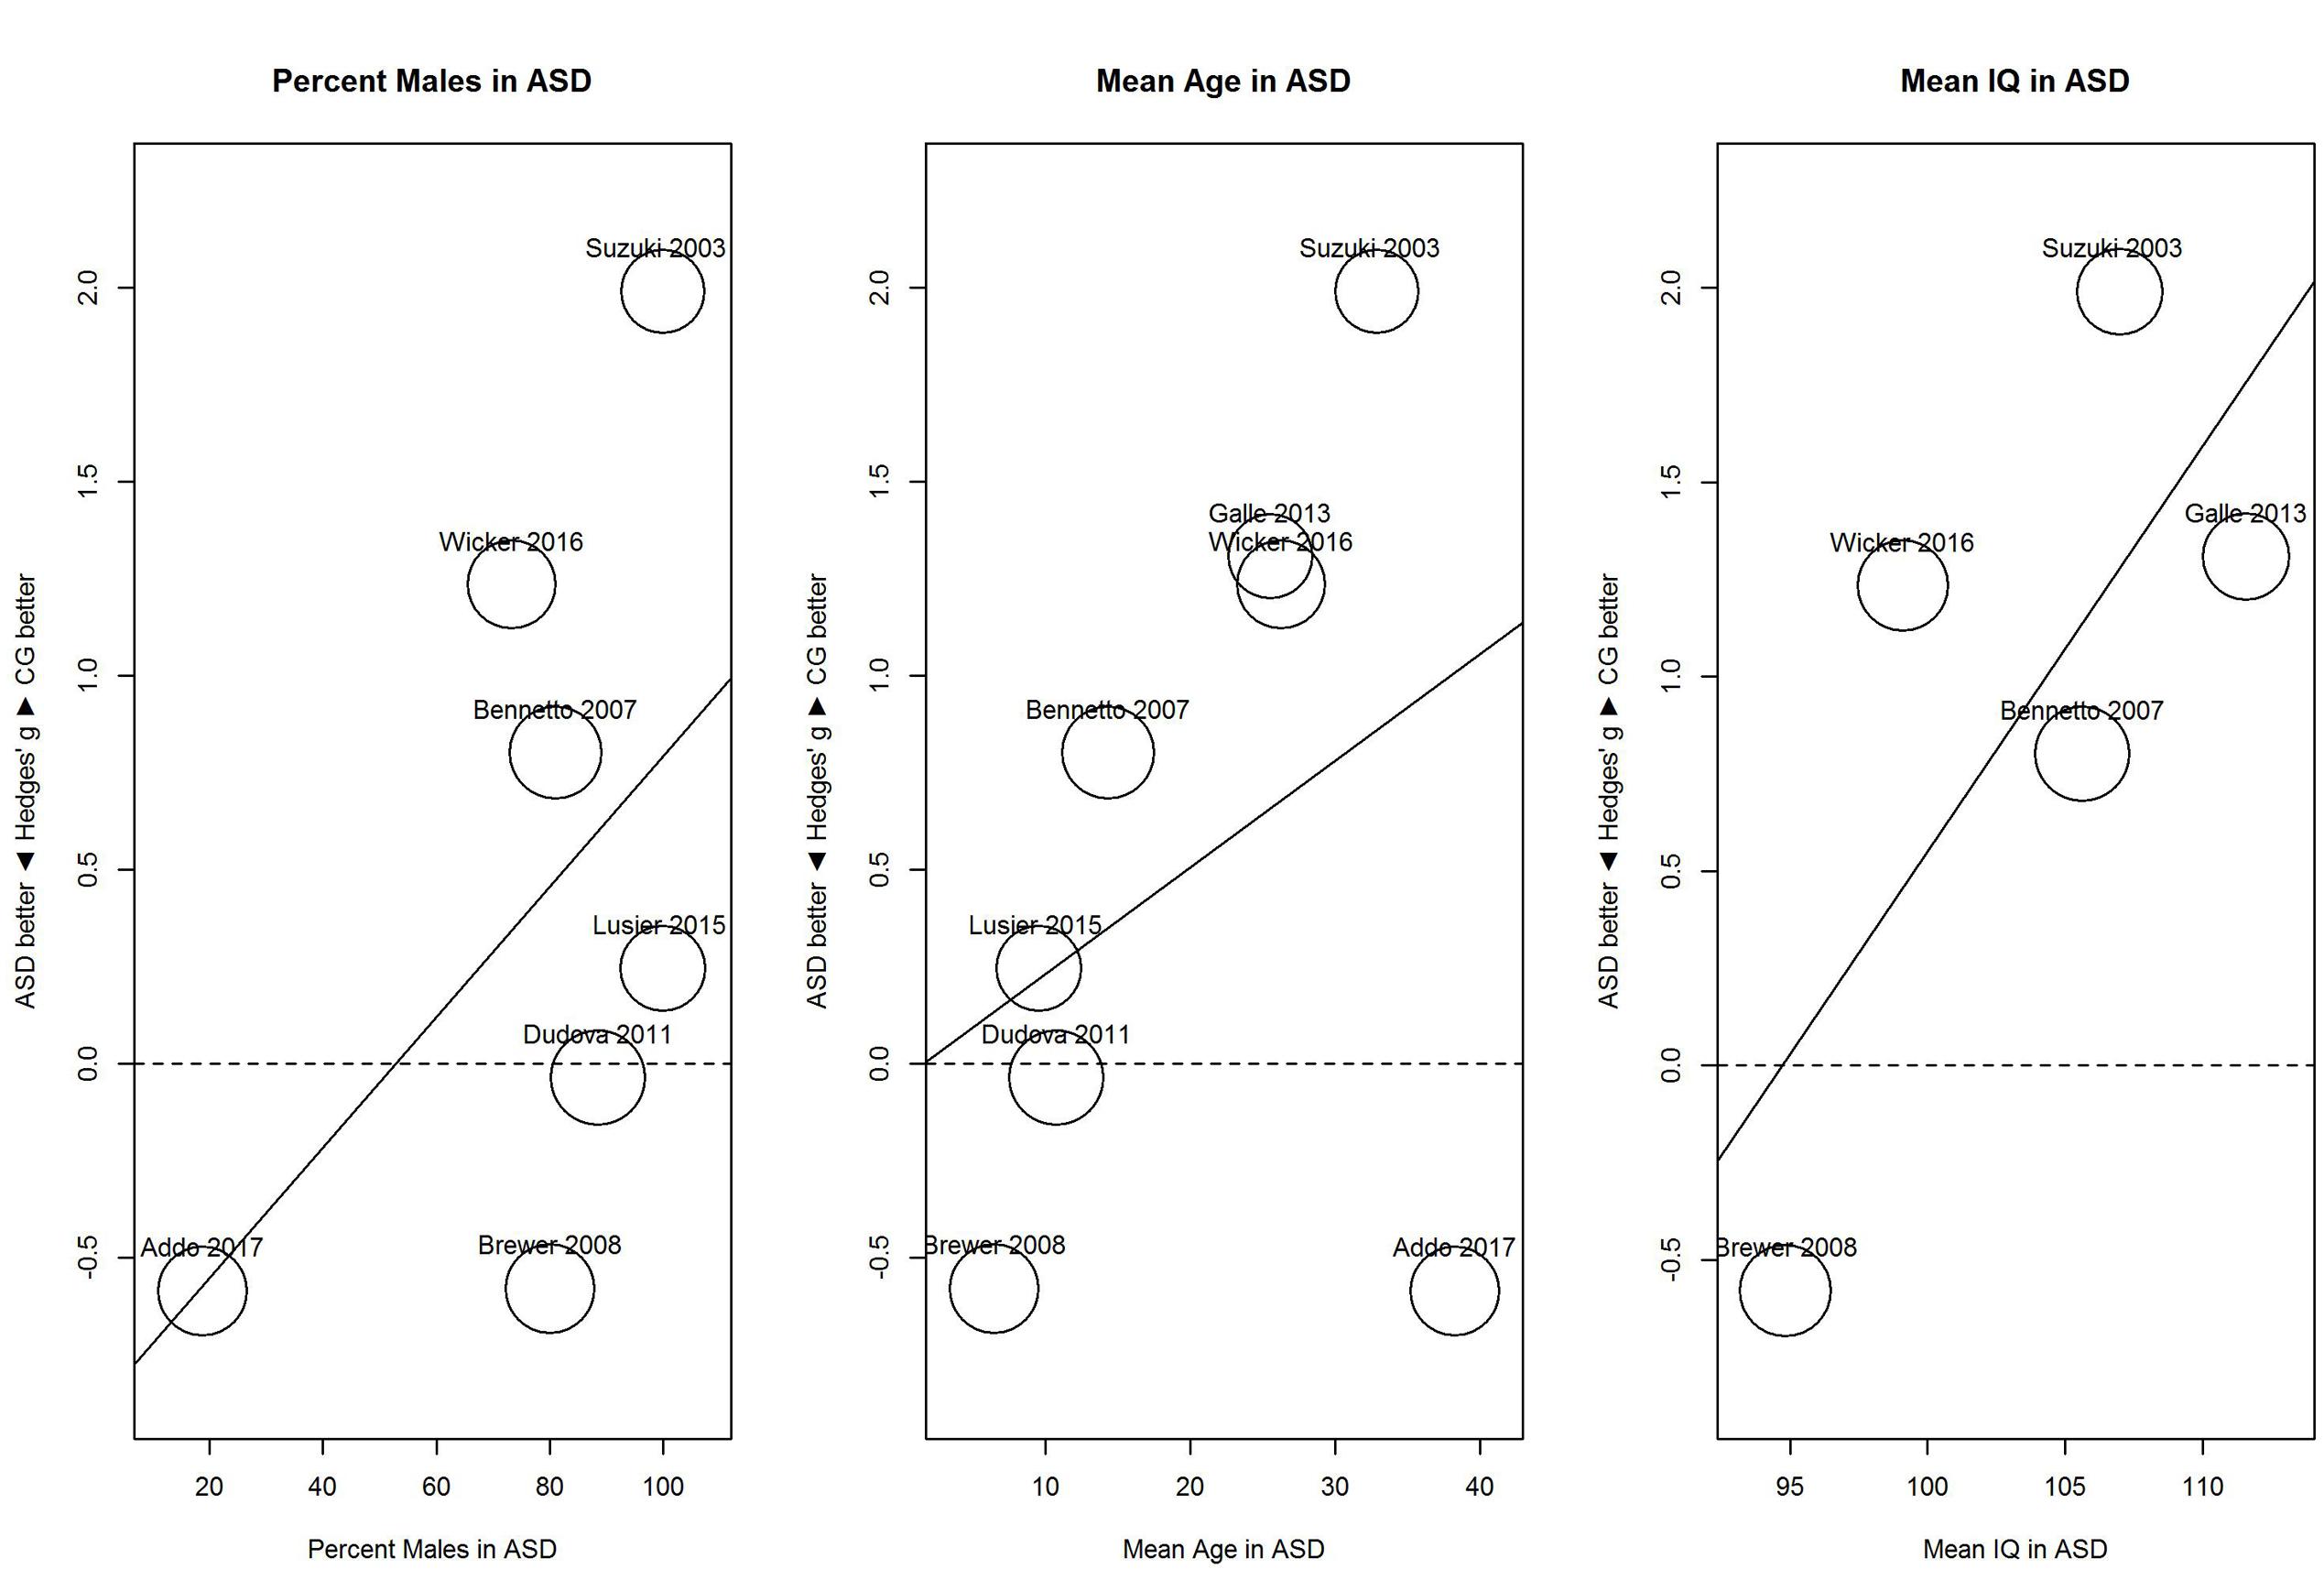
FIGURE 6. Scatterplots of the relation with performance on the odor identification task in terms of percent males in the ASD group (left panel), mean age in the ASD group (middle panel), and mean IQ in the ASD group (right panel). For positive performance values, CG was better than ASD, and vice versa. ASD, autism spectrum disorder group; CG, control group.
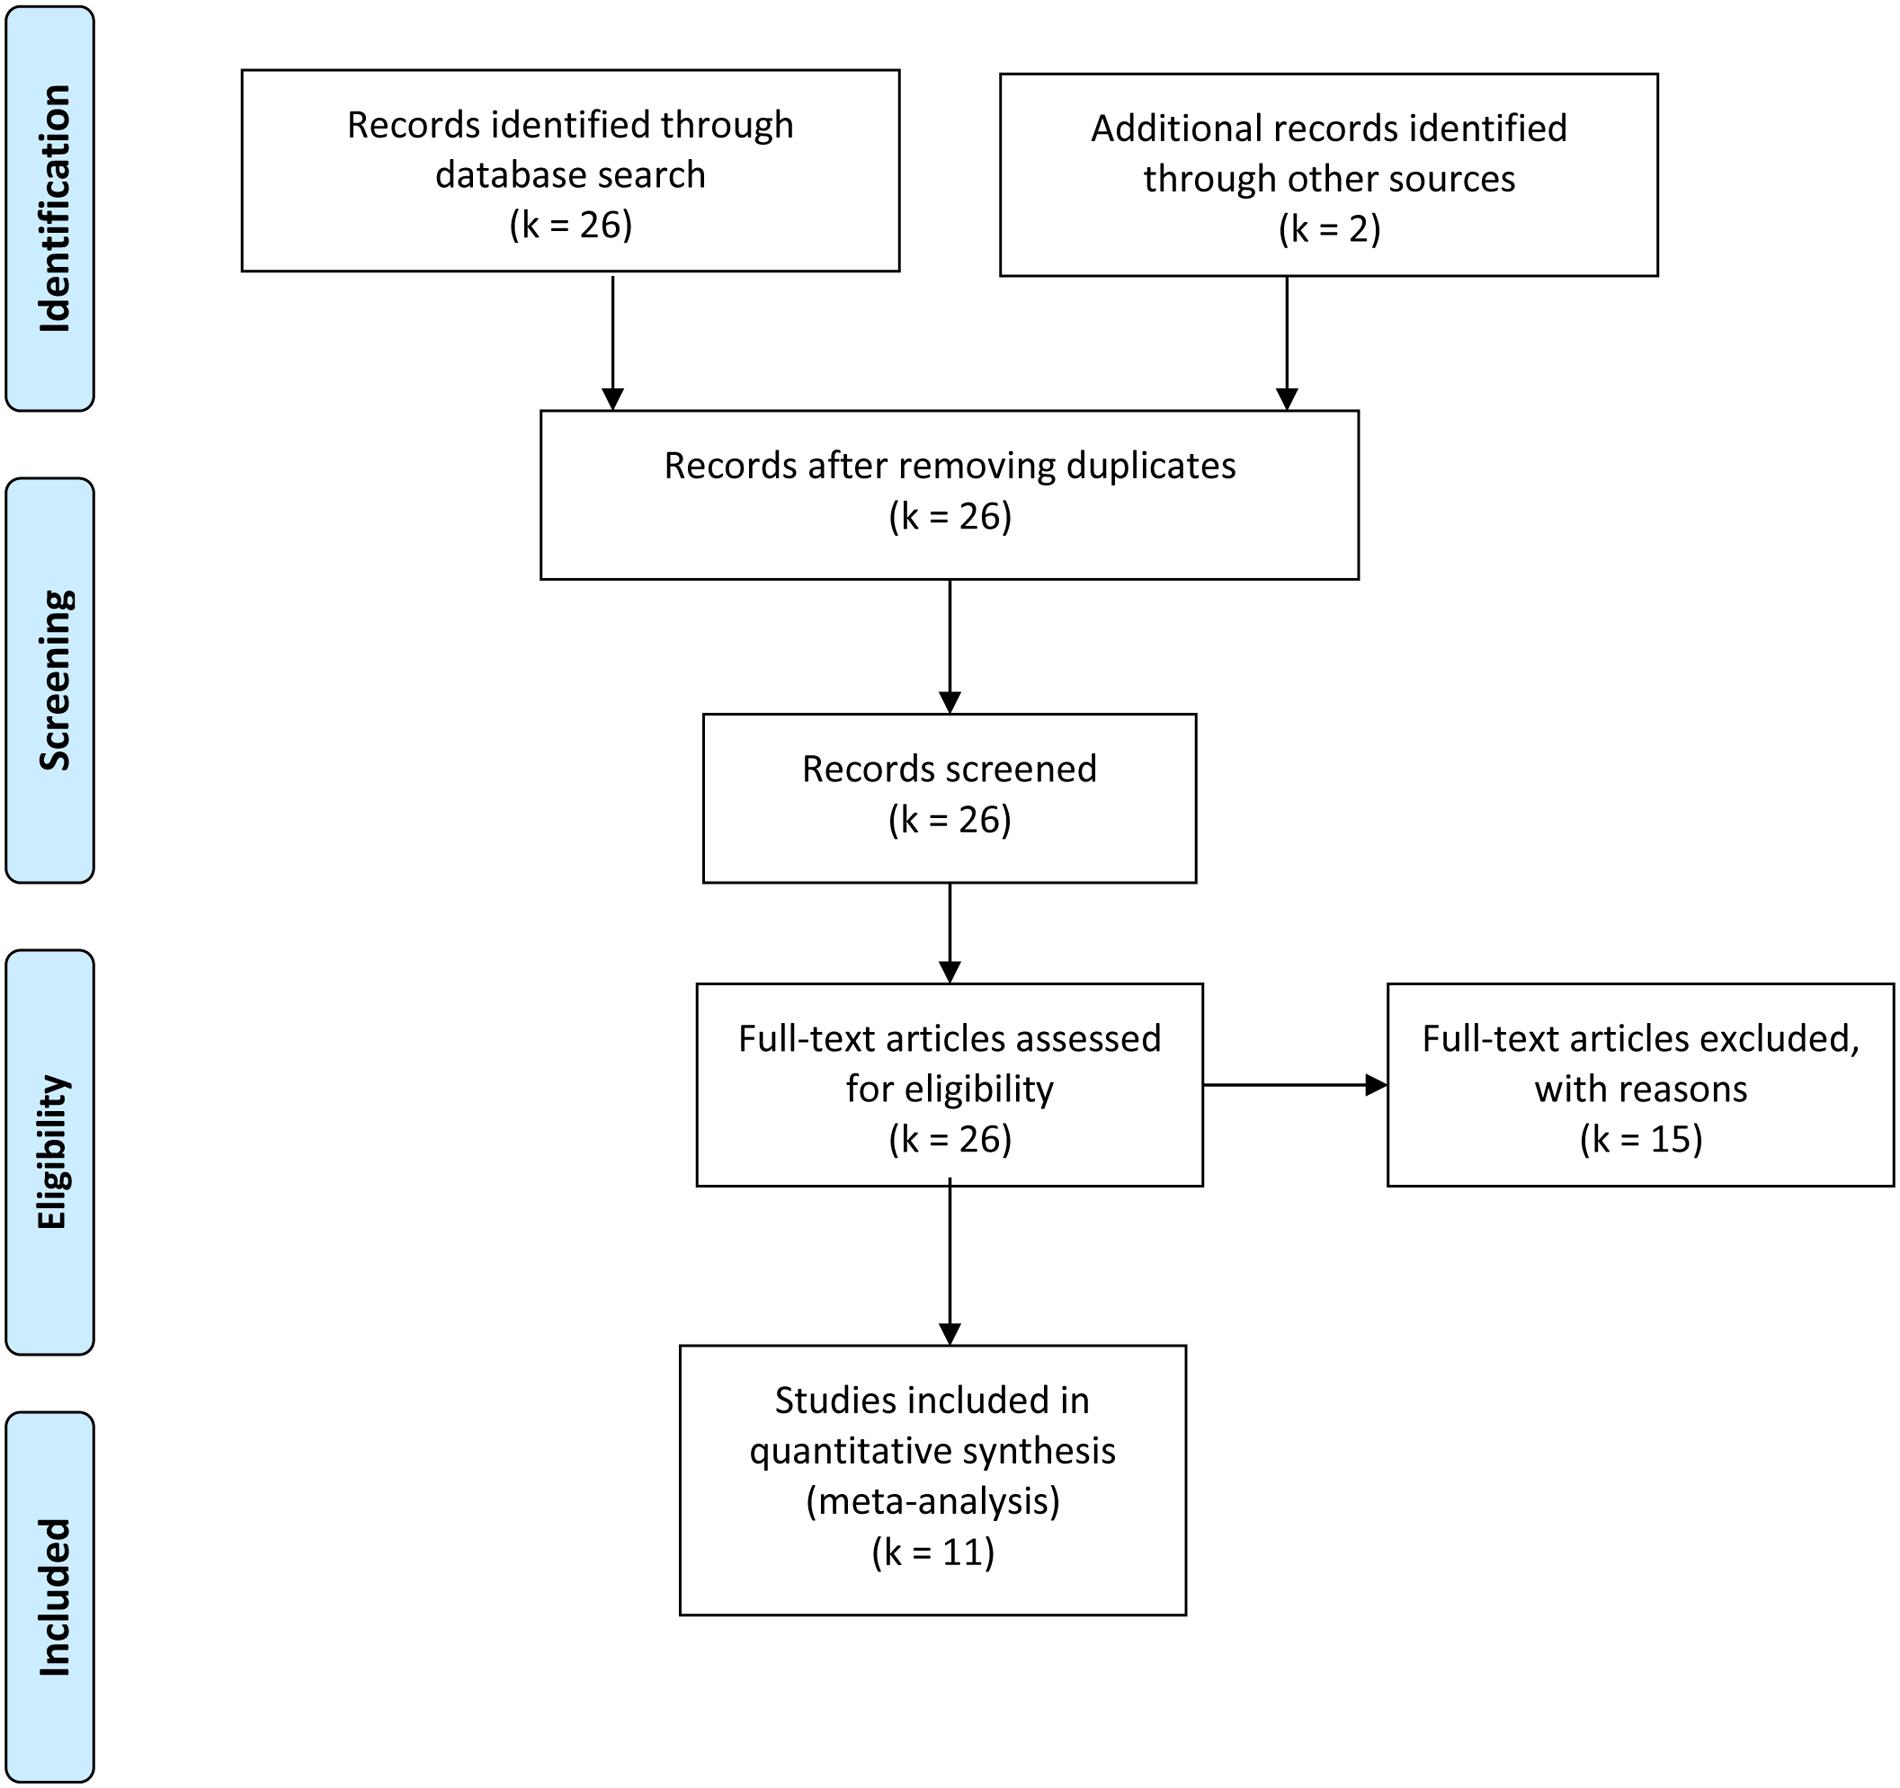
FIGURE 7. Publications’ selection process.
Discussion
The goal of the present study was to summarize quantitatively the empirical evidence for changes in olfactory function in individuals with ASD. Although only few studies with small sample sizes were available, the meta-analysis provided strong evidence that the effect sizes varied substantially among the studies for both threshold and identification tasks. This heterogeneity is clearly apparent in the large 95% prediction intervals (see Figures 1, 3) for the threshold task [-1.86, 2.05] and for the identification task [-1.51, 2.52]. These intervals imply that for a future study, the true effect size may fall between very negative and very positive. As such, the results are consistent with the idea of both hyposensitivity and hypersensitivity in individuals with ASD.
To investigate this heterogeneity, we explored the role of potential moderators that may be associated with hyposensitivity and hypersensitivity: proportion of males, mean age, and mean IQ score in the ASD group. For threshold, mean age below 30 and mean IQ below 113 tended to be associated with hyposensitivity whereas mean age above 35 and mean IQ above 113 tended to be associated with hypersensitivity. However, mean age and mean IQ correlated with each other (r = 0.72). This makes it difficult to separate the unique contribution of each variable. For identification, increases in mean IQ were associated with increased hyposensitivity. These results are surprising because they suggest that mean IQ is associated with opposite effects depending on the task: increased mean IQ is associated with hypersensitivity on a threshold task and hyposensitivity on an identification task. However, these findings from the meta-regression need to be interpreted carefully (Borenstein et al., 2009). First, they are based on few studies with low precision and thus, the findings are very tentative. Second, they are based on mean differences in the groups and may not apply to individual data (i.e., ecological fallacy). Third, mean IQ may be only a correlate of the underlying, yet unknown mechanism.
Given the substantial heterogeneity among observed effect sizes, future research should focus on a particular group of individuals to establish hyposensitivity or hypersensitivity (or neither). Notably, the present results imply that 35-year old males with ASD and an IQ around 115 would show opposite effects on threshold and identification tasks, that is, hypersensitivity on the threshold task and hyposensitivity on the identification task. To determine if this is not simply a chance finding, future research should study well-characterized individuals with standardized methods and consider the role of potential moderators. Any potential moderators should be reported completely to avoid missing data. Sample size should be large to reduce the uncertainty in the obtained estimate. Although a power analysis is often recommended to determine sample size, a power analysis seems cumbersome in the present context, as the effect sizes were heterogeneous and their direction was unclear. Critically, a power analysis is meaningful only from the perspective of null hypothesis significance testing with its focus on the p-value. In contrast, a Bayesian approach would allow researchers to analyze the data after every participant (Wagenmakers et al., 2015). This simplifies data collection because participants would not have to be recruited unnecessarily. In the Bayesian approach, participants might be recruited until the evidence is strong (e.g., Bayes Factor > 10). In the analysis, a default prior could be used that predicts only the direction of the effect (hyposensitivity or hypersensitivity), and subsequent analyses could evaluate the robustness of the findings depending on the prior (Wagenmakers et al., 2016). Another advantage is that Bayesian analysis can provide support for the null hypothesis (i.e., there is no group difference), something that null hypothesis significance testing cannot provide, even in high-powered studies (Dienes, 2016); for an example in addiction research, see here (Beard et al., 2016). Also, Bayesian analyses permit the calculation of credible intervals (Wiens and Nilsson, 2016). These capture the actual precision of the estimate, whereas it is incorrect to interpret confidence intervals in terms of precision (Morey et al., 2015). Furthermore, the study should be pre-registered and designed to minimize risk of bias (Nosek and Lakens, 2014; Nuzzo, 2015). Last, the raw data should be available online to facilitate future meta-analyses (Nosek et al., 2015; Munafò et al., 2017). In particular, meta-analyses that use the raw data (rather than aggregated data) can model individual data to avoid typical fallacies such as the ecological fallacy (Lakens et al., 2016).
Conclusion
The present meta-analysis provides convincing evidence for heterogeneity among effect sizes that exceeds that expected by chance. Demographic variables such as age and IQ may account, at least in part, for this heterogeneity, and their effects may differ depending on the task. Future studies should be conducted on well-defined samples with standard methods to assess olfactory functions in ASD. If a study is pre-registered and uses Bayesian statistics, participants could be added consecutively until the evidence is convincing for hyposensitivity, hypersensitivity, or neither.
Author Contributions
ML and SW developed the study concept. ML and CT jointly searched the databases and extracted the data. SW analyzed the data and produced the figures. ML, CT, and SW wrote the manuscript.
Conflict of Interest Statement
The authors declare that the research was conducted in the absence of any commercial or financial relationships that could be construed as a potential conflict of interest.
Acknowledgments
Funded by internal funds from Stockholm University, a program research grant from The Swedish Foundation for Humanities and Social Sciences (M14-0375:1) to ML, and a research grant from the Swedish Research Council (2015-01181) to SW. We thank Kim Ströberg for assistance in data extraction.
Footnotes
- * Included in the meta-analysis
References
*Addo, R. N., Wiens, S., Nord, M., and Larsson, M. (2017). Olfactory functions in adults with autism spectrum disorders. Perception 46, 530–537. doi: 10.1177/0301006616686100
American Psychiatric Association [APA] (2013). Diagnostic and Statistical Manual of Mental Disorders: DSM-V. Arlington, VA: American Psychiatric Publishing, Inc.
American Psychiatric Association [APA] (2016). Supplement to Diagnostic and Statistical Manual of Mental Disorders: DSM-V. Arlington, VA: American Psychiatric Publishing, Inc.
*Ashwin, C., Chapman, E., Howells, J., Rhydderch, D., Walker, I., and Baron-Cohen, S. (2014). Enhanced olfactory sensitivity in autism spectrum conditions. Mol. Autism 5:53. doi: 10.1186/2040-2392-5-53
Beard, E., Dienes, Z., Muirhead, C., and West, R. (2016). Using Bayes factors for testing hypotheses about intervention effectiveness in addictions research. Addiction 111, 2230–2247. doi: 10.1111/add.13501
*Bennetto, L., Kuschner, E. S., and Hyman, S. L. (2007). Olfaction and taste processing in autism. Biol. Psychiatry 62, 1015–1021. doi: 10.1016/j.biopsych.2007.04.019
Borenstein, M., Hedges, L. V., Higgins, J. P. T., and Rothstein, H. R. (2009). Introduction to Meta-Analysis. Hoboken, NJ: John Wiley & Sons, Ltd.
Brang, D., and Ramachandran, V. S. (2010). Olfactory bulb dysgenesis, mirror neuron system dysfunction, and autonomic dysregulation as the neural basis for autism. Med. Hypotheses 74, 919–921. doi: 10.1016/j.mehy.2008.11.048
*Brewer, W. J., Brereton, A., and Tonge, B. J. (2008). Dissociation of age and ability on a visual analogue of the University of Pennsylvania Smell Identification Test in children with autism. Res. Autism Spectr. Disord. 2, 612–620. doi: 10.1016/j.rasd.2008.01.003.
Brewer, W. J., Pantelis, C., De Luca, C., and Wood, S. J. (2006). “Olfactory processing and brain maturation,” in Olfaction and the Brain, eds W. J. Brewer, D. J. Castle, and C. Pantelis (Cambridge: Cambridge University Press), 103–118.
Corcoran, C., Whitaker, A., Coleman, E., Fried, J., Feldman, J., Goudsmit, N., et al. (2005). Olfactory deficits, cognition and negative symptoms in early onset psychosis. Schizophr. Res. 80, 283–293. doi: 10.1016/j.schres.2005.07.028
Crane, L., Goddard, L., and Pring, L. (2009). Sensory processing in adults with autism spectrum disorders. Autism 13, 215–228. doi: 10.1177/1362361309103794
Del Re, A. C. (2015). A practical tutorial on conducting meta-analysis in R. Quant. Methods Psychol. 11, 37–50.
Dienes, Z. (2016). How Bayes factors change scientific practice. J. Math. Psychol. 72, 78–89. doi: 10.1016/j.jmp.2015.10.003
Doty, R. L., Shaman, P., and Dann, M. (1984). Development of the University of Pennsylvania smell identification test: a standardized microencapsulated test of olfactory function. Physiol. Behav. 32, 489–502. doi: 10.1016/0031-9384(84)90269-5
Dudova, I., and Hrdlicka, M. (2013). Olfactory functions are not associated with autism severity in autism spectrum disorders. Neuropsychiatr. Dis. Treat. 9, 1847–1850. doi: 10.2147/ndt.s54893
*Dudova, I., Vodicka, J., Havlovicova, M., Sedlacek, Z., Urbanek, T., and Hrdlicka, M. (2011). Odor detection threshold, but not odor identification, is impaired in children with autism. Eur. Child Adolesc. Psychiatry 20, 333–340. doi: 10.1007/s00787-011-0177-1
*Galle, S. A., Courchesne, V., Mottron, L., and Frasnelli, J. (2013). Olfaction in the autism spectrum. Perception 42, 341–355. doi: 10.1068/p7337
Hrdlicka, M., Vodicka, J., Havlovicova, M., Urbanek, T., Blatny, M., and Dudova, I. (2011). Brief report: significant differences in perceived odor pleasantness found in children with asd. J. Autism. Dev. Disord. 41, 524–527. doi: 10.1007/s10803-010-1084-x
Hummel, T., Sekinger, B., Wolf, S. R., Pauli, E., and Kobal, G. (1997). ’Sniffin’ Sticks’: olfactory performance assessed by the combined testing of odor identification, odor discrimination, and olfactory threshold. Chem. Senses 22, 39–52. doi: 10.1093/chemse/22.1.39
Jones, R. S. P., Quigney, C., and Huws, J. C. (2003). First-hand accounts of sensory perceptual experiences in autism: a qualitative analysis. J. Intellect. Dev. Disabil. 28, 112–121. doi: 10.1080/1366825031000147058
*Kumazaki, H., Muramatsu, T., Fujisawa, T. X., Miyao, M., Matsuura, E., Okada, K., et al. (2016). Assessment of olfactory detection thresholds in children with autism spectrum disorders using a pulse ejection system. Mol. Autism 7:6. doi: 10.1186/s13229-016-0071-2
Lakens, D. (2013). Calculating and reporting effect sizes to facilitate cumulative science: a practical primer for t-tests and ANOVAs. Front. Psychol. 4:863. doi: 10.3389/fpsyg.2013.00863
Lakens, D., Hilgard, J., and Staaks, J. (2016). On the reproducibility of meta-analyses: six practical recommendations. BMC Psychology 4:24. doi: 10.1186/s40359-016-0126-3
Lane, A. E., Young, R. L., Baker, A. E., and Angley, M. T. (2010). Sensory processing subtypes in autism: association with adaptive behavior. J. Autism. Dev. Disord. 40, 112–122. doi: 10.1007/s10803-009-0840-2
Liu, X., Liu, J., Xiong, X., Yang, T., Hou, N., Liang, X., et al. (2016). Correlation between nutrition and symptoms: nutritional survey of children with autism spectrum disorder in Chongqing, China. Nutrients 8:294. doi: 10.3390/nu8050294
*Luisier, A. C., Petitpierre, G., Ferdenzi, C., Bérod, A. C., Giboreau, A., Rouby, C., et al. (2015). Odor perception in children with autism spectrum disorder and its relationship to food neophobia. Front. Psychol. 6:1830. doi: 10.3389/fpsyg.2015.01830
Martin, G. N., and Daniel, N. (2014). Autism spectrum disorders and chemoreception: dead-end or fruitful avenue of inquiry? Front. Psychol. 5:42.
May, T., Brewer, W. J., Rinehart, N. J., Enticott, P. G., Brereton, A. V., and Tonge, B. J. (2011). Differential olfactory identification in children with autism and Asperger’s disorder: a comparative and longitudinal study. J. Autism. Dev. Disord. 41, 837–847. doi: 10.1007/s10803-010-1101-0
Morey, R. D., Hoekstra, R., Rouder, J. N., Lee, M. D., and Wagenmakers, E.-J. (2015). The fallacy of placing confidence in confidence intervals. Psychon. Bull. Rev. 23, 103–123. doi: 10.3758/s13423-015-0947-8
Munafò, M. R., Nosek, B. A., Bishop, D. V. M., Button, K. S., Chambers, C. D., Percie du Sert, N., et al. (2017). A manifesto for reproducible science. Nat. Hum. Behav. 1:0021. doi: 10.1038/s41562-016-0021
Nosek, B. A., Alter, G., Banks, G. C., Borsboom, D., Bowman, S. D., Breckler, S. J., et al. (2015). Promoting an open research culture. Science 348, 1422–1425. doi: 10.1126/science.aab2374
Nováková, L. M., and Mrzílková, R. V. (2016). Children’s exposure to odors in everyday contexts predicts their odor awareness. Chemosens. Percept. 9, 56–68. doi: 10.1007/s12078-016-9205-3
Nuzzo, R. (2015). How scientists fool themselves-and how they can stop. Nature 526, 182–185. doi: 10.1038/526182a
Rentowl, P., and Hanning, C. D. (2004). Odour identification as a marker for postoperative cognitive dysfunction: a pilot study. Anaesthesia 59, 337–343. doi: 10.1111/j.1365-2044.2004.03678.x
Rogers, S. J., Hepburn, S., and Wehner, E. (2003). Parent reports of sensory symptoms in toddlers with autism and those with other developmental disorders. J. Autism. Dev. Disord. 33, 631–642.
Rozenkrantz, L., Zachor, D., Heller, I., Plotkin, A., Weissbrod, A., Snitz, K., et al. (2015). A mechanistic link between olfaction and autism spectrum disorder. Curr. Biol. 25, 1904–1910. doi: 10.1016/j.cub.2015.05.048
Schwarzer, G. (2007). meta: an R package for meta-analysis. R News 7, 40–45. doi: 10.3389/fpsyg.2014.01521
Silverman, J. L., Yang, M., Lord, C., and Crawley, J. N. (2010). Behavioural phenotyping assays for mouse models of autism. Nat. Rev. Neurosci. 11, 490–502. doi: 10.1038/nrn2851
Small, D. M., and Pelphrey, K. A. (2015). Autism spectrum disorder: sniffing out a new biomarker. Curr. Biol. 25, R674–R676. doi: 10.1016/j.cub.2015.06.050
*Suzuki, Y., Critchley, H. D., Rowe, A., Howlin, P., and Murphy, D. G. M. (2003). Impaired olfactory identification in Asperger’s syndrome. J. Neuropsychiatry Clin. Neurosci. 15, 105–107. doi: 10.1176/appi.neuropsych.15.1.105
*Tavassoli, T., and Baron-Cohen, S. (2012). Olfactory detection thresholds and adaptation in adults with autism spectrum condition. J. Autism. Dev. Disord. 42, 905–909. doi: 10.1007/s10803-011-1321-y
Wagenmakers, E. J., Morey, R. D., and Lee, M. D. (2016). Bayesian benefits for the pragmatic researcher. Curr. Dir. Psychol. Sci. 25, 169–176. doi: 10.1177/0963721416643289
Wagenmakers, E.-J., Verhagen, J., Ly, A., Bakker, M., Lee, M. D., Matzke, D., et al. (2015). A power fallacy. Behav. Res. Methods 47, 913–917. doi: 10.3758/s13428-014-0517-4
*Wicker, B., Monfardini, E., and Royet, J. P. (2016). Olfactory processing in adults with autism spectrum disorders. Mol. Autism 7:4. doi: 10.1186/s13229-016-0070-3
Keywords: autism, olfactory sense, meta-analysis, odor threshold, odor identification
Citation: Larsson M, Tirado C and Wiens S (2017) A Meta-Analysis of Odor Thresholds and Odor Identification in Autism Spectrum Disorders. Front. Psychol. 8:679. doi: 10.3389/fpsyg.2017.00679
Received: 20 February 2017; Accepted: 19 April 2017;
Published: 11 May 2017.
Edited by:
Kathrin Ohla, Medical School Berlin, GermanyReviewed by:
Jessica Freiherr, RWTH Aachen University, GermanyEmilia Iannilli, Technische Universität Dresden, Germany
Copyright © 2017 Larsson, Tirado and Wiens. This is an open-access article distributed under the terms of the Creative Commons Attribution License (CC BY). The use, distribution or reproduction in other forums is permitted, provided the original author(s) or licensor are credited and that the original publication in this journal is cited, in accordance with accepted academic practice. No use, distribution or reproduction is permitted which does not comply with these terms.
*Correspondence: Maria Larsson, maria.larsson@psychology.su.se