
- 1 Face Categorization Lab, Faculté de Psychologie et des Sciences de l’Education, Université Catholique de Louvain, Louvain-la-Neuve, Belgium
- 2 Department of Psychology, The University of Sheffield, Sheffield, UK
- 3 Laboratoire de Psychologie et Neurocognition, Centre national de la recherche scientifique, Université Pierre Mendes, Grenoble, France
Early deprivation in audition can have striking effects on the development of visual processing. Here we investigated whether early deafness induces changes in holistic/configural face processing. To this end, we compared the results of a group of early deaf participants to those of a group of hearing participants in an inversion-matching task (Experiment 1) and a composite face task (Experiment 2). We hypothesized that deaf individuals would show an enhanced inversion effect and/or an increased composite face effect compared to hearing controls in case of enhanced holistic/configural face processing. Conversely, these effects would be reduced if they rely more on facial features than hearing controls. As a result, we found that deaf individuals showed an increased inversion effect for faces, but not for non-face objects. They were also significantly slower than hearing controls to match inverted faces. However, the two populations did not differ regarding the overall size of their composite face effect. Altogether these results suggest that early deafness does not enhance or reduce the amount of holistic/configural processing devoted to faces but may increase the dependency on this mode of processing.
Introduction
Traditionally, there have been two main views on how humans recognize faces: the analytical view and the holistic/configural view (Ellis, 1975; Sergent, 1986). According to the analytical view (e.g., Haig, 1984; Gosselin and Schyns, 2001; Sadr et al., 2003), observers explore a face by scanning local features in order to extract the most diagnostic information to individualize the face. According to the holistic/configural view, the features are not perceived and represented independently of each other. Instead the face is perceived as an integrated whole (Sergent, 1986; Tanaka and Farah, 1993; Farah et al., 1998; Maurer et al., 2002; Rossion, 2008). The holistic/configural view has been mainly supported by behavioral studies showing that the perception of a given facial feature (e.g., a local element such as an eye, a distance between two elements, or even half of a face) is influenced by the position and the identity of other facial features (Sergent, 1986; Young et al., 1987; Tanaka and Farah, 1993; Farah et al., 1998).
Holistic/configural processing matures early on (e.g., Tanaka et al., 1998; de Heering et al., 2007) and its integrity depends on early visual experience (e.g., Maurer et al., 2007). This is illustrated by studies performed with patients who missed early visual inputs because a dense and opaque cataract blocked any patterned visual input to reach the retina at birth, until the day of surgery. Specifically, when tested at adulthood, these cataract-reversal patients perform worse than age-matched controls when they have to discriminate faces that differ in term of the relative distance between the features (Le Grand et al., 2001). Contrary to age-matched controls, their matching of half of a face is also not influenced by the identity of the other half (absence of composite face effect; Le Grand et al., 2004).
An unresolved issue is whether the absence of early inputs in another modality than vision, audition for instance, can modulate holistic/configural processing. There are a few reasons why this could be the case. First, it has been suggested, in agreement with some experiments performed on animals, that enhanced visual performance is found in specific regions of the auditory cortex of congenital deaf cats (e.g., Lomber et al., 2010; for a review, see Rauschecker, 1995). The same phenomenon has also been observed in humans (for a review, see Bavelier and Neville, 2002). More specifically, the absence of audition, sometimes together with the use of sign language, has been identified as a potential factor favoring intermediate and high-level vision: deaf are better than hearing controls to perform mental rotation (Emmorey et al., 1993) and gestalt completion (Siple et al., 1978), as well as to detect (Loke and Song, 1991; Stivalet et al., 1998; Armstrong et al., 2002) and discriminate (Neville and Lawson, 1987) moving stimuli appearing in periphery but not in the center of the visual field (Bavelier et al., 2000, 2006; Bosworth and Dobkins, 2002; Buckley et al., 2010; although, see Hauser et al., 2007).
Regarding face recognition abilities, deaf individuals’ superiority over hearing, as well as the exact role of early exposure to sign language is still debated. Using a card memory game, Arnold and Murray (1998) found that deaf signers were better than hearings signers to match faces, but not objects. In turn, hearing signers performed better than hearing non-signers. Given these results, the authors attributed deaf superiority to their use of sign language and raised the appealing possibility that deafness and the long use of sign language might have additive effects. However these authors did not control for the age of sign language acquisition, which makes strong conclusions about the importance of signing difficult to make. Later on, Arnold and Mills (2001) compared the performance of a group of deaf signers, hearing signers, and hearing non-signers in a task where they had to memorize the location of objects, faces, and shoes. They found deaf signers to perform like hearing signers, both of whom were better than hearing non-signers on the face and shoe task. Along the same line, Bettger et al. (1997) reported that deaf individuals using American signed language (ASL) performed significantly better than hearing non-signers at discriminating face photographs presented under different views and lighting. In another experiment, the same authors showed that hearing signers born from deaf parents also show better results than hearing non-signers in this task, suggesting indirectly that the enhanced performance of deaf signers is linked to their experience with ASL rather than to their auditory deprivation. Interestingly deaf signers’ expertise with upright faces does not extend to inverted faces (Bettger et al., 1997), Mooney faces or the recognition of the faces of the Warrington test (1984) in which participants have to recognize previously memorized faces (McCullough and Emmorey, 1997).
Although McCullough and Emmorey’ (1997) study shows a superiority of deaf people to detect subtle manipulations introduced at the level of the mouth, the studies described above focus more on the global level of performance of this population with faces than on how they process faces. Here we addressed this issue by testing a group of deaf participants and a group of hearing participants in an inversion-matching task (Experiment 1) and a composite face task (Experiment 2). In Experiment 1, we used picture-plane inversion as a manipulation because it disrupts the ability to process faces to a greater extent than what is observed for non-face stimuli (Yin, 1969). Specifically, it has been suggested that whereas upright faces are encoded as integrated wholes, inverted faces are rather processed feature-by-feature, in a piecemeal manner (e.g., Yin, 1969; Sergent, 1984; Farah et al., 1995; Maurer et al., 2002; Rossion, 2008, 2009). Here, we hypothesized that, independently of whether the stimuli are presented simultaneously on the screen (Experiment 1A) or with a delay between the target and the probes (Experiment 1B), if deaf participants focus more than hearing participants on the details of the faces such as the mouth for example, as previously suggested by McCullough and Emmorey (1997), they could show a reduced or abolished inversion effect. Indeed it has been shown that individuals with acquired prosopagnosia, who rely more on some facial features than controls without being able to integrate them into a coherent template, show an abolished face inversion effect (see Busigny and Rossion, 2010 for a recent review). Alternatively, if deaf individuals integrate facial features to a greater extent than hearing controls because they are used to process a largely distributed range of visual information (by simultaneously processing the mouth and the eyes to understand the syntactic structure of a sentence, for example), they could show an equally large or even enhanced face inversion effect compared to hearing controls. In Experiment 2, we used the composite face effect originally reported by Young et al. (1987). In the context of a matching task with unfamiliar faces (Hole, 1994), it refers to the observation that two identical top parts of a face are perceived as slightly different if their respective bottom parts belong to different facial identities. This perceptual illusion is abolished or strongly reduced if the top and the bottom parts of the face are laterally offset. Here we used the paradigm as it is generally used, asking participants to pay attention to the top parts of the faces while their bottom halves are different (Experiment 2A). We expected hearing participants to show a strong composite effect on accuracy and/or correct response times (for empirical demonstrations, see for example, Hole, 1994; Le Grand et al., 2004; Goffaux and Rossion, 2006; Michel et al., 2006; Rossion and Boremanse, 2008). Consistently with the predictions of Experiment 1, we also hypothesized that deaf individuals would show a larger composite effect than hearing controls in case of enhanced holistic/configural face processing. Conversely, their composite effect would be reduced if they rely more on facial features than hearing controls. Participants were also asked to judge the bottom parts of another set of composite faces (Experiment 2B). As previously shown (Young et al., 1987; Ramon et al., 2010), we expected hearing participants to show a smaller composite effect than in Experiment 2A. We also hypothesized that deaf participants would be less affected than hearing participants in this part of the experiment because of their everyday use of lip-reading.
Experiment 1: The Inversion Effect
Methods
Participants
The sample was composed of 35 deaf participants (mean age: 36 years; 12 males) from Belgium (N = 20; mean age: 38 years; six males; two left-handed) and the United Kingdom (N = 15; mean age: 35 years; six males; all right-handed). None had history of neurological disorder and they were all characterized by a severe to profound hearing loss (>80 dB, based on a questionnaire, see Table 1). We refer to our participants as early deaf because they were either congenitally deaf (N = 25; 71%), became deaf between 9 months and 13 years of age (N = 8; 23%) or were deaf from an undetermined period during childhood because of the absence of an early diagnosis (N = 2; 6%). With the exception of two participants who became deaf during infancy/childhood and who were not fluent at signing, all participants were using signed language that they learned thanks to one or two deaf signing parents or the attendance to a school where sign language was promoted (for more details, see Table 1). Thirty-five Belgian (N = 20; mean age: 37 years; five males; one left-handed) and British (N = 15; mean age: 34 years; six males; all right-handed) hearing adults were also tested. None of them had signing expertise. The hearing group matched the non-hearing group in sex and age [t(68) = 0.227, p = 0.821]. Every participant had normal or corrected-to-normal visual acuity.
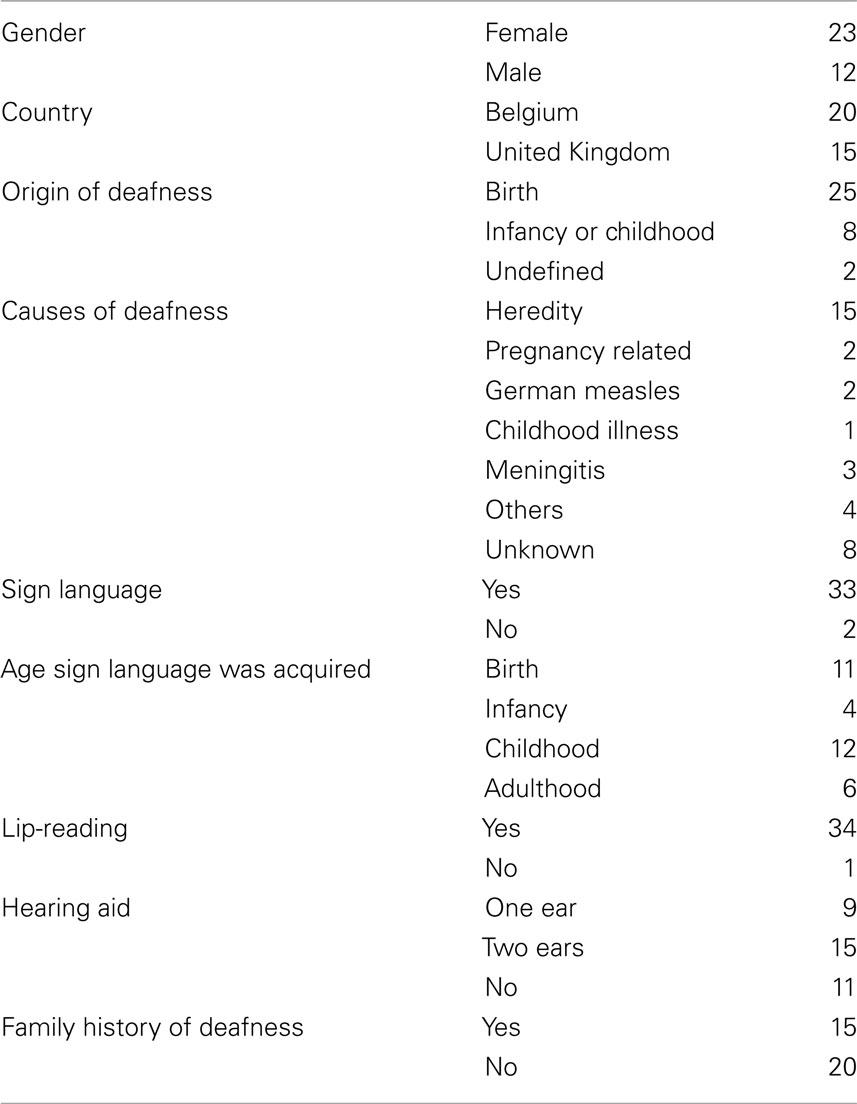
Table 1. Characteristics of the deaf sample.
Stimuli
In both experiments (Experiment 1A–Experiment 1B), grayscale photographs of 24 individuals (12 women) and 24 cars were used. One full-front and one 3/4 profile of each face and car picture were created. Faces and cars subtended 5 × 7.8° and 7.1 × 5.7° of visual angle, respectively. All stimuli were displayed on a white background and presented either in upright or inverted orientation. More details about the stimuli are provided in Busigny and Rossion (2010).
Procedure
Participants were tested at home on a laptop computer (Belgium) or at the Department of Psychology of the University of Sheffield on a computer monitor (United Kingdom), at a viewing distance of 50 cm. Stimuli were controlled by E-prime 1.1. Participants had to locate the target between two 3/4 profile items presented at the bottom of the screen (simultaneous presentation, Experiment 1A; Figure 1), or on another screen after a target presented centrally (delayed presentation, Experiment 1B; Figure 2). The order of the experiments was counterbalanced across participants. The orientation (upright/inverted) of the target was consistent between the probe and the distracter. In the simultaneous version of the test (Experiment 1A), a trial ended by participant’s response and was followed by a 1000-ms inter-stimulus interval. In the delayed version of the test (Experiment 1B), each trial started with a blank screen (1000 ms), followed by a target (2000 ms), an inter-trial interval (1000 ms), and the probe together with a distracter until participants’ response. In all cases, participants were instructed to select the stimulus corresponding to the target, by pressing a key on a keyboard according to its position (left/right; Experiment 1A) or its similarity with the target (same/different; Experiment 1B). Experiment 1A was divided into two blocks of 72 randomized trials preceded by seven practice trials. Half of the trials (n = 36; 1/2 upright and 1/2 inverted) were composed of face stimuli, the other half of car stimuli (n = 36; 1/2 upright and 1/2 inverted). Experiment 1B was divided into two blocks of 48 randomized trials. Half of the trials were faces (n = 24; 1/2 upright and 1/2 inverted), the other half were cars (n = 24; 1/2 upright and 1/2 inverted).
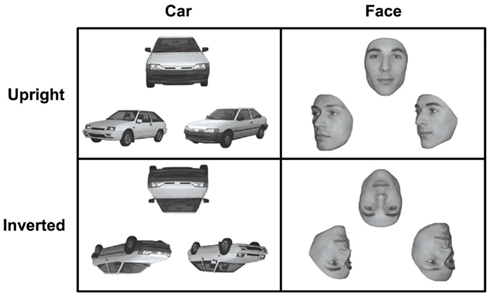
Figure 1. In Experiment 1A, participants had to decide which of the left or right stimulus (face or car) presented at the bottom of the panel corresponded to the target (face or car) presented at the top of the panel. The stimuli were presented in upright or inverted orientation.
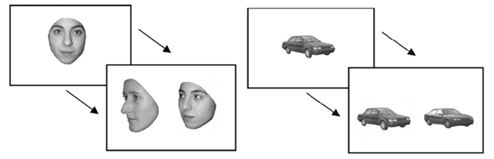
Figure 2. In Experiment 1B, participants had to decide which of the left or right stimulus (face or car) presented on a second screen corresponded to the target (face or car) presented on the first screen. The stimuli were presented in upright or inverted orientation.
Analyses
Participants’ results (Deaf: N = 35; Controls: N = 35) were analyzed separately according to whether all three stimuli were presented simultaneously (Experiment 1A) or with a delay between the target and the probes (Experiment 1B). Participants’ accuracy (% of correct responses) and correct response times (ms) that were not exceeding 3 SDs from their own average were taken into account for analyses. We performed repeated measures analyses of variance (ANOVAs) on participants’ accuracy (%) and correct response times (ms) for each experiment separately, with the orientation of the stimulus (upright vs. inverted) and the stimulus category (faces vs. cars) as within-subject factors, and the group (deaf vs. hearing) as the between-subjects factor. We further performed additional ANOVAs for each stimulus category separately as well as independent t-tests to differentiate the groups. Finally we replicated the analyses without the two non-signer participants who became deaf during infancy/childhood (Deaf: N = 33; Controls: N = 33). As their results did not significantly influence the general pattern of results, their data were included in the analyses.
Results
Experiment 1A: Simultaneous presentation
Participants were significantly more accurate with cars than with faces [F(1,68) = 175.958, p < 0.0001] as well as with upright stimuli than inverted stimuli [F(1,68) = 183.812, p < 0.0001]. The inversion effect was significant for both faces [F(1, 68) = 168.017, p < 0.0001] and cars [F(1, 68) = 20.540, p < 0.0001] and was larger for faces than for cars, as evidenced by a significant two-way interaction between the category and the orientation of the stimulus [F(1,68) = 105.129, p < 0.0001]. Deaf participants were also better than age-matched controls to match stimuli presented simultaneously [Deaf: X = 90%, SD = 6; Controls: X = 88%, SD = 6; F(1,68) = 4.187, p = 0.045]. There was no interaction between the group of participants and either the stimulus category or the stimulus orientation or between the group, the stimulus category, and the orientation of the stimulus (ps > 0.05).
Overall, participants were also faster to match cars than faces [F(1,68) = 105.318, p < 0.0001] and upright stimuli than inverted stimuli [F(1,68) = 134.847, p < 0.0001]. However there was no significant difference between deaf and hearing subjects in term of response times [F(1,68) = 3.510, p = 0.065]. As for accuracy, there was a significant inversion effect for faces [F(1,68) = 99.277, p < 0.0001] and for cars [F(1,68) = 29.447, p < 0.0001]. Furthermore the inversion effect was larger for faces than cars, as illustrated by the significant interaction between the category and the orientation of the stimulus [F(1,68) = 49.741, p < 0.0001]. A significant interaction between the group and the orientation of the stimulus [F(1,68) = 9.381, p = 0.003] was also found but, crucially for the purpose of this study, there was a significant three-way interaction between category, orientation, and group [F(1,68) = 4.389, p = 0.040]. As a follow-up on these interactions, we conducted ANOVAs for each stimulus category separately (faces/cars). We found a significant two-way interaction between the stimulus orientation and the group of participants for faces [F(1,68) = 7.607, p = 0.007] but not for cars [F(1,68) = 1.218, p = 0.274] because deaf participants were significantly slower than controls to match inverted faces [t(68) = 2.001, p = 0.049] but not upright faces [t(68) = 0.779, p = 0.438; Figure 3].
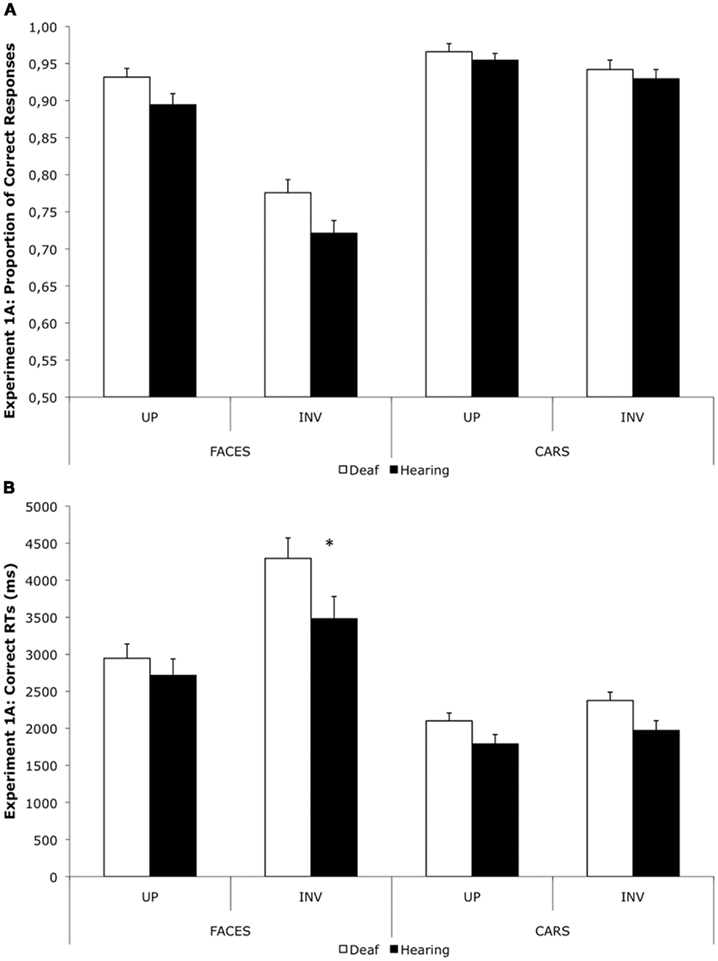
Figure 3. Proportion of correct responses (A) and correct response times (B) of deaf participants (white) and hearing participants (black) when matching upright and inverted faces or cars presented simultaneously on the screen (Experiment 1A). Bars represent SEs. Asterisks indicate significant differences between the two groups (p < 0.05).
Experiment 1B: Delayed presentation
As in Experiment 1A, participants performed significantly better with cars than with faces [F(1,68) = 168.597, p < 0.0001] as well as with upright stimuli than inverted stimuli [F(1,68) = 199.781, p < 0.0001]. These results led to significant inversion effects for both faces [F(1,68) = 209.746, p < 0.0001] and cars [F(1,68) = 14.311, p < 0.0001]. There was also a significant two-way interaction between the stimulus category and the orientation of the stimulus indicating a larger inversion effect for faces than for cars [F(1,68) = 101.950, p < 0.0001]. In addition, deaf subjects were significantly better than age-matched controls to match the target to the probe item [F(1,68) = 4.461, p = 0.038]. As for experiment 1A, there was no interaction between category and orientation, as well as no interaction between the group and either the stimulus category or the orientation of the stimulus (ps > 0.05).
With regard to response times, deaf participants were generally slower than controls in this version of the experiment [F(1,68) = 7.743, p = 0.007]. Participants’ inversion effect was again significantly larger for faces [F(1,68) = 58.434, p < 0.0001] than for cars [F(1,68) = 76.602, p < 0.0001; category by orientation: F(1,68) = 10.966, p < 0.0001]. Here we found a significant two-way interaction between group and orientation [F(1,68) = 5.307, p = 0.024] whereas the two-way interaction just failed to reach statistical significance [F(1,68) = 3.087, p = 0.083]. However, upon further examination, separate ANOVAs revealed that deaf and hearing subjects showed a significantly different face inversion effect [F(1,68) = 4.997, p = 0.029], which was not the case when cars were involved [F(1,68) = 0.459, p = 0.5]. As in Experiment 1A, deaf individuals were significantly slower than controls to match inverted faces [t(68) = 2.831, p = 0.006] but not upright faces [t(68) = 1.897, p = 0.062; Figure 4].
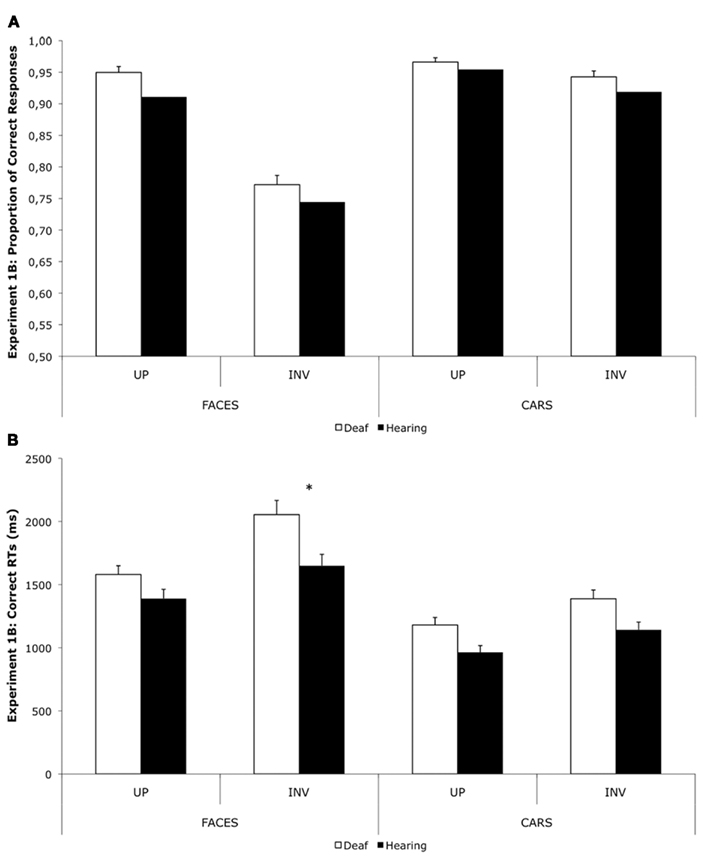
Figure 4. Proportion of correct responses (A) and correct response times (B) of deaf participants (white) and hearing participants (black) when matching upright and inverted faces or cars presented with a delay between the target and the probes (Experiment 1B). Bars represent SEs. Asterisks indicate significant differences between the two groups (p < 0.05).
Comparison between experiments
As previously suggested for some, but not all, aspects of vision (e.g., Bavelier et al., 2006), deaf participants were generally more accurate than hearing controls to discriminate faces and cars. Their response times were also slower than those of hearing participants when the stimuli were presented with a delay. Conversely they performed as fast as controls when faces or cars appeared simultaneously on the screen (see Hauser et al., 2007 for similar results). The most interesting observation was that deaf participants showed an increased face inversion effect in response times compared to hearing participants, both during simultaneous matching and delayed matching. This finding cannot be explained by a general effect of inverting a stimulus because the inversion effect for cars was of the same magnitude for the two populations, over the two experiments. Instead the group difference suggests that deaf participants are more dependent on holistic/configural processing than normal observers, taking significantly more time than controls when they cannot rely on holistic/configural processing because of the inversion of the face.
Experiment 2: The Composite Face Effect
Methods
Participants
The 35 hearing and 35 non-hearing participants were the same as those tested in Experiment 1. The order of Experiment 2A and Experiment 2B was counterbalanced across participants as well as the order of Experiment 1 and Experiment 2.
Stimuli
Gray-scaled full-front pictures of 40 unfamiliar faces (20 women, neutral expression, no glasses, or facial hair) were used to measure the magnitude of the composite face effect. These faces were divided into a top and a bottom segment by dividing them in the middle of the nose using Adobe Photoshop 7.0. They were considered as the original aligned faces (Figure 5) and as the original misaligned faces when their bottom part was laterally offset to the right side so that the middle of the nose (bottom part) was vertically aligned to the contour of the top part. The aligned stimuli and misaligned stimuli subtended 9.9 × 7.8° and 9.9 × 11.3° of visual angle, respectively. All stimuli were displayed on a light gray background. Each original top part (or bottom part in Experiment 2B) was also combined with the bottom part (or top part in Experiment 2B) of a randomly selected other face to generate, together with the original aligned, or misaligned faces respectively, the 40 pairs used in the “same” condition whose exemplars were therefore only differing with respect to their bottom parts (or top parts in Experiment 2B). Conversely, both the top and bottom face parts differed from the original faces in the 18 pairs composing the “different” condition. The 40 trials (1/2 aligned; 1/2 misaligned) and 18 trials (1/2 aligned; 1/2 misaligned) requiring a “same” and a “different” decision respectively were randomly presented in two blocks of 58 trials. The different proportion of same/different trials was introduced to increase the sensitivity of the composite face paradigm because participants’ performance in the aligned and misaligned condition on same trials only (see also Le Grand et al., 2004; Michel et al., 2006).

Figure 5. Time course and stimuli used to test participants’ composite face effect. Participants focused the top parts (Experiment 2A) or the bottom parts (Experiment 2B) of two faces presented sequentially in order to decide whether they were the same or different.
Procedure
The same material and testing distance were used as in Experiment 1. After a short training period, participants completed a delayed matching task with composite faces. Each trial involved the consecutive presentation of two composite stimuli, both being either aligned or misaligned. These two composite faces had to be matched with regard to the identity of the top (Experiment 2A) or the bottom part (Experiment 2B). Participants were asked to decide as accurately and quickly as possible whether the instructed face part was of the same or of a different identity by pressing a left (same) or a right (different) key of the keyboard. Trials started with the presentation of a 300-ms fixation cross at the center of a computer screen. This fixation cross was followed by a blank interval (200 ms) upon which a target face was presented for 600 ms. After a 300-ms inter-trial interval, a second stimulus was shown until a response was provided (Figure 5). The next trial was initiated 1000 ms after a given response. In order to restrict the possibility of participants comparing specific locations of the display while performing the task, the target, and the probe appeared at slightly different screen locations.
Analyses
Participants’ results were analyzed separately according to whether they were focusing on the top (Experiment 2A) or the bottom (Experiment 2B) parts of faces (Deaf: N = 35; Controls: N = 35). As for Experiment 1, we only took into account their accuracy (% of correct responses on same trials) and their correct response times (ms) that were not exceeding 3 SDs from their own average. Then we performed distinct repeated measures ANOVAs on both these dependant variables, with the alignment of the face parts (aligned vs. misaligned) as the within-subject factor, and the group (deaf vs. hearing) as the between-subjects factor. As for Experiment 1, we also replicated the analyses without the two non-signer individuals who became deaf during infancy/childhood (Deaf: N = 33; Controls: N = 33). As their exclusion did not influence the general pattern of results, their data were included in the analyses reported below.
Results
Experiment 2A: Focus on the top
Deaf participants were as good as hearing controls when they had to match the top part of faces [F(1,68) = 2.615, p = 0.110]. For trials of interest (“same” decision; AS vs. MS trials), there was a main effect of the alignment of the face [F(1,68) = 17.447, p < 0.0001]: participants performed, as expected, better on misaligned trials (MS) than on aligned trials (AS). The composite face effect did not differ between groups, as reflected by the absence of interaction between the group and the alignment of the face parts [F(1,68) = 0.101, p = 0.751; Figure 6A].
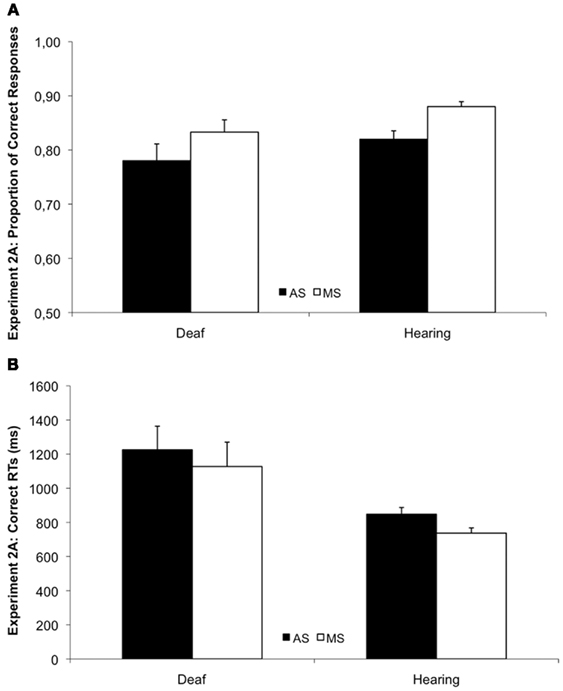
Figure 6. Proportion of correct responses (A) and correct response times (B) of deaf and hearing participants when the locus of attention was the top parts of faces (Experiment 2A). Bars represent SEs.
Overall, deaf participants were also slower than age-matched controls to perform Experiment 2A [F(1,68) = 7.071, p = 0.010]. Like hearing participants, they showed a significant composite face effect on correct response times [F(1,68) = 40.302, p < 0.0001]. The composite effect did not differ between groups [F(1,68) = 0.137, p = 0.712; Figure 6B].
Experiment 2B: Focus on the bottom
Deaf participants were as accurate as hearing participants when they had to match the bottom parts of faces [F(1,68) = 0.959, p = 0.331]. For trials of interest (“same” trials), there was a main effect of the alignment of the face [F(1,68) = 23.208, p < 0.0001], with higher accuracies in misaligned trials (MS) than in aligned trials (AS). As in Experiment 2A, the composite face effect did not differ between groups [F(1,68) = 1.557, p = 0.216; Figure 7A].
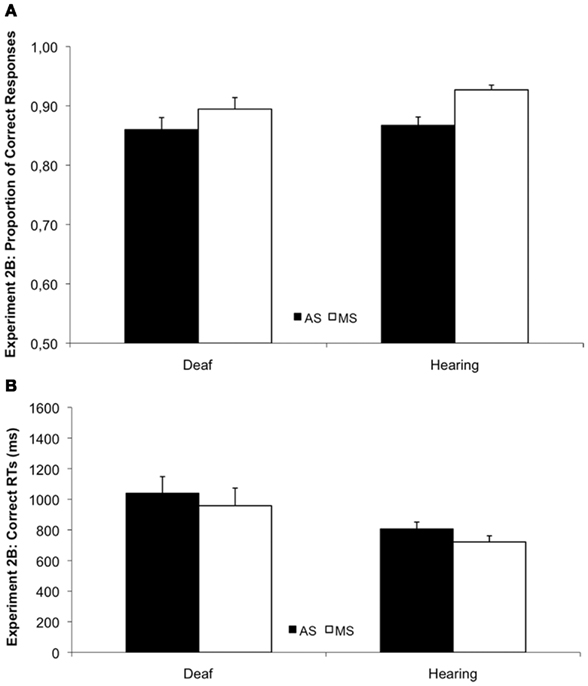
Figure 7. Proportion of correct responses (A) and correct response times (B) of deaf and hearing participants when the locus of attention was the bottom parts of faces (Experiment 2B). Bars represent SEs.
Deaf participants also tended to be slower than age-matched controls to perform this version of the task [F(1,68) = 3.957, p = 0.051]. As for controls, their response times revealed a significant composite effect when they had to focus the bottom of faces [F(1,68) = 20.284, p < 0.0001] that did not differ between the groups [F(1,68) = 0.011, p = 0.915; Figure 7B].
Comparison between experiments
Overall, deaf individuals were as accurate as controls, but slower, to perform the composite task, whether the locus of attention was the top (Experiment 2A) or the bottom of faces (Experiment 2B). They were also as sensitive as controls to the alignment of the face parts, which can be taken as the evidence that they are able to integrate two face parts in a single perceptual representation to the same extent as controls. Interestingly, when looking at the results of Experiment 2 into more details, it also appears that the bottom part of the face is more salient for deaf than for hearing participants. Indeed, from Experiment 2B (focus on the bottom; Figure 7) to Experiment 2A (focus on the top; Figure 6), the interference effect remains stable in hearing participants (6–6%) but diminishes in deaf participants (5–3%).
General Discussion
The aim of this study was to examine how early deaf participants process socially relevant visual stimuli such as faces given the evidence that reorganization of the cortical functions is observed in humans in case of sensory deprivation such as deafness (for a review, see Bavelier and Neville, 2002). To our knowledge McCullough and Emmorey (1997) were the only authors who investigated this topic. They made the observation that deaf individuals were significantly better than controls to detect featural manipulations introduced at the level of the mouth. To date no study had focused on deaf ability to process faces holistically/configurally despite that this type of processing is thought to be at the heart of hearing individuals’ expertise with faces (e.g., Farah et al., 1998; Maurer et al., 2002; Van Belle et al., 2010a). Specifically we conducted two experiments to assess whether deaf individuals would show enhanced or reduced holistic/configural face processing compared to hearing controls.
The results of the inversion-matching task (Experiment 1) were threefold. First, deaf participants were slightly better than hearing participants, but also generally slower, to match visual stimuli such as cars and faces except when they were simultaneously presented on the screen. They also showed an enhanced face inversion effect in response times compared to hearing participants, both during the simultaneous and the delayed matching of faces. Finally, they took longer than controls to process inverted faces, suggesting that they were more dependent on holistic/configural processing than non-deprived observers. In line with the perceptual field hypothesis of the face inversion effect (Rossion, 2008, 2009) suggesting that the inversion of a face induces a reduction of the size of the perceptual field to a single local feature, we would hypothesize that hearing participants were able to directly focus on the most diagnostic feature of the face to match inverted faces, namely the eyes. Conversely, we think that deaf participants needed more time to do the same because their representation of a face is probably not as biased towards the diagnostic eye region as it is for hearing participants. In other words, we believe that deaf face individualization capabilities rely on cues that are more evenly distributed on the superior and inferior parts of the face than what is observed in hearing individuals due to long-term experience with lip-reading and in discriminating grammatical facial expression used with sign language (McCullough and Emmorey, 1997; Letourneau and Mitchell, 2011; but, see Watanabe et al., 2011 for different results on Japanese deaf participants).
The results of the composite task (Experiment 2) indicated a composite face effect of the same magnitude in deaf and hearing participants, independently of whether the locus of attention was the top or the bottom of the face. Both populations could therefore rely on a holistic template to simultaneously extract information from the whole face configuration. This observation is compatible with Experiment 1 because the inversion-matching paradigm and the composite face paradigm do not measure the exact same thing. Specifically the inversion paradigm is a measure of participants’ dependency on holistic/configural processing. That is, the more a participant needs holistic/configural face processing to match inverted faces, the more his/her performance drops because of his/her inability to recruit this kind of processing. In contrast, the composite face paradigm provides an index of how strongly the different parts of the face are integrated into a holistic representation when one part of the face (e.g., the bottom of the face) does not provide additional diagnostic information and is only there to interfere.
In sum, the current study suggest that early deafness does not enhance or reduce the amount of holistic/configural processing devoted to faces but rather increases the dependency on this mode of processing. Future studies recording eye–gaze fixations during upright and inverted face individualization could help clarifying this issue. For example, gaze-contingency stimulation (Van Belle et al., 2010a,b) could be used to test a group of early deaf individuals as well as a group of hearing participants with faces. If, as predicted by McCullough and Emmorey (1997), the absence of one sensory modality such as audition leads to the enhancement of the visual representation of the mouth in an upright face, then deaf individuals should be less impaired than hearing individuals in a condition where a gaze-contingent window only reveals this internal feature (central window condition). The same experiment with inverted faces would confirm or infirm that deaf individuals’ first fixation on an inverted face is closer to the mouth than what is observed in hearing individuals. Furthermore, if deaf individuals rely on a larger area than hearing controls when they process inverted faces and if, consequently, their dependency on holistic/configural face processing is particularly salient with this face category, they should be more impaired than controls in a condition where the central features of inverted faces, but not upright faces, are masked (central mask condition) that forces the observers to rely on the whole face (Van Belle et al., 2010a,b).
Conflict of Interest Statement
The authors declare that the research was conducted in the absence of any commercial or financial relationships that could be construed as a potential conflict of interest.
Acknowledgments
Adélaïde de Heering and Bruno Rossion are supported by the Belgian National Fund for Scientific Research (FNRS). Olivier Pascalis is supported by ANR Plasticity and Multimodality in Oral Communication for the Deaf.
References
Armstrong, B. A., Neville, H. J., Hillyard, S. A., and Mitchell, T. V. (2002). Auditory deprivation affects processing of motion, but not color. Brain Res. Cogn. Brain Res. 14, 422–434.
Arnold, P., and Mills, M. (2001). Memory for faces, shoes, and objects by deaf and hearing signers and hearing nonsigners. J. Psycholinguist. Res. 30, 185–195.
Arnold, P., and Murray, C. (1998). Memory for faces and objects by deaf and hearing signers and hearing nonsigners. J. Psycholinguist. Res. 27, 481–497.
Bavelier, D., Dye, M. W. G., and Hauser, P. C. (2006). Do deaf individuals see better? Trends Cogn. Sci. (Regul. Ed.) 10, 512–518.
Bavelier, D., and Neville, H. J. (2002). Cross-modal plasticity: where and how? Nat. Rev. Neurosci. 3, 443–452.
Bavelier, D., Tomann, A., Hutton, C., Mitchell, T., Corina, D., Liu, G., and Neville, H. (2000). Visual attention to the periphery is enhanced in congenitally deaf individuals. J. Neurosci. 20, RC93.
Bettger, J., Emmorey, K., McCullough, S., and Bellugi, U. (1997). Enhanced facial discrimination: effects of experience with American sign language. J. Deaf Stud. Deaf Educ. 2, 223–233.
Bosworth, R. G., and Dobkins, K. R. (2002). Visual field asymmetries for motion processing in deaf and hearing signers. Brain Cogn. 49, 170–181.
Buckley, D., Codina, C., Bhardwaj, P., and Pascalis, O. (2010). Action video game players and deaf observers have larger Goldmann visual fields. Vision Res. 50, 548–556.
Busigny, T., and Rossion, B. (2010). Acquired prosopagnosia abolishes the face inversion effect. Cortex 46, 965–981.
de Heering, A., Houthuys, S., and Rossion, B. (2007). Holistic face processing is mature at 4 years of age: evidence from the composite face effect. J. Exp. Child. Psychol. 96, 57–70.
Emmorey, K., Kosslyn, S. M., and Bellugi, U. (1993). Visual imagery and visual-spatial language: enhanced imagery abilities in deaf and hearing ASL signers. Cognition 46, 139–181.
Farah, M. J., Tanaka, J. W., and Drain, H. M. (1995). What causes the face inversion effect? J. Exp. Psychol. Hum. Percept. Perform. 21, 628–634.
Farah, M. J., Wilson, K. D., Drain, M., and Tanaka, J. N. (1998). What is “special” about face perception? Psychol. Rev. 105, 482–498.
Goffaux, V., and Rossion, B. (2006). Faces are “spatial” – holistic face perception is supported by low spatial frequencies. J. Exp. Psychol. Hum. Percept. Perform. 32, 1023–1039.
Gosselin, F., and Schyns, P. G. (2001). Bubbles: a technique to reveal the use of information in recognition tasks. Vision Res. 41, 2261–2271.
Hauser, P. C., Dye, M. W. G., Boutla, M., Green, S., and Bavelier, D. (2007). Deafness and visual enumeration: not all aspects of attention are modified by deafness. Brain Res. 1153, 178–187.
Le Grand, R., Mondloch, C., Maurer, D., and Brent, H. P. (2001). Early visual experience and face processing. Nature 2001, 410, :890.
Le Grand, R., Mondloch, C. J., Maurer, D., and Brent, H. P. (2004). Impairment in holistic face processing following early visual deprivation. Psychol. Sci. 15, 762–768.
Letourneau, S. M., and Mitchell, T. V. (2011). Gaze patterns during identity and emotion judgments in hearing adults and deaf users of American Sign Language. Perception 40, 563–575.
Loke, W. H., and Song, S. (1991). Central and peripheral visual processing in hearing and nonhearing individuals. Bull. Psychon. Soc. 29, 437–440.
Lomber, S. G., Meredith, M. A., and Kral, A. (2010). Cross-modal plasticity in specific auditory cortices underlies visual compensations in the deaf. Nat. Neurosci. 13, 1421–1427.
Maurer, D., Le Grand, R., and Mondloch, C. J. (2002). The many faces of configural processing. Trends Cogn. Sci. (Regul. Ed.) 6, 255–260.
McCullough, S., and Emmorey, K. (1997). Face processing by deaf ASL signers: evidence for expertise in distinguishing local features. J. Deaf Stud. Deaf Educ. 2, 212–222.
Michel, C., Rossion, B., Han, J., Chung, C.-S., and Caldara, R. (2006). Holistic processing is finely tuned for faces of our own race. Psychol. Sci. 17, 608–615.
Neville, H. J., and Lawson, D. (1987). Attention to central and peripheral visual space in a movement detection task: an event-related potential and behavioral study. II. Congenitally deaf adults. Brain Res. 405, 268–283.
Ramon, M., Busigny, T., and Rossion, B. (2010). Impaired holistic processing of unfamiliar individual faces in a case of acquired prosopagnosia. Neuropsychologia 48, 933–944.
Rauschecker, J. P. (1995). Compensatory plasticity and sensory substitution in the cerebral cortex. Trends Neurosci. 18, 36–43.
Rossion, B. (2008). Picture-plane inversion leads to qualitative changes of face perception. Acta Psychol. (Amst.) 128, 274–289.
Rossion, B. (2009). Distinguishing the cause and consequence of face inversion: the perceptual field hypothesis. Acta Psychol. (Amst.) 132, 300–312.
Rossion, B., and Boremanse, A. (2008). Nonlinear relationship between holistic processing of individual faces and picture-plane rotation: evidence from the face composite illusion. J. Vis. 8, 1–13.
Sadr, J., Jarudi, I., and Sinha, P. (2003). The role of eyebrows in face recognition. Perception 32, 285–293.
Sergent, J. (1984). An investigation into component and configurational processes underlying face recognition. Br. J. Psychol. 75, 221–242.
Sergent, J. (1986). “Microgenesis of face perception,” in Aspects of Face Processing, eds H. D. Ellis, M. A. Jeeves, F. Newcombe, and A. M. Young (Dordrecht: Kluwer), 17–33.
Siple, P., Hatfield, N., and Caccamise, F. (1978). The role of visual perceptual abilities in the acquisition and comprehension of sign language. Am. Ann. Deaf 123, 852–856.
Stivalet, P., Moreno, Y., Richard, J., Barraud, P. A., and Raphel, C. (1998). Differences in visual search tasks between congenitally deaf and normally hearing adults. Brain. Res. Cogn. Brain Res. 6, 227–232.
Tanaka, J. W., and Farah, M. J. (1993). Parts and wholes in face recognition. Q. J. Exp. Psychol. (Hove) 46A, 225–245.
Tanaka, J. W., Kay, J. B., Grinnell, E., Stanfield, B., and Szechter, L. (1998). Face recognition in young children: when the whole is greater than the sum of its parts. Vis. Cogn. 5, 479–496.
Van Belle, G., de Graef, P., Verfaillie, K., Busigny, T., and Rossion, B. (2010a). Whole not hole: expert face recognition requires holistic perception. Neuropsychologia 48, 2609–2620.
Van Belle, G., de Graef, P., Verfaillie, K., Rossion, B., and Lefèvre, P. (2010b). Face inversion impairs holistic perception: evidence from gaze-contingent stimulation. J. Vis. 10, 1–13.
Watanabe, K., Matsuda, T., Nishioka, T., and Namatame, M. (2011). Eye gaze during observation of static faces in deaf people. PLoS ONE 6, e16919. doi: 10.1371/journal.pone.0016919
Keywords: faces, configural, holistic, inversion, composite, deaf, hearing
Citation: de Heering A, Aljuhanay A, Rossion B and Pascalis O (2012) Early deafness increases the face inversion effect but does not modulate the composite face effect. Front. Psychology 3:124. doi: 10.3389/fpsyg.2012.00124
Received: 26 October 2011; Accepted: 08 April 2012;
Published online: 25 April 2012.
Edited by:
Laurence T. Maloney, Stanford University, USAReviewed by:
Gyula Kovács, Budapest University of Technology, HungaryCorrado Caudek, Università di Firenze, Italy
Copyright: © 2012 de Heering, Aljuhanay, Rossion and Pascalis. This is an open-access article distributed under the terms of the Creative Commons Attribution Non Commercial License, which permits non-commercial use, distribution, and reproduction in other forums, provided the original authors and source are credited.
*Correspondence: Adélaïde de Heering, Face Categorization Lab, Faculté de Psychologie et des Sciences de l’Education, Université Catholique de Louvain, Place Cardinal Mercier, 10, 1348 Louvain-la-Neuve, Belgium. e-mail: adelaide.deheering@uclouvain.be