
- 1 Department of Clinical Psychology, University of Amsterdam, Amsterdam, Netherlands
- 2 Cognitive Science Center Amsterdam, University of Amsterdam, Amsterdam, Netherlands
Response inhibition is a hallmark of executive control and crucial to support flexible behavior in a constantly changing environment. Recently, it has been shown that response inhibition is influenced by the presentation of emotional stimuli (Verbruggen and De Houwer, 2007). Healthy individuals typically differ in the degree to which they are able to regulate their emotional state, but it remains unknown whether individual differences in emotion regulation (ER) may alter the interplay between emotion and response inhibition. Here we address this issue by testing healthy volunteers who were equally divided in groups with high and low heart rate variability (HRV) during rest, a physiological measure that serves as proxy of ER. Both groups performed an emotional stop-signal task, in which negative high arousing pictures served as negative emotional stimuli and neutral low arousing pictures served as neutral non-emotional stimuli. We found that individuals with high HRV activated and inhibited their responses faster compared to individuals with low HRV, but only in the presence of negative stimuli. No group differences emerged for the neutral stimuli. Thus, individuals with low HRV are more susceptible to the adverse effects of negative emotion on response initiation and inhibition. The present research corroborates the idea that the presentation of emotional stimuli may interfere with inhibition and it also adds to previous research by demonstrating that the aforementioned relationship varies for individuals differing in HRV. We suggest that focusing on individual differences in HRV and its associative ER may shed more light on the dynamic interplay between emotion and cognition.
Introduction
A vast body of literature has underscored the effect of emotions on executive control (Pessoa, 2008, 2009). For example, response latencies for solving mathematical problems are longer when very unpleasant pictures are presented compared to when moderate or low arousing emotional pictures are shown (Schimmack, 2005). People also need more time to name the color of emotional words compared to non-emotional ones (Williams et al., 1996; Phaf and Kan, 2007) or to withhold a planned response after the presentation of emotional compared to neutral stimuli (Verbruggen and De Houwer, 2007). Nevertheless, it remains unknown whether the above outcomes vary across individuals that differ in their ability to process emotional stimuli, an ability referred to as emotion regulation (ER; Gross, 1998). Subsequently, it is plausible that variations in ER may lead to differences in how emotions influence ongoing non-emotional tasks. In the present paper we focus on how individual differences in heart rate variability (HRV), a measure associated with ER (Appelhans and Luecken, 2006), may translate in differences in response initiation and response stopping.
The present study builds on recent findings indicating the impact of the presentation of emotional stimuli on the production and interruption of motor responses. First, Verbruggen and De Houwer (2007) showed that the presentation of high arousing emotional pictures lead to slowing as well as slowed stopping of a motor response compared to low arousing emotional pictures. Similar findings were reported by De Houwer and Tibboel (2010), who introduced emotional pictures in a Go/No-Go task1 and found that participants had the highest error rates in no-go trials after the presentation of highly arousing negative stimuli. Subsequently, both studies indicate that emotional stimuli disturb both the production and inhibition of motor responses compared to neutral stimuli. Nonetheless, the question whether individual differences may moderate the effects of emotion on response inhibition and initiation remains unanswered.
A plethora of studies suggest that individuals differ in how effectively they can regulate incoming emotional information, an ability referred to as ER (Gross, 1998). A physiological measure that is associated with ER is HRV, which reflects the degree of cardiac activity adjustment to meet situational demands (Ruiz-Padial et al., 2003; Appelhans and Luecken, 2006; Thayer and Sternberg, 2006; Segerstrom and Nes, 2007). Technically speaking, HRV is the measure of the interplay between the sympathetic and the parasympathetic systems on the heart. The former system dominates over the latter during periods of stress and physiological arousal whereas the reversed pattern is observed in periods of safety and low physiological arousal. Low HRV has been associated with limited capacity of the organism to adapt to environmental changes (Appelhans and Luecken, 2006). This is because environmental modifications are not followed by quick adjustments of the interplay between the systems of the autonomic nervous system. That can also explain why reduced HRV and low vagal tone is associated with the cardiovascular symptoms of panic attacks, poor ER and behavioral stiffness (Friedman and Thayer, 1998; Thayer and Lane, 2000; Thayer and Siegle, 2002). In addition, lower HRV during rest periods is correlated with trait and self-perceived stress-induced anxiety (Lyonfields et al., 1995; Mujica-Parodi et al., 2009; Thayer et al., 1996). On the other hand, a high HRV is associated with quicker adjustment to situational diversions (Appelhans and Luecken, 2006). In the present paper, HRV serves as proxy of ER.
Considering the aforementioned findings on HRV as well as the work by Verbruggen and De Houwer (2007), we hypothesize that (1) individuals will have prolonged response and inhibition times after the presentation of high arousing emotional stimuli compared to low arousing ones and (2) individuals with high levels of HRV will have shorter response and inhibition times compared to individuals with low levels of HRV after the presentation of high arousing emotional stimuli whereas no differences are expected between individuals with different levels of HRV after the presentation of low arousing emotional stimuli. Our first prediction is theoretically in line with previous literature underscoring the influence of emotional stimuli on attention. A robust effect described in the literature on the relation between emotional stimuli and attention indicates that the presentation of high arousing emotional stimuli lead to longer attention times compared to low arousing stimuli (Lang et al., 1993; Schimmack, 2005). Subsequently, the emission or suppression of actions is expected to be delayed after the presentation of high arousing emotional stimuli compared to low arousing stimuli due to the prolonged attention times on the former ones. However, as indicated by our second prediction, this effect is expected to differ as function of the HRV level. Our second prediction is in line with recent studies demonstrating the relation between HRV level and performance in emotional tasks. For example, Johnsen et al. (2003) used a modified Stroop task with dental-related words that was administered to dental-phobic individuals. Results showed that individuals with higher parasympathetically mediated HRV could more effectively inhibit the attentional processing of the written words. Subsequently, for our study it is expected that subjects with high HRV will trigger or refrain from executing a response faster compared to subjects with low HRV. This is because participants with high HRV can quickly regulate the load of the incoming emotional information and shift their attention toward the main task. Participants with low HRV are expected to have longer response and stopping latencies compared to subjects with high HRV due to their longer attention engagement to incoming emotional information.
In sum, the present study has two goals. First, we attempt to replicate previous findings indicating the influence of the presentation of emotional stimuli on emitting and restraining from giving a response (Verbruggen and De Houwer, 2007). To this end, an emotional stop-signal task comparable to that of Verbruggen and De Houwer (2007) will be used to measure response initiation and inhibition latencies. Secondly, we will investigate whether individual differences in HRV predict the degree of slowing in response initiation and inhibition after the presentation of emotional stimuli, when compared to neutral stimuli. Individual differences in HRV will be measured during a relaxation period (Appelhans and Luecken, 2006).
Materials and Methods
Participants
Sixty-two individuals participated in this experiment. Due to technical problems or incomplete answers, data from eight participants were excluded from further analyses. Hence, data from 54 participants (44 female, mean age 21.4, range 18–29) were analyzed. All participants had normal or corrected-to-normal vision and were naive to the purpose of the experiment. The ethical committee of the University of Amsterdam approved the experiment and all procedures were in accordance with the relevant laws and ethical guidelines. As a reward, participants received either research credits or a small amount of money (€14).
Stimuli, Apparatus, and Questionnaires
We selected 320 negative and neutral stimuli from the International Affective Picture System (IAPS; Lang et al., 2005). Importantly, previous research with the emotional stop-signal task has shown no reliable differences in performance after the presentation of negative and positive valence pictures (Verbruggen and De Houwer, 2007). Thus, for the current experiment low arousing pictures with neutral valence served as neutral non-emotional stimuli. High arousing pictures with negative valence served as negative emotional stimuli (see Table 1). A DVD with all picture stimuli is available upon request.
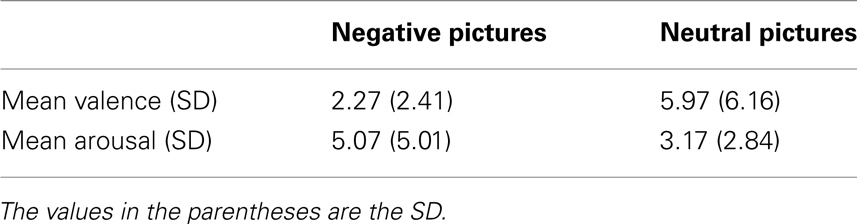
Table 1. Overview of the selected pictures.
All pictures were 500 pixels wide and 700 pixels high. Right or left pointing black arrows served as Go stimuli. All pictures and Go stimuli were presented on the middle of a 17″ inch computer screen (1680 × 1050 pixels) against a white background. For stimuli presentation, we used the software package Presentation (Neurobehavioural Systems Inc, www.neurobs.com).
Heart rate variability data were collected using three Ag–Ag electrodes. The electrodes were fixed using adhesive patches (3M Red Dot Electrode with Micropore Tape 2239). One electrode was placed below the right clavicle and one on the left side of the chest, just below the sixth rib. The ground electrode was fixed under the left clavicle. The signal was recorded using Vsrrp98, a software program developed at the University of Amsterdam, with a sampling rate of 1000 samples per second.
Finally, for investigating the initial emotional states of participants, the Dutch version of the Positive and Negative Affect Schedule (PANAS) was used (Watson et al., 1988; Peeters et al., 1996). The Dutch versions of Spielberger’s STAI–S and STAI–T were also administered in order to investigate the potential role of state and trait anxiety (Spielberger et al., 1970; Ploeg et al., 1981). Note that previous research has shown an influence of anxiety on HRV (Fuller, 1992; Miu et al., 2009).
Procedure and Task
Upon arrival, participants were seated on a straight, high-back chair. After reading the information brochure and signing the informed consent, participants filled in PANAS, STAI–T, and STAI–S. Next, the heart rate electrodes were attached. Heart rate signal was collected during a 10-min period while participants watched a relaxing movie and listened to relaxing music coming from closed headphones. In the present study we used the film fraction from 5:33–15:33 s of the movie “Coral Sea dreaming” (Hannan, 1999).
Next, subjects performed an emotional stop-signal task (see Figure 1). The emotional stop-signal task consisted of Go and Stop trials. Each trial started with a black fixation cross that remained on the screen for 500–2000 ms (steps of 500 ms, M = 1250 ms). Next, a neutral or a negative picture was presented for 500 ms, followed by a right or left pointing arrow. Arrows remained on the screen for 200 ms and participants had to press the right or the left response button as fast and accurately as possible within a response time window of maximally 1500 ms. Response buttons were fixed on the chair’s arms and participants responded using their thumbs. On Stop trials (30%), an auditory sound was presented and subjects had to withhold their motor response. There were 224 Go and 96 Stop trials, equally divided in two blocks of 160 trials each. The presentation of neutral and negative pictures, before the arrow, were equally balanced across all Go and Stop trials.
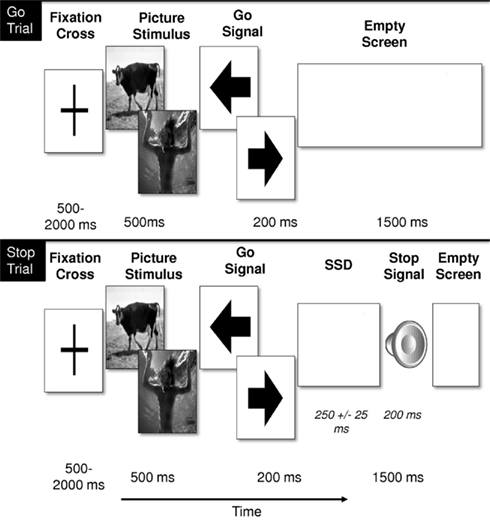
Figure 1. Schematic design of the Go and Stop trials. Both trials started with a fixation cross, followed by a picture stimulus (neutral or negative). Next a left or right pointing arrow was presented (Go-signal). Each trial ended with a blank screen during which participants could give a response. On the Stop trials, the Go-signal was followed by an auditory Stop-Signal after a stop-signal delay (SSD).
The stop-signal delay (SSD) between the Go stimulus (the arrow) and the stop-signal (auditory tone) was dynamically adjusted. This was done separately for neutral and negative trials according to the staircase method and ensured convergence to P (inhibit) of 0.5. For example, if a stop-signal was presented on a neutral trial and the subject responded (Failed Stop), then the SSD for the neutral staircase was reduced by 25 ms on the subsequent neutral Stop trial; if the subject did not respond (i.e., Successful Stop), then SSD was increased by 25 ms. Initial SSD was set to 250 ms for both neutral and negative Stop trials. In order to familiarize with the task, participants had to complete a practice block consisting of 14 Go and 6 Stop trials involving neutral pictures. During the practice block, feedback for correct, incorrect, and late responses was given.
Subsequent to the emotional stop–signal task, participants rated all pictures in terms of valence and arousal using the self-assessment manikin (SAM; Lang, 1980; Bradley and Lang, 1994). Below the manikins, numbers from 1 to 9 were presented. For the valence ratings, 1 represented positive valence whereas nine represented negative valence. For the arousal ratings, 1 represented a stressed arousal state and 9 referred to a relaxed arousal state. Participants provided their ratings using the 1–9 buttons on a standard keyboard.
The experiment ended with participants filling in the PANAS scale as well as a short debriefing section.
Manipulation Check
Before performing our main analyses, we defined valence and arousal cut-off scores that would ensure that we would have enough remaining trials for the reliable computation of SSRT’s (Band et al., 2003; Verbruggen and Logan, 2009) as well as having cut-off scores close to the middle of both scales (5). The only cut-off scores that fitted both criteria was that of six for valence – with scores equal or below that number indicating neutral ratings and above it negative – and four for arousal2 – with scores equal or below that number indicating low arousal and above it high arousal. Our strategy resulted in removing 12.8% of the picture stimuli. The same picture stimuli were removed from all participants. It is noted that any other cut-off score would either result in having too few trials to compute reliable SSRT’s or would result in values that would diverge more from the middle (point 5) of the valence or arousal scales.
Behavioral Data Analyses
Error rates and median response times (RTs) were calculated for negative and neutral trials. All RTs above 2.5 SD from the mean RT were removed from further analyses. This resulted in discarding 7.33% of the Go trials (2.15% neutral, 5.17% negative) and 3.6% (1.78% neutral, 1.84% negative) of the Stop Respond trials. For the Stop trials, SSRT was estimated separately for negative and neutral trials using the so-called “integration method” (Logan and Cowan, 1984; Verbruggen and Logan, 2009). The overall slowing effect was computed by subtracting the median RT (SSRT for Stop trials) on neutral trials from the median RT (SSRT for Stop trials) on negative trials. Paired t-tests were used to analyze the overall slowing effect on Go and Stop trials. Next, we examined the relationship between the slowing affect in Go trials and the degree of slowing in Stop trials with Pearson’s correlation.
Heart Rate Variability Analyses
Prior to all analyses, the Electrocardiogram (ECG) signal was visually inspected and artifacts were corrected or if necessary removed. The interbeat intervals were imported to Kubios HRV Package (Tarvainen et al., 2009) and were again corrected for artifacts, using a medium artifact correction from the default options of the Kubios software. Finally, we estimated the root mean square of successive difference (RMSSD), a time domain measure of HRV (Appelhans and Luecken, 2006). Based on the RMSSD values, we performed a median split (Field, 2005) separating participants in groups with low and high HRV.
Before comparing groups’ performance, we tested whether potential differences in initial emotional states diverged between groups. In this vein, we performed independent sample t-tests as well as Bayesian t-tests under the assumption of equality of variance. We specifically used Bayesian t-tests in order to test the plausibility that the two groups were equal in measures of interest. In Bayesian inference, the Bayes factor is computed which serves as an alternative to frequentist hypothesis testing. In the present study, the higher the Bayes factor the more likely the results have been occurred under the null hypothesis than the alternative hypothesis. For example, a Bayes factor of three shows that the null hypothesis is three times more likely than the alternative hypothesis3. We performed our computations by using the Bayesian models described in Wetzles et al. (2009) for two samples Savage Dikey t-tests with the assumption of equality of variance. The model and the R code (R Development Core Team, 2009) for computing the Bayes factor are available on http://www.ruudwetzels.com/sdtest. Our analyses showed that there were no differences between participants with low and high HRV in positive (t31 = −1.29, p = 0.20, BF = 2.44) or negative (t62 = 0.77, p = 0.44, BF01 = 4.01) mood. In addition, after correlating state and trait anxiety measures with the HRV measures for each group (Fuller, 1992; Miu et al., 2009), non-significant results emerged (r < |0.20|), indicating that neither state or trait anxiety differently influenced the HRV of each group. We also confirmed our results by performing Bayesian correlations (all BF01 > 3.7). For our Bayesian correlation analyses we used the formulas provided by Jeffreys (1983) describing the comparison of a correlation coefficient to a suggested value (see Jeffreys, 1983, pp. 289–292). In our case, we compared correlation coefficients with zero (no relation).
We then conducted a series of mixed ANOVA’s with type of trial (neutral, negative) as a within-subject factor and HRV (high, low) as between subjects factor. This allowed us to examine the influence of HRV on performance in the emotional stop-signal task. In addition, two groups Bayesian t-tests were performed to test for similarity between the two groups under the assumption of equality of variance (Wetzles et al., 2009).
Linear regression analyses were also performed in order to investigate whether trait and state anxiety as well as positive and negative affect could predict response and inhibition times for each trial type. Finally, we assessed whether mood generally changed after completion of the stop-signal and whether these changes perhaps differed for our two HRV groups. This was achieved by performing mixed effects ANOVAs separately for each measure including time (first measure, second measure) as within-subject factors and HRV (high, low) as a between subjects factor.
Results
The Presentation of Negative Stimuli Leads to Prolonged Response and Inhibition Times
Table 2 presents an overview of the behavioral data for Go and Stop trials. Few omissions during Go trials (combined errors, M = 0.927%, SD = 1.625) were observed. Additionally, participants gave more incorrect responses during negative trials compared to neutral trials (t63 = 3.75, p< 0.001), indicating that negative stimuli affect the accuracy in the stop-signal task. In line with previous findings, on Go trials participants responded slower after the presentation of negative pictures (t63 = −4.1, p < 0.001) compared to neutral pictures (see Figure 2, left panel). Moreover, negative stimuli prolonged the time needed to stop a planned response during successful Stop trials (t63 = −4.8, p < 0.001; see Figure 2, right panel), and the overall reaction time during Stop respond trials (t63 = −3.8, p < 0.001). The above findings provide a successful replication of the study by Verbruggen and De Houwer (2007).
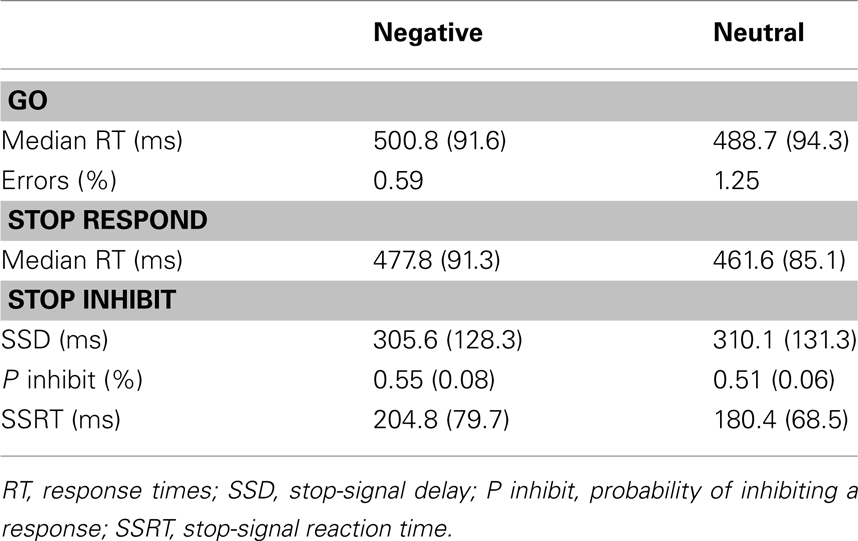
Table 2. Behavioral data during the emotional stop task on Go and Stop trials.
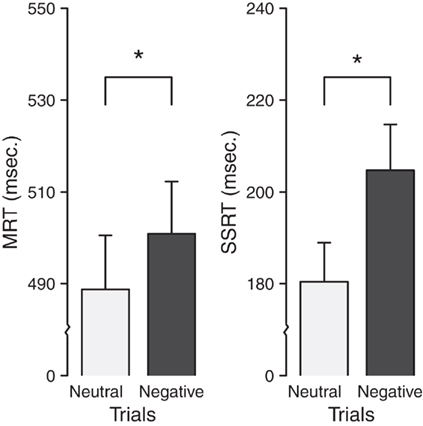
Figure 2. Bar plots depicting performance in Go (left panel) and Stop (right panel) trials (Error barsrepresent SE). As it can be seen, participants needed more time to give but also stop their responses in the negative trials compared to neutral trials. MRT, median response time; SSRT, stop-signal reaction time. *p < 0.001.
Additionally, we tested the independence assumption between the Go and Stop process of the horse-race model (Logan and Cowan, 1984; Verbruggen and Logan, 2008b). Specifically, we investigated whether the slowing effect in Go trials is related to the degree of slowing during Stop trials. In accordance with the independence assumption of the horse-race model, no relationship was found between the degree of slowing during Go and Successful Stop trials. On the other hand, when participants failed to Stop, the degree of emotional slowing was predictive for the slowing effects present on the Go trials (t62 = 4.3, p< 0.01).
Heart Rate Variability Predicts the Degree of Slowing during Response Inhibition and Initiation after the Presentation of Negative Stimuli
Next, we zoomed in on individual differences in HRV. To this end, we investigated whether high HRV subjects differed from low HRV subjects in the emotional stop-signal task. Table 3 summarizes the behavioral results for each group.
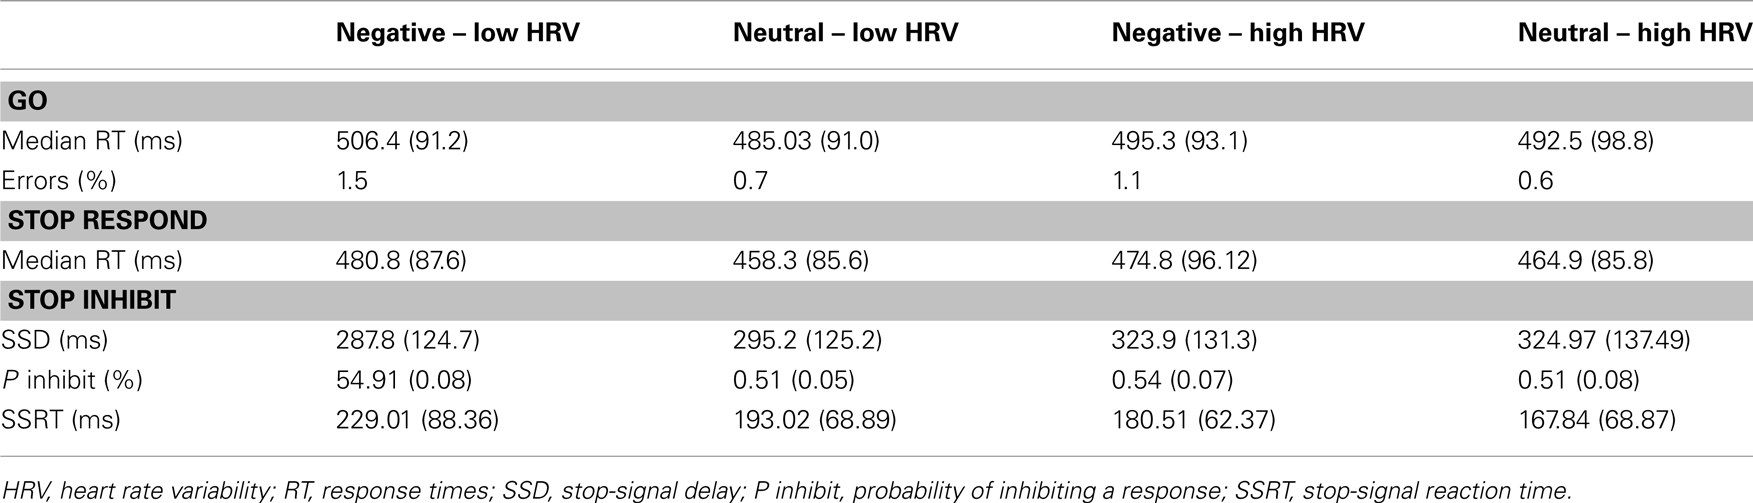
Table 3. Behavioral data during the emotional stop task on Go and Stop trials.
First, we tested whether the high vs. low HRV group differed in their response speed in negative and neutral trials. The results showed that the two groups did not differ in the speed to initiate a response independent of the type of stimuli (F1,62 = 0.015, p = 0.904). There was also no difference for negative trials (t62 = 0.484, p = n.s.) or neutral trials (t62 = 0.313, p = n.s., BF01 = 4.33), respectively. Importantly, as shown in Figure 3 (left panel), a strong interaction (F1,62 = 11.392, p = 0.001,  = 0.115) emerged between the content of pictures presented on Go trials (i.e., neutral or negative) and HRV.
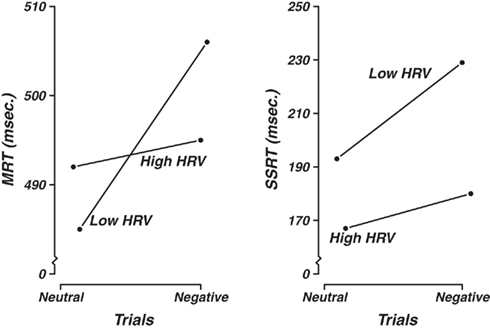
Figure 3. Two 2 × 2 interactions between trial type and group. On the left panel, it is shown that participants needed more time to respond in the negative compared to neutral trials. On the right panel, the time to inhibit a planned response for each trial is depicted. Although participants needed more time to inhibit a response in negative compared to neutral trials, this increase in SSRT’s is quicker for participants with low HRV. Please see text for further details on both interactions. MRT, median response time; SSRT, stop-signal reaction time, HRV, heart rate variability.
Following our research questions, we investigated if the speed to inhibit a response also differed as a function of HRV. In line with the behavioral analyses reported before, participants took longer to inhibit their responses in negative trials compared to neutral ones (F1,62 = 24.461, p < 0.001, = 0.283). Notably, again this effect was different for each group as was shown from an Emotion × HRV interaction (F1,62 = 5.613, p = 0.021, = 0.083; see right panel of Figure 3). Specifically, subjects with low HRV compared to subjects with high HRV needed more time to inhibit their responses in negative trials (t31 = 2.537, p = 0.014) while no group differences were found in neutral trials (t31 = 1.484, p = n.s.). The latter effect was also confirmed by our Bayesian analysis (BF01 = 1.97). Finally, participants with low HRV took longer to inhibit their responses than people with high HRV, regardless of the type of trial (F1,62 = 4.486, p = 0.038, = 0.067) with participants with high HRV being faster to inhibit than the participants with low HRV. Specifically, individuals with low HRV had shorter RTs on neutral compared to negative trials (t31 = 4.675, p < 0.001). The same pattern emerged for the High HRV although to a smaller extent (t31 = 2.069, p = 0.047), reflecting the main effect of emotion shown before. In line with our predictions, the outcomes above seem to indicate that HRV impacts the efficacy of stopping a planned response after the presentation of negative stimuli. Nevertheless, results should be interpreted with caution. As mentioned in Loftus (1978), non-crossover interactions are sensitive to the measurement scale (here SSRT’s in millisecond) and can be potentially transformed away by a monotonic transformation of the scale (see also Luce and Tukey, 1964; Krantz and Tversky, 1971; Salthouse and Hedden, 2002).
Finally, we investigated whether positive and negative affect before and after the experiment was different among groups. Both groups reported a reduction in their positive affect although this reduction was bigger for the high HRV group (t30 = 6.481, p < 0.001) rather than the low HRV group (t29 = 2.785, p = 0.009), as indicated by a significant cross over interaction between group and time (F1,60 = 7.530, p = 0.008). No differences between groups were found in positive affect for time point one (t62 = −1.296, p = 0.200) and two (t60 = 1.084, p = 0.283). Increase of negative effect was reported (F1,59 = 9.034, p = 0.004), although this effect did not differ as function of group (F1,59 = 1.402, p = 0.241).
Discussion
The present study set out to investigate the influence of emotional stimuli on cognitive control processes such as the initiation or inhibition of motor responses. We also tested whether the initiation or inhibition of responses is different for participants with low and high HRV. Using an emotional stop-signal task, we found that after the presentation of high arousing negative pictures, participants needed more time to initiate and stop a planned response, compared to when neutral pictures were presented. These results are in line with previous research (Verbruggen and De Houwer, 2007) affirming a robust effect of the presentation of emotional stimuli on response initiation and inhibition. Furthermore, based on participants’ HRV scores, we separated participants in groups with low and high HRV and compared the performance of the two groups in the emotional stop-signal task. In line with our predictions, performance in the emotional stop-signal task differed among participants with low and high HRV, indicating that individual differences in HRV translate into latency differences in action initiation and inhibition. While HRV is associated with ER, our findings provide evidence how performance in cognitive tasks is mediated by the perception and processing of emotional stimuli (Gross, 1998).
One explanation for the prolonged response and stopping times after the presentation of emotional stimuli is an attentional allocation toward emotional stimuli (Fox et al., 2001; Vuilleumier, 2005; Wyble et al., 2008; see also Estes and Verges, 2008 for a description of alternative explanations). In particular, emotional stimuli seem to attract and withhold attention longer compared to non-emotional stimuli (Öhman et al., 2001; Anderson, 2005). Although it remains unclear whether this effect is driven by the valence (Pratto and John, 1991; Estes and Verges, 2008) or the arousal dimension (Schimmack, 2005; Vogt et al., 2008) of each stimulus, it is assumed that the longer attentional engagement toward incoming emotional information results in slower responding in co-occurring non-emotional tasks (Lang et al., 1993; McKenna and Sharma, 1995; Buodo et al., 2002; Gronau et al., 2003). This explanation seems also to be in agreement with D:DeHouwerandTibboel’s:2010] recent findings on a go/no-go task.
Attentional biases toward emotional stimuli can also be a potential explanation for the difference in performance between participants with low and high HRV, as previous studies have associated low HRV to poorer attentional control (Porges, (1992; Friedman and Thayer, 1998). Specifically, when RTs were investigated, individuals in the low HRV group were slower in giving a response after the presentation of negative compared to neutral pictures. This result can be attributed to the slow disengagement of attention from emotional stimuli which delayed the subsequent execution of overt responses (Buodo et al., 2002). On the other hand, people with high HRV had similar performance independently of what type of picture was presented. By taking attentional biases into account, we argue that individuals with HRV are more efficient in shifting their attention away from emotional stimuli and subsequently give a response.
In their seminal work, Logan and Cowan (1984) regarded stop-signal inhibition as a form of executive function. Accordingly, attentional biases can also be a potential explanation for the differences between groups to stop a planned response as well. Although the interaction on inhibition times can be potentially attributed to the measurement scale (Loftus, 1978; Salthouse and Hedden, 2002), our results show that people with low HRV needed more time to stop their responses compared to individuals with high HRV after the presentation of negative pictures. This finding supports the notion of an attentional bias in that individuals in the low HRV group had more difficulty in shifting their attention from emotional stimuli compared to subjects with high HRV. In support of this view, no differences between the two groups emerged after the presentation of neutral pictures.
An alternative explanation of participants’ response and inhibition times could as well be that the use of negative and neutral emotionally stimuli could have resulted in some kind of negative emotional state, affecting individuals’ performance4. Although valid, we think that this explanation contradicts the results on the PANAS, collected at the beginning and the end of the experiment. Specifically, both groups showed a decrease in positive affect as well as an increase in negative affect. Interestingly, the decrease in positive affect was steeper for the high HRV group as shown by a statistically significant interaction. This indicates that individuals with high HRV had stronger emotional reactions than the low HRV individuals in the end compared to the beginning of the experiment. At first sight, this may contrast our finding that individuals high in HRV are less affected by negative pictures during performing the stop-signal task than those displaying lower HRV. However, taken together, these findings merely show that individuals higher in HRV certainly are affected by the negative pictures, as indicated by the PANAS scores, but are nevertheless very well capable to effectively regulate those emotions and still focus on the main task demands (i.e., performing the emotional stop-signal task). This is in line with previous literature (Porges, 1992; Thayer and Lane, 2000) indicating that individuals high in HRV are not so much unaffected by certain stimuli, but display high adaptability to environmental demands (i.e., the experimental task). Nonetheless, due to the conflicting findings in the literature regarding HRV and mood states (for a review Pressman and Cohen, 2005) and the inability of our data to exactly address this question, future research is needed to investigate the exact relation between affect and HRV.
Although for both the response and stopping times, a significant interaction emerged, the pattern of the interactions was quite different. For example, no between group difference was found when participants had to initiate a response. Contrary to this finding, individuals with low compared to high HRV needed more time to inhibit a response in both neutral and negative trials, respectively. These results can be explained by the independence between the Go and Stop processes of the horse-race model (Logan and Cowan, 1984; Verbruggen and Logan, 2008a,b). Specifically, the horse-race model assumes that the Go and Stop process are stochastically independent. By measuring the level of HRV, we extend previous findings by showing that emotions differentially influence the Go and Stop process. To note, both our results and previous studies (e.g., Verbruggen and De Houwer, 2007) revealed that negative pictures lead to prolonged response and stopping times. Based on those results, it may be argued that in both cases emotional stimuli interrupt both the Go and the Stop process. The present results clearly oppose this assumption.
Nonetheless, the present study suffers from two main limitations. Firstly, although we selected our negative and neutral stimuli based on the normative IAPS ratings (Lang et al., 2005), preliminary analyses in which the mean valence and arousal ratings of the pictures were compared with participants’ subjective ratings for each picture, showed that many pictures did not induce the desired emotion. Specifically, a high proportion of negative stimuli were regarded as low arousing by the participants, and a high proportion of neutral stimuli were regarded as positive valence. This led us to use less strict criteria in determining the cut-off scores in discarding pictures (see Materials and Methods). The aforementioned difference between IAPS mean ratings and participants’ ratings could be attributed to the stronger content of a subset of pictures compared to others. This could have resulted in making individuals regard some negative pictures as low arousing and some neutral pictures as positively valence. Another important limitation is the low number of pictures included in the IAPS system that matched our valence and arousal ratings. As a result, we included neutral and negative pictures with a wide range of valence and arousal scores. Future studies should either use a smaller number of high arousing negative pictures or determine the final picture sets in pilot studies.
Secondly, although we used HRV during rest as an associative measure of ER (Lyonfields et al., 1995), this measure cannot be used as a direct index of ER. Future studies could overcome this shortcoming by measuring HRV during emotional situations as well and not only during resting periods.
In sum, the present study replicates the results of Verbruggen and De Houwer (2007) by showing that after the presentation of highly emotional pictures participants need more time to initiate and inhibit a response. We found that this effect interacted with the level of HRV while individuals with high HRV showed shorter response and stopping times after the presentation of emotional pictures compared to subjects with low HRV. These present results further our understanding of the intricate relation between ER and executive control functions by taking into account individual differences in HRV.
Conflict of Interest Statement
The authors declare that the research was conducted in the absence of any commercial or financial relationships that could be construed as a potential conflict of interest.
Acknowledgments
Angelos-Miltiadis Krypotos is a scholar of the Alexander S. Onassis Public Benefit Foundation. This work was supported by a Mozaiek grant (Sara Jahfari), a Toptalent grant (Vanessa A. van Ast) and a VENI grant (Birte U. Forstmann), all grants awarded by The Netherlands Organization for Scientific Research (NWO). Merel Kindt is supported by an NWO Innovation Scheme (Vici) Grant. We thank Bert Molenkamp for technical support, Kaya Peerdeman for helpful comments on an earlier draft of this article and Ruud Wetzels for his valuable help on Bayesian statistics.
Footnotes
- ^For a discussion over the differences between the stop-signal and the go/no-go task, see Verbruggen and Logan (2008a).
- ^It is noted that the arousal scale is reversed with 1 standing for relax ratings and 9 stressed ratings.
- ^For more information on Bayesian inference and Bayes factor we refer the reader to Dienes (2011), Rouder et al. (2009), and Wetzles et al. (2009).
- ^We would like to thank an anonymous reviewer for suggesting this alternative explanation of the results.
References
Anderson, A. K. (2005). Affective influences on the attentional dynamics supporting awareness. J. Exp. Psychol. Gen. 134, 258–281.
Appelhans, B. M., and Luecken, L. J. (2006). Heart rate variability as an index of regulated emotional responding. Rev. Gen. Psychol. 10, 229–240.
Band, G. P., van der Molen, M. W., and Logan, G. D. (2003). Horse-race model simulations of the stop-signal procedure. Acta. Psychol. 112, 105–142.
Bradley, M. M., and Lang, P. J. (1994). Measuring emotion: the self-assessment manikin and the semantic differential. J. Behav. Ther. Exp. Psychiatry 25, 49–59.
Buodo, G., Sarlo, N., and Palomba, D. (2002). Attentional resources measured by reaction times highlight differences within pleasant and unpleasant, high arousing stimuli. Motiv. Emot. 26, 123–138.
De Houwer, J., and Tibboel, H. (2010). Stop what you are doing! Emotional pictures interfere with the task not to respond. Psychon. Bull. Rev. 17, 699–703.
Dienes, Z. (2011). Bayesian versus orthodox statistics: which side are you on? Persp. Psychol. Sci. 6, 274–290.
Estes, Z., and Verges, M. (2008). Freeze or flee? Negative stimuli elicit selective responding. Cognition 108, 557–565.
Fox, E., Russo, R., Bowles, R., and Dutton, K. (2001). Do threatening stimuli draw or hold visual attention in subclinical anxiety? J. Exp. Psychol. Gen. 130, 681–700.
Friedman, B. H., and Thayer, J. F. (1998). Autonomic balance revisited: panic anxiety and heart rate variability. J. Psychosom. Res. 44, 133–151.
Fuller, B. F. (1992). The effects of stress-anxiety and coping styles on heart rate variability. Int. J. Psychophysiol. 12, 81–86.
Gronau, N., Cohen, A., and Ben-Shakhar, G. (2003). Dissociations of personally significant and task–relevant distractors inside and outside the focus of attention: a combined behavioral and psychophysiological study. J. Exp. Psychol. Gen. 132, 512–529.
Gross, J. J. (1998). The emerging field of emotion regulation: an integrative review. Rev. Gen. Psychol. 2, 271–299.
Johnsen, B. H., Thayer, J. F., Laberg, J. C., Wormnes, B., Raadal, M., Skaret, E., Kvale, G., and Berg, E. (2003). Attentional and physiological characteristics of patients with dental anxiety. J. Anxiety Disord. 17, 75–87.
Krantz, D. H., and Tversky, A. (1971). Conjoint measurement analysis of composition rules in psychology. Psychol. Rev. 78, 151–169.
Lang, P. J. (1980). “Behavioral treatment and bio-behavioral assessment: computer applications,” in Technology in Mental Health Care Delivery Systems, eds J. B. Sidowski, J. H. Johnson, and T. A. Williams (Norwood, NJ: Ablex), 119–137.
Lang, P. J., Bradley, M. M., and Cuthbert, B. N. (2005). International Affective Picture System (IAPS): Instruction Manual and Affective Ratings. Technical Report A-6. The Center for Research in Psychophysiology, University of Florida, Gainesville, FL.
Lang, P. J., Greenwald, M. K., Bradley, M. M., and Hamm, A. O. (1993). Looking at pictures: affective, facial, visceral, and behavioral reactions. Psychophysiology 30, 261–273.
Logan, G. D., and Cowan, W. B. (1984). On the ability to inhibit thought and action: a theory of an act of control. Psychol. Rev. 91, 295–327.
Luce, R. D., and Tukey, J. W. (1964). Simultaneous conjoint measurement: A new type of fundamental measurement. J. Math. Psychol. 1, 1–27.
Lyonfields, J. D., Borkovec, T. D., and Thayer, J. F. (1995). Vagal tone in generalized anxiety disorder and the effects of aversive imagery and worrisome thinking. Behav. Res. 26, 457–466.
McKenna, F. P., and Sharma, D. (1995). Intrusive cognitions: an investigation of the emotional Stroop task. J. Exp. Psychol. Learn. Mem. Cogn. 21, 1595–1607.
Miu, A. C., Heilman, R. M., and Miclea, M. (2009). Reduced heart rate variability and vagal tone in anxiety: trait versus state, and the effects of autogenic training. Auton. Neurosci. 145, 99–103.
Mujica-Parodi, L. R., Korgaonkar, M., Ravindranath, B., Greenberg, T., Tomasi, D., Wagshul, M., Ardekani, B., Guilfoyle, D., Khan, S., Zhong, Y., Chon, K., and Malaspina, D. (2009). Limbic dysregulation is associated with lowered heart rate variability and increased trait anxiety in healthy adults. Hum. Brain Mapp. 30, 47 – 58.
Öhman, A., Flykt, A., and Esteves, F. (2001). Emotion driven attention: detecting the snake in the grass. J. Exp. Psychol. Gen. 130, 466–478.
Peeters, F. P. M. L., Ponds, R. W. H. M., and Vermeeren, M. T. G. (1996). Affectiviteit en zelfbeoordeling van depressie en angst [affectivity and self-assessment of depression and anxiety]. Tijdschr. Psychiatr. 38, 240–250.
Pessoa, L. (2008). On the relationship between emotion and cognition. Nat. Rev. Neurosci. 9, 148–158.
Pessoa, L. (2009). How do emotion and motivation direct executive control? Trends Cogn. Sci. 13, 160–166.
Phaf, R. H., and Kan, K. (2007). The automaticity of emotional stroop: a meta-analysis. J. Behav. Ther. Exp. Psychiatry 38, 184–199.
Ploeg, H. M., van der Defares, P. B., and Spielberger, C. D. (1981). ZBV. Een nederlandstalige bewerking van de Spilberger State – Trait anxiety inventory [ZBV. A Dutch adaptation of the Spilberger’s State – Trait anxiety inventory]. Lisse: Swets and Zeitlinger.
Porges, S. W. (1992). “Autonomic regulation and attention,” in Attention and Information Processing in Infants and Adults, eds B. A. Campbell, H. Hayne, and R. Richardson (Hillsdale, NJ: Erlbaum), 201–223.
Pratto, F., and John, O. P. (1991). Automatic vigilance: the attention-grabbing power of negative social information. J. Pers. Soc. Psychol. 61, 380–391.
Pressman, S. D., and Cohen, S. (2005). Does positive affect influence health? Psychol. Bull. 131, 925–971.
R Development Core Team. (2009). R: A Language and Environment for Statistical Computing. Vienna: R Foundation for Statistical Computing.
Rouder, J. N., Speckman, P. L., Sun, D., Morey, R. D., and Iverson, G. (2009). Bayesian t tests for accepting and rejecting the null hypothesis. Psychon. Bull. Rev. 16, 225–237.
Ruiz-Padial, E., Sollers, J. J. III, Vila, J., and Thayer, J. F. (2003). The rhythm of the heart in the blink of an eye: emotion-modulated startle magnitude covaries with heart rate variability. Psychophysiology 40, 306–313.
Salthouse, T. A., and Hedden, T. (2002). Interpreting reaction time measures in between-group comparisons. J. Clin. Exp. Neuropsychol. 24, 858–872.
Schimmack, U. (2005). Attentional interference effects of emotional pictures: threat, negativity, or arousal? Emotion 5, 55–66.
Segerstrom, S. C., and Nes, L. S. (2007). Heart rate variability reflects self-regulatory strength, effort, and fatigue. Psychol. Sci. 18, 275–281.
Spielberger, C. D., Gorsuch, R. L., and Lusthene, R. E. (1970). Manual for the State-Trait Anxiety Inventory. Palo Alto: Consulting Psychologists Press.
Tarvainen, M. P., Niskanen, J. P., Lipponen, J. A., Ranta-aho, P. O., and Karjalainen, P. A. (2009). “Kubios HRV a software for advanced heart rate variability analysis,” in 4th European Conference of the International Federation for Medical and Biological Engineering, eds J. Sloten, P. Verdonck, M. Nyssen, J. Haueisen, and R. Magjarevic (Heidelberg: Springer), 1022–1025.
Thayer, J. F., Friedman, B. H., and Borkovec, T. D. (1996). Autonomic characteristics of generalized anxiety disorder and worry. Biol. Psychiatry 39, 255–266.
Thayer, J. F., and Lane, R. D. (2000). A model of neurovisceral integration in emotion regulation and dysregulation. J. Affect. Disord. 61, 201–216.
Thayer, J. F., and Siegle, G. J. (2002). Neurovisceral integration in cardiac and emotional regulation. IEEE Eng. Med. Biol. Mag. 21, 24–29.
Thayer, J. F., and Sternberg, E. (2006). Beyond heart rate variability: vagal regulation of allostatic systems. Ann. N. Y. Acad. Sci. 1088, 361–372.
Verbruggen, F., and De Houwer, J. (2007). Do emotional stimuli interfere with response inhibition? Evidence from the stop signal paradigm. Cogn. Emot. 21, 391–403.
Verbruggen, F., and Logan, G. D. (2008a). Automatic and controlled response inhibition: associative learning in the go/no-go and stop-signal paradigms. J. Exp. Psychol. Gen. 137, 649–672.
Verbruggen, F., and Logan, G. D. (2008b). Response inhibition in the stop-signal paradigm. Trends Cogn. Sci. 12, 418–424.
Verbruggen, F., and Logan, G. D. (2009). Models of response inhibition in the stop-signal and stop-change paradigms. Neurosci. Biobehav. Rev. 33, 647–661.
Vogt, J., De Houwer, J., Koster, E. H. W., Van Damme, G., and Crombez, S. (2008). Allocation of spatial attention to emotional stimuli depends upon arousal and not valence. Emotion 8, 880–885.
Vuilleumier, P. (2005). How brains beware: neural mechanisms of emotional attention. Trends Cogn. Sci. 9, 585–594.
Watson, D., Clark, L. A., and Tellegen, A. (1988). Development and validation of brief measures of positive and negative affect: the PANAS scales. J. Pers. Soc. Psychol. 54, 1063–1070.
Wetzels, R., Raaijmakers, J. G. W., Jakab, E., and Wagenmakers, E.-J. (2009). How to quantify support for and against the null hypothesis: a flexible WinBUGS implementation of a default Bayesian t test. Psychon. Bull. Rev. 16, 752–760.
Williams, J. M. G., Mathews, A., and MacLeod, C. (1996). The emotional Stroop task and psychopathology. Psychol. Bull. 120, 3–24.
Keywords: heart rate variability, response inhibition, individual differences, emotion regulation, stop-signal task
Citation: Krypotos A-M, Jahfari S, van Ast VA, Kindt M and Forstmann BU (2011) Individual differences in heart rate variability predict the degree of slowing during response inhibition and initiation in the presence of emotional stimuli. Front. Psychology 2:278. doi: 10.3389/fpsyg.2011.00278
Received: 29 June 2011;
Paper pending published: 02 August 2011;
Accepted: 04 October 2011;
Published online: 31 October 2011.
Edited by:
Tom Verguts, Ghent University, BelgiumCopyright: © 2011 Krypotos, Jahfari, van Ast, Kindt and Forstmann. This is an open-access article subject to a non-exclusive license between the authors and Frontiers Media SA, which permits use, distribution and reproduction in other forums, provided the original authors and source are credited and other Frontiers conditions are complied with.
*Correspondence: Angelos-Miltiadis Krypotos, Department of Psychology, University of Amsterdam, Weesperplein 4, (Room. 5.19) 1018 XA, Amsterdam, Netherlands. e-mail: amkrypotos@gmail.com