
- 1 Department of Psychology, University of Oregon, Eugene, OR, USA
- 2 Department of Psychology, University at Buffalo, State University of New York, Buffalo, NY, USA
- 3 Department of Psychology, University of Delaware, Newark, DE, USA
- 4 Research Imaging Institute, University of Texas Health Science Center at San Antonio, San Antonio, TX, USA
- 5 Department of Biology and Neuroscience Institute, University of Texas at San Antonio, San Antonio, TX, USA
Native tone language experience has been linked with alterations in the production and perception of pitch in language, as well as with the brain response to linguistic and non-linguistic tones. Here we use two experiments to address whether these changes apply to the discrimination of simple pitch changes and pitch intervals. Event related potentials (ERPs) were recorded from native Mandarin speakers and a control group during a same/different task with pairs of pure tones differing only in pitch height, and with pure tone pairs differing only in interval distance. Behaviorally, Mandarin speakers were more accurate than controls at detecting both pitch and interval changes, showing a sensitivity to small pitch changes and interval distances that was absent in the control group. Converging evidence from ERPs obtained during the same tasks revealed an earlier response to change relative to no-change trials in Mandarin speakers, as well as earlier differentiation of trials by change direction relative to controls. These findings illustrate the cross-domain influence of language experience on the perception of pitch, suggesting that the native use of tonal pitch contours in language leads to a general enhancement in the acuity of pitch representations.
Introduction
There is increasing evidence that native experience with a tone language changes the perceptual and categorization abilities of listeners for both linguistic and non-linguistic stimuli (i.e., Deutsch, et al., 2006; Krishnan et al., 2009). For example, speakers of Mandarin, where the lexical meaning of a word depends on the overall pitch height as well as change in pitch (melodic contour) in production, are better at discriminating pitch intervals compared to native speakers of English (Pfordresher and Brown, 2009; Hove et al., 2010), a language that uses tone mainly to convey supra-segmental or prosodic information concerning stress or sentence structure (Cruttenden, 1997; Yip, 2002; Gussenhoven, 2004). It is unclear however, whether corresponding temporal dynamics of the neural processes underlying pitch perception actually facilitate this advantage, and whether or not this advantage for tone language speakers transfers to simple non-linguistic stimuli, such as pure tones. With this goal, the current study compares native speakers of a tonal language to speakers of an intonation language with no tone language experience, and measures both accuracy and continuous electrophysiological data on two auditory discrimination tasks.
Languages are classified as either “tonal” or “intonation” based on whether they use pitch to convey word meaning (Yip, 2002). For example, in Mandarin, a Chinese tone language, the word ma can mean “mother,” “hemp,” “horse,” or “scold” based on whether a level, rising, falling, or bi-directional (falling then rising) tone is used, respectively. Acquiring the ability to speak a tone language demands the establishment of fine-grained associations between pitch contours and word meaning, and this appears to lead to general enhancements in pitch processing (Pfordresher and Brown, 2009) and AP abilities (Deutsch, et al., 2009; Deutsch et al., 2006). The use of pitch during language acquisition might exclusively influence pitch processing of speech stimuli, consistent with the view that speech is a specialized, modular ability (Liberman et al., 1967; Liberman and Mattingly, 1985, 1989; Liberman and Whalen, 2000). Alternately, if pitch contrasts in speech are processed by general auditory mechanisms (Bregman et al., 1990), then tone speakers may demonstrate enhanced pitch processing abilities for non-linguistic stimuli, such as simple pure tones.
Recent studies have reported several forms of evidence for this advantage (though see also Burns and Sampat, 1980; Stagray and Downs, 1993; Lee et al., 1996 which have not observed a tone language advantage for the processing of non-speech tones). Higher accuracy has been found among native speakers of an Asian tone language than intonation speakers for discriminating pitch intervals (Pfordresher and Brown, 2009; Hove et al., 2010). Absolute pitch (AP) is more prevalent among Chinese than American music conservatory students (Deutsch et al., 2006). AP abilities have been found to be more accurate in individuals who are very fluent in a tone language, compared to those who are moderately or not at all fluent (Deutsch et al., 2009). Speakers of Japanese (a pitch accented language) have been found to be better at detecting mistuning of familiar songs than are English speakers (Trehub et al., 2008; but see Schellenberg and Trehub, 2008). Similarly, the reverse relationship has also been documented, where Mandarin speakers with deficits in processing musical pitch are often also worse at identifying and discriminating Mandarin tones than are other speakers (Nan et al., 2010). If indeed tone language experience facilitates the processing of pitch, then additional questions are raised about the specificity of the underlying changes to neural systems implicated in pitch processing, such as whether these changes are limited to the processing of pitch contours similar to the tonal contours in one’s native language, or whether these changes apply generally to processes recruited when discriminating between non-linguistic tones differing only in pitch.
In addition to behavioral evidence of a tone language advantage, several studies have demonstrated that native tone language experience leads to changes in the pre-attentive subcortical processing of pitch contours, occurring as early as the auditory brainstem-evoked response. Using the scalp-recorded human frequency following response (FFR), a measure of phase-locked activity in the rostral brainstem, researchers have observed stronger pitch representations, and smoother pitch tracking of Mandarin tonal contours in native speakers of Mandarin Chinese than in English controls (Krishnan et al., 2005, 2009; Swaminathan et al., 2008). Furthermore, this enhanced pitch representation at the brainstem level appears to be driven by pitch information in the auditory stream, specifically for certain dimensions of pitch contours that native tone speakers are familiar with, and not specific to speech (Swaminathan et al., 2008; Krishnan et al., 2009). Musical training may also enhance the extraction of pitch information from Mandarin tones in the brainstem, even among individuals with no knowledge of Mandarin (Wong et al., 2007). These findings suggest that native tone-speaking experience involves plasticity-related changes that optimize which dimensions of the auditory signal are captured at the brainstem and subsequently passed on to pitch-relevant processes at the cortical level, and that these pitch processing advantages may be shared across linguistic and non-linguistic domains.
Although the present study addresses the effect of native tone language experience on the active processing of pitch during a discrimination task, others have shown tone language effects on pre-attentive processing during passive listening tasks. Chandrasekaran et al. (2007a,b) have observed that native tone speakers demonstrate a larger mismatch negativity (MMN) to deviant non-speech homologues of Mandarin pitch contours than English-speaking controls. Even when the deviant non-speech tone was a pitch contour not found in any language, tone language speakers elicited a larger MMN than non-tone language speaking musicians and non-musicians, suggesting that native tone-speaking experience enhances the pre-attentive neural representation of pitch-relevant information (Chandrasekaran et al., 2009). Kaan et al. (2007, 2008) observed an MMN to deviant Thai lexical tones in native speakers of Thai, Mandarin, and English, suggesting all are able to pre-attentively discriminate among tones. Further, they found that perceptual identification training with the tones improved performance on a behavioral discrimination task and decreased MMN amplitude and latency for all groups. Similar MMN latency decrements with pitch training had been reported previously, although they were conversely observed in conjunction with increases in MMN amplitude (Kraus, et al., 1995; Tremblay et al., 1997). Overall, these findings provide evidence of short- and long-term plasticity-related changes in the auditory system and suggest that native tone language experience will facilitate the timing and magnitude of the brain’s response to sound input.
In the few event related potential (ERP) studies that have examined the effects of pitch change more generally, modulations of both early and late ERP components effects have been observed in relation to pitch discrimination. Tervaniemi et al. (2005) found that both early (MMN, N2b) and late ERP components (P300) increased in amplitude to deviant tones in an oddball paradigm with increasing amount of pitch change. Similarly, Peretz et al. (2005) observed increases in N1 amplitude with the increasing amount of pitch change of a deviant tone within a 5-tone sequence. Perhaps most relevant to the current study, training-related increases in P2 and N1c amplitude have been observed during an active-listening task similar to the one employed here, where a standard auditory tone was followed by a second tone of same or differing pitch to which participants must respond indicating whether the two tones were the same or different (Bosnyak et al., 2004). Given that early auditory ERP components are sensitive to modulations in pitch, we predict that a pitch processing advantage for native tone speakers will be reflected in ERPs at early stages of processing (e.g., N1–P2 complex), indexing facilitated perceptual processing.
Herein we present two experiments using ERPs to capture the temporal dynamics of the neural response to pure tones during a simple pitch discrimination task (Experiment 1) and a more complex pitch interval discrimination task (Experiment 2). For both experiments, we first report differences in behavioral performance between native tone language speakers and a control group, followed by a detailed summary of the ERPs of each group for the effect of pitch change and change direction.
Experiment 1
Experiment 1 follows from Pfordresher and Brown (2009), who found a nominal behavioral advantage in accuracy on a simple pitch discrimination task for tone vs. non-tone speakers. The range of pitch trials used tended toward easily discriminable tones, which is exemplified by the near-perfect performance of several participants in that study and a previous study using an identical task (Pfordresher and Brown, 2007). In those studies (Pfordresher and Brown, 2007, 2009), contrast trials deviated from the base pitch (C5) by 25, 50, 100, 200, 400, 600, and 800 cents, where performance reached high accuracy around 100 cents. Here we used a more challenging range of pitch changes: 7, 13, 25, 50, 100, and 200 cents. It should be noted that accurate performance on this task depends solely on the ability to extract pitch height information from the flat, non-contoured pure tones. Although Asian tone languages undoubtedly place heavy emphasis on pitch contour, research suggests that pitch height is still relevant to tone judgments in Mandarin, as pitch height information is believed to be evaluated separately from, and later integrated with, information about pitch contour (Massaro et al., 1985). Considering that pitch height information is crucial to accurate performance on our task, we hypothesize that tone language speakers will be better able to discriminate changes in pitch than speakers with no tone language experience, particularly on difficult trials (smaller cent change). In addition to the behavioral advantage, we expect that the ERPs of tone language speakers will reflect enhanced perceptual processing in early sensory components like the N1–P2 complex, and possibly differences at later stages of processing, such as the P300.
Methods
Participants
Thirty-three right-handed adults1 ,2 grouped as native tone language speakers and a control group were paid for their participation. The Tone group consisted of 17 native speakers of Mandarin Chinese (9 females; mean age = 26.4 years), who were born and raised in China for an average of 22.94 years (range 16–30). They reported using Mandarin for an average of 64% of the day (range 5–90%), all resided in the USA for at least 1 year, and were proficient in English, with an average of 14.71 years of experience in English (range 6–27 years). All were also fluent in at least one other language, including another tone language (i.e., Cantonese or Taiwanese) for 10 of the Tone speakers. The control group consisted of 16 individuals (7 females; mean age = 28.3 years) of various ethnic backgrounds who had no exposure to a tone language. Importantly, the Tone and control groups were not significantly different on years of musical training (tone, M = 2.30, control, M = 1.44; p = 0.27), years of playing an instrument or singing (tone, M = 3.41, control, M = 1.63; p = 0.11), hours listening to music per week (tone, M = 12.24, control, M = 10.44; p = 0.60), and live concerts attended per year (tone, M = 2.53, control, M = 3.19; p = 0.60). No participants in either group reported any private musical training outside of school activities. Additionally, to control for the number of languages spoken as compared to the bilingual Tone speakers, all members of the control group were bilingual in another non-tone language, such that the groups had similar years of experience with a non-native language (tone, M = 26.35 years, control, M = 26.81 years; p = 0.80). Tests of hearing thresholds with an audiometer confirmed that all participants could detect low intensity tones (<35 db) within the frequency range used for testing (500–6000 Hz)3.
Stimuli
The stimuli were pure tones created using Matlab software (The Mathworks, Natick, MA, USA) with custom-made scripts, and were presented using E-Prime software (Psychological Software Tools, Inc., Pittsburgh, PA, USA). Tone amplitudes were shaped by an exponential function that resulted in 200 ms attack and 50 ms decay times. The first tone in each pair was always 524 Hz (C5), and was followed by either the identical sound (240 trials) or a tone that was higher (120 trials) or lower (120 trials) in pitch, yielding equiprobability of change and no-change trials. (see Pfordresher and Brown, 2007, 2009). The pitch difference between the first and second note could be 7, 13, 25, 50, 100, or 200 cents (40 trials each), corresponding to approximate frequency differences of 2, 4, 8, 15, 30, and 61 Hz respectively. Like Pfordresher and Brown, we aimed for a geometric series based on subdividing 400 cents into equal intervals (rounding to the nearest cent) to include critical intervals like the semitone and quartertone (50 cents). The order of trials was pseudo-randomized, such that no more than two trials in a row were presented with the same amount or direction of change, with a fixed order presented to all participants.
Procedure
After written consent, participants completed a series of questionnaires requesting information such as demographics, hearing and sight conditions, handedness, language history, and musical experience. For the ERP session, participants sat alone in a sound attenuating, electrically shielded recording chamber and wearing ER-1 insert earphones (Etymotic Research, Inc., Elk Grove Village, IL, USA) to listen to the sound stimuli. Instructions were presented on a computer monitor 4.5 feet from the participant. An experimenter monitored the continuous recording of EEG and a video monitor of the participant throughout the experiment. During a single session, participants performed alternating blocks of pitch discrimination trials and interval discrimination trials (see Experiment 2). After a set of 8 practice trials, participants were presented with 480 pairs of tones across 12 blocks of the pitch discrimination task, interspersed with 16 blocks of interval discrimination trials. During the pitch discrimination trials, participants heard two tones lasting 500 ms each, separated by 500 ms of silence (see Figure 1). They judged whether the two tones were the same or different. Participants were asked to fixate their vision on a half-inch white cross on a black screen, which appeared 500 ms before the first tone was heard to orient the participant, and remained on the screen until 500 ms after the end of the last tone to reduce eye movement artifacts in the EEG. This was followed by three fixation crosses that remained on the screen for 3000 ms or until the participant responded (cued delayed-response). Responses before or after the appearance of these three crosses were registered as a null response. Participants responded by pushing one button for “same” and another for “different” with their right hand on a PST serial response box (Psychological Software Tools, Inc., Pittsburgh, PA, USA). At the end of each trial, the screen went blank for 500 ms before the onset of the next trial.
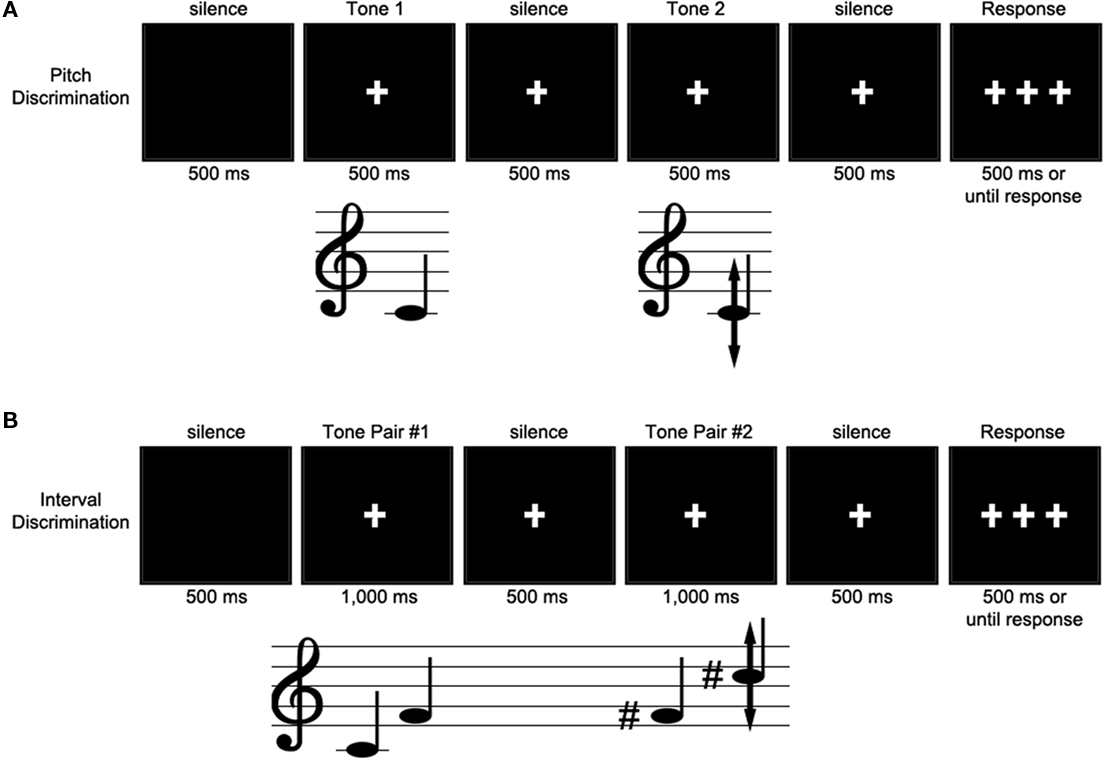
Figure 1. Example trial for Experiments 1 (A) and 2 (B). During the pitch discrimination task, a standard tone was presented, followed 500 ms later by a tone of identical, lower, or higher pitch. Participants indicated their response (same or different) by button press when the three fixation crosses appeared on the screen. ERPs were time-locked to the onset of the second tone.
Between each block, participants read a few sentences of an entertaining children’s story (king grisly beard by the Brothers Grimm) at their own pace, to prevent fatigue from the discrimination task. Participants were also given several breaks. The entire session lasted approximately 2.5 h, with 1.5 h of EEG recording.
ERP recording parameters
Continuous scalp-recorded EEG was acquired using a geodesic array of 26 pre-amplified sintered Ag–AgCl electrodes (BioSemi active electrodes) embedded in a custom electrode cap (Electro-Cap International Inc., using BioSemi electrode holders; see Giuliano and Wicha (2010). Additional electrodes were placed below and at the outer canthi of the left and right eyes to record blinks and eye movement, respectively, and on the left and right mastoid processes to serve as offline reference. Preamplifiers in each electrode were used to reduce induced noise between the electrode and the amplification/digitization system (BioSemi ActiveTwo, BioSemi B.V. Amsterdam), allowing high electrode impedances. Electrode offsets were kept below 35 mV. A first-order analog anti-aliasing filter with a half-power cutoff at 3.6 kHz was applied (see www.biosemi.com). The data were sampled at 512 Hz (2048 Hz with a decimation factor of 1/4) with a bandwidth of DC to 134 Hz, using a fifth order digital sinc filter. Each active electrode was measured online with respect to a common mode sense (CMS) active electrode producing a monopolar (non-differential) channel, and was referenced offline to the average of the left and right mastoids. Data were processed using BrainVision Analyzer 2 (Brain Products GmbH, Munich, Germany). Non-causal Butterworth digital filters were applied with a low cutoff at 0.1 Hz (12 db/oct) and high cutoff at 30.0 Hz (12 db/oct). The EEG data were segmented in intervals of 1000 ms time-locked to stimulus-onset with a 200 ms prestimulus baseline. Epochs containing blinks, eye movement and excessive artifacts were removed from the data. Artifact rejection thresholds were adjusted for each participant for tests of maximum amplitude to capture blinks, maximum voltage step per ms to capture voltage spikes, minimum amplitude per 50 ms to capture flat lining and saccades, and maximum amplitude difference in 100 ms to capture signal drift. Average waveforms were then calculated for each condition time-locked to the second tone in each pair. Only trials for correctly discriminated tones were included in the grand averages, with change and no-change trials averaged separately. For display purposes only, a high cutoff filter at 15 Hz was applied to the grand average ERPs used in each figure.
Results
Behavioral data
Figure 2 contains a summary of performance on the pitch discrimination task. Performance accuracy was analyzed by the amount and direction of pitch change using hit rate minus false alarm rate, a measure of discrimination accuracy that corrects for response bias (Ayotte et al., 2002). In this case a hit corresponded to the correct detection of a pitch change, while a false alarm corresponded to a response of “different” on a no-change trial. A repeated-measures ANOVA with factors of Group (tone vs. control) × change amount (7, 13, 25, 50, 100, or 200 cents) × change direction (up vs. down) was performed. Overall, performance was better in tone speakers than the control group [group, F(1, 31) = 7.700, p = 0.009], particularly when discriminating smaller changes in pitch [group × change amount, F(5, 155) = 4.405, p = 0.014]. Tone speakers were more accurate than controls on pitch changes of 13 cents (p = 0.006), 25 cents (p = 0.007), and 50 cents (p = 0.035). When collapsing across groups, performance overall improved as the amount of pitch change increased [change amount, F(5, 155) = 230.224, p < 0.001] and was more accurate on downward than upward pitch changes [change direction, F(1, 31) = 10.287, p = 0.003] particularly on small pitch change trials [change amount × change direction, F(5, 155) = 5.684, p = 0.002]. However, effects of change direction were more pronounced in tone speakers [down, 74.5%; up, 68.5%; F(1, 31) = 6.533, p = 0.016] than in controls [down, 61.8%; up, 57.0%; F(1, 31) = 3.957, p = 0.056]. To explore this pattern further we performed planned contrasts by change direction, revealing that tone speakers were more accurate than controls at change amounts of 7 cents (p = 0.030), 13 cents (p = 0.005), and 25 cents (p = 0.024). On upward changes, tone speakers were better at changes of 13 cents (p = 0.038), 25 cents (p = 0.006), and 50 cents (p = 0.028).
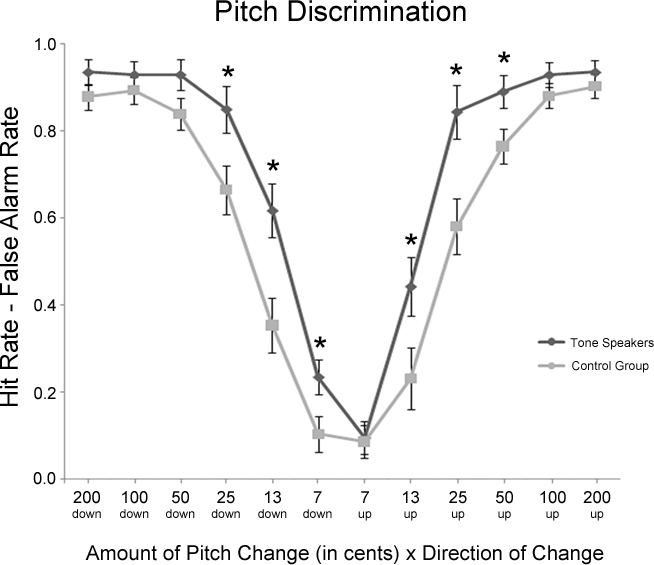
Figure 2. Experiment 1 behavioral performance (hit rate minus false alarm rate) on the pitch discrimination task as a function of the amount and direction of pitch change. Significant group differences between tone speakers and controls are starred (p < 0.05).
Event-related potentials analyses
Grand average ERPs time-locked to the second tone in each pair can be seen in Figures 3 and 4. For both groups, the early frontocentral negative deflection (N1) and later central-parietal positivity (P300) were larger in amplitude for change than no-change trials (Figure 3; see also footnote 4 regarding contingent negative variation). Upon visual inspection, the ERPs of the control group were characterized by larger N1c and P300 amplitudes to change trials relative to the tone speakers. Taking the direction of pitch change into consideration (Figure 4), tone speakers distinguished between upward and downward pitch changes around 200–400 ms post-stimulus, whereas the control group ERPs to upward and downward changes did not differ until later stages of processing of approximately 400 ms and onward. In the following sections we address results separately for effects of pitch change and change direction, with planned contrasts between groups when a group main effect or interaction with group was present. Mean amplitudes were analyzed in a group × change (change vs. no-change) ANOVA design including scalp distribution factors of hemisphere (left vs. right) × laterality (lateral vs. medial) × anteriority (prefrontal, frontal, central, occipital), such that only 16 of the 26 scalp electrodes were included in the omnibus ERP analyses (left lateral sites, LLPf (prefrontal), LLFr (frontal), LLTe (temporal), LLOc (occipital); left medial sites, LMPf, LMFr, LMCe, LMOc; right lateral sites, RLPf, RLFr, RLTe, RLOc; right medial sites, RMPf, RMFr, RMCe, RMOc). Greenhouse–Geisser corrections were applied to all repeated-measures with more than one degree of freedom to correct for errors of sphericity, and Bonferoni corrections were used for all pair wise comparisons.
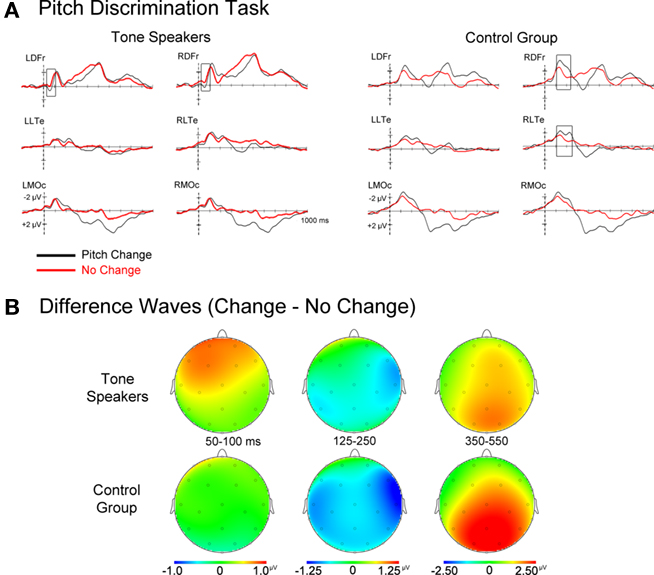
Figure 3. (A) Event related potentials for change and no-change trials time-locked to the second tone of each pair. (B) Topographic scalp plots of difference wave activity (change minus no-change trials). Notice the larger P50 for tone speakers, and the later effects for the control group (N1c).
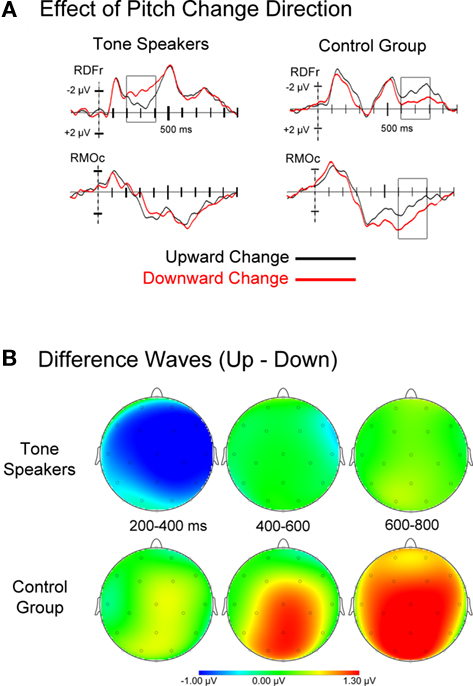
Figure 4. (A) Event related potentials for upward and downward pitch changes, collapsed across the amount of pitch change. Tone speakers showed early differentiation between change directions (200–400 ms), whereas the control group ERPs showed effects of change direction at later stages of processing. (B) Topographic scalp plots of difference wave activity (upward minus downward pitch changes) for each analyzed window.
Effect of pitch change (change vs. no-change)
Topographic scalp plots of change minus no-change difference waves (Figure 3B) suggest that tone speakers differentiated between change and no-change trials at very early stages of processing, specifically at the P50 (50–100 ms). Both groups showed evidence of differentiating between change and no-change trials at the subsequent negativity (N1 complex), although the control group seemed to take longer to resolve this discrepancy, manifesting in a prolonged N1c. At subsequent stages of processing indexed by the P300, both groups showed similar differentiation between change and no-change trials. During the same time window in which the P300 emerged at central-parietal sites, the CNV-like4 sustained negativity was observed at anterior sites. To capture these effects, mean amplitudes were extracted in time windows of 50–100 ms (P50), 125–250 ms (N1), and 350–550 ms (P300/CNV).
50–100 ms. There was a main effect of pitch change at anterior sites, with larger P50 amplitudes for change than no-change trials at left anterior sites [change × anteriority, F(3, 93) = 8.701, p = 0.002; change × hemisphere × anteriority, F(3, 93) = 3.661, p = 0.024; change × hemisphere × laterality × anteriority, F(3, 93) = 6.450, p = 0.001]. Overall, P50 amplitudes at frontocentral electrodes were larger for tone speakers than the control group [group × hemisphere × anteriority, F(3, 93) = 4.238, p = 0.019; group × hemisphere × laterality × anteriority, F(3, 93) = 5.081, p = 0.006]. Although there were no significant interactions between group and change, the main effect of change and the differences by group seemed to be carried by larger P50 amplitudes to change than no-change trials in tone speakers only. Post hoc analyses confirmed that tone speakers elicited larger P50 amplitudes to change than no-change trials at several bilateral anterior sites (MiPf, LLPf, LMPf, RMPf, RDFr, LDFr, LMFr, RMFr, and LDCe significance at p < 0.05), while this same effect was limited to one electrode in the control group (LLPf).
125–250 ms. A right-lateralized N1 was observed for both groups independent of change condition during this epoch. Similar to the P1, the N1 was larger in amplitude for change than no-change trials [change, F(1, 31) = 9.608, p = 0.004], and was most pronounced at medial electrodes over the right hemisphere [change × hemisphere, F(1, 31) = 11.568, p = 0.002; change × laterality, F(1, 31) = 6.717, p = 0.014; change × anteriority, F(3, 93) = 7.292, p = 0.004; change × hemisphere × Laterality, F(1, 31) = 10.714, p = 0.003; change × hemisphere × anteriority, F(3, 93) = 10.084, p < 0.001; change × laterality × anteriority, F(3, 93) = 6.706, p = 0.001; change × hemisphere × laterality × anteriority, F(3, 93) = 5.069, p = 0.007]. The distribution of the N1 effect for change vs. no-change trials differed between groups [group × change × hemisphere × laterality, F(1, 31) = 5.301, p = 0.028], with a more distributed effect for control subjects (medial sites in the left, p = 0.022 and right hemispheres, p = 0.013 and at right lateral sites, p = 0.001) than tone speakers (right medial electrodes, p = 0.033). Additionally, only the control group showed an N1 effect at the right lateral temporal electrode site (RLTe: p < 0.001; tone speakers, p = 0.173), likely indexing the N1c subcomponent of the auditory N1 potential, with greater amplitude for change than no-change trials.
350–550 ms. Overall, P300 amplitudes were larger for change than no-change trials at frontal, central, and posterior sites [change, F(1, 31) = 21.056, p < 0.001; change × anteriority, F(3, 93) = 24.576, p < 0.001], while the CNV7 was larger for no-change than change trials at medial prefrontal sites [change × hemisphere, F(1, 31) = 9.529, p = 0.004; change × laterality, F(1, 31) = 19.223, p < 0.001; change × hemisphere × anteriority, F(3, 93) = 3.995, p = 0.015; change × laterality × anteriority, F(3, 93) = 4.674, p = 0.008]. There was also an overall amplitude difference between groups [group, F(1, 31) = 5.502, p = 0.026], with tone speakers eliciting larger negative (CNV) amplitudes than controls at prefrontal and frontal sites, while controls elicited larger positive amplitudes (P300) than tone speakers at posterior sites [group × laterality × anteriority, F(3, 93) = 4.640, p = 0.015; group × hemisphere × laterality × anteriority, F(3, 93) = 5.100, p = 0.005]. Interestingly, tone speakers elicited larger CNV amplitudes than controls on both change and no-change trials, while controls elicited larger P300 amplitudes than tone speakers on change trials only [group × change × anteriority, F(3, 93) = 4.953, p = 0.021; group × change × laterality × anteriority, F(3, 93) = 3.002, p = 0.046].
Direction of change analyses
Visual inspection of the ERPs for upward and downward pitch changes collapsed across amount of change suggests an earlier dissociation between upward and downward change for tone speakers than controls (see Figure 4). Mean amplitudes for upward and downward trials were extracted for consecutive epochs of 200–400 ms, 400–600 ms, and 600–800 ms, then subjected to a group × change direction (up, down) ANOVA.
200–400 ms. Tone speakers elicited larger negative amplitude for downward than upward changes over the right hemisphere [group × change direction × laterality, F(1, 31) = 6.297, p = 0.018; group × change direction × hemisphere × laterality × anteriority, F(3, 93) = 3.008, p = 0.043]. Pairwise comparisons show that this difference was strongest at the lateral frontal and temporal electrodes (RLFr, p = 0.004; RLTe, p = 0.005), as well as medial prefrontal to central sites (RMPf, p = 0.053; RMFr, p = 0.009; RMCe, p = 0.015). No significant differences were observed for the control group (all p’s > 0.10).
400–600 ms. There were no significant main effects of group or change direction, nor interactions of these factors, in this window.
600–800 ms. Controls elicited larger positive amplitudes to downward than upward changes at medial electrode sites [group × change direction × laterality × anteriority, F(3, 93) = 3.532, p = 0.028]. Pairwise comparisons revealed that this was significant at frontal (p = 0.033), central (p = 0.006) and occipital sites (p = 0.002). No differences by change direction were observed for tone speakers.
Discussion
The behavioral and electrophysiological results both demonstrate a clear advantage for native tone speakers on this simple pitch discrimination task. Tone speakers were more accurate at discriminating changes in pitch, particularly for smaller change amounts. In addition, tone speakers elicited an earlier difference between change and no-change trials (P50) than was observed in the control group (N1), alluding to faster and more sensitive tone discrimination in speakers of a tone language. Similarly, the ERPs of tone speakers differentiated upward from downward pitch change at an earlier stage of processing (200–400 ms) than controls (600–800 ms), even though the task did not require listeners to indicate the direction of pitch change. ERPs from the control group also showed larger P300 amplitude on change trials compared to tone speakers, indexing a difference in the ability to categorize the stimuli perhaps due to categorical perception requiring more resources for the control group. Finally, subtle differences in scalp distribution between the groups imply that non-tone language speakers employed a more widely distributed neural network to perform the task than tone language speakers.
Experiment 2
Experiment 1 demonstrated an advantage for tone language speakers on a simple pitch discrimination task. Experiment 2 was designed to test for a similar advantage on a more complex perceptual discrimination task. Experiment 2 required participants to determine if two consecutive pairs of tones were of same or different interval size. The goal was to uncover the electrophysiological correlates for an observed behavioral tone language advantage (Pfordresher and Brown, 2009; Hove et al., 2010), using a similar task and stimuli.
Methods
Participants
Data from right-handed native tone language speakers (n = 16) and controls (n = 16) of those who participated in Experiment 1 were used for this experiment.5
Stimuli
Stimuli were pure tones as in Experiment 1. During each trial, participants heard two pairs of notes, where the first interval (standard) always comprised C5 (524 Hz) then G5 (784 Hz), resulting in a 700-cent change (where 100 cents = 1 semitone). The second interval started on F#5 (740 Hz) and was immediately followed by a fourth tone, which varied with trial type.
On “no-change” trials (160 total), the fourth tone was C#6, resulting in an equivalent change compared to the previously presented tone pair. On “change” trials (240 total), the fourth tone was either higher or lower in pitch than the no-change note C#6 by 13, 25, 50, 100, 200, or 400 cents (20 trials each). Thus, relative to the standard interval, an “expanded” interval was created by upward pitch changes from C#6, while a “shrunken” interval was formed by downward changes from C#6. Participants were asked to judge the relative size of the two intervals by indicating whether they were “same” or “different” via a button press. The order of trials was pseudo-randomized, such that no more than two trials in a row were presented with the same amount or direction of change, with a fixed order presented to all participants.
Procedure
The procedure was the same as in Experiment 1. Participants completed a total of 400 trials of interval discrimination across 16 blocks. During each trial (see Figure 1B), participants were asked to fixate on a half-inch white cross on a black screen, which appeared 500 ms before the first tone to orient the participant, and remained on the screen until 500 ms after the end of the last tone to reduce eye movement artifacts in the EEG. Participants responded by pushing one button for “same” and another for “different” with their right hand on a response box. At the end of each trial, the screen went blank for 500 ms before the onset of the next trial.
Results
Behavioral data
Figure 5 contains a summary of performance on the interval discrimination task. Response accuracy was analyzed using hit rate minus false alarm rate in a group × interval distance (13, 25, 50, 100, 200, and 400 cent change) × change direction (expanded vs. shrunken) repeated-measures ANOVA. For both groups, performance became more accurate as the amount of interval change increased [interval, F(5, 150) = 131.807, p < 0.001] and was more accurate on expanded than shrunken intervals [interval × change direction, F(5, 150) = 2.702, p = 0.044], particularly at large interval distances of 400 cents (p = 0.001). Although there was no main effect of group, F(1, 30) = 1.574, p = 0.219, there was a significant group × interval interaction, F(5, 150) = 5.926, p = 0.001, where tone speakers performed better than controls at the largest interval change amounts, specifically 200-cent (p = 0.012) and 400-cent change (p = 0.022). Furthermore, there was a group × interval × change direction interaction, F(5, 150) = 3.307, p = 0.019, revealing better performance in tone speakers than the control on shrunken intervals of 200 cents (p = 0.038) and 400 cents (p = 0.008), and on expanded intervals of 13 cents (p = 0.046), and 200 cents (p = 0.009). Tone speakers were also marginally better on expanded intervals of 100 cents, p = 0.061 (note that the apparent difference at 25 cent intervals in Figure 5 was not significant, p = 0.101).
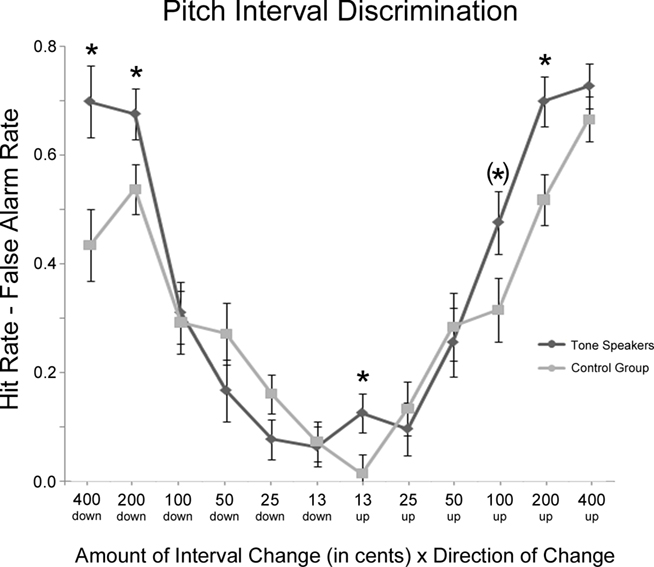
Figure 5. Mean hit rate minus false alarm rate on the interval discrimination task for tone speakers and controls as a function of the amount and direction of change. Significant group differences are starred (p < 0.05); the parentheses indicate a marginal group difference (p = 0.61).
Event-related potentials
Event related potentials were time-locked to the critical changing tone (second tone of the second pair) and analyzed as change relative to no-change (Figure 6) and by change direction (Figure 7). In the following, we describe the results of each analysis in separate sections. As with Experiment 1, all ERP analyses included the electrode factors of hemisphere (left, right) × laterality (lateral, medial) × anteriority (prefrontal, frontal, central, occipital), while Greenhouse–Geisser and Bonferroni corrections were applied where appropriate.
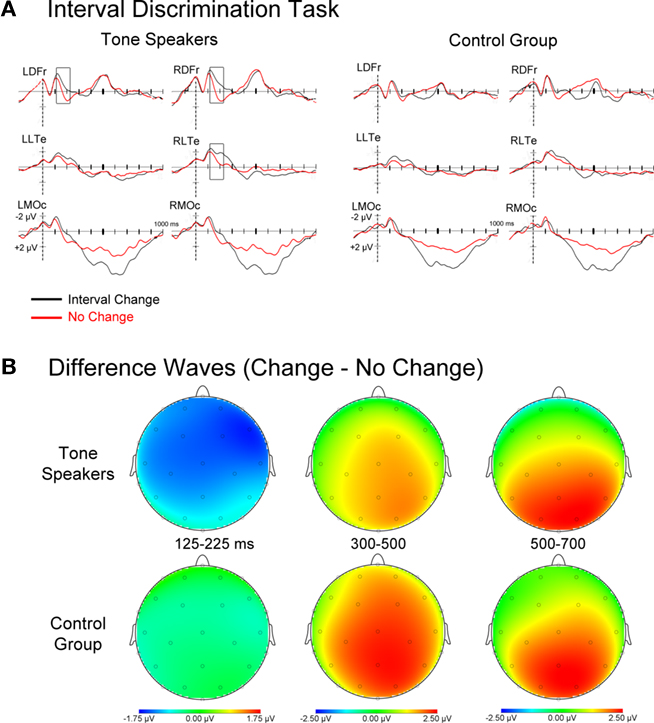
Figure 6. (A) Event related potentials for interval change and no-change trials time-locked to the second tone of the second tone pair. (B) Topographic scalp plots of difference wave activity (change minus no-change trials). Notice the earlier effects of interval change for Tone speakers.
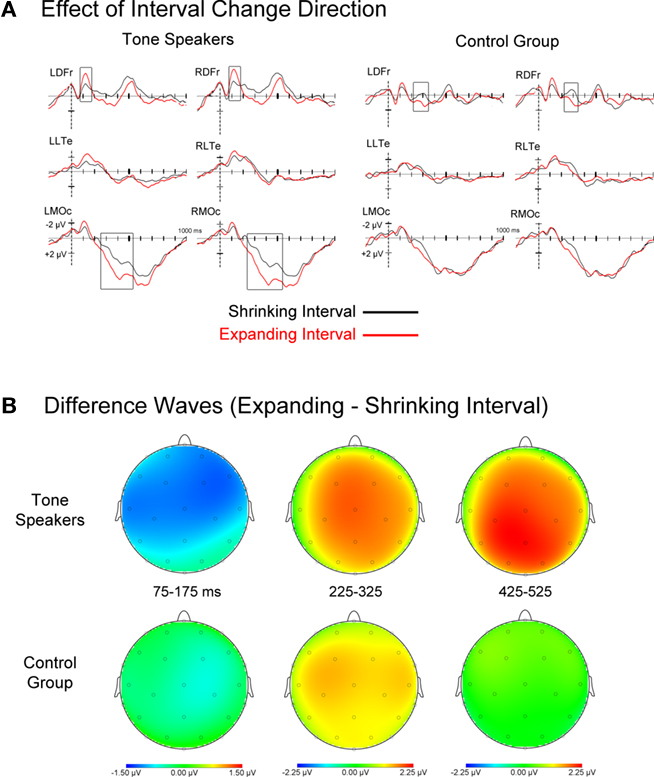
Figure 7. (A) Event related potentials for rising and falling interval changes, collapsed across amount of change. Tone speakers showed larger effects of change direction than controls at early (75–175 ms) and later stages of processing (425–525 ms). (B) Topographic scalp plots of difference wave activity (upward minus downward pitch changes) for each analyzed window, showing earlier effects for tone speakers.
Effect of interval change (change vs. no-change)
Event related potentials for all interval no-change and change trials collapsed across change amount, as well as difference waves of change minus no-change activity are shown in Figure 6. Mean amplitudes were extracted in epochs where group ERPs differentiated between change and no-change intervals and subjected to a group × change (change vs. no-change) ANOVA. The chosen epochs corresponded with an early, right-lateralized N1 effect of change that was only present in tone speakers (125–225 ms), and a later effect of change seen in both groups that was indexed by a P300 and subsequent late positivity (300–500 ms, 500-700 ms).
125–225 ms. Overall, N1 amplitudes were larger for change than no-change trials [change, F(1, 30) = 14.327, p = 0.001]. However this was mitigated by a marginally significant interaction by group [group × change, F(1, 30) = 3.969, p = 0.056], such that this effect was observed in tone speakers (p < 0.001) but not in the control group (p = 0.215). Pair wise comparisons confirmed that the larger N1 amplitudes for tone speakers on change relative to no-change intervals was observed broadly across the scalp, yet absent in controls.
300–500 ms. For both groups, P300 amplitudes were larger for change than no-change trials [change, F(1, 30) = 19.234, p < 0.001]. However, this effect was more widely distributed in controls than tone speakers [group × change × laterality × anteriority, F(3, 90) = 3.564, p = 0.037]. This effect was observed at all midline sites, as well as lateral central and occipital sites for the control group, and only at midline frontal, central, and occipital sites for tone speakers.
500–700 ms. Continuing from the previous epoch, the prolonged positivity resulted in larger positive amplitudes for change than no-change trials in both groups [change, F(1, 30) = 11.541, p < 0.001]. While both groups showed a larger positivity to change than no-change trials at lateral and medial occipital sites, and medial frontal and central sites, this effect extended to lateral central sites in tone speakers only [group × change × anteriority, F(3, 90) = 4.147, p = 0.038; group × change × laterality × anteriority, F(3, 90) = 5.161, p = 0.008].
Effect of interval change direction
Figure 7 shows ERPs for expanded and shrunken intervals collapsed across amount of interval change, as well as difference waves for rising minus falling intervals. Visual inspection reveals that the ERPs of tone speakers differentiated between expanded and shrunken change around 75 ms and at later stages of processing, while an effect of change direction in non-tone speakers did not emerge until approximately 225 ms. To capture these effects, mean amplitudes were extracted in windows of 75–175 ms, 225–325 ms, and 425–525 ms, and subjected to a group × change direction (expanded vs. shrunken) ANOVA.
75–175 ms. Overall, amplitudes in this epoch were more negative for expanded than shrunken intervals [Direction, F(1, 30) = 7.670, p = 0.010]. There was a trend toward a Group by Change Direction interaction, F(1, 30) = 3.052, p = 0.091. Planned comparisons indicated larger negative amplitudes to expanded compared to shrunken intervals for Tone speakers (p = 0.003), but no difference for controls (p = 0.475). Further exploratory comparisons revealed that this effect was significant at frontocentral sites in the left and right hemisphere for Tone speakers, but was absent at all sites for the control group.
225–325 ms. In contrast to the previous epoch, amplitudes were more negative for shrunken than expanded intervals [Direction, F(1, 30) = 10.527, p = 0.003], and this effect was present in both groups (Tone, p = 0.039; controls, p = 0.021). No interaction of Group by Change Direction was observed in this window.
425–525 ms. Larger positive amplitudes to expanded than shrunken intervals were observed exclusively in Tone speakers [group × direction × laterality, F(1, 30) = 5.207, p = 0.030]. Planned comparisons revealed the presence of this effect in Tone speakers at medial prefrontal, frontal, central, and occipital sites. In contrast, no differences by direction of change were observed at any sites in the control group.
Discussion
Like Experiment 1, Experiment 2 shows strong support for a tone language advantage, this time in a more complex perceptual discrimination task. Behaviorally, native tone speakers were more accurate at detecting large changes in interval distance of 200 and 400 cents. In addition, Tone speakers elicited an earlier difference between interval change and no-change trials (125–225 ms) than controls (300–500), alluding to faster and more sensitive tone discrimination in speakers of a tone language. Similarly, the ERPs of Tone speakers showed a difference between expanded and shrunken intervals at an earlier (and later) stage of processing (75–175 ms) than the control group (225–325 ms).
General Discussion
In this study, native experience speaking a language in which pitch is used to express meaning determined how early the brain responded to differences in pitch for non-speech sounds, and was accompanied by enhanced performance (i.e., greater accuracy in discriminating sounds) on pitch and interval discrimination tasks relative to controls. Not only were native tone speakers more accurate at detecting changes in pitch height and interval distance at various increments, their ERPs demonstrated earlier effects of change vs. no-change, more focal processing of stimulus change, and earlier effects of change direction. These findings support an existing body of research demonstrating the impact of language experience on the way sound is processed in the brain, replicating previous reports of general pitch processing advantages observed in tone language speakers, while adding that these effects are driven by facilitation in the brain response to auditory stimuli at early stages of processing.
The current results demonstrate greater sensitivity to pitch height information in native tone speakers when compared to non-tone language speaking bilinguals, even when listeners were presented with level-contour tones that did not directly resemble linguistic tones used in Mandarin. This is consistent with the view that height and contour of pitch are evaluated separately during the perception of Mandarin lexical tones (Massaro et al., 1985) and coheres with previous findings that native tone-speaking experience leads to general enhancements in pitch processing that are not specific to linguistic input (Deutsch and Henthorn, 2004; Deutsch et al., 2006, 2009). Prior to this study, studies using similar paradigms did not show an advantage for tone language speakers for simple pitch discrimination (Bent et al., 2006; Pfordresher and Brown, 2009). There were some differences between this and prior studies. Whereas the composition of the control non-tone language group in the current study included bilingual speakers (English, plus another non-tonal language), participants in previous studies have primarily been monolingual (English only) speakers. It seems plausible that experience with more than one language can lead to improved performance on a pitch task based on the use of different pitch patterns across languages. For this reason we thought it was important to include a bilingual control group for the bilingual tone speaker group. However, improved performance based on being bilingual alone would have worked against our finding of a tone language advantage. On the contrary, the current results might be confounded by ethnicity, given that the tone language speakers were all of the same ethnicity, while the non-tone speakers were of different ethnic backgrounds. With our population samples we cannot separate out any role that genetics might play in our findings (c.f., Hove et al., 2010). Nevertheless, there is strong evidence that it is experience and not genetics that plays the more critical role in pitch processing (Crinion et al., 2009; Deutsch et al., 2009). Great care was taken to match the groups on all other characteristics6 (see Footnote 1). Finally, the number of trials in the current study was significantly more than those of the other studies, given that a large number of trials are needed for ERP analysis. However, there was no evidence of a practice or habituation effect comparing earlier and later trials in our data. Our results replicate the behavioral tone language advantage for interval discrimination previously reported by Pfordresher and Brown (2009), and suggest that this advantage is specific to larger interval sizes (200- and 400-cent change) for this more challenging perceptual discrimination task. Thus, we provide evidence for a robust advantage across both experiments.
Tone speakers also demonstrated greater sensitivity to the direction of pitch change than controls. On pitch discrimination trials, the hit rate of tone speakers was higher for downward than upward changes, particularly at the smallest change amounts (7 and 13 cents). Considering that falling tones occur with greater frequency than rising tones in Mandarin (e.g., Cheng, 1973), this difference may be due to Mandarin speakers’ greater experience detecting downward than upward changes in pitch. Thus the cross-domain influence between linguistic and non-linguistic tone processing is influenced by the specific characteristic of the sounds to which a listener is exposed. The same pattern was observed in the ERPs of tone speakers (Figure 4), which differentiated downward from upward pitch changes at earlier stages of processing (200–400 ms) than controls (600–800 ms). Although change direction effects were not apparent behaviorally on interval discrimination trials, the more sensitive ERP measures showed earlier and more robust differentiation between expanded and shrunken intervals for tone speakers compared to controls (Figure 7).
On the surface, the fact that Mandarin speakers were more sensitive to pitch direction in the current study is similar to previous findings reported by Bent et al. (2006). In that study, Mandarin speakers processed rising and falling non-speech contours differently in an identification task, whereas English speakers were more comparable in their performance across contours. However, unlike the current study, Mandarin speakers in Bent et al. differed only with respect to response bias, not sensitivity, and group differences in that study were only found for non-speech analogs of Mandarin tones (i.e., dynamically changing tones). Bent et al. concluded that linguistic background shapes categorization, but not perception, of auditory signals that resemble speech sounds. The present results have much different implications in that they suggest differences across groups with respect to sensitivity that extend to auditory patterns bearing little resemblance to speech. Moreover, our ERP results indicate that these differences across groups appear early and are related to both perceptual (exogenous, stimulus-driven components such as N1) and categorization (P300) processes. We suspect that both findings fill in part of the continuum from speech to non-speech processing referred to by Bent et al. whereas effects related to response bias may be found for more speech-like analogs, effects related to sensitivity may appear in materials that less resemble speech. Moreover, as mentioned above, effects related to sensitivity as found here may require greater statistical power, and more balanced selection of control participants, to detect.
The effect of change (change minus no-change collapsing across pitch change amount) showed early group differences in brain activity at the P50 component, with pitch changes eliciting a larger frontocentral positivity for tone speakers at around 50–100 ms compared to controls (Figure 3B), consistent with the distribution of the auditory P50 (e.g., Potts et al., 1998; Korzyukov et al., 2007). Guterman et al. (1992) found that focusing participants’ attention on the second click of a click pair increased the P50 amplitude elicited by that click, suggesting that the P50 reflects enhancements in early stimulus processing. This is supported by similar findings of stimulus expectancy and attention effects occurring as early as the P50 (Guterman and Josiassen, 1994; Clementz et al., 2002). The P50 appears to be generated by separate sources in the frontal and temporal lobes (Potts et al., 1998; Grunwald et al., 2003; Korzyukov et al., 2007), where the frontal generator collects and retains information from the temporal lobe generator about the physical parameters of the auditory stimulus (Korzyukov et al., 2007). In light of these findings, the larger P50 amplitudes observed here for tone speakers may suggest that their native experience with a tonal language allows them to extract more information from the auditory stream, in this case information about pitch height. This interpretation is consistent with findings that tone speakers show enhanced processing of pitch in the brainstem (Krishnan et al., 2005, 2009; Swaminathan et al., 2008). In the interval task, although collapsing across interval change amount did not reveal a P50 effect in either group, tone speakers still showed an earlier effect of change than controls indexed by a larger N1-like component (Figure 6). Given the greater complexity of the interval discrimination judgments, it is possible that tone speakers’ auditory processing advantage is noticeable only at a later cortical stage of processing relative to the simpler pitch discrimination task. We should note that there was evidence of a reduction in the brain response to pitch change in tone speakers at the P300, but this was not replicated in the interval task. Diminished P300 amplitudes in tone speakers may reflect a less resource-intensive category judgment of change or no-change for each pitch, due to pitch discrimination involving more automated processing than in controls (Linding et al., 2003).
Conclusion
To our knowledge, this study is the first to demonstrate a tone language pitch processing advantage with simple tones, where accurate performance depends solely upon sensitivity to pitch height information. Utilizing the temporal precision of ERPs, we provide evidence that the tone language advantage observed on the pitch and interval discrimination tasks was due to an enhancement of early sensory processes, indexed by larger P50 amplitudes to pitch changes and larger N1 amplitudes to the more complex interval changes. Together these findings clearly show that language experience can have a significant impact on an individual’s ability to process non-linguistic information, reflecting the subtle but robust cross-domain influence between language and general perception. Native experience with a tone language involves attending to the pitch of spoken syllables in daily language use from an early age, and this experience appears to enhance the brain’s cortical representation of pitch relative to speakers of a non-tone language.
Conflict of Interest Statement
The authors declare that the research was conducted in the absence of any commercial or financial relationships that could be construed as a potential conflict of interest.
Acknowledgments
This research was supported by a San Antonio Life Sciences Institute grant #121075, the University of Texas at San Antonio (UTSA) College of Science (Nicole Y. Y. Wicha), and the UTSA Computational Biology Initiative. Nicole Y. Y. Wicha and Ryan J. Giuliano were supported by NICHD/NIGMS HD060435. Peter Q. Pfordresher was supported by NSF grant #BCS-0642592.
Footnotes
- ^Fifty-six individuals took part in this study, however in order to closely match the groups, several participants were excluded from data analysis. Four participants were outliers in age (>40 years old), 3 were native speakers of Vietnamese, and 16 others were excluded for an insufficient number of artifact-free trials with correct responses (13), not completing the session (2), or failing the hearing test (1). Two participants in each group did not perform the hearing test due to a technical error, however their performance on the discrimination task was less than one standard deviation from the appropriate group mean, indicating that they had no trouble hearing the stimuli. Note that there is currently no evidence suggesting that hearing sensitivity among normal-hearing populations influences the ability to discriminate pitches (Ayotte et al., 2002).
- ^Seven people from the control group took part in a parallel fMRI version of this study prior to the ERP session. The time between sessions was on average 20 days. Note that practice effects would be expected to improve performance, yet the control group still underperformed the Tone group in accurately detecting change trials.
- ^Although years of experience is an incomplete way of characterizing acquired musical ability, a lack of a more valid assessment tool for musical experience has lead researchers in music cognition to routinely use years of training as an indicator of musician/non-musician status (e.g., Bigand and Poulin-Charronnat, 2006).
- ^Both groups also showed a sustained frontocentral negativity peaking around 500 ms then returning sharply to baseline. Since the task involved a delayed-response upon appearance of a visual cue 500 ms after the target tone, this negativity is likely a contingent negative variation (CNV) reflecting response preparation processes (e.g., Walter et al., 1964; Tecce, 1972; Bender et al., 2004), or an offset potential (Rohrbaugh et al., 1979; Goydke et al., 2004) similar to those observed in auditory studies not requiring a response, though the latter tends to be larger toward the vertex (Picton et al., 1977).
- ^The sample for Experiment 2 included all participants from Experiment 1, however a single participant was excluded from the Tone group for an insufficient number of artifact-free trials in Experiment 2. The exclusion of this participant did not significant impact the group matching on music experience, age, education, and other variables.
- ^To rule out the possibility that the current results were influenced by musical experience, years of musical training3 was entered as a covariate on ANOVAs of both behavioral and ERP data. For behavioral and ERP analyses in both experiments, there were no main effects of music experience (all p’s > 0.63), nor significant interactions with pitch change (all p’s > 0.71) or change direction (all p’s > 0.23) in any of the time windows analyzed.
References
Ayotte, J., Peretz, I., and Hyde, K. (2002). A group study of adults afflicted with a music-specific disorder. Brain 125, 238–251.
Bender, S., Resch, F., Weisbrod, M., and Oelkers-Ax, R. (2004). Specific task anticipation versus unspecific orienting reaction during early contingent negative variation. Clin. Neurophysiol. 115, 1836–1845.
Bent, T., Bradlow, A. R., and Wright, B. A. (2006). The influence of linguistic experience on the cognitive processing of pitch in speech and nonspeech sounds. J. Exp. Psychol. Hum. Percep. Perform. 32, 97–103.
Bigand, E., and Poulin-Charronnat, B. (2006). Are we “experienced listeners?” A review of the musical capacities that do not depend on formal musical training. Cognition 100, 100–130.
Bosnyak, D. J., Eaton, R. A., and Roberts, L. E. (2004). Distributed auditory cortical representations are modified when non-musicians are trained at pitch discrimination with 40Hz amplitude modulated tones. Cereb. Cortex 14, 1088–1099.
Bregman, A. S., Liao, C., and Levitan, R. (1990). Auditory grouping based on fundamental-frequency and formant peak frequency. Can. J. Psychol. 44, 400–413.
Burns, E. M., and Sampat, K. S. (1980). A note on possible culture-bound effects in frequency discrimination. J. Acoust. Soc. Am. 68, 1886–1888.
Chandrasekaran, B., Krishnan, A., and Gandour, J. T. (2007a). Experience-dependent neural plasticity is sensitive to shape of pitch contours. Neuroreport 18, 1963–1967.
Chandrasekaran, B., Krishnan, A., and Gandour, J. T. (2007b). Mismatch negativity to pitch contours is influenced by language experience. Brain Res. 1128, 148–156.
Chandrasekaran, B., Krishnan, A., and Gandour, J. T. (2009). Relative influence of musical and linguistic experience on early cortical processing of pitch contours. Brain Lang. 108, 1–9.
Clementz, B. A., Barber, S. K., and Dzau, J. R. (2002). Knowledge of stimulus repetition affects the magnitude and spatial distribution of low-frequency event-related brain potentials. Audiol. Neurootol. 7, 303–314.
Crinion, J. T., Green, D. W., Chung, R., Ali, N., Grogan, A., Price, G. R., Mechelli, A., and Price, C. J. (2009). Neuroanatomical markers of speaking Chinese. Hum. Brain Mapp. 30, 4108–4115.
Deutsch, D., Dooley, K., Henthorn, T., and Head, B. (2009). Absolute pitch among students in an American music conservatory: association with tone language fluency. J. Acoust. Soc. Am. 125, 2398–2403.
Deutsch, D., and Henthorn, T. (2004). Absolute pitch, speech, and tone language: some experiments and a proposed framework. Music Percept. 21, 339–356.
Deutsch, D., Henthorn, T., Marvin, E., and Xu, H. (2006). Absolute pitch among American and Chinese conservatory students: prevalence differences, and evidence for a speech-related critical period. J. Acoust. Soc. Am. 119, 719–722.
Giuliano, R. J., and Wicha, N. Y. Y. (2010). Why the white bear is still there: Electrophysiological evidence for ironic semantic activation during thought suppression. Brain Res. 1316, 62–74.
Goydke, K.N., Altenmuller, E., Moller, J., and Munte, T. F. (2004). Changes in emotional tone and instrumental timbre are reflected by the mismatch negativity. Cogn. Brain Res. 21, 351–359.
Grunwald, T., Boutros, N. N., Pezer, N., von Oertzen, J., Fernandez, G., Schaller, C., and Elger, C. E. (2003). Neuronal substrates of sensory gating within the human brain. Biol. Psychiatry 53, 511–519.
Gussenhoven, C. (2004). The Phonology of Tone and Intonation. Cambridge: Cambridge University Press.
Guterman, Y., and Josiassen, R. C. (1994). Sensory gating deviance in schizophrenia in the context of task-related effects. Int. J. Psychophysiol. 18, 1–12.
Guterman, Y., Josiassen, R. C., and Bashore, T. R. (1992). Attentional influence on the P50 component of the auditory event-related brain potential. Int. J. Psychophysiol. 12, 197–209.
Hove, M. J., Sutherland, M. E., and Krumhansl, C. L. (2010). Ethnicity effects in relative pitch. Psychon. Bull. Rev. 17, 310–316.
Kaan, E., Barkley, C. M., Bao, M., and Wayland, R. (2008). Thai lexical tone perception in native speakers of Thai, English and Mandarin Chinese: an event-related potentials training study. BMC Neurosci. 9, 1–17. doi: 10.1186/1471-2202-9-53
Kaan, E., Wayland, R., Bao, M. Z., and Barkley, C. M. (2007). Effects of native language and training on lexical tone perception: an event-related potential study. Brain Res. 1148, 113–122.
Korzyukov, O., Pflieger, M. E., Wagner, M., Bowyer, S. M., Rosburg, T., Sundaresan, K., Elger, C. E., and Boutros, N. N. (2007). Generators of the intracranial P50 response in auditory sensory gating. Neuroimage 35, 814–826.
Kraus, N., Mcgee, T., Carrell, T. D., King, C., Tremblay, K., and Nicol, T. (1995). Central auditory-system plasticity associated with speech-discrimination training. J. Cogn. Neurosci. 7, 25–32.
Krishnan, A., Swaminathan, J., and Gandour, J. T. (2009). Experience-dependent enhancement of linguistic pitch representation in the brainstem is not specific to a speech context. J. Cogn. Neurosci. 21, 1092–1105.
Krishnan, A., Xu, Y. S., Gandour, J., and Cariani, P. (2005). Encoding of pitch in the human brainstem is sensitive to language experience. Cogn. Brain Res. 25, 161–168.
Lee, Y. S., Vakoch, D. A., and Wurm, L. H. (1996). Tone perception in Cantonese and Mandarin: a cross-linguistic comparison. J. Psycholinguist. Res. 25, 527–542.
Liberman, A. M., Cooper, F. S., Shankweiler, D. P., and Studdert-Kennedy, M. (1967). Perception of the speech code. Psychol. Rev. 74, 431–461.
Liberman, A. M., and Mattingly, I. G. (1985). The motor theory of speech-perception revised. Cognition 21, 1–36.
Liberman, A. M., and Mattingly, I. G. (1989). A specialization for speech-perception. Science 243, 489–494.
Liberman, A. M., and Whalen, D. H. (2000). On the relation of speech to language. Trends Cogn. Sci. 4, 187–196.
Linding, M., Zurron, M., and Diaz, F. (2003). Changes in P300 amplitude during an active standard auditory oddball task. Biol. Psychol. 66, 153–167.
Massaro, D. W., Cohen, M. M., and Tseng, C. Y. (1985). The evaluation and integration of pitch height and pitch contour in lexical tone perception in Mandarin Chinese. J. Chin. Linguist. 13, 267–290.
Nan, Y., Sun, Y., and Peretz, I. (2010). Congenital amusia in speakers of a tone language: association with lexical tone agnosia. Brain 133, 2635–2642.
Peretz, I., Brattico, E., and Tervaniemi, M. (2005). Abnormal electrical brain responses to pitch in congenital amusia. Ann. Neurol. 58, 478–482.
Pfordresher, P. Q., and Brown, S. (2007). Poor-pitch singing in the absence of “tone deafness”. Music Percept. 25, 95–115.
Pfordresher, P. Q., and Brown, S. (2009). Enhanced production and perception of musical pitch in tone language speakers. Atten. Percept. Psychophys. 71, 1385–1398.
Picton, T. W., Woods, D. L., Baribeaubraun, J., and Healey, T. M. G. (1977). Evoked-potential audiometry. J. Otolaryngol. 6, 90–119.
Potts, G. F., Dien, J., Hartry-Speiser, A. L., McDougal, L. M., and Tucker, D. M. (1998). Dense sensor array topography of the event-related potential to task-relevant auditory stimuli. Electroencephalogr. Clin. Neurophysiol. 106, 444–456.
Rohrbaugh, J. W., Syndulko, K., and Lindsley, D. B. (1979). Cortical slow negative waves following non-paired stimuli: effects of modality, intensity and rate of stimulation. Electroencephalogr. Clin. Neurophysiol. 46, 416–427.
Schellenberg, E. G., and Trehub, S. E. (2008). Is there an Asian advantage for pitch memory? Music Percept. 25, 241–252.
Stagray, J. R., and Downs, D. (1993). Differential sensitivity for frequency among speakers of a tone and a nontone language. J. Chin. Linguist. 21, 143–163.
Swaminathan, J., Krishnan, A., and Gandour, J. T. (2008). Pitch encoding in speech and nonspeech contexts in the human auditory brainstem. Neuroreport 19, 1163–1167.
Tecce, J. J. (1972). Contingent negative variation (CNV) and psychological processes in man. Psychol. Bull. 77, 73–108.
Tervaniemi, M., Just, V., Koelsch, S., Widmann, A., and Schroger, E. (2005). Pitch discrimination accuracy in musicians vs. nonmusicians: an event-related potential and behavioral study. Exp. Brain Res. 161, 1–10.
Trehub, S. E., Schellenberg, E. G., and Nakata, T. (2008). Cross-cultural perspectives on pitch memory. J. Exp. Child. Psychol. 100, 40–52.
Tremblay, K., Kraus, N., Carrell, T. D., and McGee, T. (1997). Central auditory system plasticity: generalization to novel stimuli following listening training. J. Acoust. Soc. Am. 102, 3762–3773.
Waldo, M. C., and Freedman, R. (1986). Gating of auditory evoked-responses in normal college-students. Psychiatry Res. 19, 233–239.
Walter, W. G., Cooper, R., Aldridge, V. J., McCallum, W. C., and Winter, A. L. (1964). Contingent negative variation: an electric sign of sensorimotor association and expectancy in the human brain. Nature 203, 380–384.
Wong, P. C. M., Skoe, E., Russo, N. M., Dees, T., and Kraus, N. (2007). Musical experience shapes human brainstem encoding of linguistic pitch patterns. Nat. Neurosci. 10, 420–422.
Keywords: pitch discrimination, pitch interval discrimination, event related potentials, tone language, auditory perception, auditory cognitive neuroscience, mandarin chinese, neural plasticity
Citation: Giuliano RJ, Pfordresher PQ, Stanley EM, Narayana S and Wicha NYY (2011) Native experience with a tone language enhances pitch discrimination and the timing of neural responses to pitch change. Front. Psychology 2:146. doi: 10.3389/fpsyg.2011.00146
Received: 16 February 2011;
Accepted: 16 June 2011;
Published online: 03 August 2011.
Edited by:
Lutz Jäncke, University of Zurich, SwitzerlandReviewed by:
Martin Meyer, University of Zurich, SwitzerlandPsyche Loui, Beth Israel Deaconess Medical Center/Harvard Medical School, USA
Stefan Andreas Elmer, University of Zurich, Zurich, Switzerland
Copyright: © 2011 Giuliano, Pfordresher, Stanley, Narayana and Wicha. This is an open-access article subject to a non-exclusive license between the authors and Frontiers Media SA, which permits use, distribution and reproduction in other forums, provided the original authors and source are credited and other Frontiers conditions are complied with.
*Correspondence: Nicole Y. Y. Wicha, Department of Biology – University of Texas at San Antonio, One UTSA Circle, San Antonio, TX 78249, USA. e-mail: Nicole.Wicha@UTSA.edu