 Yue Zhang1†
 Lulu Zhang2†Haoqiang Hua1Jianxiu Jin1Lingqing Zhu1
 Lin Shu1*
 Xiangmin Xu1,3Feng Kuang1Yunhe Liu1
- 1School of Electronic and Information Engineering, South China University of Technology, Guangzhou, China
- 2Department of Psychiatry, Guangzhou First People’s Hospital, The Second Affiliated Hospital, South China University of Technology, Guangzhou, China
- 3Zhongshan Institute of Modern Industrial Technology of South China University of Technology, Zhongshan, China
Increasing social pressure enhances the psychological burden on individuals, and the severity of depression can no longer be ignored. The characteristics of high immersion and interactivity enhance virtual reality (VR) application in psychological therapy. Many studies have verified the effectiveness of VR relaxation therapy, although a few have performed a quantitative study on relaxation state (R-state). To confirm the effectiveness of VR relaxation and quantitatively assess relaxation, this study confirmed the effectiveness of the VR sightseeing relaxation scenes using subjective emotion scale and objective electroencephalogram (EEG) data from college students. Moreover, some EEG features with significant consistent differences after they watched the VR scenes were detected including the energy ratio of the alpha wave, gamma wave, and differential asymmetry. An R-state regression model was then built using the model stacking method for optimization, of which random forest regression, AdaBoost, gradient boosting (GB), and light GB were adopted as the first level, while linear regression and support vector machine were applied at the second level. The leave-one-subject-out method for cross-validation was used to evaluate the results, where the mean accuracy of the framework achieved 81.46%. The significantly changed features and the R-state model with over 80% accuracy have laid a foundation for further research on relaxation interaction systems. Moreover, the VR relaxation therapy was applied to the clinical treatment of patients with depression and achieved preliminary good results, which might provide a possible method for non-drug treatment of patients with depression.
Introduction
The rapidly developing society enhances pressure on individuals, while mental health problems are getting increasingly critical. By the end of 2020, mental health problems became the second most critical disease worldwide (Randy et al., 2019). Statistics from the World Health Organization in 2020 showed that more than 300 million individuals were suffering from depression, with over 80% not receiving appropriate treatment (WHO, 2020). Patients with mental disorders have a profound negative impact on their personal development, bringing burdens to their families and society (Sidra et al., 2013). Since many studies have confirmed that relaxation could relieve depression (DeBerry, 1982; Lolak et al., 2008), it is highly important to effectively reduce stress and relax.
The current primary methods to relax include deep respiration (Ilse et al., 2014), muscular relaxation (Wesley and Douglas, 1977), music relaxation (Claas et al., 2008; Olga et al., 2011), meditation (Lazar et al., 2000; Narendra et al., 2017), and autogenic training (Ernst and Kanji, 2000). These methods were easily subject to the environment and devices.
The advantages of free space, high immersion, and interactivity have enhanced virtual reality (VR) application in psychological therapy with its rapid development, thus achieving good results (Imran et al., 2014; Allison et al., 2017). Nevertheless, most of these VR scenes are static in nature without scene transitions (Andersen et al., 2017; Kiefl et al., 2018), which might cause boredom and affect the relaxation effect. Moreover, current studies have only made a subjective and qualitative evaluation (Freeman et al., 2017; Linda et al., 2020).
Subjective scales and physiological parameters are generally used to assess the relaxation degree, where the former refers to Perceived Stress Scale (Cohen et al., 1983) and State-trait Anxiety Inventory (Theresa and Hilary, 1992), and the latter includes electroencephalogram (EEG) (Knott et al., 1997; Xing et al., 2019), heart rate variability (Patil and Shirley, 2006; Shu et al., 2020), galvanic skin response (Alexandros et al., 2015), and respiration (Joseph et al., 2016). EEG can relevantly reflect people’s emotional state more accurately among the physiological parameters (Soraia and Manuel, 2019) since emotion is a natural product of neural activity in the brain. Consequently, EEG would be an ideal parameter for measuring relaxation state (R-state), and frontal EEG is considered as the first choice considering its simple operation.
Relevant studies have proved that different frequencies of brain electricity reflect different brain states (Hou et al., 2020), in which alpha, theta, and gamma waves show stronger relevance with R-state. Cahn and Delorme found that the long-term training of Vipassana meditation could increase gamma power (Baruch et al., 2016). Du and Lee observed that low-frequency alpha waves in the left frontal lobe while high-frequency alpha waves in the right frontal lobe increased significantly during positive emotional audio stimulation, where the experimental materials were from the standard International Affective Digital Sounds dataset (Du and Lee, 2015). However, there is a lack of EEG-based relaxation regression models under a VR environment as well as an effective VR relaxation system.
To explore the relaxation effect of VR scenes and the correlation between R-state and frontal EEG, VR relaxation scenes were used as emotion-evoked materials in this study, and a relaxation rating model was established based on EEG data. The VR relaxation scenes and R-state model were then used on patients with depression to explore the possibility of VR relaxation therapy for depression. The study is organized as follows. Section “Materials and Methods” introduces the methods of relaxation VR scene design, data collecting, and model building. Section “Results” shows the results of the analysis of EEG data and the effect of the relaxation model. Section “Application” introduces the application of the research. Section “Discussion” and section “Conclusion” present the discussion and conclusion, respectively.
Materials and Methods
Design of Virtual Reality Relaxation Scenes
Four sightseeing-relaxation VR scenes were selected as experimental materials including National Park, Snow Mountain, the Great Wall, and Yunnan. Western classical and new age music were chosen, as background music since O’Sullivan’s research had proved that relaxation music was mainly soft music composed of slow rhythm, low pitch, low volume, beautiful melody, and orchestral instruments (O’Sullivan, 1991), which were copyright free and had been evaluated (Zhu et al., 2019). The selected background music was absolute music without lyrics to avoid cognitive and cultural differences. The description of the scenes and music is shown in Table 1.
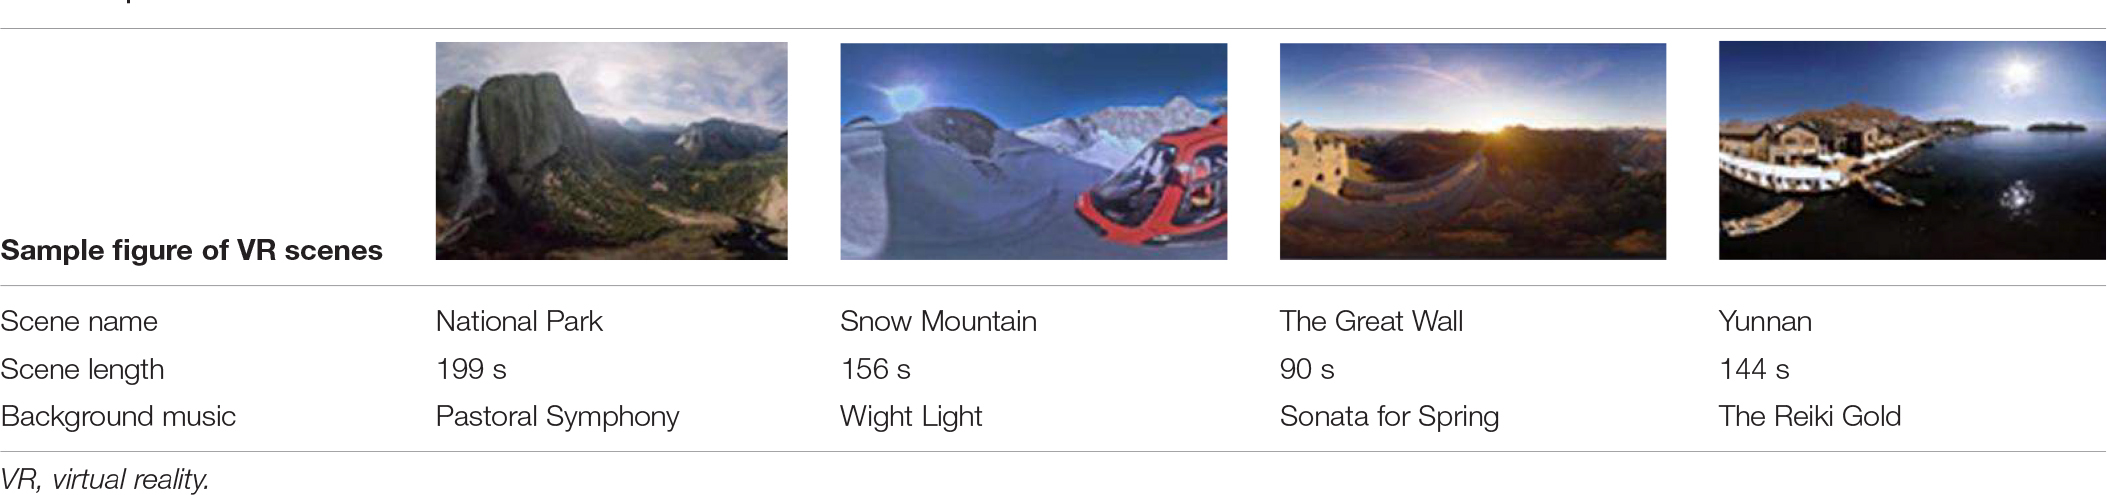
Table 1. Selected VR relaxation scenes.
The design process of VR relaxation scenes is illustrated in Figure 1. Appropriate VR scenes and background music were chosen and combined to get visual and auditory fusion materials. EEG was collected during the whole period of watching the VR scene, after which a subjective scale was completed. A designed relaxation VR scene was officially completed when it was verified to achieve an ideal relaxation effect through subjective scale and EEG data evaluation.
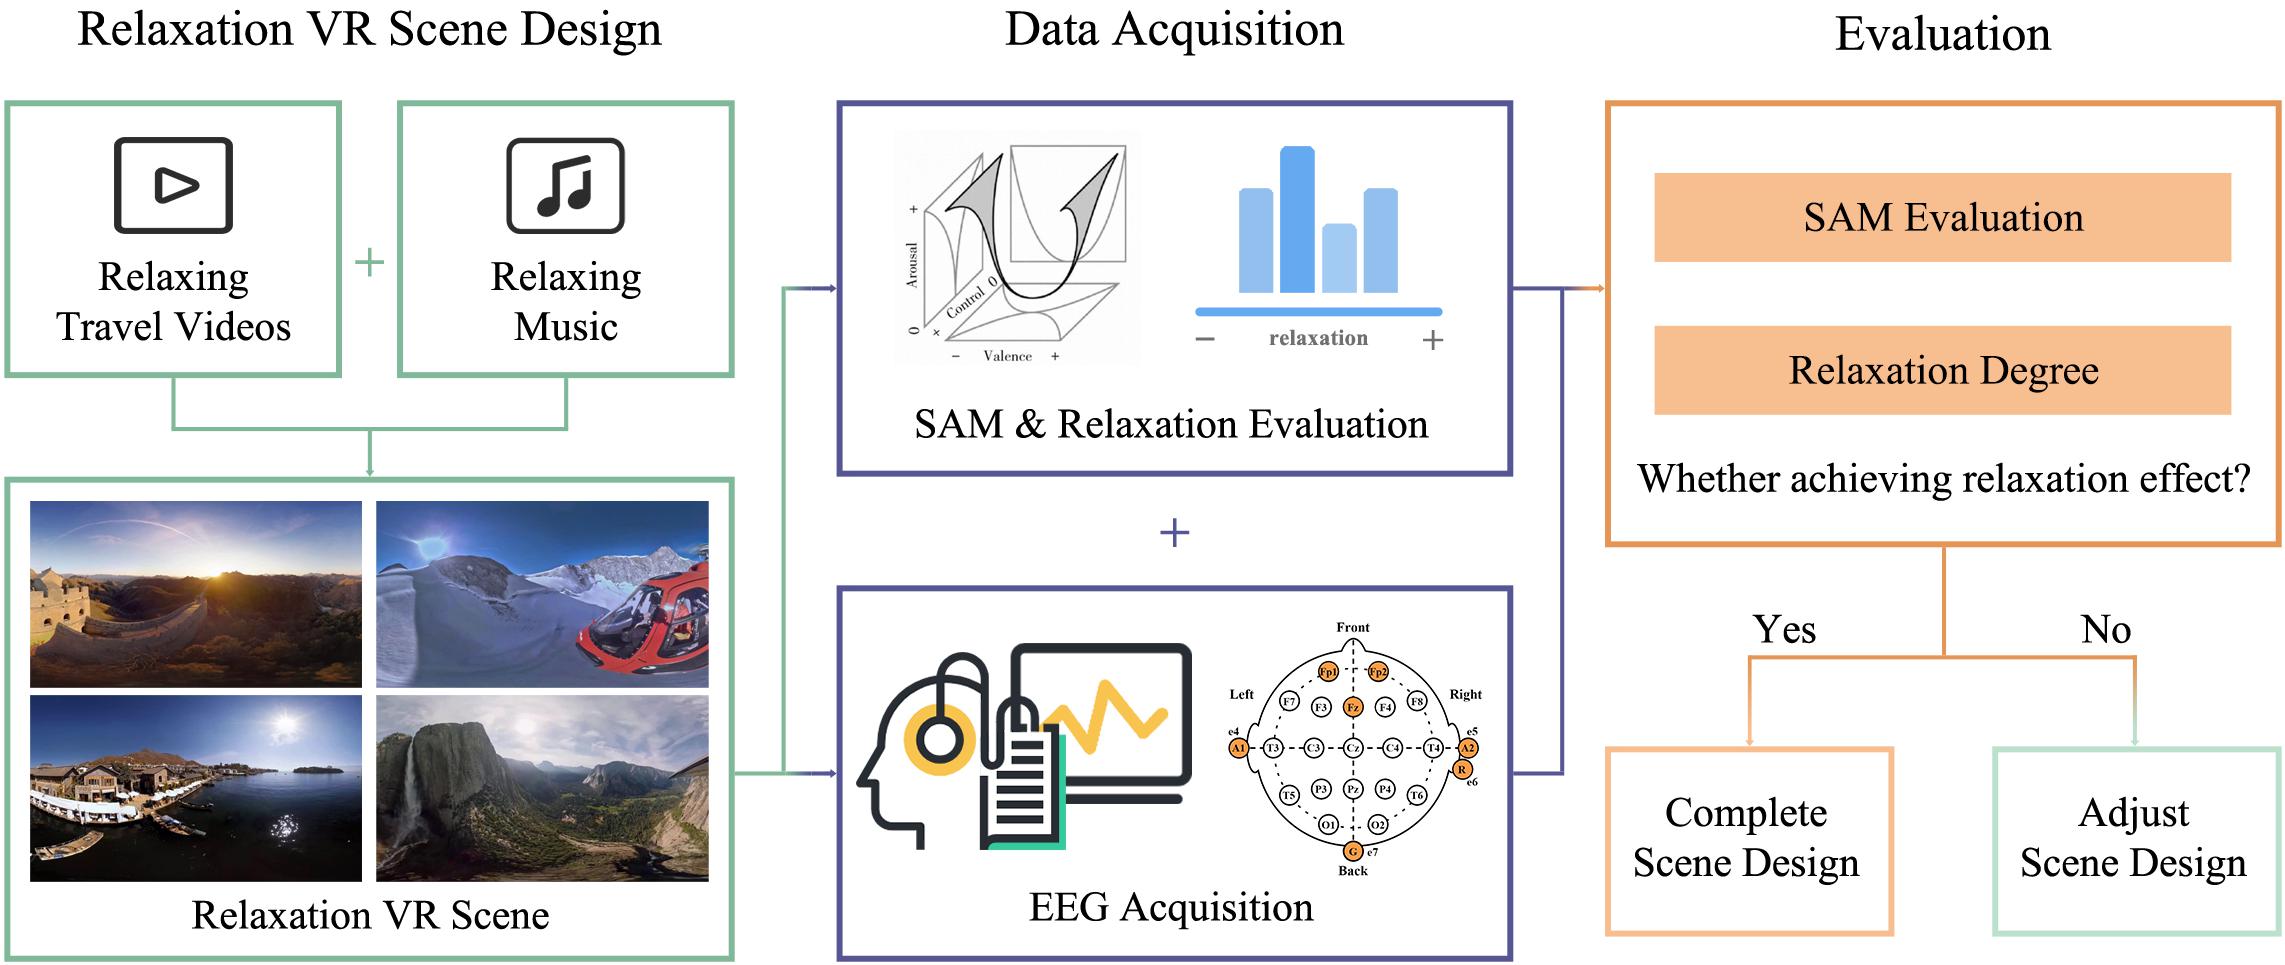
Figure 1. Design process of virtual reality relaxation scenes.
Methods of R-State Evaluation
The forehead prefrontal EEG electrodes of FP1, FP2, and FPZ were chosen to acquire EEG signals for analyzing the relaxation degree of the participants, since the forehead region of the brain was found to be most associated with emotions (Suranjita and Rajesh, 2019).
Furthermore, subjective emotion scale Self-Assessment Manikin (SAM) and R-state were used as subjective emotion labels. SAM was based on the valence–arousal–dominance emotion model, which assessed emotion state through three indices. Each score of the three indices ranged from 1 to 9. A higher score indicated a more intense emotion state (higher valence, arousal, and dominance) (Bradley and Lang, 1994; Shu et al., 2018). R-state was based on the R-state pyramid theory proposed by Smith (2005). To keep the grading uniform, the value of the R-state also ranged from 1 to 9. A value of R-state greater than five indicated relaxation, and the numbers 5–9 corresponded to the five levels of R-state, as shown in Figure 2 (value 5 of R-state corresponded to level 1 of stress relief). The higher the score, the more relaxed the participant was.
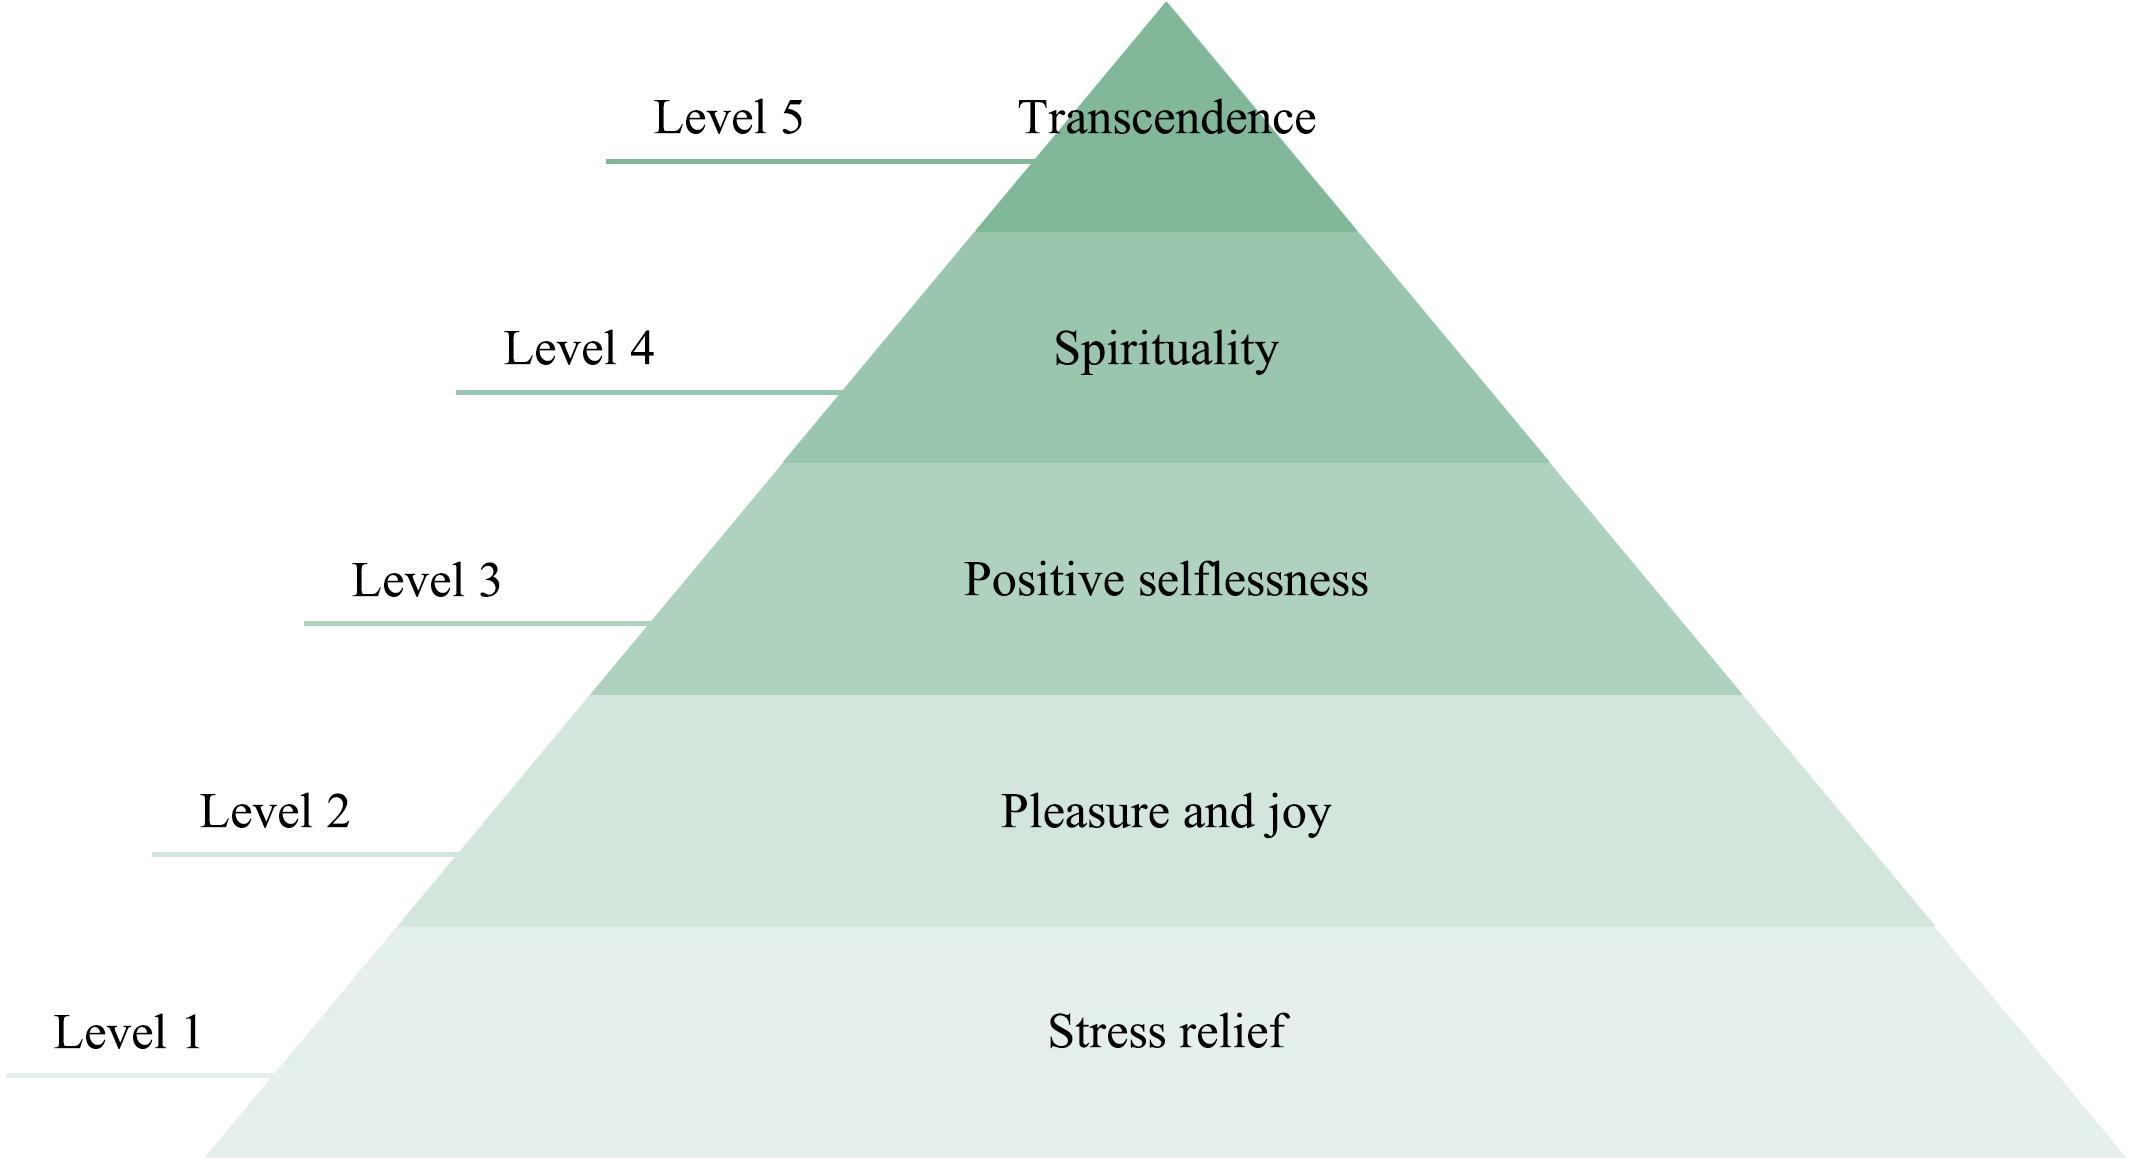
Figure 2. R-state pyramid.
Participants and Experimental Procedure
Thirty-three healthy college students (age ranging from 20 to 26 years) including 19 men and 14 women participated in the experiment, with data of only 30 participants valid (16 men and 14 women) for the reason that there were three participants whose EEG data were not fully collected due to the instability of electrode–scalp interface of the EEG collection device. The experiment was conducted in a 30-dB closed soundproof room (Hengqi, Dongguan, China), with experimental equipment, two comfortable chairs, and a table. A pre-training was conducted to make the participants familiar with the experimental steps and SAM scale evaluation method. The procedure of the experiment is shown in Figure 3. After offering personal information and wearing VR glasses together with the EEG acquisition device, participants needed to rest for 2 min with a black screen insight, before and after watching each relaxation scene, the duration of which lasted 90–199 s. Each participant was asked to randomly watch three of the four scenes. The participants were asked to keep their eyes open during the whole experiment to control the variables. The experiment procedure was based on other relevant studies (Zhu et al., 2019). The experimental procedures were approved by the Guangzhou First People’s Hospital (202002030262, on April 1, 2020).
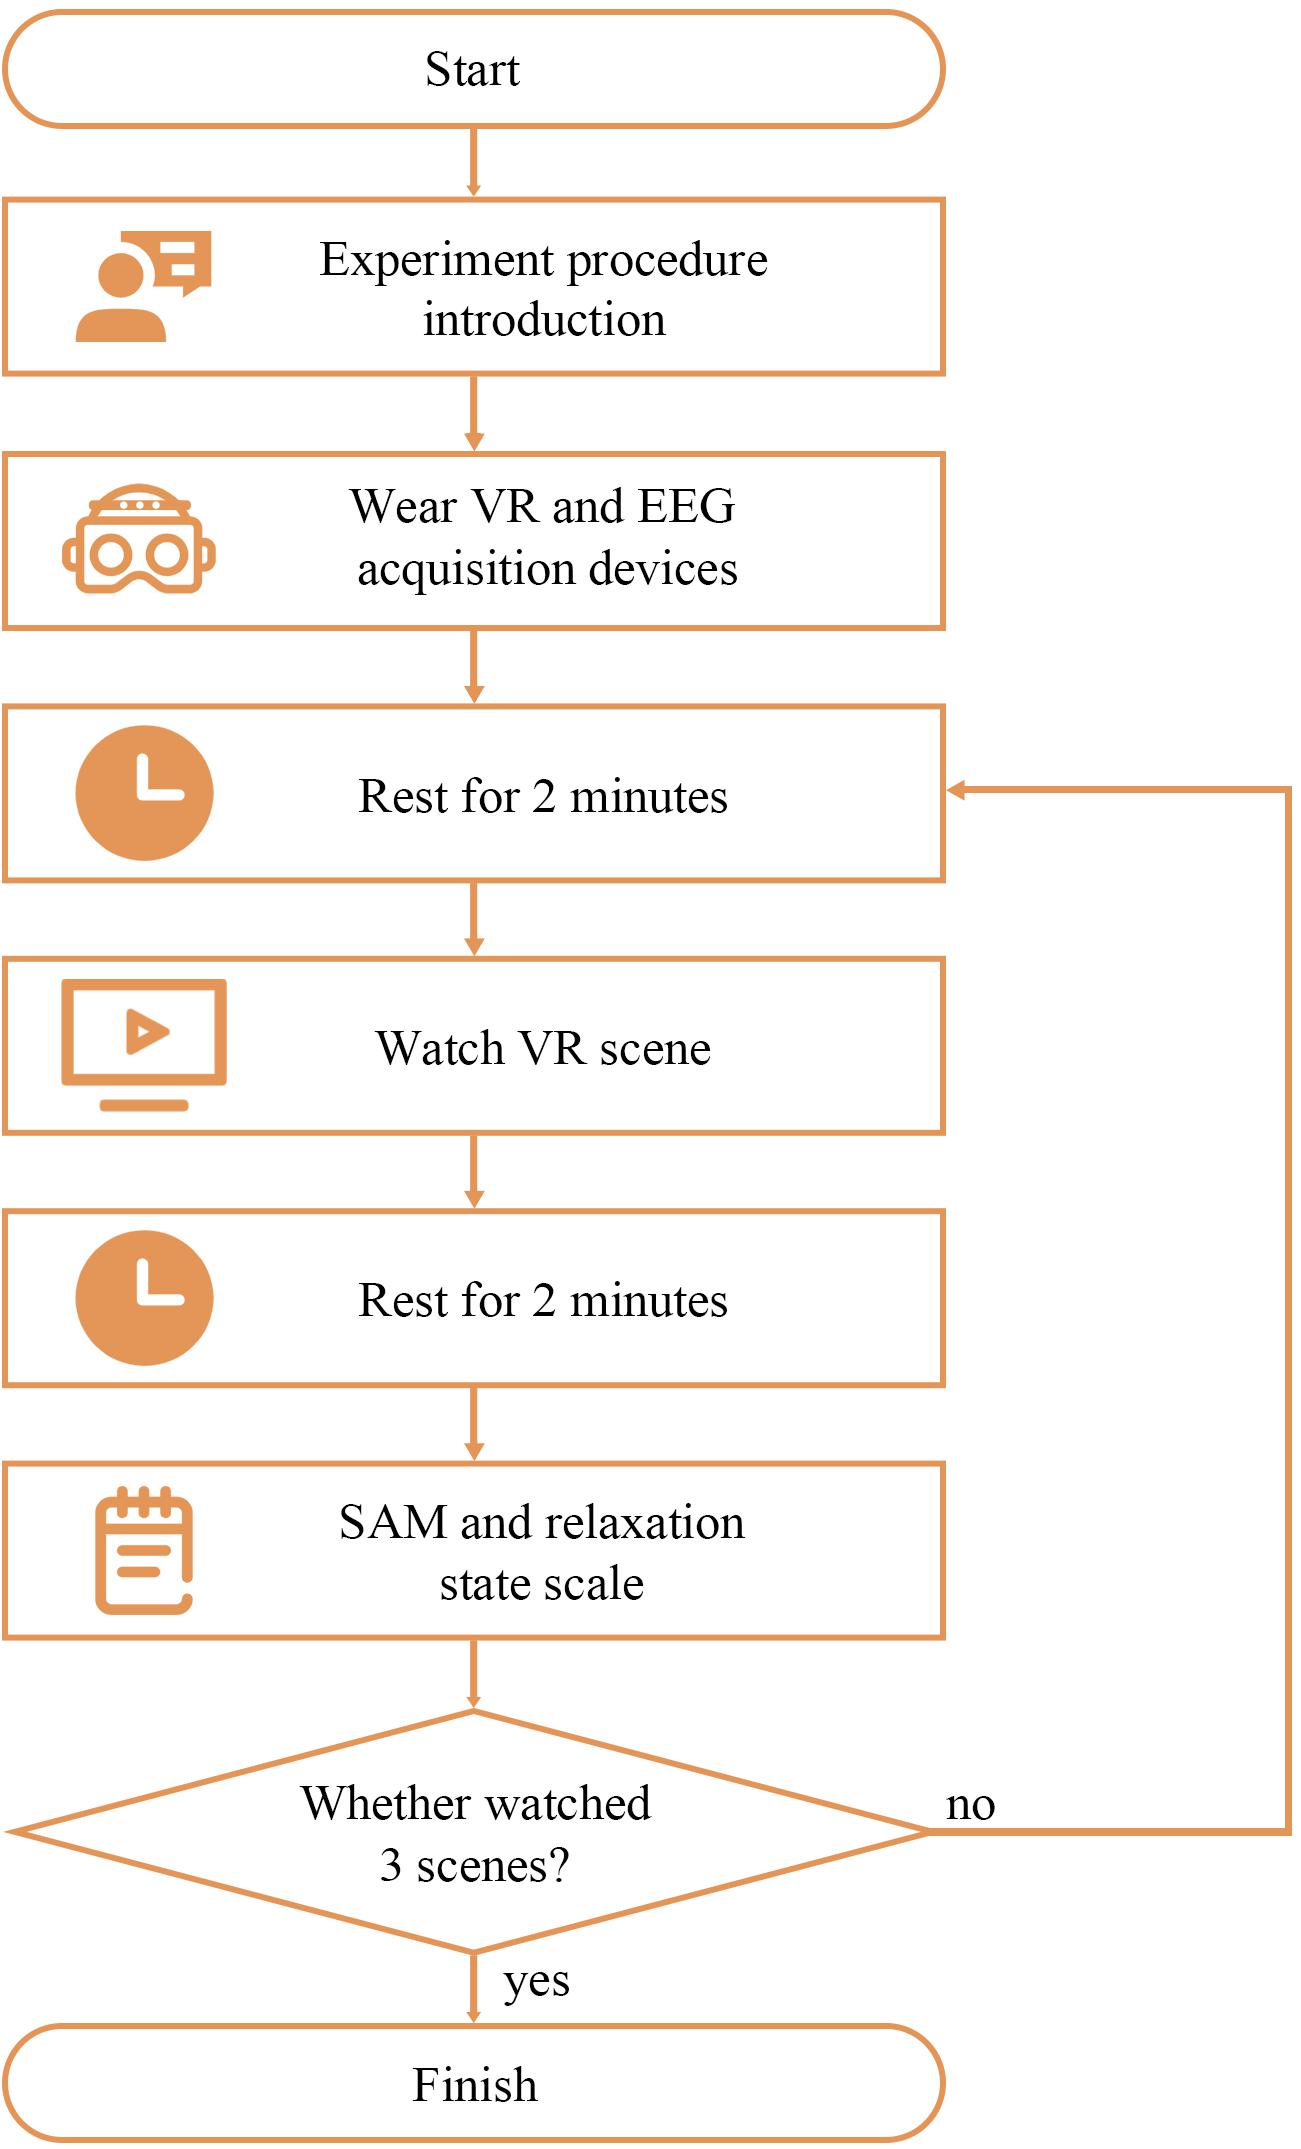
Figure 3. Experimental procedure.
The VR scenes were watched by HTC Vive, and the EEG acquisition device was a Mangold-10 multichannel physiological instrument with an acquisition frequency of 256 Hz. Figure 4 shows the experimental equipment and the data collection settings for the participants. Three flexible EEG electrodes were embedded in the sponge of the VR device to collect forehead EEG data. The subjective scale was finished after each scene.
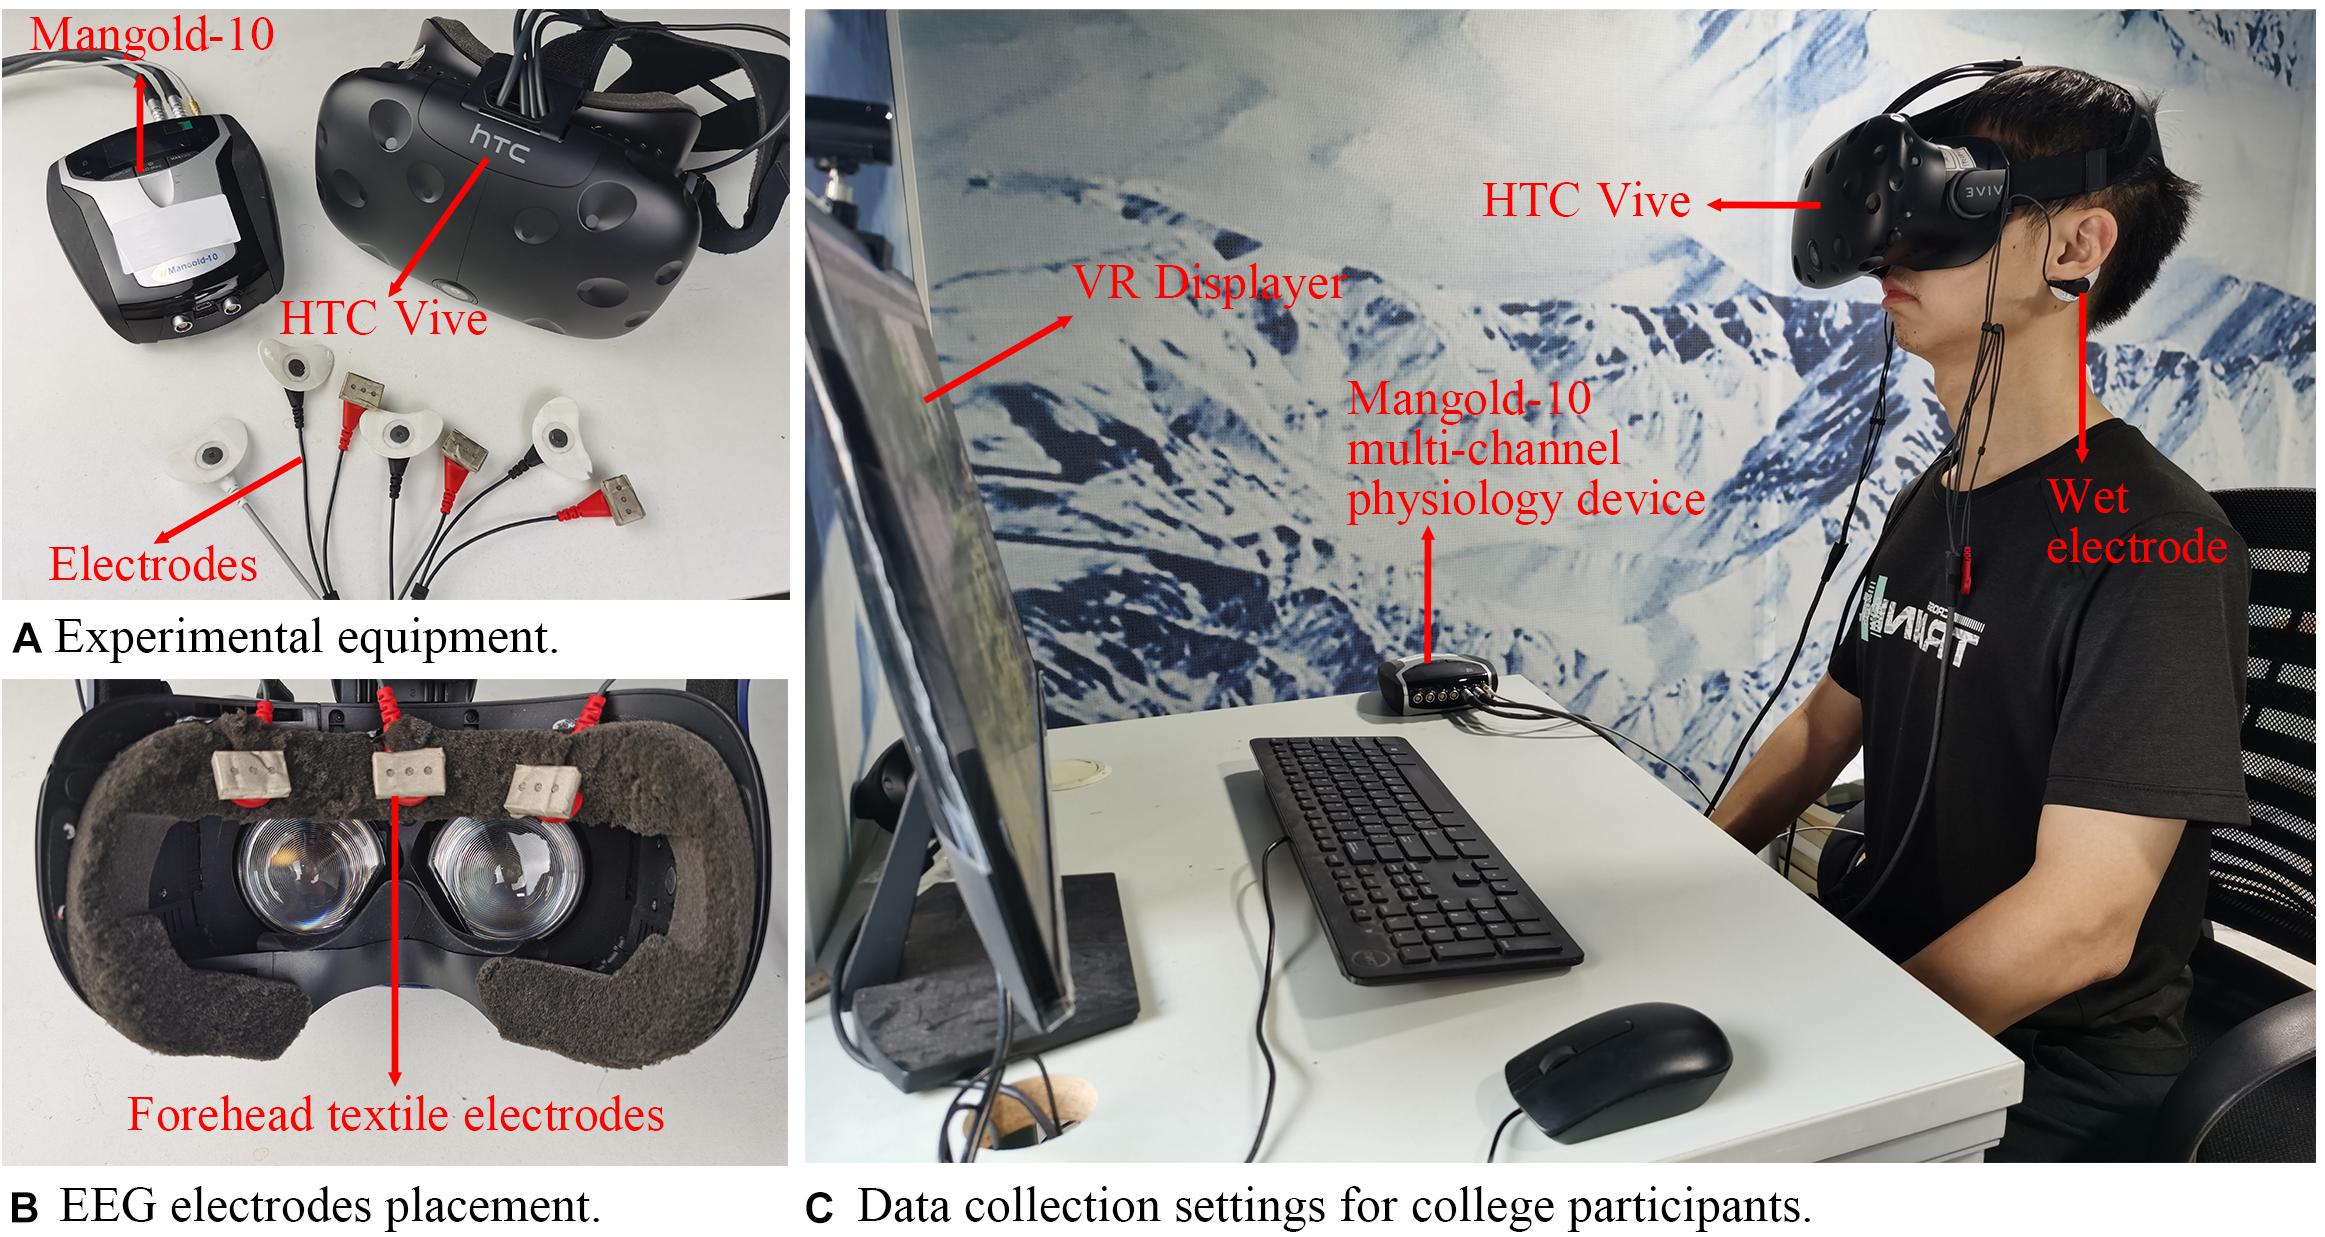
Figure 4. Experimental equipment and settings for college participants.
Electroencephalogram Data Processing
Considering the EEG data collection from watching one section of the VR scene as one segment of data, 80 segments of effective data of normal participants were collected for further analysis (20 segments for each scene). To explore the relaxing effect of the VR scenes, data sections in each segment of EEG data before and after watching scenes for the 30 s (noted as pre EEG and post EEG) and 30-s data during the period of watch VR scenes (noted as begin EEG and end EEG) were selected (Nitin et al., 2016), as shown in Figure 5.
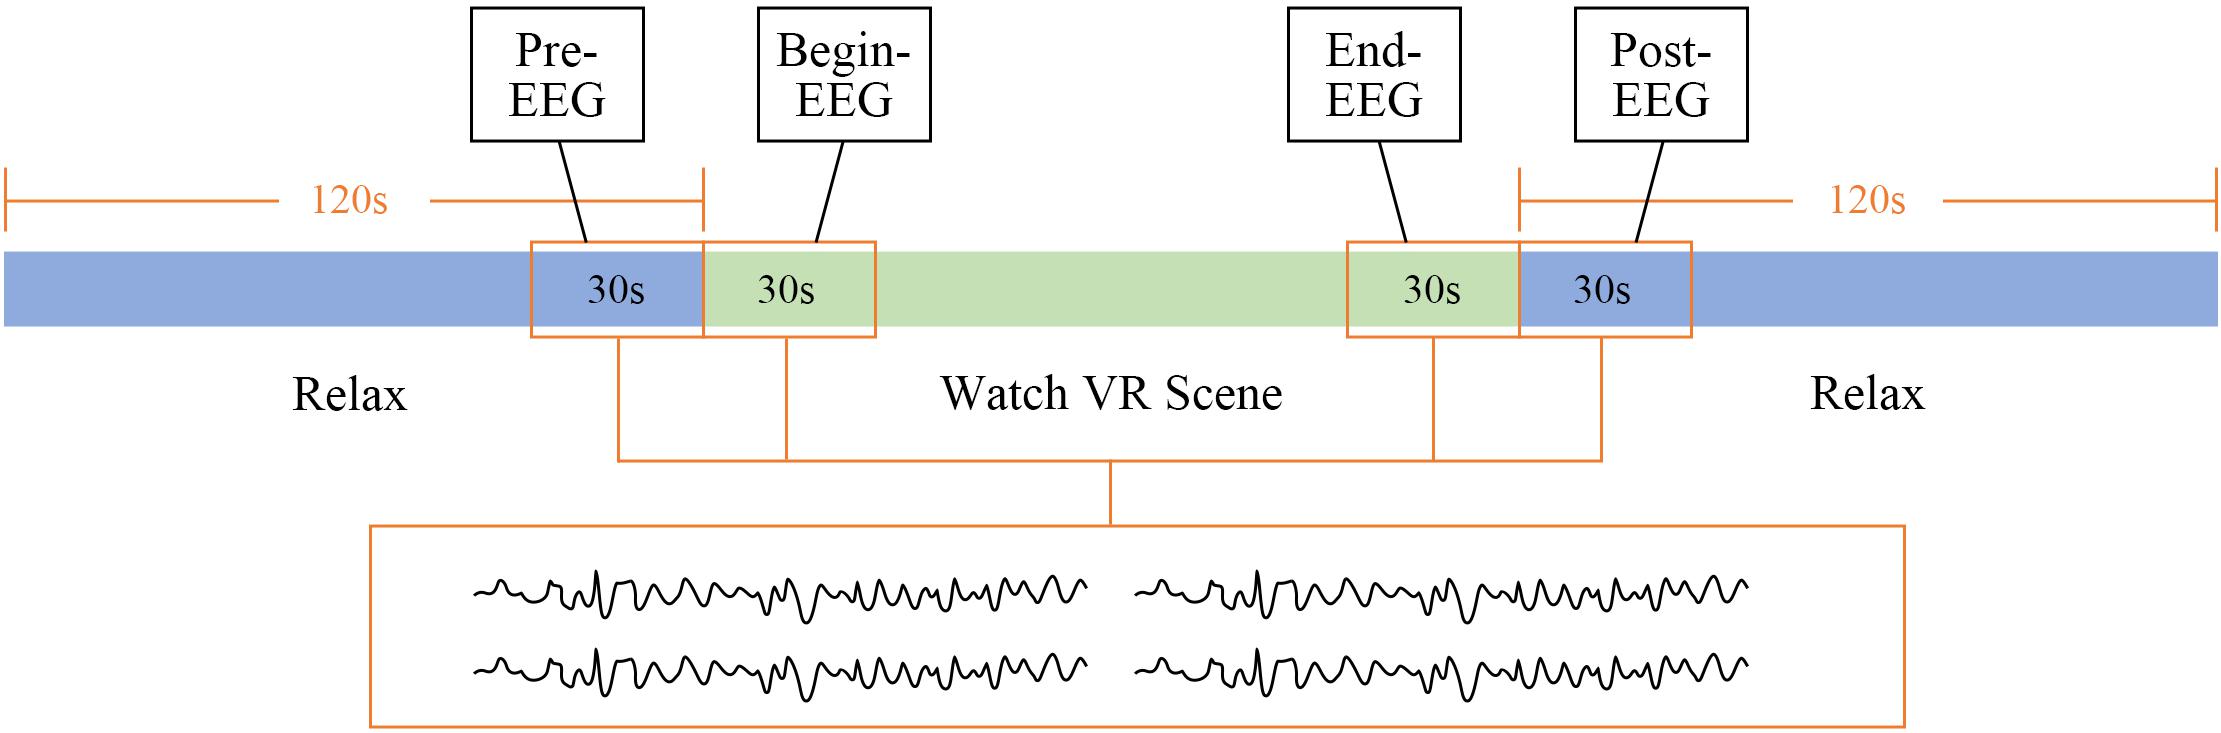
Figure 5. Selected electroencephalogram (EEG) data.
Selected EEG data were filtered using a 1- to 45-Hz Butterworth filter to eliminate the power interference and the baseline drift, after which each segment of de-noised EEG data was decomposed into seven frequency bands according to the different frequencies including delta (δ, 1–3 Hz), theta (θ, 4–7 Hz), low alpha (α_l, 8–10 Hz), high alpha (α_h, 10–12 Hz) (Dombrowe and Hilgetag, 2014), low beta (β_l, 12–20 Hz), high beta (β_h, 20–30 Hz) (Kwon et al., 2011), and gamma waves (γ, 31–50 Hz). Then, EEG features of each band were extracted including the EEG energy value (E), energy ratio (ER), energy entropy (EE), differential entropy (DE), power spectral density, the asymmetry (ASM), rational asymmetry (RASM), differential asymmetry (DASM) of the alpha wave, and the asymmetry of EEG energy ratio of each frequency band, as shown in Table 2 (Jenke et al., 2014; Tortella-Feliu et al., 2014; Zheng and Lu, 2015; Deng et al., 2021).
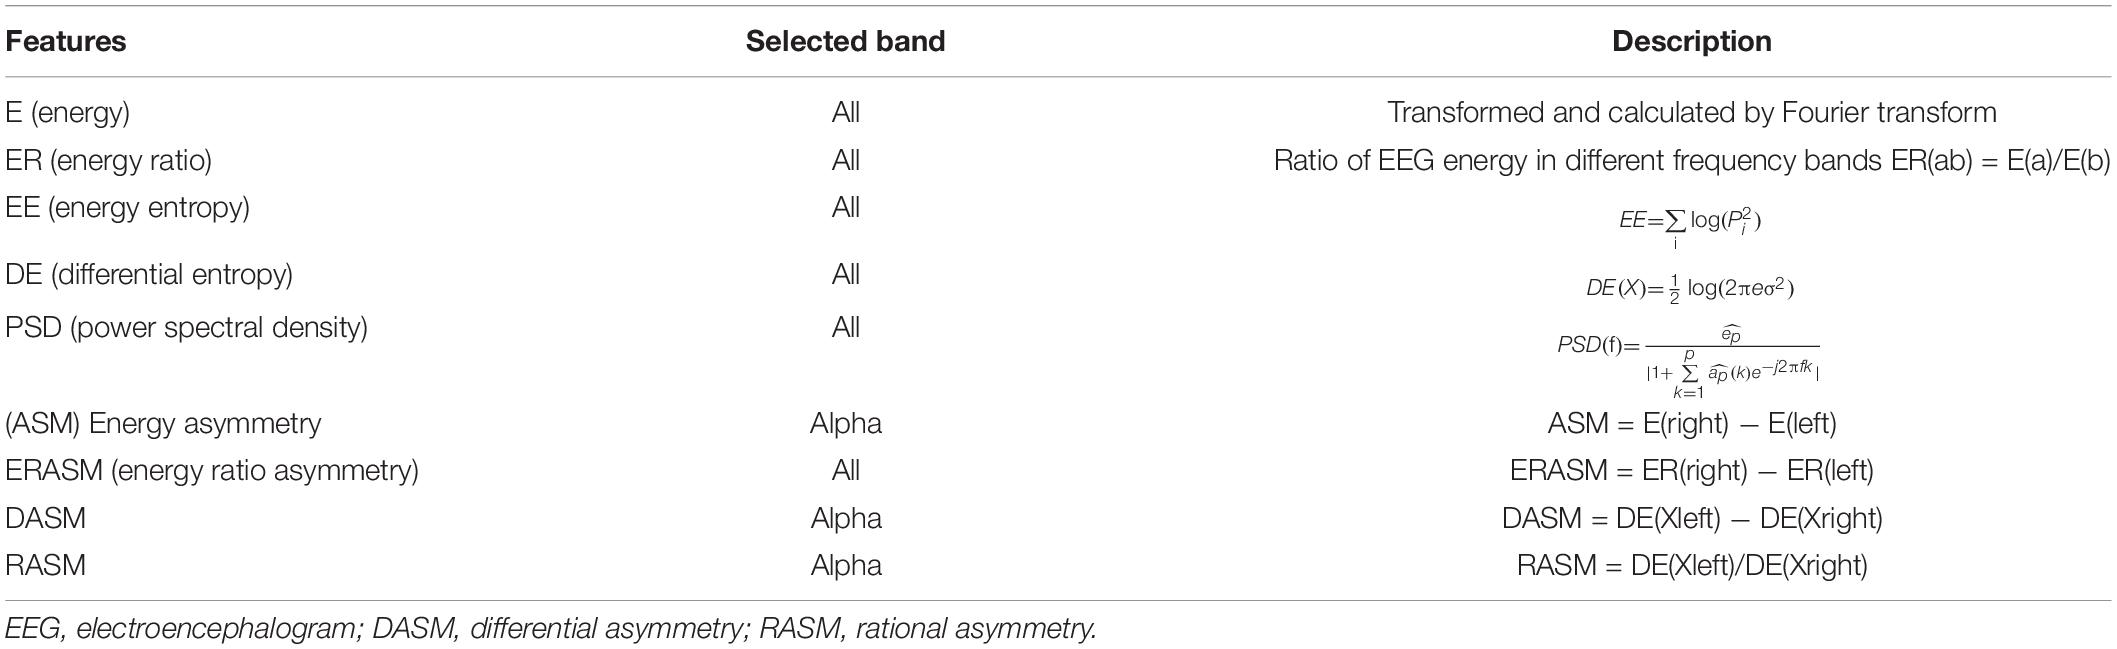
Table 2. Selected features.
The feature changes of the four data sections extracted from each segment of EEG data including pre–post EEG, pre–end EEG, and begin–end EEG were tested using t-test except begin–post EEG for the reason that the mood swings were evident by the VR scene and the goal emotion had not been fully aroused with huge mood swings at the beginning. Moreover, the relaxing emotion would be somewhat diminished during the period of post EEG. Consequently, comparing the begin–post EEG involves multiple variables that cannot be controlled. The features with significant variance (p < 0.05) after watching VR scenes were selected for further study. Since participants were exposed to visual and auditory stimuli during the begin EEG period of time, this EEG might be different from pre EEG collected in the resting state. Therefore, both pre–end EEG and begin–end EEG are worth analyzing.
R-State Model
Since four of the 30 normal participants did not finish the subjective emotion scale, which meant that some of their EEG data lacked an R-state label, and seven segments of the EEG data had obvious noises due to the large body or eye movements during the experiments, only 71 segments of EEG data of 26 participants were used for relaxation model building. After being preprocessed, 147 EEG features were selected to train the R-state model.
First, different lengths of EEG were selected for training. The last 30 and 60 s of EEG data while watching the scenes were chosen to extract selected features for EEG regression model training. Cross-subject research was adopted to make the model more generalized. The leave-one-subject-out (LOSO) method for cross-validation was used to evaluate the accuracy (Tommaso et al., 2006). The LOSO would be performed with n iterations when given a dataset from n participants. The classifier would be trained with EEG data of n − 1 participant and tested on the remaining single subject in each iteration. In this study, the whole segments of EEG data of one participant were considered as one subject data.
Data Enhancement
To increase the number of the existing dataset to increase training accuracy, each segment of EEG data was divided into several fragments, and all the fragments in one segment were tagged with the same label. Window sizes that were tried included 2, 4, 6, and 8 s, whereas the overlapping remaining 50%, which meant that the 2-s window corresponded to 1-s step and the 8-s window corresponded to 4-s step. The input data groups are shown in Table 3.
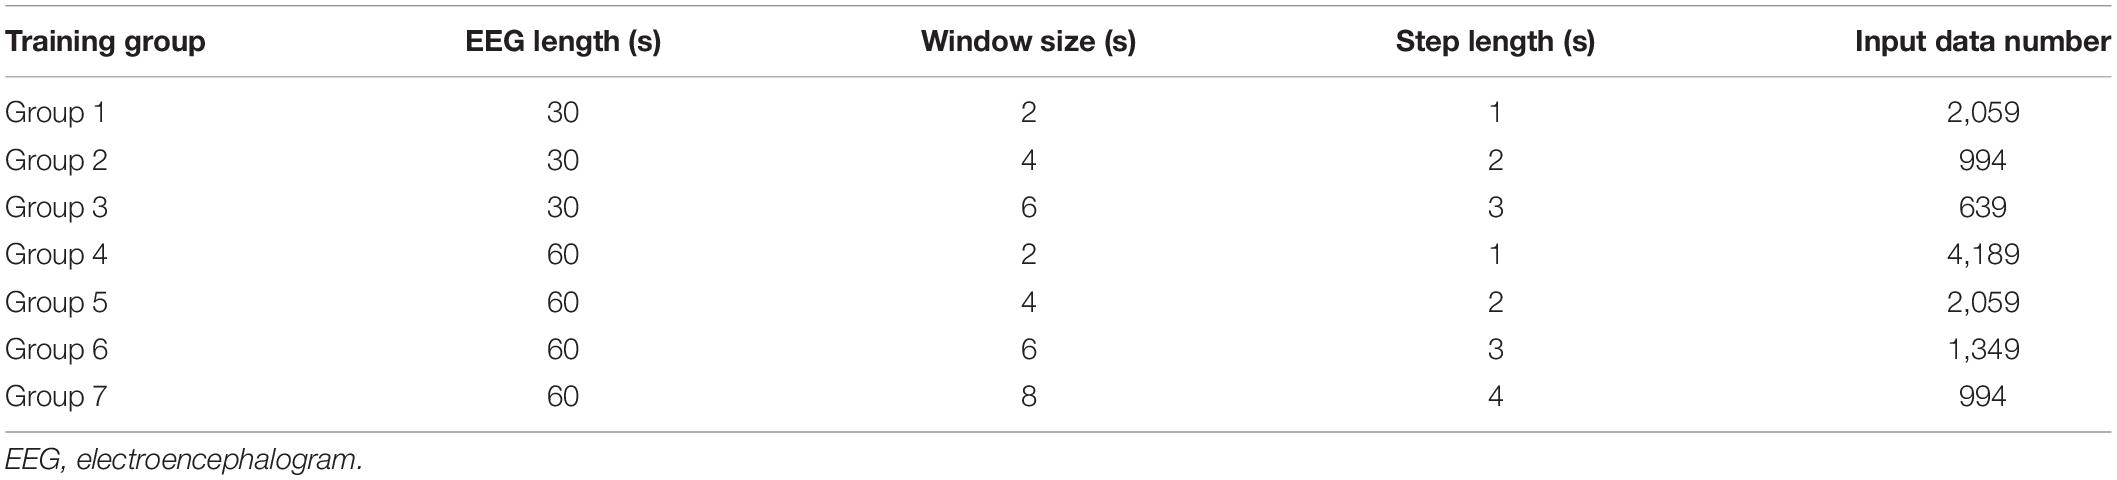
Table 3. Input data groups.
The amount of data per segment of EEG noted as N was calculated by the equation below.
where L indicates the length of one segment of the EEG, W represents window size, and step is the overlapping length.
Regression Model
After all the 147 features from every second of data were extracted and the mean value of each fragment was calculated, the results were then put into different regression models. Eight models were used for a comparison including linear regression (LR), support vector machine (SVM), random forest regression (RFR), adaptive boosting (AdaBoost), BootStrap aggregation (Bagging), gradient boosting (GB), eXtreme GB (XGB), and light GB (LGBM). Stacking regression was then used, which was first proposed by Leo (1996). It was a method that could integrate the outputs of multiple models to produce a new model to improve prediction accuracy. The stacking model generally consists of two levels. Several different high-prediction models with complementary advantages and disadvantages were often used at the first level; and at the second level, one simple model would be used. In this study, four different types of base regression models including RFR, AdaBoost, GB, and LGBM were used at the first level to train the original dataset referring to the results of the eight models training and previous studies (Kim et al., 2020). RFR and boosting models are the most commonly used models at the first level of stacking because these two models belong to the parallel model and the serial model, which are quite different and have generalization to the results. And at the second level, a simple model such as LR or SVM will be used to integrate the results of the models used at the first level to prevent overfitting (David, 1992; Bohdan, 2020). LOSO method was also used in the first level so that 26-fold cross-validation would be done by each model to get predicted labels. The predictions of each test fold were then put into the second level as the training dataset, and the average of the 26-fold predictions would be taken as test datasets in the second level. Two simple models LR and SVM were tried at the second level to make a comparison. The diagram of model stacking in the regression work is shown in Figure 6.
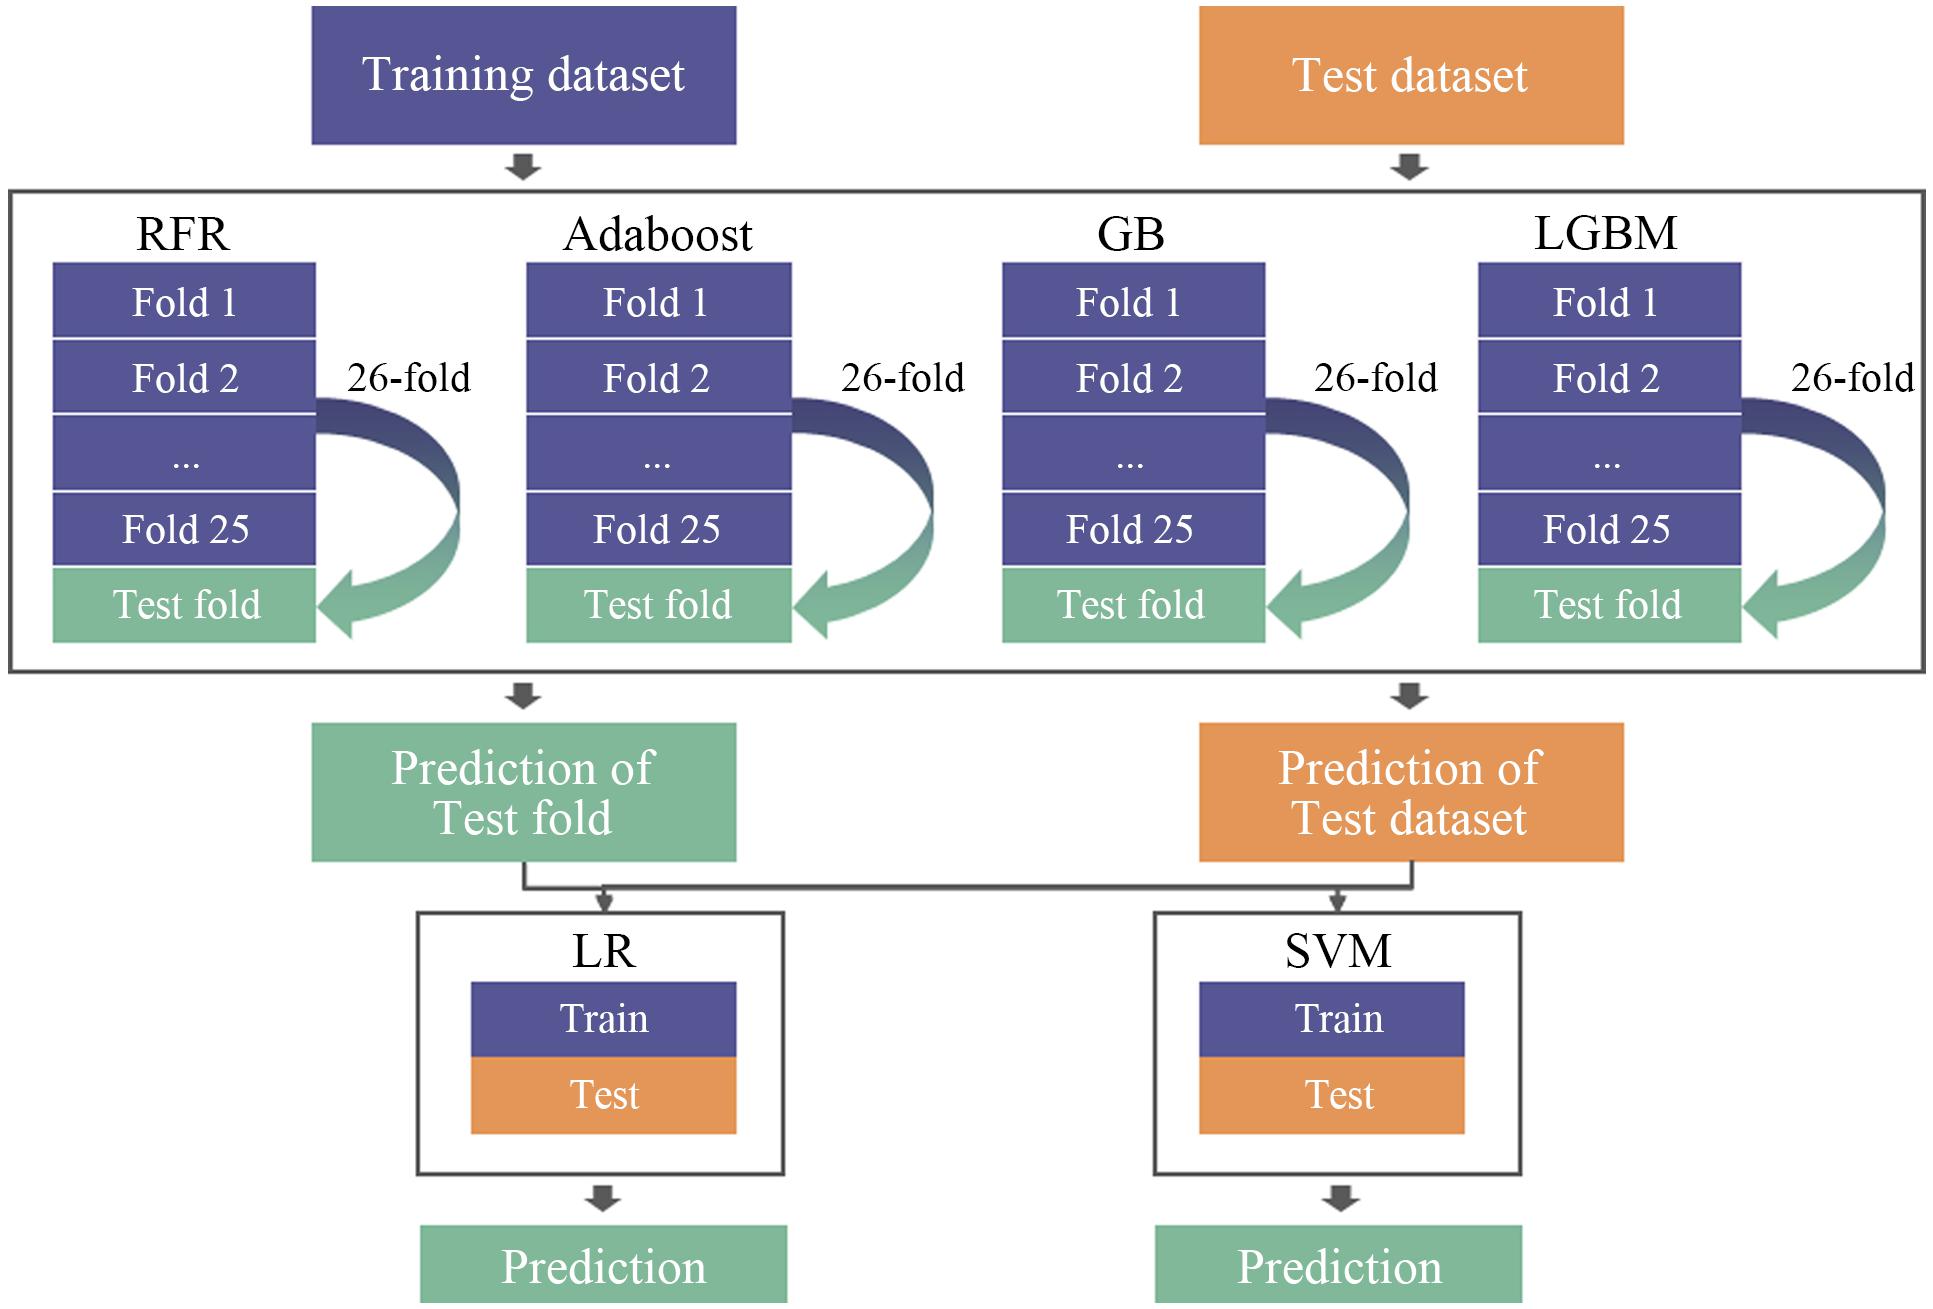
Figure 6. The stacking model diagram.
Evaluation Index
Mean absolute error (MAE) and mean relative accuracy (ACC) (Li et al., 2019) were used as indices to evaluate the results of different model training. MAE calculated the absolute error between the predicted value and the true value. The formula is illustrated below, where n indicates the number of the EEG data, yi is the true value, and is the predicted value. The lower the value, the better is the training model.
The calculation formula of ACC is shown below with an index ranging in value from 0 to 1. The closer the value is to 1, the better is the training model. ACC reflected the relative error between the predicted and true values, which would be more comparable than MAE.
Results
Subjective Emotion Scale Result
The result of the subjective scale is shown in Figure 7. Since the relaxation degree score greater than five indicated that the scene had a relaxing effect, all the four relaxation scenes were effective (National Park 7.18, Snow Mountain 6.06, the Great wall 6.71, and Yunnan 7.53), in which Yunnan was the most relaxing VR scene. Furthermore, the results also showed that with increase in the relaxation degree, the value of valence also increased.
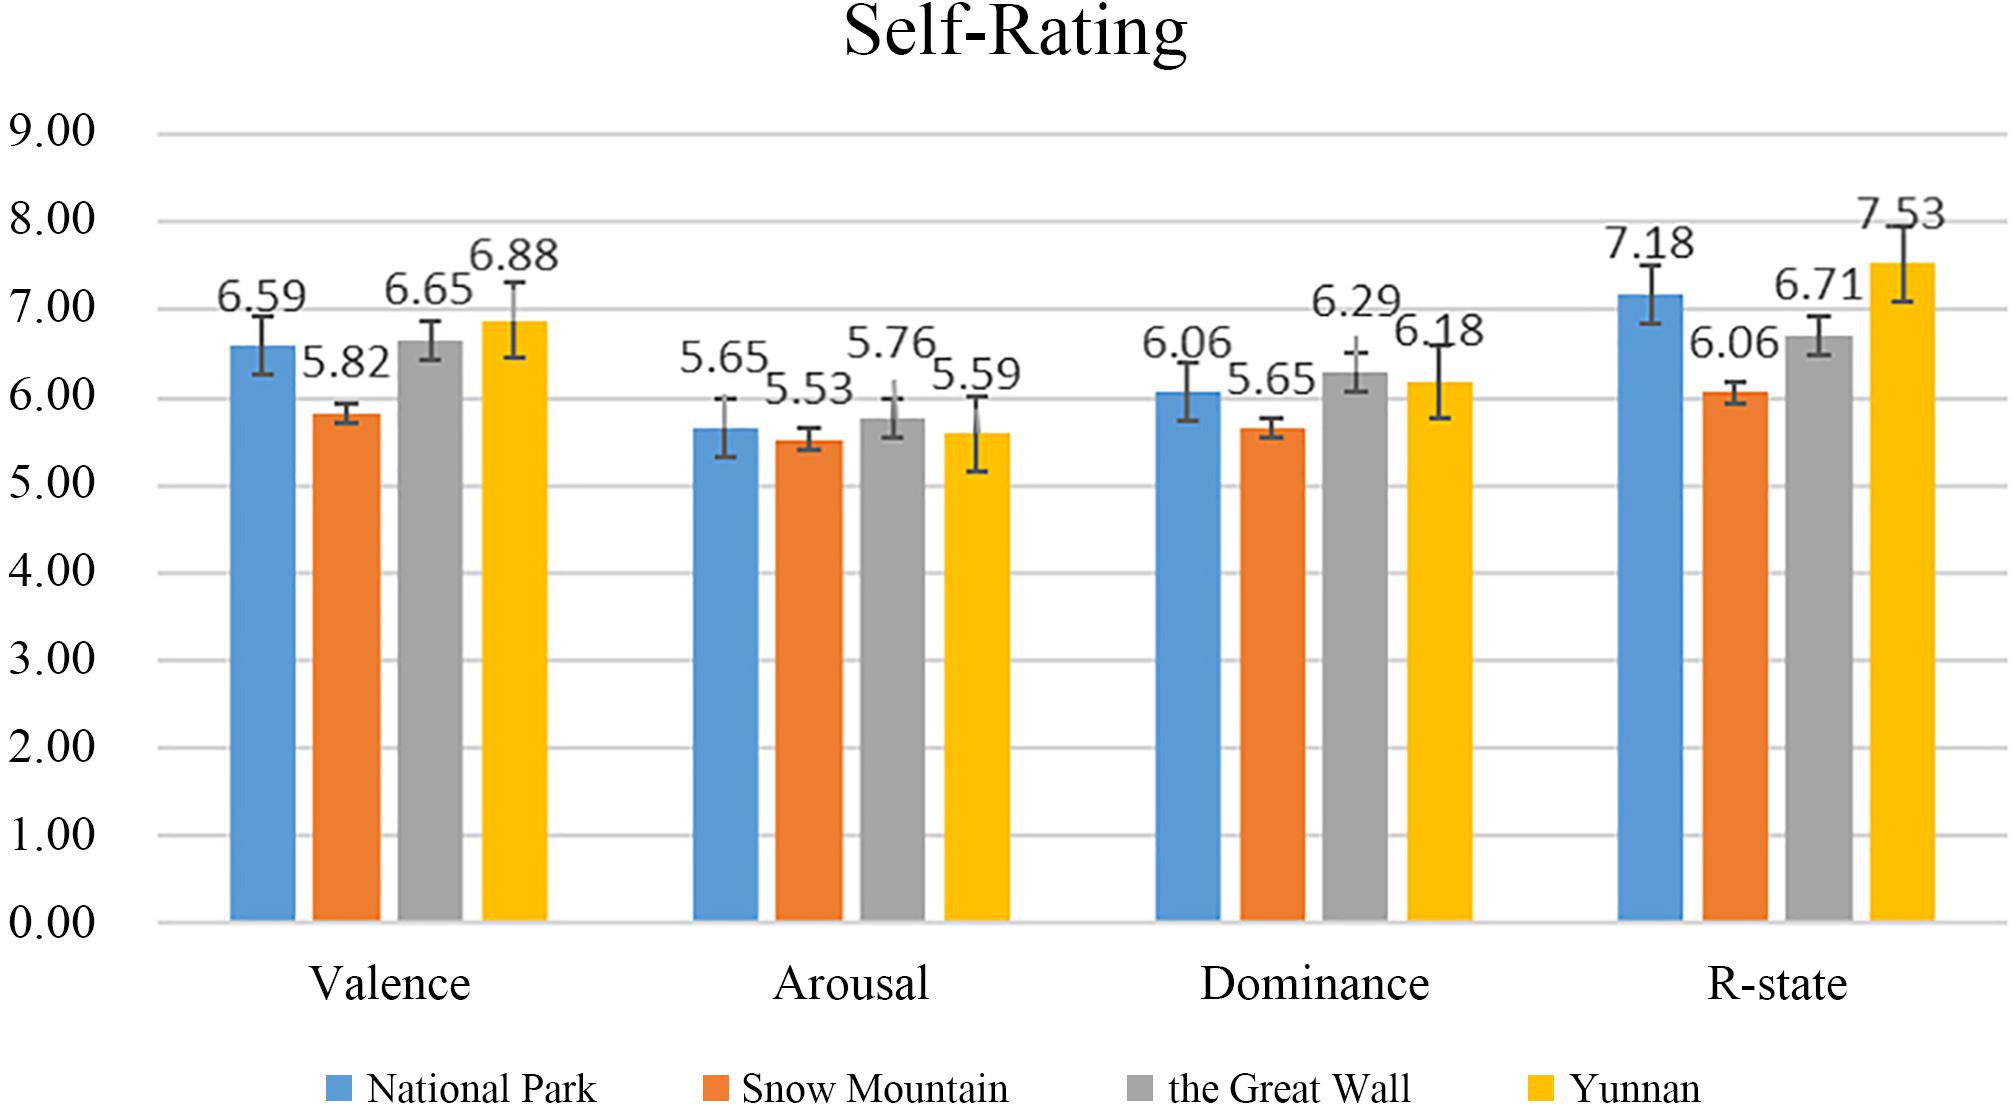
Figure 7. Self-rating scale of normal participants.
Electroencephalogram Feature Analysis Result
The typically changed EEG features of the participants are shown in Table 4 including energy features, energy ratio features, and SE features of each band.
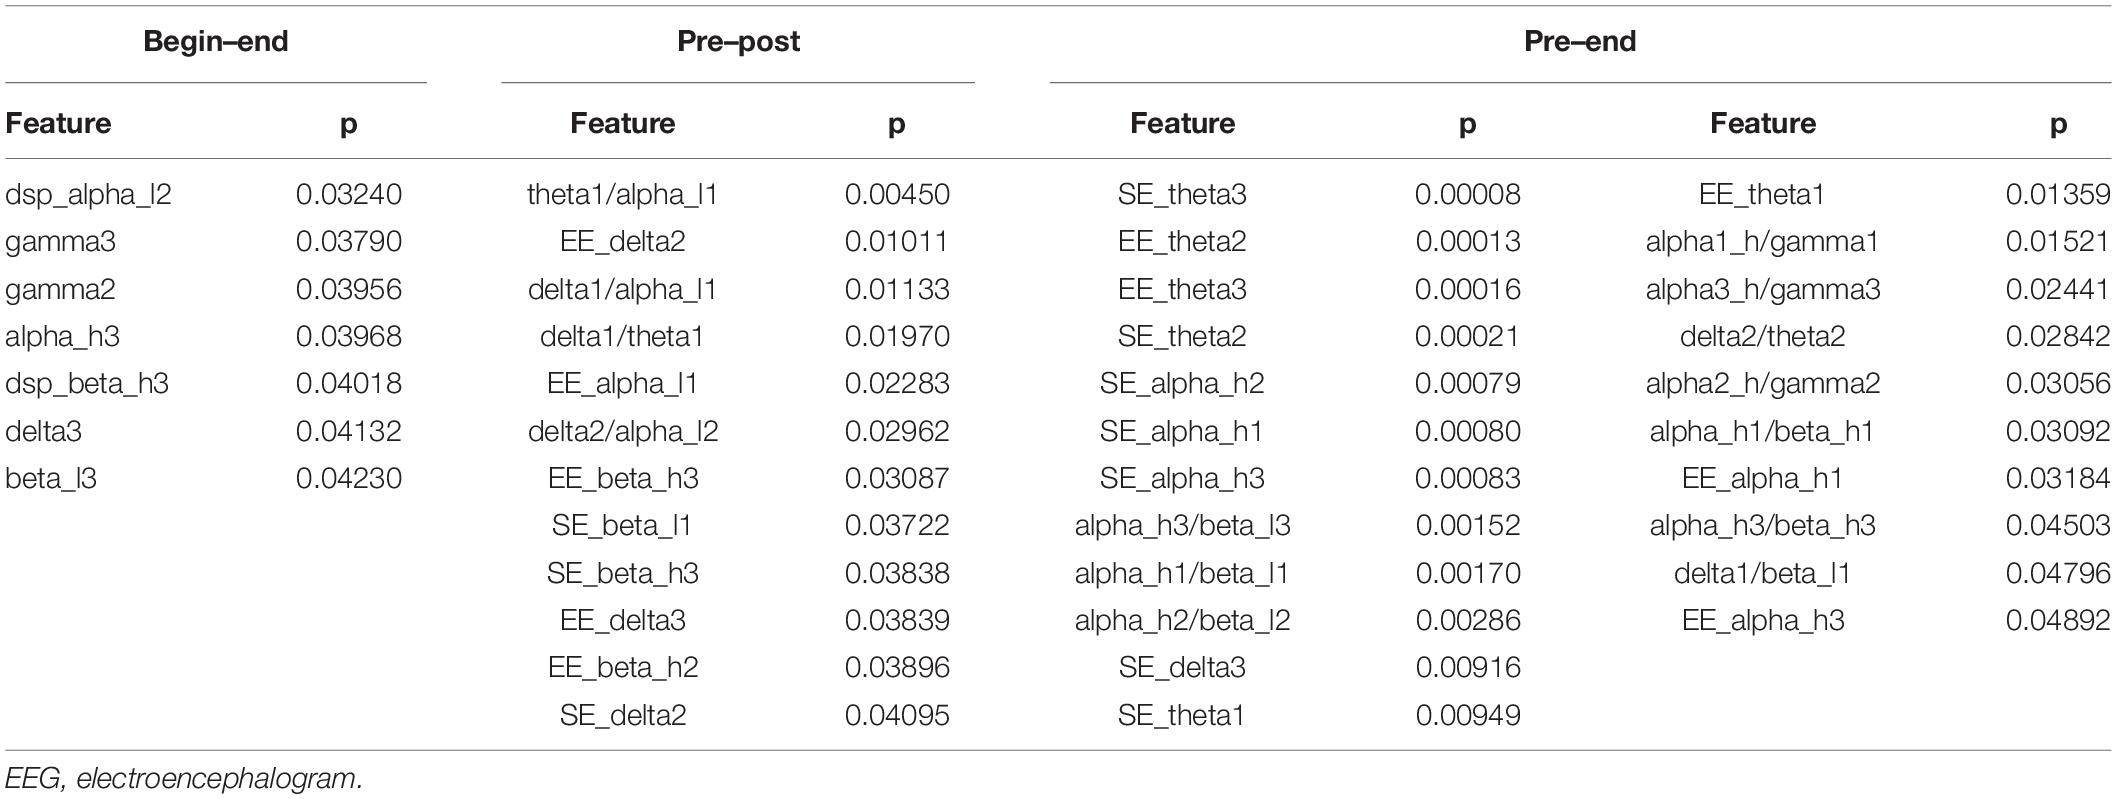
Table 4. EEG features with significant variance.
The results of pre EEG to end EEG, pre EEG to post EEG, and begin EEG to end EEG were used as comparison groups. Ten features were found from significantly changed features, as was shown in Figure 8, to have consistency differences after watching the VR relaxation scenes, which meant the EEG feature values of all the 26 participants showed an increasing or a decreasing trend after watching the VR scene for each participant. The significantly changed features included E-delta/alpha_l, E-alpha_h/gamma, E-alpha_l/beta_h-ASM, EE-beta_l, EE-beta_h, EE-gamma, EE-theta, SE-alpha_h, SE-theta, and DASM-alpha_l. Moreover, features E-delta/alpha_l, E-alpha_l/beta_h-ASM, and SE-theta showed an increasing trend after watching the relaxation VR scene. Features E-alpha_h/gamma, EE-beta_l, EE-beta_h, EE-gamma, SE-alpha_h, SE-theta, and DASM-alpha_l showed a decreasing trend.
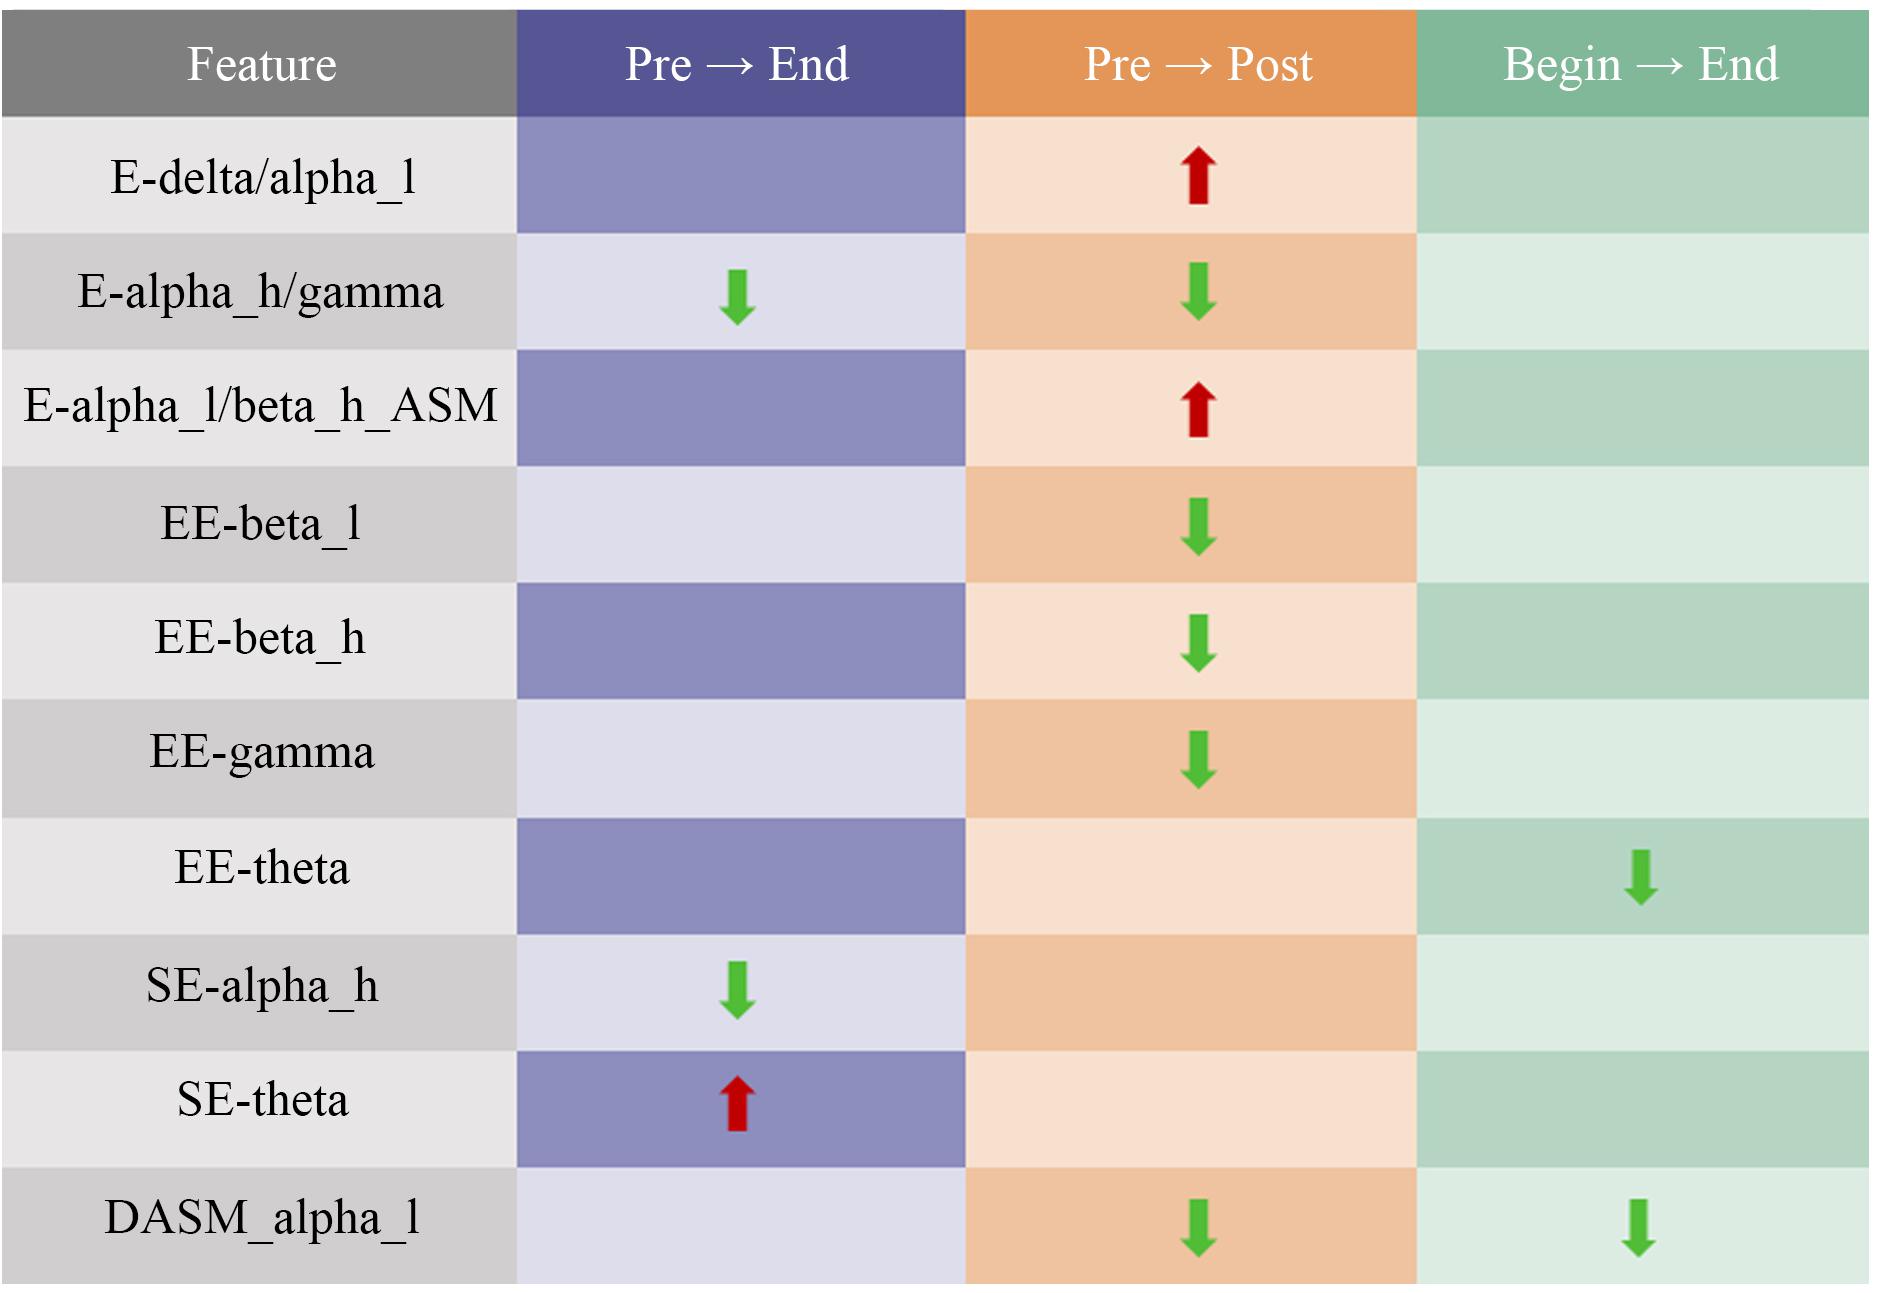
Figure 8. Summary of changes in electroencephalogram (EEG) characteristics of normal participants after watching the relaxation scenes.
Relaxation Regression Results
Table 5 shows the ACC results of the different training models in each group. From the average accuracy results of the different training models in each group, it could be observed that the accuracy of XGB and LGBM reached above 80%, and LGBM got the best result of 80.42% on average. While using LGBM to train the model, Group 1 performed the best, with the accuracy of 80.69%.
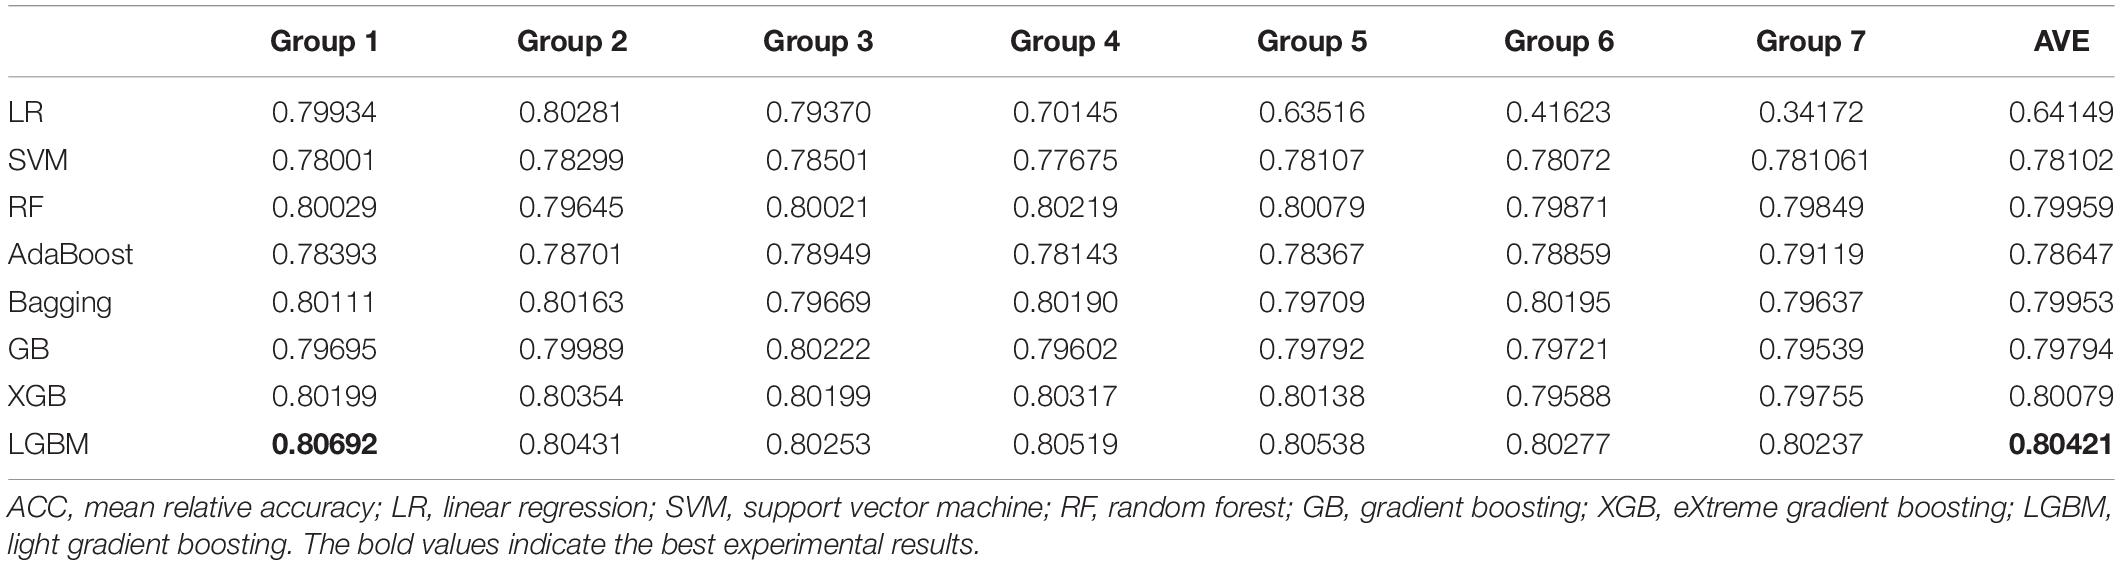
Table 5. Relaxation model training ACC results.
Mean absolute error result is shown in Table 6. It could be found that in using LGBM to train Group 1, the lowest value of 1.00494 was obtained. While comparing the results of each group, it could be found that in general, using 30 s of EEG data (Groups 1, 2, and 3) to train the model would get better results than 60 s of EEG data (Groups 4, 5, 6, and 7). Furthermore, the model stacking method was applied to train Group 1. The result is shown in Table 7. It could be found that using stacking increased the accuracy of the predictions by approximately 1% and decreased the MAE values by 1, which indicated that the model was optimized. Moreover, using SVM at the second level got better results than LR.
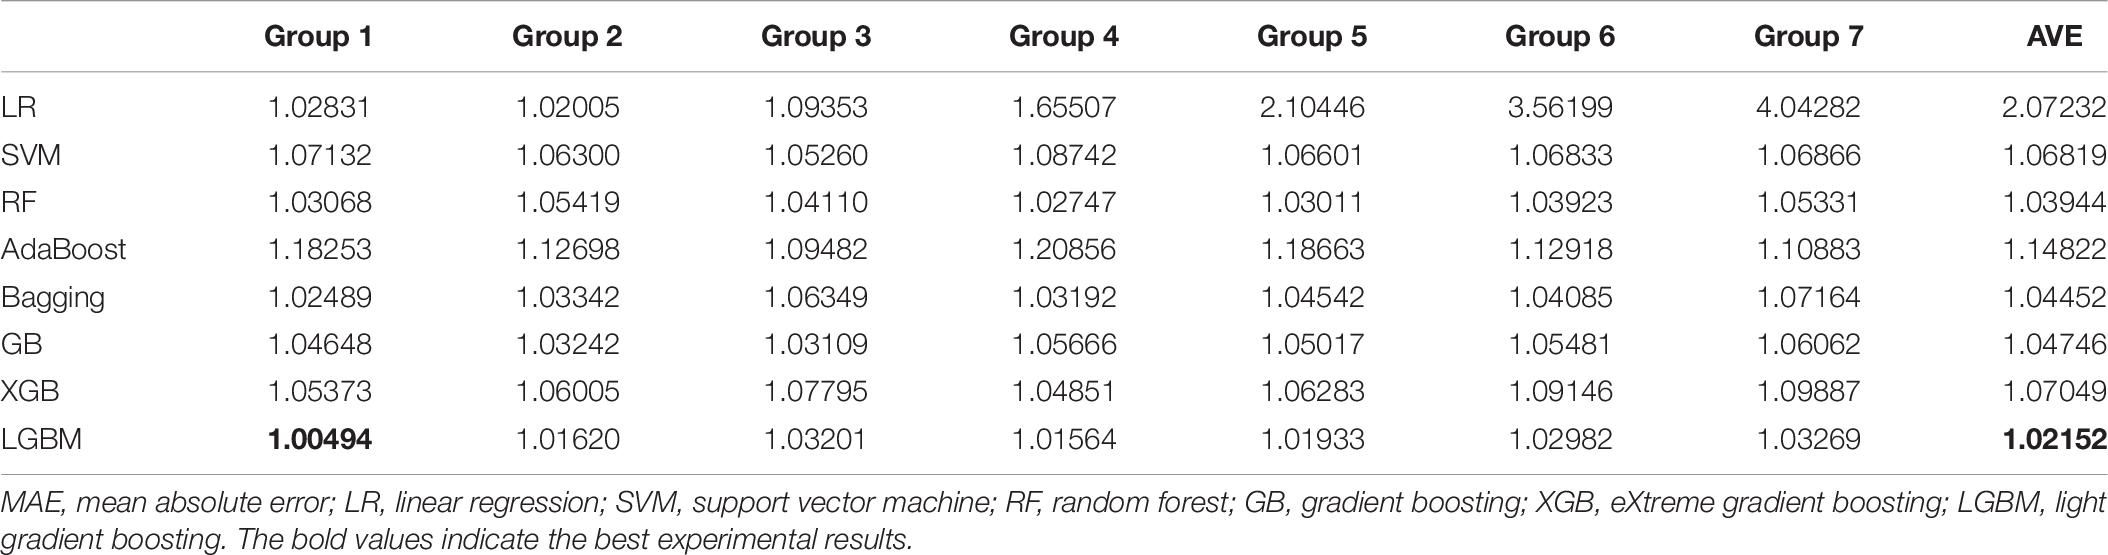
Table 6. Relaxation model training MAE results.
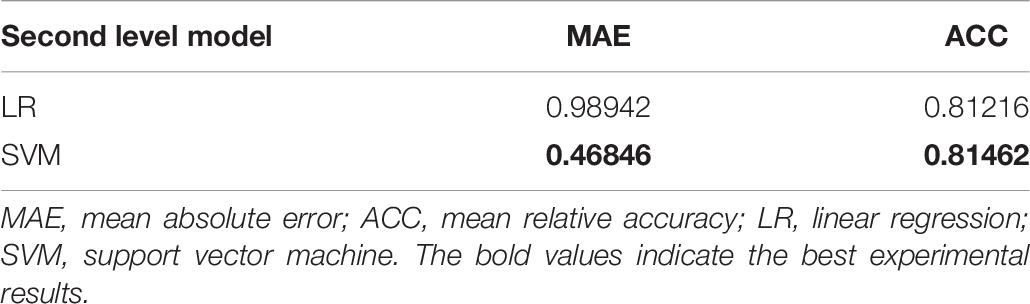
Table 7. Stacking model results.
Application
The VR relaxation scenes were applied to assist in the treatment of patients with depression in the Guangzhou First People’s Hospital. Twenty-two patients with first-episode depression including six men and 16 women (age ranging from 19 to 50 years) volunteered for the VR treatment. Each patient was asked to watch only one VR scene, the Great Wall, to avoid discomfort caused by watching VR for a long time. EEG was also acquired during the procedure, and patients were asked to verbally answer how they felt after watching. Figure 9 shows the data collection settings for the patients, who were asked to sit and watch the VR scene wearing the VR glasses in front of a table on which there was a computer monitor and the EEG acquisition device. Written consent was obtained from each participant before the experiment.
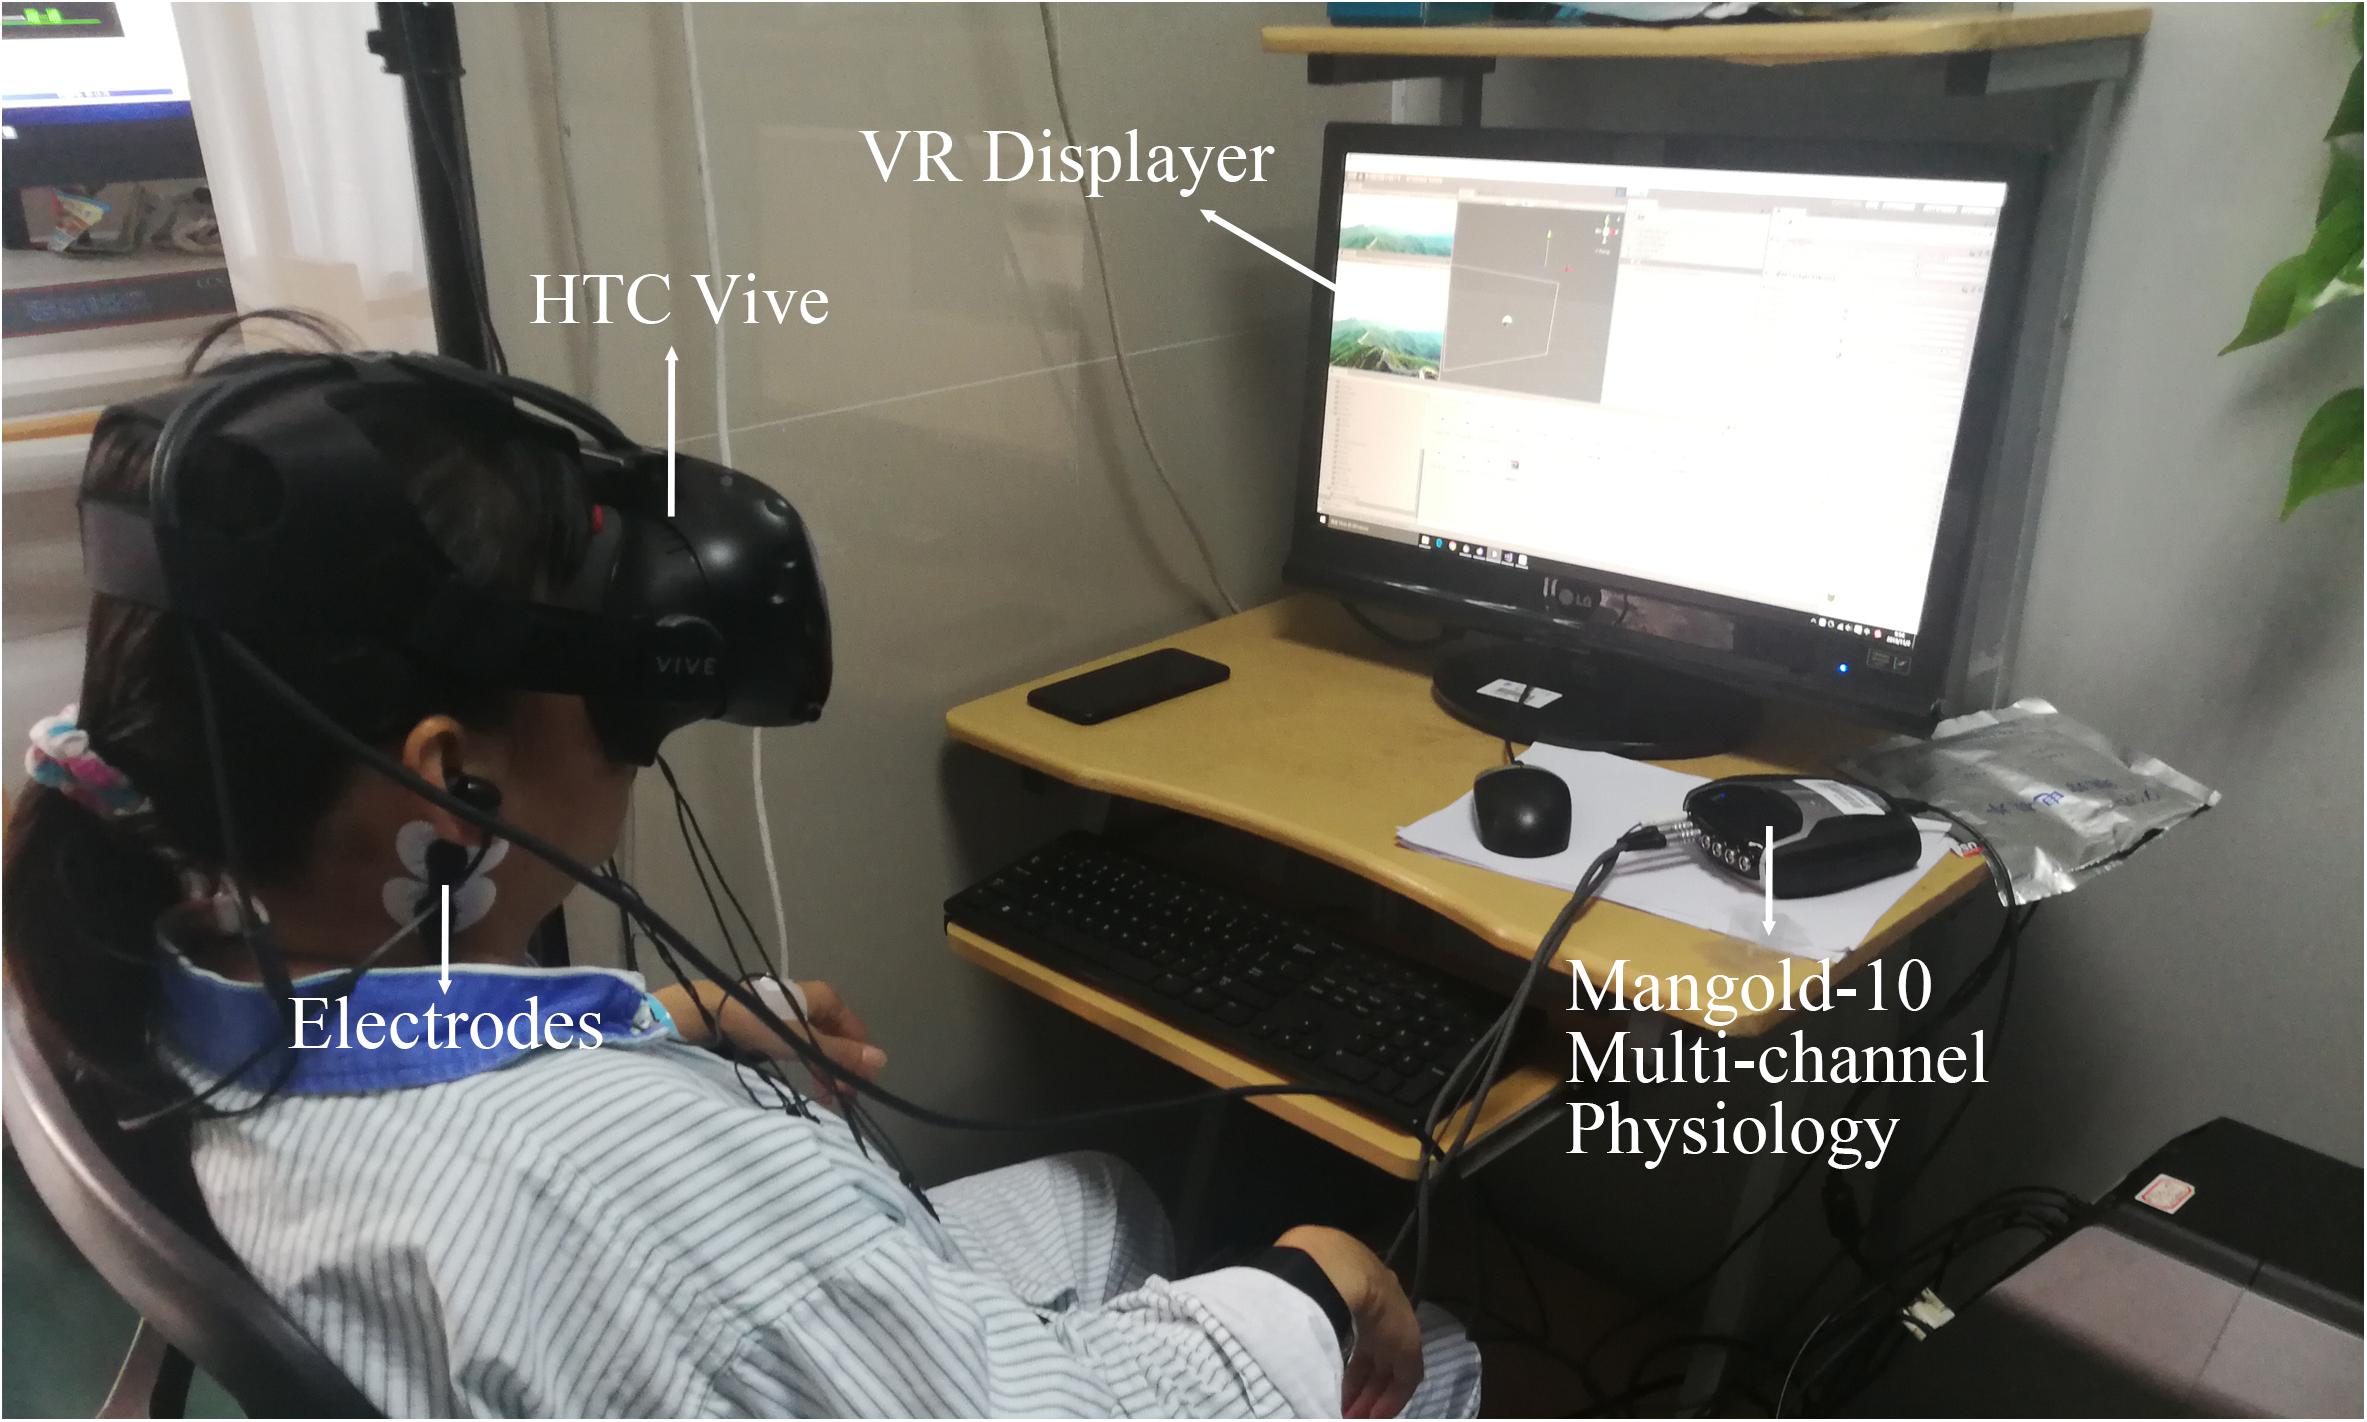
Figure 9. Data collection settings for patients with depression.
Patients’ subjective answer results are shown in Table 8. It could be seen that most patients with depression felt relaxed after watching the VR scene except for two patients.
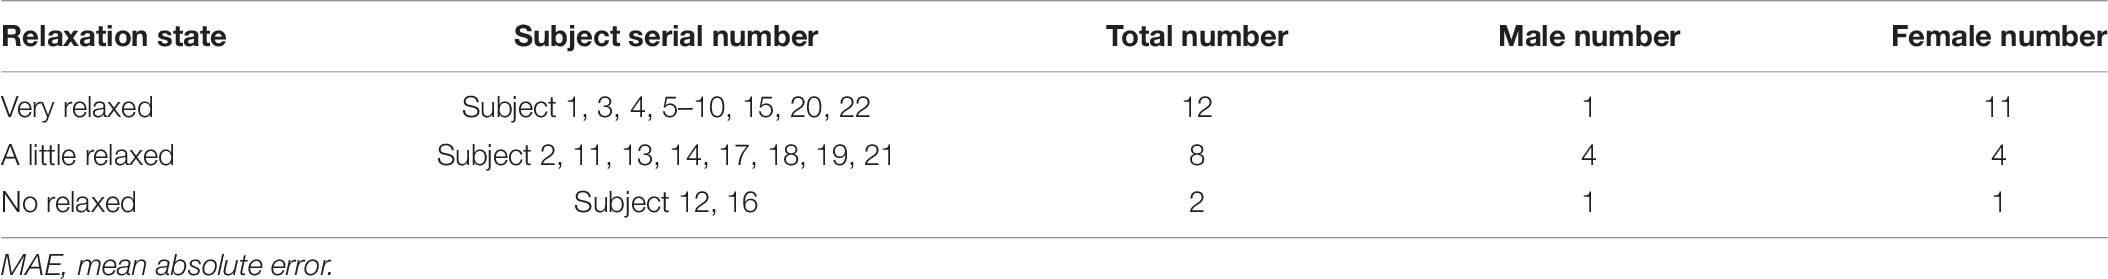
Table 8. Relaxation model training MAE results.
The EEG datasets of the depression patients were preconditioned in the same manner as those of normal college students. After preprocessing, the last 30-s EEG data while watching the relaxation scene were put into the stacking regression model whose second layer was SVM to predict the R-state to demonstrate the effectiveness of the VR relaxation scene to depression patients. The method of EEG data progress was the same as that of Group 1, of which the R-state prediction result was the best. The predicted R-state results of disorder patients are shown in Table 9, demonstrating that all the prediction values were over 5, and the average of the predicted R-state was 6.54, which was close to the subjective rating value (6.71). These results confirmed that the VR relaxation scene has a positive effect on the relaxation therapy of patients with depression.
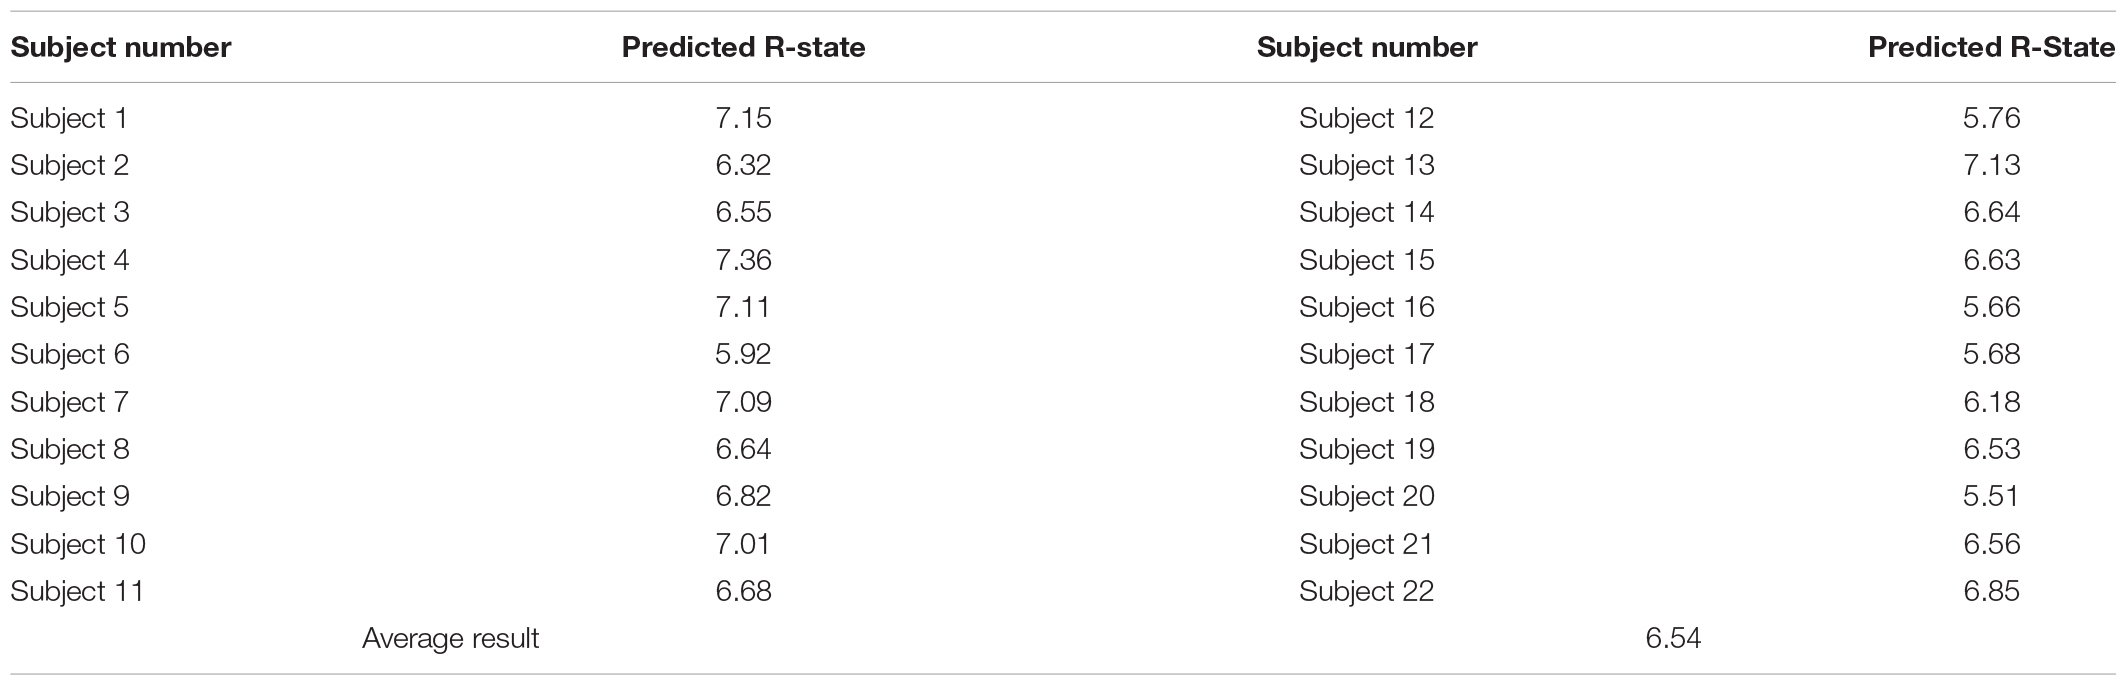
Table 9. Predicted R-state of each patient.
The EEG features of patients with depression were analyzed in the same manner as those of normal participants. Five features had significant consistency differences after watching the VR relaxation scenes, including E-delta/beta_l, E-delta/beta_h, E-alpha_l/gamma, E-alpha_h/gamma, and E-beta_l/gamma, as shown in Figure 10. All of these changing features were on a downward trend. Moreover, E-alpha_h/gamma had the same trend as that of normal participants.
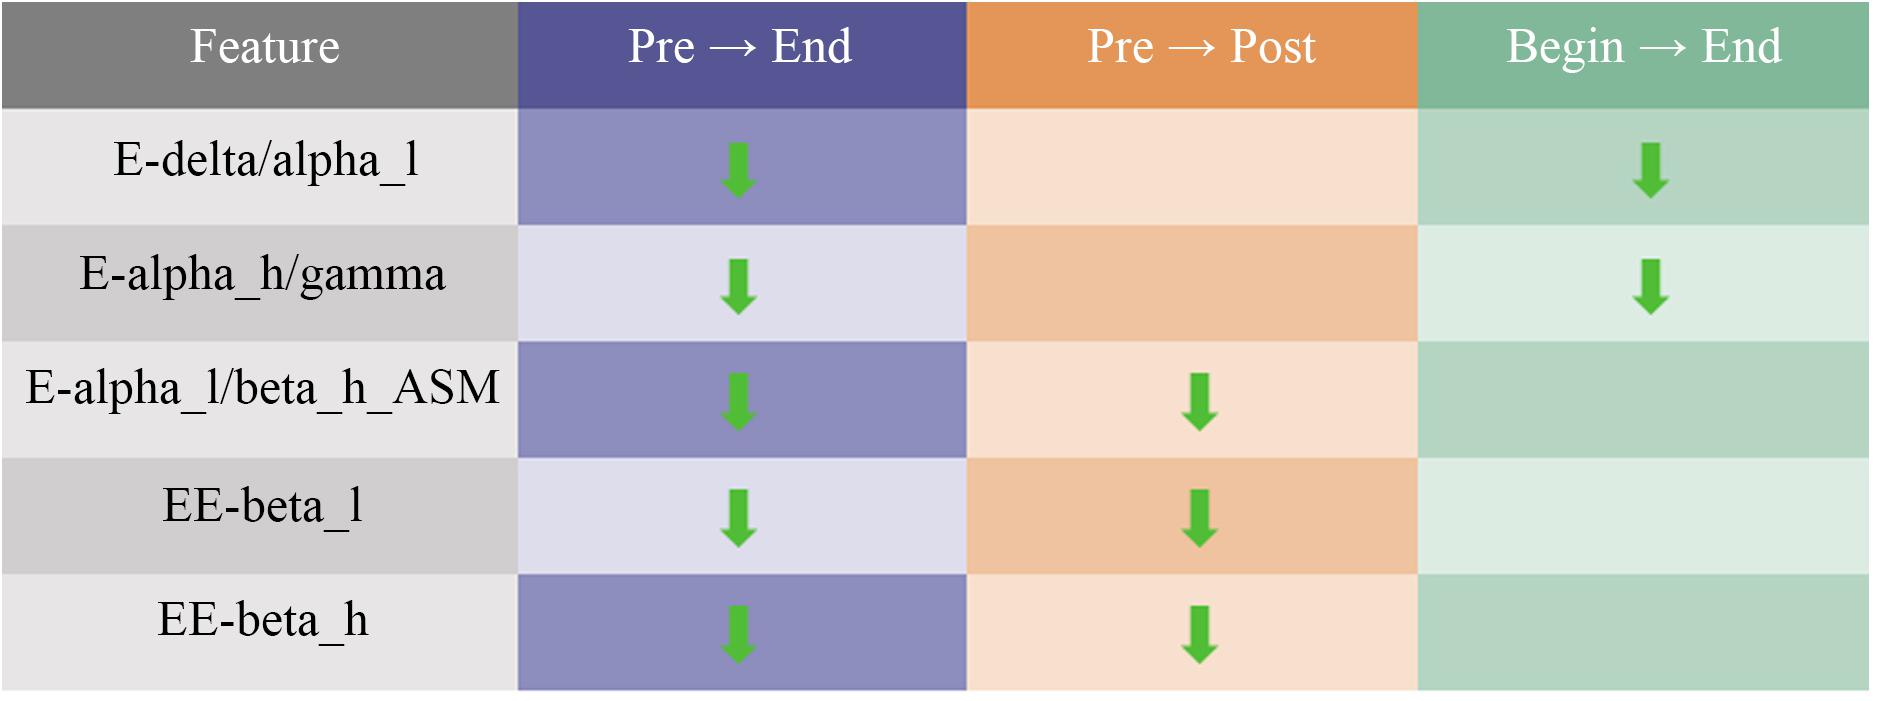
Figure 10. Summary of changes in electroencephalogram (EEG) characteristics of patients with depression after the relaxation scenes.
Discussion
The subjective evaluations in the normal participants and patients with depression demonstrated that the sightseeing-relaxation VR scenes with new age music had relaxing effects. However, it was hard to say whether the visual scene or the auditory music had a greater effect on relaxation. Some studies have found that auditory stimulations aroused emotions much better than visual materials. Therefore, the impact of relaxation VR scenes and relaxing background music must be explored.
Different data processing methods were used to analyze the EEG datasets for R-state study in this study. The length of chosen EEG was 30 s including sections during watching VR scenes and during the 2-min relaxing period. In the previous study, 60 s of EEG data of one section before and after watching the VR scenes were used (Zhu et al., 2019). However, since the participant’s emotion was easily influenced by other psychological activities during 2 min of relaxation before and after watching the VR scene, the 60 s of EEG data was relatively long. While training the R-state model, using 30 s of EEG data also showed higher accuracy and lower MAE than that at 60 s, consistent with Kumar’s research (Nitin et al., 2016).
From the EEG feature analysis results, it could be found that most of the distinctive features were theta, alpha, beta, and gamma waves, which were consistent with Cahn’s research (Baruch et al., 2016). The appearance of the beta wave was associated with mental tension and emotional excitement. When people felt relaxed, the energy and entropy of the beta wave should go down. As a result, the feature values of EE-beta_h and EE-beta_l went down. Moreover, since many studies have found that meditation and relaxation could increase gamma wave, the value of E-alpha_l/gamma and E-alpha_h/gamma increased after watching relaxation scenes. The significant variance in gamma-related features also indicated that the relaxation effects of the sightseeing scenes used in the experiment might be similar to those of meditation.
Moreover, it could be easily detected from Figure 10 that all the features with significant differences among the group of patients with depression were energy ratios, most of which were beta- and gamma-related features. It was probably because depression varied widely among individuals, and the ratio-related features could neutralize some of the individual differences (Kan and Lee, 2015). Moreover, since patients with depression felt stressed more easily, beta wave, which was associated more with anxiety, would more likely to be affected by relaxation scenes. As per Smith’s theory, reducing stress enhanced relaxation (Smith, 1988). Many studies have proved that patients with depression had increased alpha (Hosseinifard et al., 2013) and beta power (Clark et al., 2016). The decreased features of E-alpha_l/gamma, E-alpha_h/gamma, and E-beta_l/gamma might also have confirmed the effectiveness of VR-relaxation therapy in treating depression. When comparing the changes of EEG features between normal people and patients with depression, it could be found that there existed one feature, E-alpha_h/gamma, having the same trend as that of normal participants. Related studies have found that the gamma wave and alpha wave of normal people and patients with depression are relatively sensitive (Grey et al., 2010), which might cause the same significant changes. Although the findings have not been medically proven yet, these results have provided a reference for future studies.
It could be found from Table 9 that all the EEG data of depression patients predicted a level of R-state greater than 5, which meant that the emotions of all the patients were predicted to be relaxed. However, two patients were not relaxed in their subjective assessment. This difference might be due to the fact that the relaxation model was based on EEG data from normal people. Since the R-state model was built by datasets of normal people, and there existed some differences between the EEG of normal individuals and patients with depression (Davidson et al., 2002; Acharya et al., 2015), using the R-state model to predict people with depression might not be particularly accurate. However, one feature with the same trend when watching the relaxation scenes in these two groups was found, and the predicted results of the R-state still have reference value. Therefore, it is necessary to train the relaxation model using the EEG data and relaxation label of patients with depression. In further research, more experiments would be conducted covering college students, patients with depression, and some other groups of people, to verify the application scopes of the relaxation model.
Conclusion
In this study, VR relaxation scenes were used to promote the R-state for college students. Some EEG features were found to have a consistent significant trend of variance among different participants while watching the relaxation scenes, including EE-gamma, E-alpha_h/gamma, and DASM. These significantly changed features provide a reference for optimizing the relaxation prediction model and relaxation interaction system research based on EEG in the future. Eight machine learning models including LR, SVM, and LGBM were conducted to train the R-state regression model, and the LOSO method for cross-validation was used to evaluate the results. The mean accuracy reached approximately 80.42% using the LGBM model. Model stacking methods were then applied to optimize the model. The mean accuracy of the framework achieved approximately 81.46%, which increased by approximately 1%. The VR relaxation scenes were then used to help with the treatment of patients with depression, which have received good results. This work provides an objective index reference for the evaluation and treatment of depression using VR relaxation scenes and also explores the feasibility of VR relaxation scenes in the adjuvant treatment of depression.
Data Availability Statement
The raw data supporting the conclusions of this article will be made available by the authors, without undue reservation.
Ethics Statement
The studies involving human participants were reviewed and approved by the Guangzhou First People’s Hospital (202002030262, on April 1 2020). The patients/participants provided their written informed consent to participate in this study.
Author Contributions
YZ and LLZ were responsible for the entire study, including the study concept, the study design, and the application. YZ, HH, JJ, and LQZ contributed to the VR scene design. YZ, JJ, LS, and XX were responsible for the EEG collection design and data analysis. FK and YL helped with the EEG collection. All authors listed have made a direct and intellectual contribution to the work.
Funding
This work was supported in part by the Major Science and Technology Projects in Guangdong Province under Grant 2016B010108008, in part by the Technology Program of Guangzhou under Grants 202002030354 and 202002030262, in part by the Science and Technology Project of Zhongshan under Grants 2019AG024 and 2020B2053, in part by the Natural Science Foundation of Guangdong Province under Grant 2018A030310407, in part by the Guangzhou Key Laboratory of Body Data Science under Grant 201605030011, and in part by the National Natural Science Foundation of China under Grants 61972163 and 61806210.
Conflict of Interest
The authors declare that the research was conducted in the absence of any commercial or financial relationships that could be construed as a potential conflict of interest.
Publisher’s Note
All claims expressed in this article are solely those of the authors and do not necessarily represent those of their affiliated organizations, or those of the publisher, the editors and the reviewers. Any product that may be evaluated in this article, or claim that may be made by its manufacturer, is not guaranteed or endorsed by the publisher.
Acknowledgments
We would also like to thank all participants and thank the Guangzhou First People’s Hospital for medical support. We would also like to thank Editage (www.editage.com) for English-language editing.
Supplementary Material
The Supplementary Material for this article can be found online at: https://www.frontiersin.org/articles/10.3389/fnins.2021.719869/full#supplementary-material
References
Acharya, U. R., Sudarshan, V. K., Adeli, H., Santhosh, J., Koh, J. E., and Adeli, A. (2015). Computer-aided diagnosis of depression using EEG signals. Eur. Neurol. 73, 329–336.
Alexandros, L., Christos, K., Dimitris, S., Michalis, X., and Nikos, K. (2015). “Recognizing emotions in human computer interaction: studying stress using skin conductance,” in Proceedings of the 15th Human-Computer Interaction (INTERACT), Bamberg, 255–262.
Allison, P. A., Michael, D. M., Abigail, M. F., Devin, R. C., Mark, T. H., and Jay, C. B. (2017). Relaxation with immersive natural scenes presented using virtual reality. Aerosp. Med. Hum. Perform. 88, 520–526.
Andersen, T., Anisimovaite, G., Christiansen, A., Hussein, M., Lund, C., Nielsen, T. L., et al. (2017). A preliminary study of users’ experiences of meditation in virtual reality Paper Presented at the 2017 IEEE Virtual Reality (VR) (Los Angeles, CA: IEEE), 343–344.
Baruch, R. C., Arnaud, D., and John, P. (2016). Occipital gamma activation during vipassana meditation. Cogn. Process. 11, 39–56.
Bohdan, M. P. (2020). “Using bayesian regression for stacking time series predictive models,” in Proceedings of the 2020 IEEE 3rd International Conference on Data Stream Mining & Processing (DSMP) (Lviv: IEEE), 305–309.
Bradley, M. M., and Lang, P. J. (1994). Measuring emotion: the self-assessment manikin and the semantic differential. J. Behav. Ther. Exp. Psychiatry 25, 49–59.
Claas, L., Rainer, S., Peter, H., Joram, R., Moritz, M., Thomas, L., et al. (2008). Brief relaxation versus music distraction in the treatment of dental anxiety: a randomized controlled clinical trial. J. Am. Dent. Assoc. 139, 317–324.
Clark, D. L., Brown, E. C., Ramasubbu, R., and Kiss, Z. H. T. (2016). Intrinsic local beta oscillations in the subgenual cingulate relate to depressive symptoms in treatment-resistant depression. Biol. Psychiatry 80, 93–94.
Cohen, S., Kamarck, T., and Mermelstein, R. (1983). A global measure of perceived stress. J. Health Soc. Behav. 24, 385–396.
Davidson, R. J., Pizzagalli, D., Nitschke, J. B., and Putnam, K. (2002). Depression: perspectives from affective neuroscience. Annu. Rev. Psychol. 53, 545–574.
DeBerry, S. (1982). The effects of mediation-relaxation on anxiety and depression in a geriatric population. Psychother. Theory Res. Prac. 19, 51 2–521.
Deng, X., Yang, M., and An, S. (2021). Differences in frontal EEG asymmetry during emotion regulation between high and low mindfulness adolescents. Biol. Psychol. 158:107990.
Dombrowe, I., and Hilgetag, C. C. (2014). Occipitoparietal alpha-band responses to the graded allocation of top-down spatial attention. J. Neurophysiol. 112, 1307–1316.
Du, R., and Lee, H. (2015). “Frontal alpha asymmetry during the audio emotional experiment revealed by event-related spectral perturbation,” in Proceedings of the 2015 8th International Conference on Biomedical Engineering and Informatics (BMEI) (Shenyang: IEEE), 531–536.
Ernst, E., and Kanji, N. (2000). Autogenic training for stress and anxiety: a systematic review. Complement Ther. Med. 8, 106–110.
Freeman, D., Reeve, S., Robinson, A., Ehlers, A., Clark, D., Spanlang, B., et al. (2017). Virtual reality in the assessment, understanding, and treatment of mental health disorders. Psychol. Med. 47, 2393–2400.
Grey, J. S., Ruth, C., Michael, E. T., Matcheri, K., and Stuart, R. S. (2010). Sustained gamma-band EEG following negative words in depression and schizophrenia. Int. J. Psychophysiol. 75, 107–118.
Hosseinifard, B., Moradi, M. H., and Rostami, R. (2013). Classifying depression patients and normal subjects using machine learning techniques and nonlinear features from EEG signal. Comput. Methods Programs Biomed. 109, 339–345.
Hou, H., Zhang, X., and Hao, M. (2020). Odor-induced emotion recognition based on average frequency band division of EEG signals. J. Neurosci. Methods 334:108599.
Ilse, V. D., Karen, V., Andre, E. A., Devy, W., Debora, V., and Elke, V. (2014). Inhalation/exhalation ratio modulates the effect of slow breathing on heart rate variability and relaxation. Appl. Psychophysiol. Biofeedback 39, 171–180.
Imran, M., Mohd, E. R., Azmi, M. Y., Mohd, Z. M. Y., and Ahmad, R. R. Z. (2014). “Study of immersion effectiveness in VR-based stress therapy,” in Proceedings of the 6th International Conference on Information Technology and Multimedia (Putrajaya: IEEE), 380–384.
Jenke, R., Peer, A., and Buss, M. (2014). Feature extraction and selection for emotion recognition from EEG. IEEE Trans. Aff. Comp. 5, 327–339.
Joseph, W., Brianna, S. S., Antoine, L., and Richard, J. D. (2016). Long-term mindfulness training is associated with reliable differences in resting respiration rate. Sci. Rep. 6:27533.
Kan, D. P. X., and Lee, P. (2015). “Decrease alpha waves in depression: an electroencephalogram (EEG) study,” in Proceedings of the 2015 International Conference on BioSignal Analysis, Processing and Systems (ICBAPS) (Kuala Lumpur: IEEE), 156–161.
Kiefl, N., Figas, P., and Bichlmeier, C. (2018). “Effects of graphical styles on emotional states for VR-supported psychotherapy,” in Proceedings of the 2018 10th International Conference on Virtual Worlds and Games for Serious Applications (VS-Games), Würzburg, 1–4.
Kim, C., You, S. C., Reps, J. M., Cheong, J. Y., and Park, R. W. (2020). Machine-learning model to predict the cause of death using a stacking ensemble method for observational data. J. Am. Med. Inform. Assoc. 28, 1098–1107.
Knott, V., Bakish, D., Lusk, S., and Barkely, J. (1997). Relaxation-induced EEG alterations in panic disorder patients. J. Anxiety Disord. 11, 365–376.
Kwon, O. Y., Kam, S. C., Choi, J. H., Do, J. M., and Hyun, J. S. (2011). Effects of sertraline on brain current source of the high beta frequency band: analysis of electroencephalography during audiovisual erotic stimulation in males with premature ejaculation. Int. J. Impot. Res. 23, 213–219.
Lazar, S. W., Bush, G., Gollub, R. L., Fricchione, G. L., Khalsa, G., and Benson, H. (2000). Functional brain mapping of the relaxation response and meditation. Neuroreport 11, 1581–1585.
Li, Y., Zheng, W., Cui, Z., and Zong, Y. (2019). EEG emotion recognition based on graph regularized sparse linear regression. Neural Process. Lett. 49, 555–571.
Linda, G., Stefan, L., and Maic, M. (2020). “Playing in virtual nature: improving mood of elderly people using VR technology,” in Proceedings of the MuC ‘20 Conference on Mensch und Computer, Munich, 155–164.
Lolak, S., Connors, G. L., Sheridan, M. J., and Wise, T. N. (2008). Effects of progressive muscle relaxation training on anxiety and depression in patients enrolled in an outpatient pulmonary rehabilitation program. Psychother. Psychosom. 77, 119–125.
Narendra, J., Ramchandra, M., and Yashwant, J. (2017). Effect of meditation on emotional response: an EEG-based study. Biomed. Signal Process. Control 34, 101–113.
Nitin, K., Kaushikee, K., and Shyamanta, M. H. (2016). Bispectral analysis of EEG for emotion recognition. Procedia Comp. Sci. 84, 31–35.
Olga, S., Yisi, L., and Minh, K. N. (2011). Real-time EEG-based emotion recognition for music therapy. J. Multimodal User Interfaces 5, 27–35.
O’Sullivan, R. J. (1991). A musical road to recovery: music in intensive care. Intensive Care Nurs. 7, 160–163.
Patil, S., and Shirley, T. (2006). Effects of two yoga based relaxation techniques on Heart Rate Variability (HRV). Int. J. Stress. Manag. 13, 460–475.
Randy, P. A., Corina, B., Ronny, B., David, E., Eirini, K., and Ronald, C. K. (2019). The World Health Organization world mental health international college student initiative: an overview. Int. J. Methods Psychiatr. Res. 28:e1761.
Shu, L., Xie, J., Yang, M., Li, Z., Li, Z., Liao, D., et al. (2018). A review of emotion recognition using physiological signals. Sensors 18:2074.
Shu, L., Yu, Y., Chen, W., Hua, H., Li, Q., Jin, J., et al. (2020). Wearable emotion recognition using heart rate data from a smart bracelet. Sensors (Basel) 20:718.
Sidra, J. G., Avshalom, C., Honalee, H., Sean, H., Shyamala, N., Richie, P., et al. (2013). Suicide attempt in young people a signal for long-term health care and social needs. JAMA Psychiatry 71, 119–127.
Smith, J. C. (1988). Steps toward a cognitive-behavioral model of relaxation. Biofeedback Self Regul. 13, 307–329.
Smith, J. C. (2005). Relaxation, Meditation, and Mindfulness: A Mental Health Practitioner’s Guide to New and Traditional Approaches. New York, NY: Springer Publishing Co.
Soraia, M. A., and Manuel, J. F. (2019). Emotions recognition using EEG signals: a survey. IEEE Trans. Aff. Comp. 10, 374–393.
Suranjita, G., and Rajesh, S. (2019). Electrode channel selection for emotion recognition based on EEG signal Paper Presented at the 2019 IEEE 5th International Conference for Convergence in Technology (I2CT) (Bombay: IEEE), 1–4.
Theresa, M. M., and Hilary, B. (1992). The development of a six−item short−form of the state scale of the Spielberger State-Trait Anxiety Inventory (STAI). Br. J. Clin. Psychol. 31, 301–306.
Tommaso, M., Marinazzo, D., and Stramaglia, S. (2006). The measure of randomness by leave-one-out prediction error in the analysis of EEG after laser painful stimulation in healthy subjects and migraine patients. Clin. Neurophysiol. 116, 2775–2782.
Tortella-Feliu, M., Morillas-Romero, A., Balle, M., Llabrés, J., Bornas, X., and Putman, P. (2014). Spontaneous EEG activity and spontaneous emotion regulation. Int. J. Psychophysiol. 94, 365–372.
Wesley, E. S., and Douglas, E. D. (1977). Effect of EMG biofeedback and progressive muscle relaxation training on awareness of frontalis muscle tension. Psychophysiology 14, 522–530.
WHO (2020). E. coli. Mental Health: Global Strategic Direction. Available online at: https://www.who.int/observatories/global-observatory-on-health-research-and-development/analyses-and-syntheses/mental-health/global-strategic-direction (accessed December 28, 2020).
Xing, X., Li, Z., Xu, T., Shu, L., Hu, B., and Xu, X. (2019). SAE+LSTM: a new framework for emotion recognition from multi-channel EEG. Front. Neurorobot. 13:37. doi: 10.3389/fnbot.2019.00037
Zheng, W., and Lu, B. (2015). Investigating critical frequency bands and channels for EEG-based emotion recognition with deep neural networks. IEEE Trans. Auton. Ment. Dev. 7, 162–175.
Keywords: VR, EEG, relaxation state, regression model, machine learning, depression therapy
Citation: Zhang Y, Zhang L, Hua H, Jin J, Zhu L, Shu L, Xu X, Kuang F and Liu Y (2021) Relaxation Degree Analysis Using Frontal Electroencephalogram Under Virtual Reality Relaxation Scenes. Front. Neurosci. 15:719869. doi: 10.3389/fnins.2021.719869
Received: 03 June 2021; Accepted: 13 August 2021;
Published: 24 September 2021.
Edited by:
Jane Zhen Liang, Shenzhen University, ChinaReviewed by:
Xiujuan Zheng, Sichuan University, ChinaChao Chen, Tianjin University of Technology, China
Copyright © 2021 Zhang, Zhang, Hua, Jin, Zhu, Shu, Xu, Kuang and Liu. This is an open-access article distributed under the terms of the Creative Commons Attribution License (CC BY). The use, distribution or reproduction in other forums is permitted, provided the original author(s) and the copyright owner(s) are credited and that the original publication in this journal is cited, in accordance with accepted academic practice. No use, distribution or reproduction is permitted which does not comply with these terms.
*Correspondence: Lin Shu, shul@scut.edu.cn
†These authors share first authorship