 Tom Schonberg1* Craig R. Fox2,3 Jeanette A. Mumford4 Eliza Congdon5,6 Christopher Trepel2,7 Russell A. Poldrack1,4,8
- 1 Imaging Research Center, University of Texas at Austin, Austin, TX, USA
- 2 Anderson School of Management, University of California Los Angeles, Los Angeles, CA, USA
- 3 Department of Psychology, University of California Los Angeles, Los Angeles, CA, USA
- 4 Department of Psychology, University of Texas at Austin, Austin, TX, USA
- 5 Department of Psychiatry, Semel Institute for Neuroscience and Human Behavior, University of California Los Angeles, Los Angeles, CA, USA
- 6 Center for Neurobehavioral Genetics, Semel Institute for Neuroscience and Human Behavior, University of California Los Angeles, Los Angeles, CA, USA
- 7 Consumer Credit Research Institute, Encore Capital Group, San Diego, CA, USA
- 8 Department of Neurobiology, University of Texas at Austin, Austin, TX, USA
Functional imaging studies examining the neural correlates of risk have mainly relied on paradigms involving exposure to simple chance gambles and an economic definition of risk as variance in the probability distribution over possible outcomes. However, there is little evidence that choices made during gambling tasks predict naturalistic risk-taking behaviors such as drug use, extreme sports, or even equity investing. To better understand the neural basis of naturalistic risk-taking, we scanned participants using fMRI while they completed the Balloon Analog Risk Task, an experimental measure that includes an active decision/choice component and that has been found to correlate with a number of naturalistic risk-taking behaviors. In the task, as in many naturalistic settings, escalating risk-taking occurs under uncertainty and might be experienced either as the accumulation of greater potential rewards, or as exposure to increasing possible losses (and decreasing expected value). We found that areas previously linked to risk and risk-taking (bilateral anterior insula, anterior cingulate cortex, and right dorsolateral prefrontal cortex) were activated as participants continued to inflate balloons. Interestingly, we found that ventromedial prefrontal cortex (vmPFC) activity decreased as participants further expanded balloons. In light of previous findings implicating the vmPFC in value calculation, this result suggests that escalating risk-taking in the task might be perceived as exposure to increasing possible losses (and decreasing expected value) rather than the increasing potential total reward relative to the starting point of the trial. A better understanding of how neural activity changes with risk-taking behavior in the task offers insight into the potential neural mechanisms driving naturalistic risk-taking.
Introduction
To date, functional imaging studies examining neural correlates of risk-taking have generally assumed an economic conception of risk defined as the variance of the probability distribution over possible outcomes (Markowitz, 1952). Thus, many functional imaging studies have relied on paradigms that were adapted for use with fMRI and involve exposure to simple chance gambles. These studies have asserted that regions such as the dopaminergic midbrain, the striatum, and anterior insula code risk (Paulus et al., 2003; Kuhnen and Knutson, 2005; Preuschoff et al., 2006) and that the insula codes risk prediction errors (Preuschoff et al., 2008).
While imaging studies using chance gambles have been interesting and informative, they provide an incomplete account of naturalistic risk-taking behavior. First, there is only modest evidence that choices among chance gambles in the laboratory can predict naturalistic risk-taking behaviors, such as drug abuse, physically risky sports, or even aggressive financial investment (Figner and Weber, 2011; Fox and Tannenbaum, 2011; Schonberg et al., 2011). Although a few studies have documented some successes (Barsky et al., 1997; Pennings and Smidts, 2000; Brown et al., 2006; Jaeger et al., 2010) others have failed to do so (e.g., Brockhaus, 1980) or have found that a simple self-report question about general risk propensity predicts naturalistic risk-taking more consistently (Dohmen et al., 2011). Naturally, such self-reports do not lend themselves to imaging studies, but can serve as covariates to fMRI-compatible tasks. Second, some fMRI-adapted laboratory tasks (e.g., Preuschoff et al., 2006; Tobler et al., 2007) have not included an active decision component, whereas others that do (e.g., Christopoulos et al., 2009; Tobler et al., 2009) may fail to evoke the dynamic, anticipatory emotions accompanying naturalistic risky decisions (Loewenstein et al., 2001), such as escalating tension and exhilaration.
In contrast to chance gamble paradigms, The Balloon Analog Risk Task (BART, Lejuez et al., 2002) captures the escalating tension, which is often inherent to naturalistic risk-taking, and has also been found to predict several naturalistic risk-taking behaviors. In the BART, participants sequentially pump puffs of air into a balloon depicted on a computer screen (Figure 1). On each trial a participant earns a fixed amount of money for each successful pump (i.e., that expands, but does not break the balloon) but loses the accumulated amount if the balloon explodes before the participant stops pumping the balloon and cashes out. Subjects are unaware of the explosion probability of the balloon and thus the decision to pump or cash-out is made under uncertainty. The average number of pumps across all trials has been shown to correlate with self-reports of risk-taking behaviors such as stealing, unprotected sex, smoking, and substance abuse in adults and adolescents (Lejuez et al., 2003a,b, 2004, 2007; Bornovalova et al., 2005).
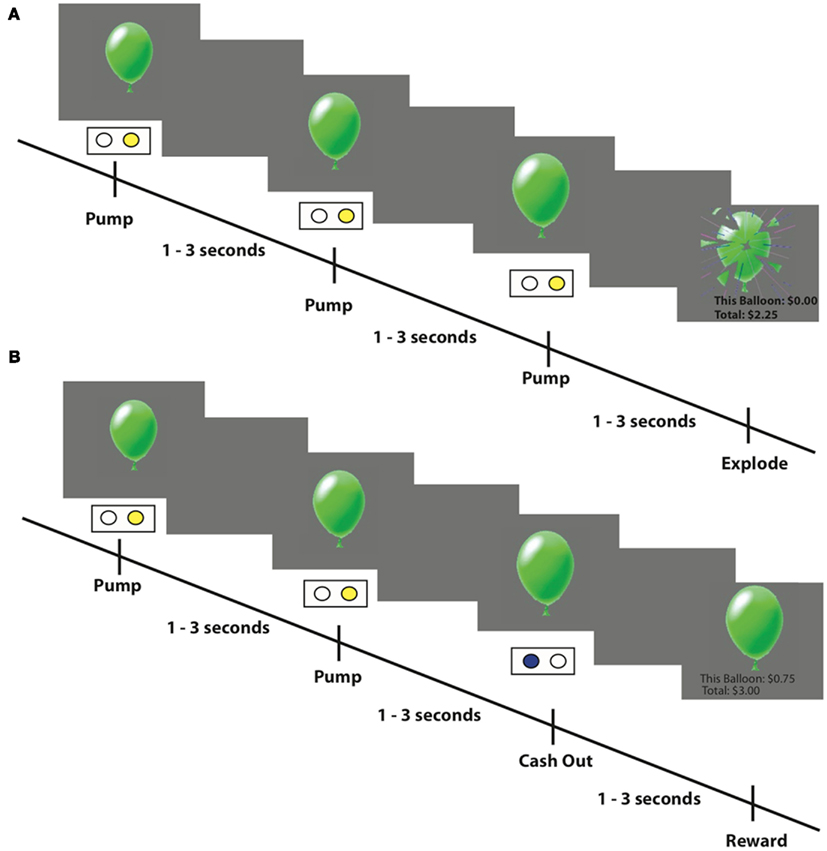
Figure 1. Example trials from the fMRI-adapted BART task. (A) An example of an explosion trial: participants press one of two buttons to inflate puffs of air into a balloon presented on a computer screen. Every successful pump adds $0.25 to their temporary bank for that trial. If the balloon explodes before the participant cashes out then nothing is won on that trial. However, an explosion does not affect the cumulative total winnings earned on prior trials. (B) An example of a cash-out trial where the participant decided to stop pumping the balloon and earn the amount accumulated up to that point.
The goal of the current study was to identify the neural systems associated with risk-taking in the BART. In the task, as in natural environments, taking a risk (making an additional pump) can result in increased potential gains but also increases the likelihood of potential losses. This raises the question of whether participants cognitively represent the task in terms of the potential total reward relative to the starting point of a given trial (so that the potential gain rises with continued pumping) or in terms of possible losses and gains relative to a reference point that shifts after each successful pump (so that loss exposure increases and expected value decreases with continued pumping). Interestingly, when Wallsten et al. (2005) compared the predictive power of computational learning models to account for participants’ behavior in the BART, they found that two models best fit the data. The results marginally favored the model suggesting that people focus on accumulating rewards relative to the starting point of a trial over a model in which participants evaluated gains and losses relative to an updating reference point. However, several studies found that lay perceptions of risk tend to increase with greater exposure to possible harm or loss (e.g., March and Shapira, 1987), and behaviors such as drug use, stealing, and base jumping are often labeled “risky” because they can result in loss or harm to oneself or others (e.g., Furby and Beyth-Marom, 1992). In the current study we used fMRI data to investigate the cognitive representation of risk-taking in the BART, which can potentially inform how people frame risk-taking in naturalistic settings. A prior fMRI study of the BART (Rao et al., 2008) did not address this issue directly and focused on comparisons between active and passive risk-taking. That study also modeled risk in the task differently and did not have subjects play for real money.
Previous studies using static choice tasks involving chance gambles have found that activity in the ventromedial prefrontal cortex (vmPFC) correlates with decision values for a wide range of different rewards (Rangel and Hare, 2010) and is consistent with value integration (Rushworth et al., 2011). Based on these findings, we suggest that if participants represent the value of each pump as an accumulated reward relative to the starting point of the trial, we would expect an increasing activation in vmPFC with increasing pumps. If, on the other hand, participants update their reference point after each pump, we would expect decreasing vmPFC activity as the number of pumps increases. A better understanding of how neural activity changes with risk-taking behavior in these systems during the BART may shed new light on potential neural mechanisms driving naturalistic risk-taking, including instances of impaired decision-making such as addiction.
Materials and Methods
Participants
Sixteen healthy, right-handed volunteers (six males; mean age 23.6 ± 2.9 years) were recruited via advertisements on the UCLA campus. All subjects were free of neurological or psychiatric history and gave informed consent according to a University of California, Los Angeles Institutional Review Board protocol. Subjects were informed that they would be compensated on the basis of task performance.
Task
In the BART (Figure 1), subjects inflate simulated balloons, and accrue monetary rewards for each successive “pump” during a particular trial. A trial is defined as a balloon that can be pumped a certain number of times and the trial can conclude in two different ways. First, the participant may “cash-out” at any point during the trial and secure the cumulative winnings up to that point for that balloon in their cumulative total “bank.” Second, a balloon may explode; in this case, participants would lose the money accumulated on that trial alone (but not the total accumulated during previous cash-out trials). In our fMRI-adapted version of the BART, each trial began with a balloon displaying a value of $0.25 and the value of the balloon increased by $0.25 for each successive pump. An explosion did not affect the cumulative total earnings from previous cash-out trials, which was displayed at the bottom of the screen at the end of each trial. During each trial, participants were presented with one of three types of “reward” balloons, each having a different explosion probability and signified by a different color: red, green, or blue. The maximum number of pumps allowed during each trial was determined by drawing a random number from a uniform distribution with maximum values of 8, 12, and 16, respectively. Thus, the explosion probability of each additional pump within a trial increased exponentially during the trial, at different rates for different color balloons. Participants were informed that balloon colors may signify differing explosion distributions, but were not provided any specific information about the explosion parameters. As a control task, participants intermittently inflated a gray “control” balloon (maximum 12 pumps) that did not explode and had no associated monetary value. The participants were instructed to inflate the control balloon until it disappeared from the screen (pumps ranged from 1 to 12, average 6.4 inflations) and the next trial began. Unlike with reward balloons, participants had no control over how many times they could inflate the control balloon before the trial ended. The order in which trials were presented was randomized among these four balloons.
Procedure
Participants were given instructions and a short demonstration of the task before entering the scanner. They were instructed to use two buttons on a button box: the right pointer finger to inflate the balloon, and the right middle finger to cash-out. Inter-stimulus (pump) intervals varied between 1 and 3 s and inter-trial (balloon) intervals varied between 1 and 12 s with a mean of 4 s; these intervals were chosen in order to maximize de-convolution of the hemodynamic response of each individual event. The task was self-paced, and therefore the number of trials varied for each participant. Three scanning runs each lasted 10 min unless the participant ran out of balloons (each participant was allowed a maximum of 12 of each of the different balloons, including the control balloon), which also terminated the run. Stimulus presentation and recording of responses was conducted using MATLAB 6 and Psychtoolbox1, on a PowerBook G4 running Mac OS9. Visual stimuli were presented using MRI-compatible goggles (Resonance Technologies, Van Nuys, CA, USA).
Behavioral Analysis
For each participant, for each of the three sessions, and for each of the three balloon types we calculated the total and average number of pumps. In addition, we calculated the total and average number of pumps only for trials when the participant cashed out before the balloon exploded (we refer to the latter measure as “adjusted pumps,” which has been found to have higher predictive validity for self reported risk-taking; Lejuez et al., 2002). We also calculated the total and average number of cash-out trials, the average sum won on each trial, and the average reaction time (RT) for all pumps, cash-outs, and of the first and last pump from each trial. We performed a repeated measures ANOVA to compare these variables across the three sessions and three balloons. Statistical analyses of behavioral data were conducted using PASW Statistics Version 18.0.
MRI Data Acquisition
Imaging was conducted using a 3T Siemens AG (Erlangen, Germany) Allegra MRI scanner at the Ahmanson-Lovelace Brain Mapping Center at UCLA. Participants first received a short localizer scan, followed by a T2-weighted matched-bandwidth high-resolution structural scan, which matched the prescription of the functional runs. In each functional run, up to 300 functional T2*-weighted blood-oxygen level-dependent (BOLD) echoplanar (EPI) images were acquired [34 contiguous 4 mm oblique axial slices; repetition time (TR) of 2 s, echo time (TE) of 30ms; matrix, 64 × 64; flip angle 90°]. A full structural magnetization-prepared rapid-acquisition gradient echo (MPRAGE) scan was conducted for each participant following the functional runs (TR, 2.3; TE 2.1; FOV 256; matrix, 192 × 192; sagittal plane; slice thickness, 1 mm; 160 slices). The data are available from the OpenfMRI repository2.
Image Preprocessing and Registration
Data analysis and preprocessing were conducted using FSL 4.1.6 software tools3. The first two volumes were discarded to allow for T1 equilibrium effects. The remaining images were then realigned using MCFLIRT to compensate for small head movements. Translational movement parameters did not exceed 2 mm in any direction. The data were highpass-filtered in the temporal domain using a Gaussian-weighted least-squares straight line fitting, with sigma = 50.0 s. Brain extraction was done using BET. Affine spatial normalization was done using FLIRT and motion correction. Data were spatially smoothed using a 5-mm full-width-half-maximum Gaussian kernel. A three-step registration procedure was used by first registering BOLD EPI images to the matched-bandwidth high-resolution structural scan, then to the MPRAGE image, and finally into standard Montreal Neurological Institute (MNI) space. Statistical analyses of functional data were performed in native space, with the statistical maps normalized to standard space prior to higher-level analyses.
fMRI Analysis
Analysis of functional data was done using a multi-stage general linear model approach with FEAT, in which event modeling was performed separately for each run using a canonical double-gamma hemodynamic response function. The three runs for each participant were then averaged together in a higher-level fixed-effects model. The group-level analysis was performed using the FMRIB Local Analysis of Mixed Effects 1 module in FSL (Beckmann et al., 2003). Outliers were automatically de-weighted in the multi-subject statistics using mixture modeling as implemented in FSL (Woolrich, 2008). Group analysis Z statistic images were prepared to show clusters determined by a height threshold of Z > 2.3 and an extent threshold of p < 0.05, corrected using the theory of Gaussian random fields (Poline et al., 1997), and all data shown in the figures adhere to these thresholds. For visualization purposes, statistical maps of all analyses were projected onto a study-specific average brain of the participants.
fMRI Model
In the general linear model we defined several regressors for each of the three types of events occurring in the task: pumps, cash-outs, and explosions. For the pumps we included three regressors:
(1) PumpsAverage: average activity across all pumps with fixed duration and without parametric modulation.
(2) PumpsParametric: parametrically modulated activity by the demeaned number of pumps (linearly increasing) within each trial and with fixed duration.
(3) PumpsRT: average activity across all pumps with duration of pumps set to the actual RT of each pump.
For the first two regressors, we used the average RT for all pumps across all participants. The third regressor (PumpsRT) was orthogonalized with respect to the average activity regressor (PumpsAverage). The RT regressor was included to account for brain activity related to RT effects (see Grinband et al., 2008, 2010) across pumps. These three regressors were also included for the control balloons (ControlAverage; ControlParamertic; and ControlRT), to account for the motor and visual activity occurring when pumping balloons with no potential monetary reward or explosions. For the cash-out events we included three similar regressors (CashAverage; CashParametric; and CashRT). However, because there could be only one cash-out (or explosion) event for each trial (as opposed to multiple pumps within each trial), the demeaning of the pump number on which the cash-out (explosion) occurred was done across trials, rather than within trials. For the explosion events we included two regressors: ExplodeAverage and ExplodeParametric as there was no measured RT associated with explosions. Temporal derivatives were included as covariates of no interest to improve statistical sensitivity. Null events, consisting of the jittered inter-trial intervals when the screen was blank, were not explicitly modeled and therefore constituted an implicit baseline.
Results
Behavioral Results
The average number of pumps differed significantly between the different colored balloons (Table 1) suggesting that participants learned to differentiate between the balloons’ explosion thresholds, despite the fact that they were not explicitly informed that these balloons differed in their underlying explosion probabilities. The average number of pumps on cash-out trials was lower than the average tolerance of the balloons [3.53, 3.99, and 4.82 for the average balloon tolerances of 4 (8 max), 6 (12 max), and 8 (16 max) pump balloons, respectively], suggesting that participants were, on average, risk-averse. In particular, a risk-neutral participant would maximize expected payout if she pumped to the level of the average tolerance for every balloon. We ran a repeated measures ANOVA with factors BALLOON and RUN to test the interaction between these factors but the interaction was never significant. For almost all of the behavioral variables there was a significant main effect of BALLOON, but no effect of RUN (Table 1; Figure 2). That said, participants apparently adjusted their behavior as the task progressed, as seen in the significant RUN effect for the average cash-out RT (i.e., the RT decreased across runs) and a smaller but significant effect of the RT of pumps, but only on cash-out trials. No effect of BALLOON was noted for any of the RT variables.
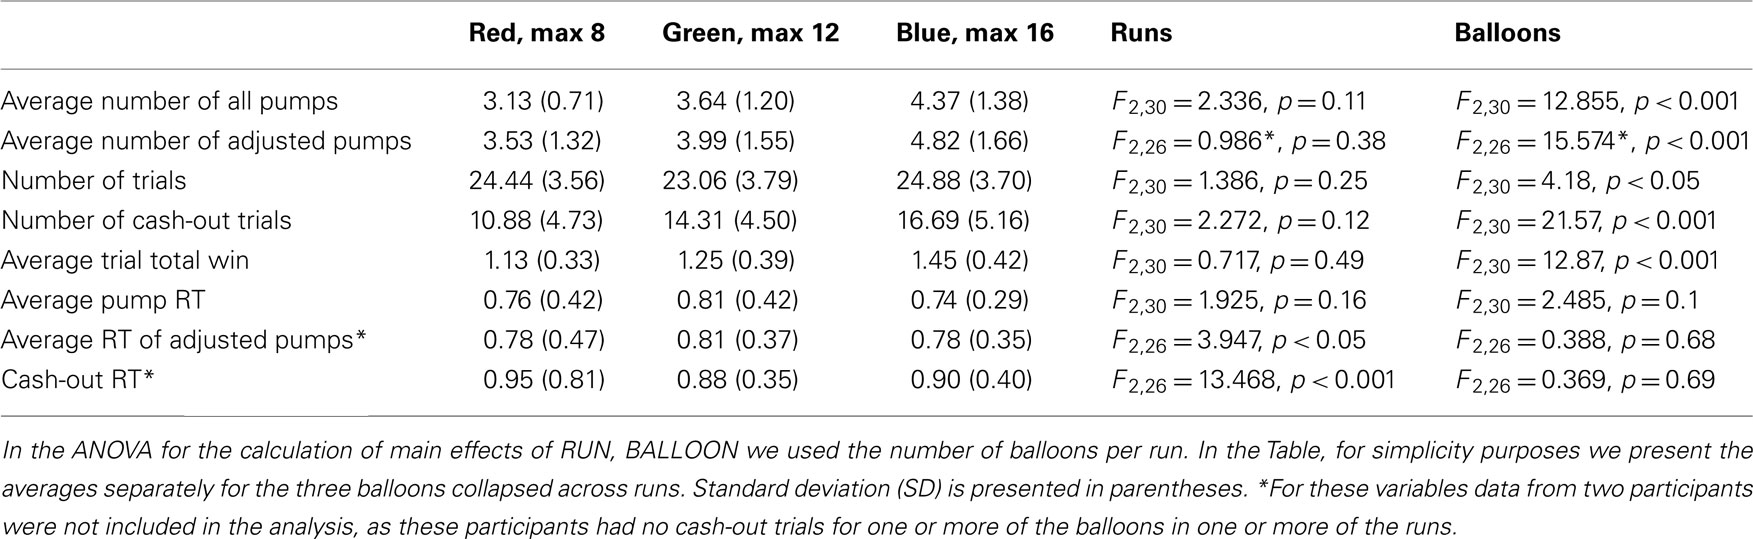
Table 1. Statistical analyses of behavioral variables from the task (SD in parentheses).
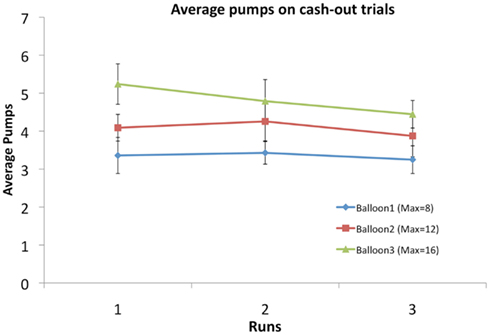
Figure 2. Average number of pumps for the three balloon types across the three fMRI runs. There was no significant effect of RUN but there was a significant effect of BALLOON, indicating participants differentiated between the three types (see Table 1).
Neuroimaging Results
Different task-related events (pumps, cash-outs, explosions) activated distinct regions of the reward-based decision-making network. We now review the results for each event separately (see Table 2 for a complete listing of coordinates).
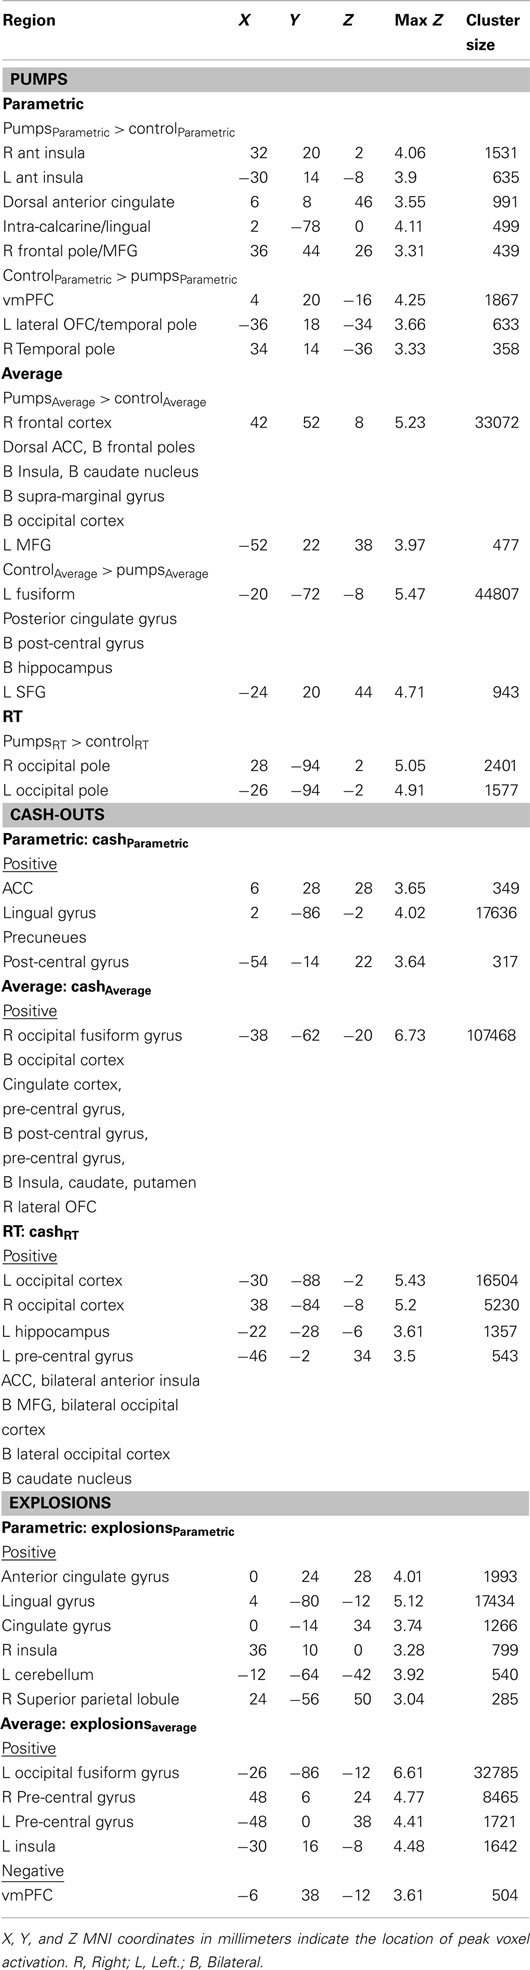
Table 2. Peaks of significant clusters of activation.
Pumps
Active risk-taking in the BART is captured by the sequential pumping of the rewarded balloons. Therefore, we focused on the parametric modulation of the rewarded balloons pumps, subtracting the parametric modulation of the control balloon pumps (thus removing visual and motor effects unrelated to risk and reward). Our behavioral results show that participants modulated their choice behavior coincident with the balloons’ different explosion probabilities. We separately modeled participants’ pump responses across the three rewarded balloons. However, we found no significant differences between the activity elicited during pumping of the different balloons, possibly due to power limitations arising from the limited number of trials for each balloon type. Therefore, we collapsed the rewarded balloons into a single regressor. We demeaned the number of pumps within each trial to capture the escalating explosion (“tension”) probability and potential gain and/or loss associated with each of the three unique balloon types.
Parametric effects. For the positive contrast of parametric modulation by pump number (PumpsParametric > ControlParametric) we found significant activations in the bilateral anterior insula, dorsal anterior cingulate cortex (ACC), and right dorsolateral prefrontal cortex (DLPFC; Figure 3A, red). Each of these regions has been associated with risk (traditionally defined as variance in the probability distribution over possible outcomes) in previous studies (Preuschoff et al., 2006, 2008). More importantly, when we tested the negative of this contrast (i.e., ControlParametric > PumpsParametric) we found highly focused vmPFC activation (Figure 3A, Blue) as well as bilateral medial temporal lobe (MTL) activation. The same effect was observed in vmPFC (as well as posterior cingulate) in the Baseline > PumpsParametric contrast, suggesting that this effect is not driven by the response to the control balloons.
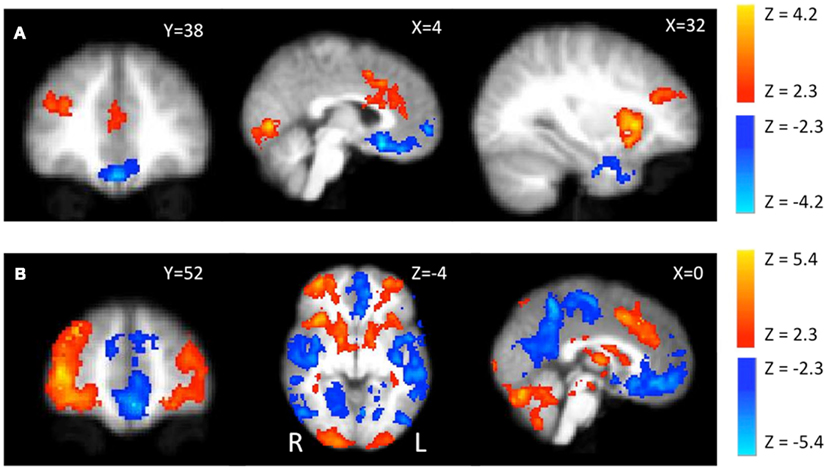
Figure 3. fMRI activations during pumping. (A) Parametric modulation of increasing number of pumps of the rewarded balloons (subtracted by the parametric modulation of the control balloon). Red scale presents PumpsParametric > ControlParametric and blue scale presents ControlParametric > PumpsParametric.(B) Average activity during pumps (subtracted by the average activity of pumping the control balloon). Red scale presents PumpsAvergae > ControlAverage and blue scale presents ControlAverage > PumpsAverage.
Average activity. We observed widespread and significant positive effects for average activity during pumps (Figure 3B), subtracting average activity during control pumps (PumpsAverage > ControlAverage), in bilateral insula, dorsal ACC, caudate, lateral orbito-frontal cortex (OFC), frontal poles, and the visual and parietal cortices. Moreover, there was widespread activation with the negative of this contrast (i.e., ControlAverage > PumpsAverage) in the default mode network (Smith et al., 2009), which includes frontal, parietal, and temporal cortices.
Reaction time. PumpsRT > ControlRT revealed bilateral occipital pole activations. There were no activations for the negative of this contrast (i.e., ControlRT > PumpsRT).
Cash-outs
Parametric effects. For the parametrically modulated cash-out regressor there were clusters of activation in ACC as well as in areas that have not been emphasized in the reward/risk related literature (including planum temporale, precuneus, and visual areas). No regions showed a negative correlation with the parametrically modulated cash-out regressor.
Average activity. Cash-out events led to significant activations across many dopamine-innervated regions including cingulate cortex, bilateral insula, and striatal regions (Figure 4A). This event has been interpreted as a “win” in a previous BART study (Rao et al., 2008). However, it might also be interpreted as the alleviation of the tension that would have been caused by continued exposure to risk (i.e., “relief”). Cash-outs have a completely predicted outcome, as participants already know exactly how much money will be transferred to their bank when they decide to cash-out. No regions showed a negative correlation with average activity during cash-outs.
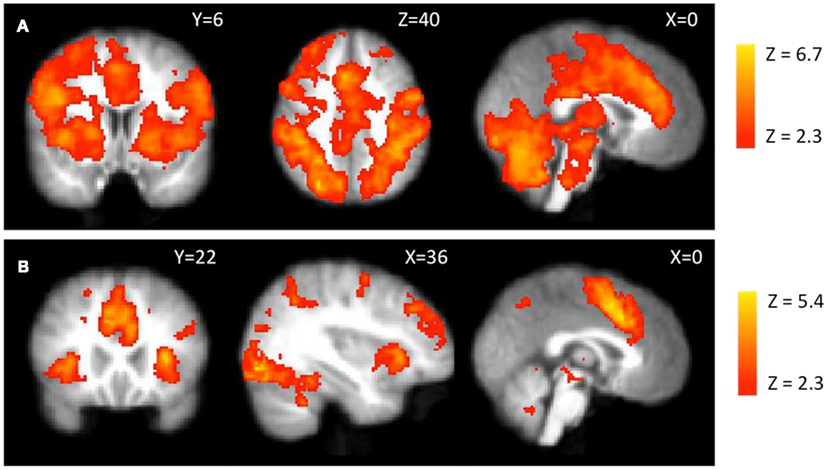
Figure 4. fMRI activations during cash-outs. (A) Average activity during cash-out events. (B) Reaction time modulated activity during cash-out events.
Reaction time. Cash-out activity modulated by cash-out RT (Figure 4B) was seen in visual areas, parahippocampal areas and also in regions previously related to risk including bilateral anterior insula, middle frontal gyrus (MFG), and dorsal ACC. No regions showed a negative correlation with average activity modulated by actual cash-out RT.
Explosions
Parametric effects. For parametrically modulated activity during explosions, we observed activations in the anterior and posterior cingulate cortex, and right inferior frontal gyrus (Figure 5A). No regions showed a negative correlation with parametrically modulated explosion activity.
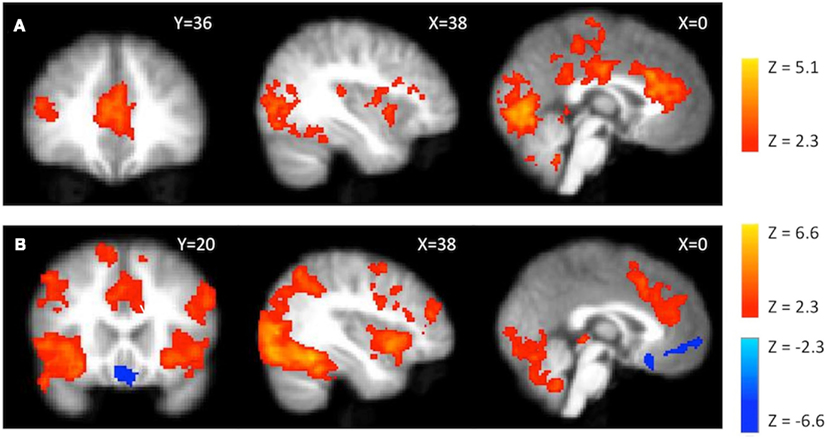
Figure 5. fMRI activations during explosions. (A) Parametrically modulated activity (by number of pumps) during explosion events. (B) Average activity during explosion events. Red scale presents positive activations and blue scale presents the negative of the contrast.
Average activity. During explosions, activity was seen in bilateral insula, ACC, parietal, and superior frontal gyrus (Figure 5B). However, unlike a previous BART fMRI study (Rao et al., 2008), we observed no positive or negative activity in the ventral striatum (i.e., no indication of a negative prediction error signal). The activation for the negative of this contrast was focused within vmPFC.
Discussion
To investigate the neural basis of naturalistic risk-taking, we scanned participants using fMRI while they completed the BART, an experimental measure that includes an active decision/choice component and that has been found to correlate with naturalistic risk-taking behaviors (Lejuez et al., 2002, 2003a,b). In this task, as in many naturalistic settings, escalating risk-taking might be perceived as the accumulation of greater potential rewards or as exposure to increasing possible losses and therefore decreasing marginal expected value. We found that vmPFC activity decreased as the number of pumps increased. In light of previous findings implicating vmPFC in value calculation (e.g. Rushworth et al., 2011), we believe that this result may suggest that escalating risk-taking in the task may be perceived as exposure to increasing possible losses (and decreasing marginal expected value) rather than as an increasing potential aggregate reward relative to the starting point of the trial (see below for alternative interpretations of this result). In addition we found that activations in bilateral anterior insula, ACC, and right DLPFC correlated positively with increasing number of pumps. Activations in all of these regions have been previously found to correlate with risk and/or risk-taking, though they have also been associated more generally with task difficulty and error monitoring.
In the original BART, and in the version used in the current study, each successful pump increases the potential trial reward by a fixed amount. At the same time, each successful pump increases the amount that a participant could potentially lose on the next pump, as well as the likelihood that the next pump will result in an explosion. Wallsten et al. (2005) compared several computational learning models to account for participants’ behavior in the BART. In particular, they examined two potential cognitive representations of the decision to continue pumping (or not). They suggested that, on each pump, participants might consider: (a) the total value of the potential gain they will receive if the balloon does not explode, relative to the trial starting point, or (b) the sequentially updated marginal value that each additional pump will add (if the balloon does not explode) or subtract (if it does explode), relative to the current accumulated gain. Their results did not lead to a definitive conclusion but the authors found evidence supporting the first representation. However, our results support the second representation and favor the suggestion that participants dynamically update the value of each additional pump until the subjective value of the next pump is negative. In this value calculation, the potential amount of gain over pumps is considered constant across pumps (but decreases in probability) while the possible amount of loss is perceived to increase with every pump (and increases in probability). Although this is only one possible interpretation of the results (see other possibilities below) it accords with the common lay and clinical view of risk as increasing with greater exposure to loss or harm (March and Shapira, 1987; Furby and Beyth-Marom, 1992).
Previous findings suggest that the vmPFC encodes different types of decision values (Plassmann et al., 2008; Chib et al., 2009; Glascher et al., 2010; Hare et al., 2010) and acts as a value integrator (Rushworth et al., 2011). Thus, our finding of decreasing vmPFC activation, coinciding with participants decision to further inflate the balloon, suggests that they may be updating their reference point when assessing the possible consequences of each additional pump. Moreover, the current study is the first to provide evidence consistent with such a value representation in a sequential risk-taking task. We note that activity in the vmPFC has been shown to parametrically increase (decrease) with potential gains (losses) when participants were deciding whether or not to accept mixed gambles that offer a 50-50 chance of gaining (or else losing) various amounts of money (Tom et al., 2007). This result is consistent with the notion that participants focus their attention on potential losses from each additional pump rather than on the sequential marginally added value. Unfortunately, we cannot distinguish between these two interpretations because the expected value of an additional pump and the potential loss are perfectly correlated in the BART.
A previous imaging study of the BART (Rao et al., 2008) did not report any evidence of a value signal encoded in the vmPFC. This might be either due to the lack of reporting any negatives of the main contrasts and corresponding activations and/or due to the fact that the study used different value and explosion functions and that the participants did not play for real money. A recent investigation into the link between alcohol dependence and risk-taking behavior in the BART (Bogg et al., 2011) also did not report vmPFC activations for any contrast, but this may be due to the use of a very different version of the BART that separated the outcome of each pump from the next decision. It should be noted that both of these studies parameterized risk as the objective explosion probability of each balloon. We chose to use the demeaned number of pumps for each balloon (rather than the objective explosion probability known only to an ideal observer) since our behavioral results suggested that subjects did not have an accurate estimation of the actual explosion probabilities for each balloon (see Figure 2; Table 1). The choice to demean each pump within a trial compared to that trial’s average encapsulates the different explosion probabilities of the different balloons (since the average pumps per balloon were significantly different) while testing for the increasing tension with each increasing pump. Unfortunately, the number of trials per balloon type and the sample size of this study did not allow us to perform a proper fit of a learning model to estimate the subjective explosion probability of each subject on a trial by trial basis. The current sample size also did not allow examination of individual differences (on the required sample size for individual differences related to risk-taking in the task see Yarkoni, 2009).
The regions that exhibited activations with increased risk-taking in the present version of the BART (bilateral insula, ACC, and right DLPFC) were the same as those identified with a different version of the BART (Rao et al., 2008). First, the insula has been previously shown to encode economic risk (as defined by variance in the probability distribution over possible outcomes; Preuschoff et al., 2006, 2008) and likewise in the BART, each additional pump leads to increased variance in the probability distribution over possible outcomes. Activity in the insula has also been previously shown during active risk-taking tasks and specifically to be more active when choosing to avoid risk (Paulus et al., 2003; Kuhnen and Knutson, 2005). Second, increasing ACC activation has been previously observed with increasing decision conflict, error likelihood (Alexander and Brown, 2011), and action selection (see recent review by Rushworth et al., 2011). The ACC (and anterior insula) are the most commonly activated regions in neuroimaging studies (Nelson et al., 2010; Yarkoni et al., 2011). This may be due to the fact that task difficulty generally correlates with prolonged RTs, which might have led to increased fMRI activations. Recently, Grinband et al. (2010) demonstrated this by showing that RT effects correlated with activity in dorsal ACC beyond the conflict in a Stroop task. It is important to note that we observed ACC and insula activations that persisted when controlling for RT. This could be an indication that the difficulty of the decision increased during each subsequent pump of the balloon. To our knowledge, our study is the first in the risk-taking domain to account for RT effects. Third, an additional manipulation used by the authors in a previous BART study (Rao et al., 2008) tested active versus passive risk-taking in the task and found that right DLPFC was active when participants were taking active compared to passive risk. Fecteau et al. (2007) were able to reduce risk-taking in the BART by enhancing DLPFC activity using transcranial direct current stimulation (tDCS). In a task very similar to the BART (the Devil’s task), Gianotti et al. (2009) found a negative correlation between tonic activity in the DLPFC and risk-taking. Studies using other risk-taking tasks have shown that temporarily disrupting DLPFC activity, using repetitive transcranial magnetic stimulation (rTMS), led to increased risk-taking (Knoch et al., 2006). DLPFC activity has been also demonstrated while exerting self-control in a task where participants needed to choose healthy over unhealthy food items (Hare et al., 2009). All of these studies support the conclusion that DLPFC activity is required in order to exert cognitive control and reign in continued risk-taking. We interpret our result showing increasing DLPFC activation with increased pumping as reflecting the increased engagement of self-control, which drives subjects to stop pumping as the balloons increase in size and are more likely to explode.
There is an intriguing similarity between our results and those of Campbell-Meiklejohn et al. (2008). Using a loss-chase paradigm, in which participants decide to either accept a small loss or else continue gambling and thereby increase or expunge that loss, the authors found that loss-chasing correlated with an increase in vmPFC activity. Concurrently, when participants stopped chasing losses the authors saw an increase in activity in ACC, anterior insula, and frontal regions. Thus, loss-chasing might be seen as an anti-BART paradigm in the sense that when participants are chasing losses they appear to be focused on the increasing potential loss.
There are two main caveats to the present study. First, because we followed the design of the original BART as closely as possible, participants in our task were required to learn the explosion probabilities of the different balloon types from experience while making pumping decisions. Our behavioral results show that participants did not change their choice behavior significantly over the three task sessions, suggesting that they rapidly learned the properties of the task. As noted above, a computational learning model has been proposed for a similar version of the BART (Wallsten et al., 2005) that parameterizes subjective probabilities of explosion for each pump. The sample size in the current study did not allow the use of this model and thus future studies with much larger sample sizes will be needed to test whether such a model applies to the fMRI-adapted design that we employed here. Second, our interpretation of how participants appear to have framed the task relies on a reverse inference (see review by Poldrack, 2006): we surmise from involvement of the vmPFC that the participants assessed the marginal decreasing expected value of each successive pump and/or focused on increasing loss exposure rather on total potential gains relative to the starting point of the trial. We feel this inference may be justified because analysis of the NeuroSynth database4 (Yarkoni et al., 2011) shows that the closest non-empty coordinate to our peak activation in vmPFC ([4, 24, −16], which is included in the activation cluster) has a very high posterior probability of terms associated with choice [P(“choice” present in paper | activation) = 0.88] and losses (posterior probability of “losses” = 0.84). This region is also often associated with the default mode network (Smith et al., 2009), and an alternative interpretation of the results might be that with increasing pumps participants are more and more engaged in the task and thus, vmPFC activity could simply reflect activity in the default mode network. However, the association of the same voxel with the term “resting state” is weaker (posterior probability = 0.76). These meta-analytic results suggest that our reverse inference may be reasonable, though these inferences must remain tentative until tested using an alternative design of the task that will allow a more direct test of this interpretation.
In summary, we show using the unique design of the BART that while activity parametrically increased in anterior insula, dorsal ACC, and DLPFC with the additional risk associated with each pump, activity in vmPFC parametrically decreased with each successive pump of the balloon. Although this is only one possible interpretation, it suggests that even under the dynamic conditions of the task, participants encoded the decreasing subjective value of each pump and/or focused on the increasing potential losses until they decided to stop pumping. Identifying these two opposing brain systems during BART performance, the one increasing and the other decreasing, suggests that increased naturalistic risk-taking, as previously shown to be measured using the task, might be attributed to an abnormality in one (or both) of these brain systems.
Conflict of Interest Statement
The authors declare that the research was conducted in the absence of any commercial or financial relationships that could be construed as a potential conflict of interest.
Acknowledgments
This work was supported by NSF DMI-0433693 (R. Poldrack and C. Fox, principal investigators, PIs). We would like to thank Elena Stover for assistance with data collection and for helpful comments on an earlier version of this manuscript.
Footnotes
References
Alexander, W. H., and Brown, J. W. (2011). Medial prefrontal cortex as an action-outcome predictor. Nat. Neurosci. 14, 1338–1344.
Barsky, R. B., Juster, F. T., Kimball, M. S., and Shapiro, M. D. (1997). Preference parameters and behavioral heterogeneity: an experimental approach in the health and retirement study. Q. J. Econ. 112, 537–579.
Beckmann, C., Jenkinson, M., and Smith, S. (2003). General multilevel linear modeling for group analysis in fMRI. Neuroimage 20, 1052–1063.
Bogg, T., Fukunaga, R., Finn, P. R., and Brown, J. W. (2011). Cognitive control links alcohol use, trait disinhibition, and reduced cognitive capacity: evidence for medial prefrontal cortex dysregulation during reward-seeking behavior. Drug Alcohol Depend. 122, 112–118.
Bornovalova, M. A., Daughters, S. B., Hernandez, G. D., Richards, J. B., and Lejuez, C. W. (2005). Differences in impulsivity and risk-taking propensity between primary users of crack cocaine and primary users of heroin in a residential substance-use program. Exp. Clin. Psychopharmacol. 13, 311–318.
Brown, S., Farrell, L., Harris, M., and Sessions, J. (2006). Risk preference and employment contract type. J. R. Stat. Soc. Ser. A Stat. Soc. 169, 849–863.
Campbell-Meiklejohn, D. K., Woolrich, M. W., Passingham, R. E., and Rogers, R. D. (2008). Knowing when to stop: the brain mechanisms of chasing losses. Biol. Psychiatry 63, 293–300.
Chib, V. S., Rangel, A., Shimojo, S., and O’Doherty, J. P. (2009). Evidence for a common representation of decision values for dissimilar goods in human ventromedial prefrontal cortex. J. Neurosci. 29, 12315–12320.
Christopoulos, G. I., Tobler, P. N., Bossaerts, P., Dolan, R. J., and Schultz, W. (2009). Neural correlates of value, risk, and risk aversion contributing to decision making under risk. J. Neurosci. 29, 12574–12583.
Dohmen, T., Falk, A., Huffman, D., Sunde, U., Schupp, J., and Wagner, G. G. (2011). Individual risk attitudes: measurement, determinants, and behavioral consequences. J. Eur. Econ. Assoc. 9, 522–550.
Fecteau, S., Pascual-Leone, A., Zald, D. H., Liguori, P., Theoret, H., Boggio, P. S., and Fregni, F. (2007). Activation of prefrontal cortex by transcranial direct current stimulation reduces appetite for risk during ambiguous decision making. J. Neurosci. 27, 6212–6218.
Figner, B., and Weber, E. (2011). Who take risks when and why? Determinants of risk taking. Curr. Dir. Psychol. Sci. 20, 211–216.
Fox, C. R., and Tannenbaum, D. (2011). The elusive search for stable risk preferences. Front. Psychol. 2:298. doi:10.3389/fpsyg.2011.00298
Furby, L., and Beyth-Marom, R. (1992). Risk taking in adolescence: a decision making perspective. Dev. Rev. 12, 1–44.
Gianotti, L. R., Knoch, D., Faber, P. L., Lehmann, D., Pascual-Marqui, R. D., Diezi, C., Schoch, C., Eisenegger, C., and Fehr, E. (2009). Tonic activity level in the right prefrontal cortex predicts individuals’ risk taking. Psychol. Sci. 20, 33–38.
Glascher, J., Daw, N., Dayan, P., and O’Doherty, J. P. (2010). States versus rewards: dissociable neural prediction error signals underlying model-based and model-free reinforcement learning. Neuron 66, 585–595.
Grinband, J., Savitskaya, J., Wager, T. D., Teichert, T., Ferrera, V. P., and Hirsch, J. (2010). The dorsal medial frontal cortex is sensitive to time on task, not response conflict or error likelihood. Neuroimage 57, 303–311.
Grinband, J., Wager, T. D., Lindquist, M., Ferrera, V. P., and Hirsch, J. (2008). Detection of time-varying signals in event-related fMRI designs. Neuroimage 43, 509–520.
Hare, T. A., Camerer, C. F., Knoepfle, D. T., and Rangel, A. (2010). Value computations in ventral medial prefrontal cortex during charitable decision making incorporate input from regions involved in social cognition. J. Neurosci. 30, 583–590.
Hare, T. A., Camerer, C. F., and Rangel, A. (2009). Self-control in decision-making involves modulation of the vmPFC valuation system. Science 324, 646–648.
Jaeger, D. A., Dohmen, T., Falk, A., Huffman, D., Sunde, U., and Bonin, H. (2010). Direct evidence on risk attitudes and migration. Rev. Econ. Stat. 92, 684–689.
Knoch, D., Gianotti, L. R., Pascual-Leone, A., Treyer, V., Regard, M., Hohmann, M., and Brugger, P. (2006). Disruption of right prefrontal cortex by low-frequency repetitive transcranial magnetic stimulation induces risk-taking behavior. J. Neurosci. 26, 6469–6472.
Kuhnen, C. M., and Knutson, B. (2005). The neural basis of financial risk taking. Neuron 47, 763–770.
Lejuez, C. W., Aklin, W., Daughters, S., Zvolensky, M., Kahler, C., and Gwadz, M. (2007). Reliability and validity of the youth version of the balloon analogue risk task (BART-Y) in the assessment of risk-taking behavior among inner-city adolescents. J. Clin. Child. Adolesc. Psychol. 36, 106–111.
Lejuez, C. W., Aklin, W. M., Jones, H. A., Richards, J. B., Strong, D. R., Kahler, C. W., and Read, J. P. (2003a). The balloon analogue risk task (BART) differentiates smokers and nonsmokers. Exp. Clin. Psychopharmacol. 11, 26–33.
Lejuez, C. W., Aklin, W. M., Zvolensky, M. J., and Pedulla, C. M. (2003b). Evaluation of the balloon analogue risk task (BART) as a predictor of adolescent real-world risk-taking behaviours. J. Adolesc. 26, 475–479.
Lejuez, C. W., Read, J. P., Kahler, C. W., Richards, J. B., Ramsey, S. E., Stuart, G. L., Strong, D. R., and Brown, R. A. (2002). Evaluation of a behavioral measure of risk taking: the balloon analogue risk task (BART). J. Exp. Psychol. Appl. 8, 75–84.
Lejuez, C. W., Simmons, B. L., Aklin, W. M., Daughters, S. B., and Dvir, S. (2004). Risk-taking propensity and risky sexual behavior of individuals in residential substance use treatment. Addict. Behav. 29, 1643–1647.
Loewenstein, G. F., Weber, E. U., Hsee, C. K., and Welch, N. (2001). Risk as feelings. Psychol. Bull. 127, 267–286.
March, J. G., and Shapira, Z. (1987). Managerial perspectives on risk and risk taking. Manage. Sci. 33, 1404–1418.
Nelson, S. M., Dosenbach, N. U., Cohen, A. L., Wheeler, M. E., Schlaggar, B. L., and Petersen, S. E. (2010). Role of the anterior insula in task-level control and focal attention. Brain Struct. Funct. 214, 669–680.
Paulus, M. P., Rogalsky, C., Simmons, A., Feinstein, J. S., and Stein, M. B. (2003). Increased activation in the right insula during risk-taking decision making is related to harm avoidance and neuroticism. Neuroimage 19, 1439–1448.
Pennings, J. M. E., and Smidts, A. (2000). Assessing the construct validity of risk attitude. Manage. Sci. 46, 1337–1348.
Plassmann, H., O’Doherty, J., Shiv, B., and Rangel, A. (2008). Marketing actions can modulate neural representations of experienced pleasantness. Proc. Natl. Acad. Sci. U.S.A. 105, 1050–1054.
Poldrack, R. A. (2006). Can cognitive processes be inferred from neuroimaging data? Trends Cogn. Sci. 10, 59–63.
Poline, J-.B, Worsley, K. J., Evans, A., and Friston, K. (1997). Combining spatial extent and peak intensity to test for activations in functional imaging. Neuroimage 5, 83–96.
Preuschoff, K., Bossaerts, P., and Quartz, S. R. (2006). Neural differentiation of expected reward and risk in human subcortical structures. Neuron 51, 381–390.
Preuschoff, K., Quartz, S. R., and Bossaerts, P. (2008). Human insula activation reflects risk prediction errors as well as risk. J. Neurosci. 28, 2745–2752.
Rangel, A., and Hare, T. (2010). Neural computations associated with goal-directed choice. Curr. Opin. Neurobiol. 20, 262–270.
Rao, H., Korczykowski, M., Pluta, J., Hoang, A., and Detre, J. A. (2008). Neural correlates of voluntary and involuntary risk taking in the human brain: an fMRI study of the balloon analog risk task (BART). Neuroimage 42, 902–910.
Rushworth, M. F., Noonan, M. P., Boorman, E. D., Walton, M. E., and Behrens, T. E. (2011). Frontal cortex and reward-guided learning and decision-making. Neuron 70, 1054–1069.
Schonberg, T., Fox, C. R., and Poldrack, R. A. (2011). Mind the gap: bridging economic and naturalistic risk-taking with cognitive neuroscience. Trends Cogn. Sci. (Regul. Ed.) 15, 11–19.
Smith, S. M., Fox, P. T., Miller, K. L., Glahn, D. C., Fox, P. M., MacKay, C. E., Filippini, N., Watkins, K. E., Toro, R., Laird, A. R., and Beckmann, C. F. (2009). Correspondence of the brain’s functional architecture during activation and rest. Proc. Natl. Acad. Sci. U.S.A. 106, 13040–13045.
Tobler, P. N., Christopoulos, G. I., O’Doherty, J. P., Dolan, R. J., and Schultz, W. (2009). Risk-dependent reward value signal in human prefrontal cortex. Proc. Natl. Acad. Sci. U.S.A. 106, 7185–7190.
Tobler, P. N., O’Doherty, J. P., Dolan, R. J., and Schultz, W. (2007). Reward value coding distinct from risk attitude-related uncertainty coding in human reward systems. J. Neurophysiol. 97, 1621–1632.
Tom, S. M., Fox, C. R., Trepel, C., and Poldrack, R. A. (2007). The neural basis of loss aversion in decision-making under risk. Science 315, 515–518.
Wallsten, T. S., Pleskac, T. J., and Lejuez, C. W. (2005). Modeling behavior in a clinically diagnostic sequential risk-taking task. Psychol. Rev. 112, 862–880.
Yarkoni, T. (2009). Big correlations in little studies: inflated fMRI correlations reflect low statistical power. Commentary on Vul et al. (2009). Perspect. Pschol. Sci. 4, 294–298.
Keywords: risk, risk-taking, BART, ventromedial prefrontal cortex, decision-making, fMRI
Citation: Schonberg T, Fox CR, Mumford JA, Congdon E, Trepel C and Poldrack RA (2012) Decreasing ventromedial prefrontal cortex activity during sequential risk-taking: an fMRI investigation of the balloon analog risk task. Front. Neurosci. 6:80. doi: 10.3389/fnins.2012.00080
Received: 14 March 2012; Accepted: 12 May 2012;
Published online: 04 June 2012.
Edited by:
Kerstin Preuschoff, École Polytechnique Fédérale de Lausanne, SwitzerlandReviewed by:
Bernd Weber, Rheinische-Friedrich-Wilhelms Universität, GermanyThorsten Kahnt, University of Zurich, Switzerland
Copyright: © 2012 Schonberg, Fox, Mumford, Congdon, Trepel and Poldrack. This is an openaccess article distributed under the terms of the Creative Commons Attribution Non Commercial License, which permits non-commercial use, distribution, and reproduction in other forums, provided the original authors and source are credited.
*Correspondence: Tom Schonberg, Imaging Research Center, University of Texas at Austin, 3925-B West Braker Lane, Austin, TX 78759, USA. e-mail: tom@mail.utexas.edu