Training-induced compensation versus magnification of individual differences in memory performance
- 1Center for Lifespan Psychology, Max Planck Institute for Human Development, Berlin, Germany
- 2Department of Psychology, Lund University, Lund, Sweden
- 3Aging Research Center, Karolinska Institutet, Stockholm, Sweden
Do individuals with higher levels of task-relevant cognitive resources gain more from training, or do they gain less? For episodic memory, empirical evidence is mixed. Here, we revisit this issue by applying structural equation models for capturing individual differences in change to data from 108 participants aged 9–12, 20–25, and 65–78 years. Participants learned and practiced an imagery-based mnemonic to encode and retrieve words by location cues. Initial mnemonic instructions reduced between-person differences in memory performance, whereas further practice after instruction magnified between-person differences. We conclude that strategy instruction compensates for inefficient processing among the initially less able. In contrast, continued practice magnifies ability-based between-person differences by uncovering individual differences in memory plasticity.
Introduction
A long-standing debate in psychometrically oriented developmental and non-developmental intelligence research deals with the issue of whether intelligence equals learning efficiency (e.g., Sternberg and Detterman, 1986; Neisser et al., 1996; Garlick, 2002) and with the related issue of aptitude by treatment interactions (e.g., Ferguson, 1956; Cronbach, 1957; Sullivan, 1964). In other words, do individuals with higher levels of task-relevant cognitive resources gain more from training? For the cognitive ability focused on in this article, episodic memory, the empirical evidence is still mixed: while positive correlations between cognitive ability and gains from instructions and practice on cognitive tasks have been reported (e.g., Kliegl et al., 1990; Verhaeghen and Marcoen, 1996; Kwon and Lawson, 2000), negative correlations are also common (e.g., Gaultney et al., 1996; Cox, 2001). These different findings have consequently given rise to competing views on interindividual differences in training gains, which are most notably represented by the magnification and compensation accounts.
The magnification view is prominent for interpreting the increase in adult age differences after mnemonic training, such as after instructions and practice in the Method of Loci (Kliegl et al., 1990; Verhaeghen and Marcoen, 1996). In adult lifespan samples, both cognitive abilities (Schaie, 1996; Li et al., 2004; Rönnlund et al., 2005) and gains from mnemonic training (Verhaeghen et al., 1992) decline with age. Moreover, cognitive abilities are usually positively related to gains from mnemonic training (Kliegl et al., 1990; Lindenberger et al., 1992; Verhaeghen and Marcoen, 1996). This pattern of findings suggests that individual and age-related differences in gains from cognitive training can be explained by initial differences in cognitive resources available to acquire, implement, and sharpen effortful cognitive strategies. The magnification account comes with three predictions. First, group differences should be magnified after training, in the sense that groups starting out higher will gain more. Second, within groups, gains from cognitive training should correlate positively with cognitive abilities as well as with initial performance. Third, the magnitude of interindividual differences should increase as a function of training because differences between the high- and low-performing individuals should be greater after training than at baseline assessment. The magnification view has gained widespread acceptance in the cognitive aging community (e.g., Kramer and Willis, 2002; Baltes et al., 2006; for reviews see Verhaeghen et al., 1992; Verhaeghen and Kliegl, 2000, see also Bjorklund et al., 1997).
In contrast, the basic reasoning in favor of the competing compensation account is that individuals with good assets are already functioning at optimal levels and thus have less room for improvement. In the case of mnemonic strategy training, for example, individuals who already apply an efficient and honed mnemonic strategy that yields good memory might gain little from being taught another efficient strategy, as compared to individuals who apply an inefficient or no strategy. Thus, the compensation account predicts that gains from cognitive training correlate negatively with cognitive abilities and initial performance, and that age differences, and other interindividual differences, are reduced after training. Notably, supporting data for the compensation model appears to be more prevalent in the literature on child development (e.g., Gaultney et al., 1996; Cox, 2001; see also Bjorklund and Douglas, 1997; Schneider, 2012).
Though both the magnification and the compensation views make clear and competing predictions, their simultaneous presence also gives room for post-hoc explanations of empirical observations because neither account includes predictions for the conditions under which it may or may not be applicable. Here, we rely on the recently introduced theoretical distinction between flexibility and plasticity (Lövdén et al., 2010; see also Baltes, 1987; Will et al., 2008) to arrive at such discriminating predictions, and then test our predictions in a sufficiently large data set on lifespan differences in memory plasticity.
According to Lövdén et al. (2010), flexibility denotes the capacity to optimize performance within the limits of the brain's currently imposed structural constraints. That is, the cognitive system is characterized as having a range of existing (i.e., previously formed) representational states available, and to constantly adapt to environmental demands by assuming such states. This notion of a range of performance and function is similar to the concept of baseline reserve capacity (e.g., Baltes, 1987), and points to the malleability of cognitive performance through environmental support (e.g., instructions). In contrast, plasticity denotes the capacity for changes in the possible range of cognitive performance enabled by flexibility (cf. Baltes, 1987; Baltes et al., 2006). In other words, adaptations of the brain to environmental changes do not uniquely define plasticity, but rather constitute a fundamental property of experience and a starting point of plasticity. Whereas flexibility refers to the adaptation of a pre-existing behavioral repertoire, plasticity refers to the expansion of this repertoire following structural cerebral change.
We propose that the distinction between flexibility and plasticity permits predictions about the empirical conditions under which compensation or magnification are more likely to occur. First, performance gains primarily acquired by making use of flexibility are likely to display a pattern consistent with the compensation model. If the brain's performance for a particular task is already optimized within current structural constraints, then nothing can be gained from altering the way that a task is executed, be it through instructions or through some other means. Hence, within the range of performance covered by flexibility, better performing individuals will gain less. In contrast, the situation is radically different if extensive practice pushes individuals beyond the current range of performance, thereby inducing plastic changes. In this case, the prevailing empirical pattern should be magnification because individual differences in baseline levels of performance and cognitive resources are, at least in part, a reflection of past manifestations of plasticity. Under such conditions, we expect that baseline performance will correlate positively with intervention-induced training gains.
To address this set of predictions, we reanalyzed data from a study previously reported by Brehmer et al. (2007; see also Brehmer et al., 2008). In this study, children, younger adults, and older adults were first taught and then allowed to practice memory performance with an interactive imagery mnemonic, akin to the Method of Loci (Bower, 1970). The mnemonic used is well suited for encoding and retrieving location-word paired-associates, which were the target of training. After initial assessment of performance, instruction sessions, and a post-instruction assessment of performance, an adaptive procedure, involving individual adjustment of presentation times, was used to produce a measurement space covering all age groups and the total practice phase (for details, see Brehmer et al., 2007). In addition, to assess baseline cognitive resources, Brehmer and colleagues (2007) also administered a psychometric battery of tasks measuring four cognitive abilities: perceptual speed, reasoning, episodic memory, and verbal knowledge. The present reanalysis goes beyond Brehmer and colleagues (2007, 2008) by addressing the predictions from the compensation and magnification views, and by applying statistical techniques (structural equation modeling; SEM) suitable for analyzing interindividual differences in performance changes as well as correlations between initial level and change. In contrast, previous reports of this data focused on age group differences (Brehmer et al., 2007) and maintenance (Brehmer et al., 2008) of mean performance.
To summarize, we assume that gains due to instructions in the mnemonic technique are primarily acquired through flexibility, as they recruit and configure existing resources, such as knowledge about memory strategies. In contrast, performance gains produced through subsequent practice primarily reflect plasticity. Specifically, during practice, all individuals are likely to perform the task in a qualitatively similar fashion, and performance improvements reflect changes in the possible range of cognitive performance. Based on these considerations, we hypothesized that instruction gains follow the prediction from the compensation view whereas practice gains follow the prediction from the magnification model.
Materials and Methods
Participants
The sample consisted of 50 children aged 9–12 years (Mage = 11.0; SDage = 1.2; 24 girls), 29 younger adults aged 20–25 years (Mage = 22.5; SDage = 0.6; 15 women), and 29 older adults aged 65–78 years (Mage = 66.9; SDage = 3.7; 14 women). Children either had received the elementary school's recommendation to attend, or were attending the German school type with the highest entry requirements after completion of elementary school (i.e., Gymnasium). Younger adults were students at Saarland University, Saarbrücken, Germany. Older adults were either auditors at Saarland University, participants in other continuing education programs, or both. All participants had normal, or corrected to normal, vision, and hearing. Participants were paid 7.5 Euro for each full hour of testing.
Table 1 summarizes scores on four cognitive composites representing performance on psychometric tests of perceptual speed, episodic memory, reasoning, and verbal knowledge as a function of age group. For a detailed description of these composites, see Background assessment. Importantly, the cognitive characteristics display the typical developmental dissociation of an inverted U-shape for the measures of broad fluid abilities (memory, perceptual speed, and reasoning), and a continuous age-related increase in verbal knowledge (e.g., Li et al., 2004). Thus, although the overall sample is positively selected (see Brehmer et al., 2007 for details), it constitutes a satisfactory approximation of lifespan population trends in cognitive functioning.
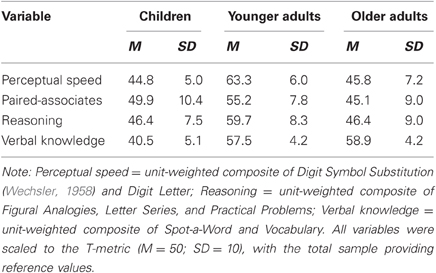
Table 1. Cognitive characteristics of the age groups.
Memory Task
Materials
Every study list consisted of 16 location-word pairs. Sixteen generic common city locations (e.g., bakery and train station) were used. The 16 locations were recycled across the different lists. The presentation order of the location cues was separately randomized at encoding and retrieval, for each list in a new random order.
A total of 413 highly imaginable and concrete nouns were selected as memory materials from a pool of 1,200 words recorded by a professional radio speaker. Selection was based on a rating study with 10 children (7–9 years old) to reduce a possible confound of age differences in word knowledge (Brehmer et al., 2004). No word was administered more than once within a given session. Words were recycled over sessions with the following three constraints: (a) A word presented at a given session did not reappear in the next session; (b) within each list, the first three letters of all 16 words were different from each other to avoid errors during response entry; and (c) words presented at the pre-instruction, post-instruction and posttest assessments were not presented in any other sessions.
Experimental paradigm
During the encoding phase, the words constituting location cues were presented visually on a monitor, and to-be-learned words were presented over headphones. First, a blank screen was presented. Second, the location cue was presented. Third, the location cue was replaced by a fixation cross, and the to-be-learned word was presented. The time for the third phase was set to 10 s for pre-instruction and post-instruction sessions. For the practice sessions, an adaptive algorithm dynamically set the encoding time for each participant individually for each list. At the final session for each individual, memory performance was assessed at a fixed (across lists), but individualized, presentation rate (see Individually Adaptive Practice).
After all 16 location-word pairs had been presented participants started the recall phase by pressing the space bar. After that, an empty screen appeared for 0.5 s, followed by a location cue, which was presented for 5 s. After another 5 s, a rectangle appeared on the screen to signal the participants that responding was possible. Participants made their responses by entering the first three letters of the corresponding word. The response time window was 90 s. Participants went to the next location cue by pressing the enter bar. After recall of each list, participants were given feedback on their level of recall performance.
Procedure
The general procedures can be dived into five phases: background assessment, baseline assessment, mnemonic instruction, post-instruction assessment, and individually adaptive practice, which ranged from 3 to 7 sessions (see Table 2 for an overview of the study design).
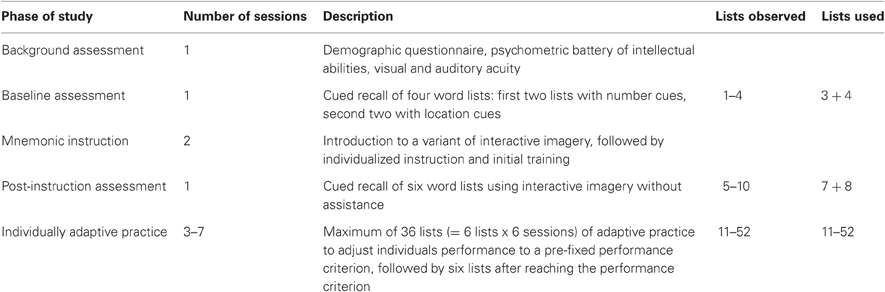
Table 2. Outline of study design.
Background assessment
In the first session, participants were administered a demographic questionnaire, tests of sensory acuity, and a psychometric battery of tests assessing perceptual speed, reasoning, paired-associates (episodic memory), and verbal knowledge (Lindenberger et al., 1993; see also Lövdén et al., 2004). A Macintosh SE30 computer equipped with a touch-sensitive screen was used for cognitive testing.
Verbal knowledge. Two tests, Spot-a-Word and Vocabulary, formed a unit-weighted composite representing verbal knowledge. The composite was scaled to the T-metric (M = 50; SD = 10) with the total sample providing reference values. For the Spot-a-Word test, 35 items containing one word and four pronounceable non-words were presented successively on the screen. Participants were asked to select the word without any time pressure. Number of correct responses was the dependent variable. For the Vocabulary test, 16 words were presented one-by-one on the screen. Participants produced definitions for each item that were coded by two independent raters. Each response received a score of 0 (wrong), 1 (partially correct), or 2 (correct). The sum of the 16 scores was the dependent variable. Testing time was unlimited.
Paired-associates. As a marker of episodic memory we used Paired-associates. Eight pairs of nouns were presented twice at a rate of 5 s per pair. After each of two presentations, the first noun of each pair was presented as a recall cue. The dependent variable was the total number of correctly remembered items across the two lists, scaled to the T-metric.
Reasoning. The T-scaled unit-weighted composite representing reasoning was composed of three tasks, Figural analogies, Letter Series, and Practical Problems. In all three tasks the test phase was terminated when subjects made three consecutive false responses, when they reached the maximum time limit (15 min), or after they had answered the last item of the test. In the Figural Analogies test, items followed the format “A is to B as C is to?”. Participants chose one of five alternative answers to complete the open figure analogy. The number of correct responses was the dependent variable. For each item of the Letter Series test, a series of five letters followed by a question mark was presented. Participants had to choose the right letter out of five alternatives that logically followed the underlying rule of the letter series used in each item. The dependent variable was the number of correct responses. In the Practical Problems task, participants solved everyday problems, such as the hours of a bus schedule, instruction of medication as well as other forms and tables. Answers were given by choosing one of five alternatives and the dependent variable was the number of correct responses.
Perceptual speed. Two tests, DSS and Digit Letter, formed a T-scaled unit-weighted composite representing perceptual speed. For the DSS test, the Wechsler (1958) version of the test was used. Participants had 90 s to write as many symbols as possible. The number of correctly written symbols was the dependent variable. The Digit Letter test closely resembles the DSS test except that subjects had to name letters instead of writing symbols with respect to corresponding digits. The dependent variable was the total number of correct responses after 3 min.
Baseline assessment
In the second session, individuals were asked to encode and recall four lists of 16 words each. The first two lists involved numbers ranging from 1 to 16 as cues. The 16 locations were used for the last two lists as well as for the rest of the experiment.
Mnemonic instruction
In the next two sessions, participants were introduced to a modified interactive-imagery version of the Method of Loci. The first session took place in age-homogeneous groups of 3–4 individuals. After introducing the participants to the historical origins of the method, the principles of the method were explained by giving concrete examples. The instruction emphasized the generation of interactive images that associate the location cue with the to-be-learned word. Participants then practiced the technique with two word lists. Instruction and supervised training were continued individually with six word lists in the second instruction session. Supervised training included prompts to verbalize and discuss all aspects of image formation and image retrieval, collaborative image generation, assistance during recall, repetition and elaboration of instructions, as well as various other forms of encouragement.
Post-instruction assessment
In this session, and all further sessions, six lists of location-word pairs were presented sequentially for encoding and retrieval. No assistance in using the mnemonic technique was provided.
Individually adaptive practice
This phase of individual practice sessions used adaptive adjustment of encoding times (cf. Kliegl and Lindenberger, 1993) to control task difficulty individually. For each participant, this part of the study lasted between three and seven sessions, depending on the number of sessions needed to reach stable levels of memory performance as defined by the adaptive practice procedure (see below). Individuals participated in one or two sessions per week, with a minimum of 2 days between sessions.
For each individual, an adaptive algorithm determined the amount of encoding time per word for the next list by three variables: encoding time of the current list, the current step width of adjustment, and the alteration, which is a variable that indicate the direction (i.e., increased, decreased, or equal) of the previous adjustment (for details and a numerical example, see Brehmer et al., 2004). During practice, the values of all three variables were updated after each list to maximize the likelihood that a given individual would correctly recall 10 out of 16 words in the next list. When the step width for the next list was lower than 0.08 s or when six practice sessions were completed, a final session was completed. Depending upon the speed with which the adaptive practice algorithm converged, the final session was scheduled after the third to the seventh practice session. In this final session, encoding time was adjusted to fix each individual's level of performance to 50% correct and was held constant across the six lists given to participants in this session. This time-relative criterion of correct performance was chosen because of considerations for subsequent memory analyses using electroencephalography, which are not reported here. For motivational reasons, the criterion was higher (i.e., 10 out of 16 word, or 62.5% correct) during practice.
Data Analysis
The dependent variable: timed recall score
In this study, information regarding memory performance comes from both encoding times and number of correctly recalled items. Thus, both pieces of information must be taken into account. Typically, the function relating encoding time to the number of words recalled approximates a logarithmic function (e.g., Kliegl et al., 1994). Therefore, we divided the number of correctly recalled items by the log of the associated encoding time to produce a single dependent variable (henceforth, Timed Recall Score; see also Brehmer et al., 2007). We also scaled up this score by a factor of 10 to produce a variance of approximately the same magnitude as the T-scaled cognitive background composites.
Modeling instruction gains
To analyze instruction gains (i.e., the difference between baseline and post-instruction assessments; see Table 2) we fitted a confirmatory two-factor model to the data from the baseline assessment and the post-instruction assessment (see Figure 1A). That is, we assumed a latent unobserved variable representing an individual's latent error-free baseline performance score (BP) before introduction to the mnemonic technique and a latent variable representing an individual's score after instruction (Post). The latent BP score is defined as a unit-weighted factor of two observed variables [list 3 (l3) and list 4 (l4)], representing performance on the first and second lists using landmark cues in the baseline assessment (the first two lists had numbers as cues), respectively. The latent post-score is defined as a unit-weighted factor of two other observed variables (l7 and l8), representing performance on the third and fourth lists presented to participants in the post-instruction assessment. The reason for including only two lists from the post-instruction assessment was to match the list-order of the lists tapping baseline performance. We simultaneously and freely estimate the error variances (σ2e3, σ2e4, σ2e7, and σ2e8), the autocovariances between the errors (ρe3,e7 and ρe4, e8), and the mean difference between the lists used as indicators of baseline and post-instruction performance (μlistdiff). Of particular interest, we simultaneously estimate the mean of baseline performance (μBP), interindividual differences in baseline performance (σBP), the mean of the latent post-instruction performance (μpost), interindividual differences in post-instruction performance (σpost), and the correlation between baseline performance and post-instruction performance (ρBP, post). We also included the cognitive composites of perceptual speed, episodic memory, reasoning, and verbal knowledge as observed variables, and allowed these to freely covary among themselves and with latent baseline performance and post-instruction performance (not shown in Figure 1A)1. In order to compare the estimates across age groups, we estimated this model as a multigroup model (children, younger adults, and older adults). In the starting model, no across-group constraints were applied. With this model, we can inspect the standard deviations of the latent factors, baseline performance, and post-instruction performance, and test for the effects of training on between-person differences expected from the compensation and magnification views.
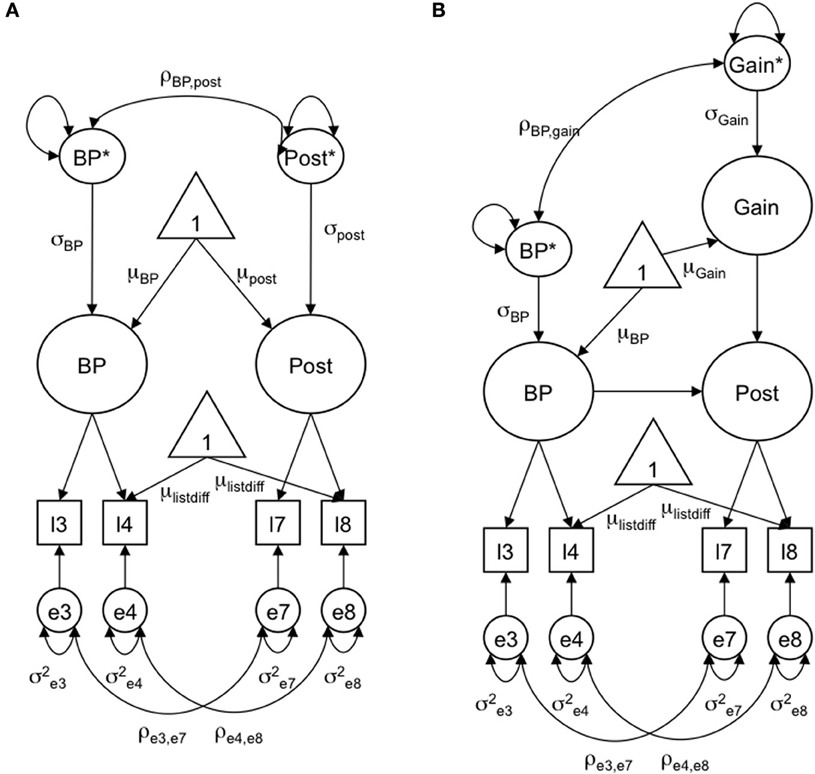
Figure 1. Graphical representation of the confirmatory factors model (A) and the latent differences score model (B) used to estimate gains from mnemonic instruction (baseline plasticity). Observed variables are represented by squares, latent variables by circles, regression weights by one-headed arrows, and variances and covariances by two-headed arrows. The triangle indicates means. Unlabeled parameters are fixed to 1. BP, baseline performance; POST, post-instruction performance; l, list.
Next, we reformulated the confirmatory factor model into a latent difference model (LDM; McArdle and Nesselroade, 1994). Figure 1B displays a graphical representation of the LDM as we implement it here. In this model, the latent post-scores are defined as the unit-weighted sum of the latent pre-score plus a latent difference score (Gain), so that the Gain factor is interpreted as the latent difference (reliable gain) from the baseline to the post-instruction assessment. Thus, this gain factor reflects instruction gains. This latent difference approach attenuates problems related to unreliability of raw difference scores by estimating the mean and variance of differences separately from error variance. Of particular interest, this models allows for simultaneously estimating the mean of baseline performance (μBP), interindividual differences in baseline performance (σBP), the mean of the latent gain scores (μgain), interindividual differences in gain (σgain), and the correlation between baseline performance and gain (ρBP, gain). Thus, with this model we can examine the prediction that magnification and compensation views have regarding the correlations between initial level of performance and gains from instruction in a methodologically rigorous manner.
Modeling practice gain
We analyzed practice gains with a latent curve model (LCM; e.g., Bryk and Raudenbush, 1987; McArdle and Epstein, 1987; Meredith and Tisak, 1990; McArdle, 2006). Figure 2 displays a graphical representation of the LCM implemented here. The observed variables, l11–l52, emanate from the seven sessions in the phase of individually adaptive practice, each session including the presentation of six location-word lists. In a linear LCM, two latent variables, the intercept IC and the linear slope S, are proposed to account for the time series information. The linear slope S represents linear gain from practice by constraining the 42 loadings of the observed variables on S to increase linearly. The intercept IC represents an individual's latent score at the end of the time series (i.e., at l52) by setting the factor loading of the observed variable l52 on S to zero (i.e., l11 has a −41 loading on S, l12 has a −40 loading, etc.; see the loading matrix (Λ) in Figure 2). The intercept and the linear slope factors are estimated at the mean level (i.e., their means μIC and μS are estimated), they both allow for interindividual differences (i.e., their standard deviations σIC and σS are estimated), and they may covary ρIC, S. The error variance σ2e is commonly assumed to have a mean of zero and to neither correlate nor change over time. Estimating the six parameters mentioned so far (μIC, μS, σIC, σS, ρIC, S, σ2e) corresponds to estimating a classic linear LCM. We included an additional factor representing the orthogonal quadratic effect (S2). For these factors, preliminary analyses showed no significant interindividual differences (i.e., standard deviations) for any of the age groups. Therefore, we did only estimate the mean μS2 and not the standard deviation.
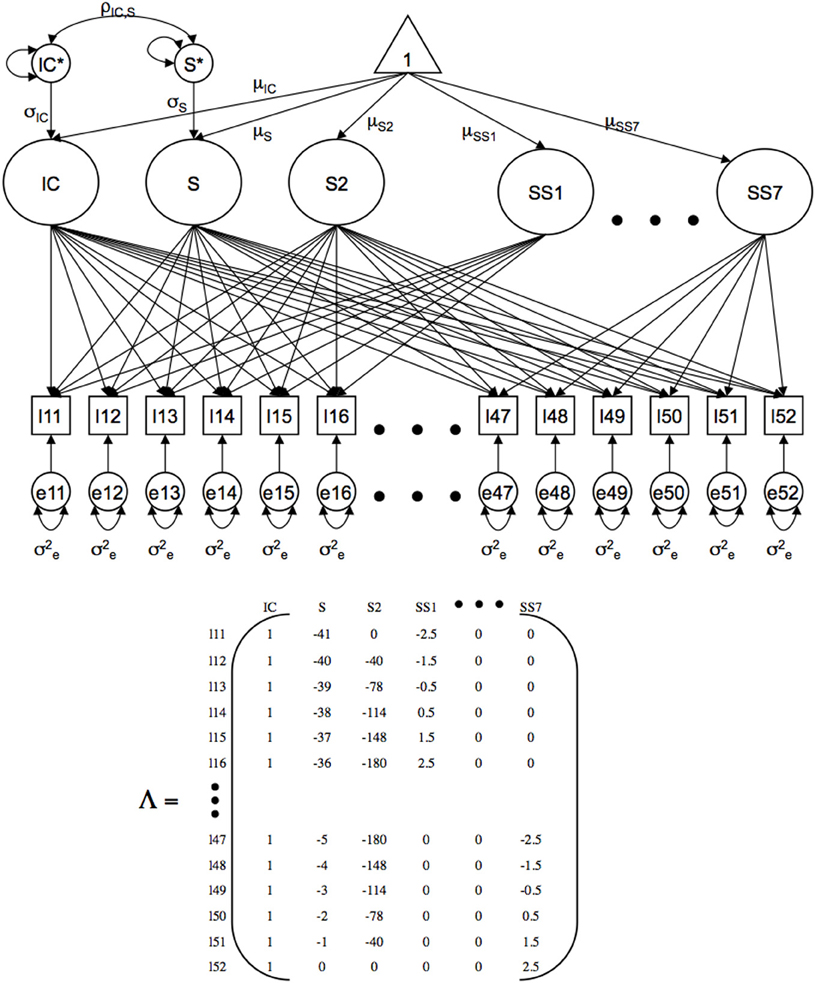
Figure 2. Graphical representation of the latent growth curve model implemented here. Observed variables are represented by squares, latent variables by circles, regression weights by one-headed arrows, and variances and covariances by two-headed arrows. The triangle indicates means. Unlabeled parameters are fixed to the values displayed in the matrix of loadings. IC, intercept, reflecting post-training performance; S, linear slope; S2, quadratic slope; SS1–7, session-wise linear slopes; l, list.
In addition to the standard modeling of the time series with polynomials, we included session-wise factors representing the unique linear slope within a session. The loadings of the observed variables (six location-word lists for each of the seven sessions) on the session-wise slope factors (SS1–SS7) were defined as linearly increasing across lists within a session. The session-wise slope factors were included because we expected proactive interference from the preceding lists (e.g., Kliegl and Lindenberger, 1993) and, to some extent, other reactive effects related to list-order (e.g., fatigue) to reduce practice-related gains on performance within sessions. We freely estimated the means of the session-wise slope factors (μSS1–μSS7) but fixed their standard deviations to zero. The assumption that the session-wise reactive effects took on a linear form without interindividual differences were based on visual inspection of the data. Specifically, we averaged the Timed Recall Score over sessions by list position within a session for each individual. Separately for the age groups, the individual means are displayed as a function of list position in Figure 3, which clearly suggests an approximately linear decrease as a function of list position for most of the individuals. Furthermore, individual differences in the slopes appeared to be limited. Indeed, preliminary analyses allowing the variances for the session-wise slopes to be estimated did not result in an increase in fit, further bolstering the decisions to model these session-wise slopes without allowing for interindividual differences.
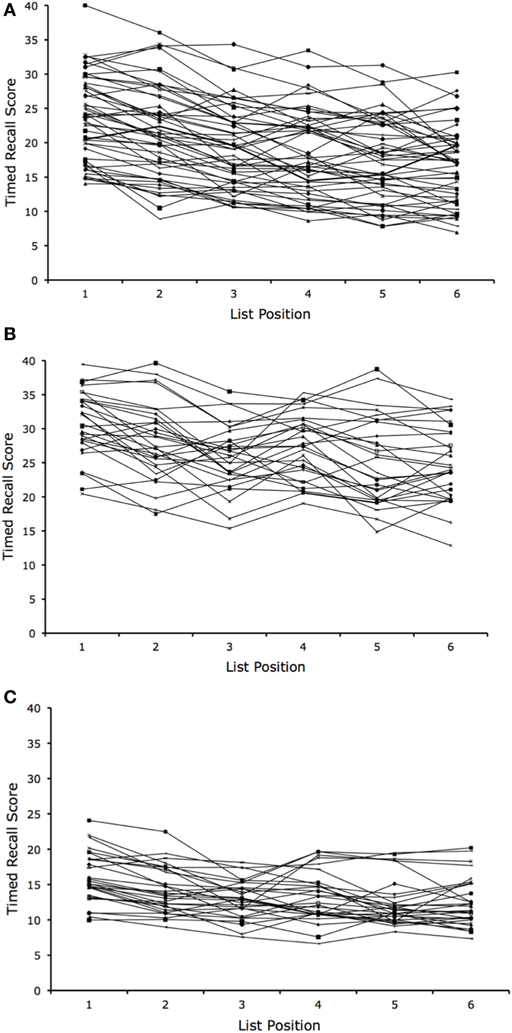
Figure 3. Timed Recall Scores averaged over sessions by list position within a session for each individual in the group of children (A), younger adults (B), and older adults (C). Each line represents the scores for one individual.
In analogy to the analyses of the instruction gains, we included the cognitive composites (not shown in Figure 2) as observed variables, and allowed these to freely covary among themselves as well as with the intercept and the linear slope. In addition, we estimated the model as a multigroup model (children, younger adults, and older adults). In the starting model, no across-group constraints were applied.
Handling missingness
Not all individuals contributed data to all variables. For the analyses of instruction gains with the LDM, the number of missing values was limited (a few missing values owing to technical problems and deletion of outliers). For practice gains, the number of missing values was dramatically higher, reflecting planned missingness due to the termination rule of the adaptive training procedure (see General Procedures; cf. McArdle, 1994). Specifically, all individuals provided scores in the first three sessions (l11–l34), but thereafter data become more and more sparse. Planned missingness was handled by taking the scores from each participant's final session and imputing these scores through the rest of the time series. This procedure assumes that the last completed session provides an accurate description of asymptotic performance, both with respect to the overall time series as well as to the session-wise reactive effects. Previous analyses suggested that a step width below 0.08 is conservative enough for making this assumption (Brehmer et al., 2007).
Remaining instances of missingness (due to technical problems and deletion of outliers) were accommodated by estimating the model with Full Information Maximum Likelihood (FIML; Finkbeiner, 1979; Arbuckle, 1996; Duncan et al., 1998; Wothke, 2000; Enders, 2001; Schafer and Graham, 2002). The FIML algorithm does not result in imputed values but uses the information in the complete data for estimating parameters that involve missing values. The FIML algorithm and related approaches generate more precise and less biased population estimates than other widespread procedures dealing with missing values (e.g., listwise deletion, regression imputation, mean imputation; e.g., Wothke, 2000; Schafer and Graham, 2002). The FIML algorithm operates under the assumption of Missing-at-Random (MAR; Rubin, 1976; see Schafer and Graham, 2002, for a non-technical treatment), which means that the probability that a score on variable X is missing may depend on other variables in the model, but not on X itself. Note also that under the MAR assumption a relationship between missingness and X produced by the mutual association to the other variables in the model is allowed, but there must be no residual relationship between missingness and X once the other variables are taken into account.
General statistical considerations
We note that our sample size is small for SEM. Some methodological limitations associated with small sample sizes are, for example, potential violations of multivariate normality, problems with improper solutions, and low power. To address potential violations of multivariate normality, we devoted considerable attention to the screening of variables. We detected five outliers among the post-instruction lists, seven outliers among the practice lists, one outlier for reasoning, and two outliers for perceptual speed. After deletion of the outlier scores, skewness, and kurtosis were within an acceptable range for all variables (rangeskewness = −2.5 to 1.7; rangekurtosis = −1.7 to 8.3), indicating satisfactory univariate normal distributions (e.g., Kline, 1998). Satisfactory univariate distributions also reduce the risk for violations of multivariate normality. The only variable bordering to deviations from normal distribution was the second list (l8) indicating post-instruction performance for the group of younger adults (skewness = −2.5; kurtosis = 8.3), which reflected a tendency for ceiling effects. This tendency arose because encoding time was fixed across all individuals at 10 s for the baseline and post-instruction assessments. In addition to univariate screening, we visually inspected the graphed time series of each individual for atypical patterns. No individual time series was judged to constitute a multivariate outlier. In summary, we found no violations of multivariate normality in the final data set. In addition, we note that minimum was achieved without problems and no improper solutions were obtained. Finally, the power of the present statistical approach is, in the case of the LCM, boosted by the abundance of variables from which relatively few substantively important parameters are extracted (e.g., Hertzog et al., 2008). Nonetheless, the LCM applied is quite complex considering the limited sample size, and we, therefore, also did follow-up analyses applying the LDM to the analyses of practice gains (see Results for a more detailed description).
We utilized AMOS 5.0 for all computations. Model fit was evaluated with the χ2 statistic and associated p-value, the normed χ2 (χ2/df), the Comparative Fit Index (CFI), and the Root Mean Square Error of Approximation (RMSEA). A χ2/df below 2, a CFI above 0.90, and a RMSEA below 0.08 indicate acceptably fitting models (Arbuckle and Wothke, 1999). The likelihood ratio test (difference in χ2; Δχ2) was used for comparing nested models. The level for all statistical decisions was 0.05.
Results
Baseline Performance and Instruction Gains
First we estimated the confirmatory two-factor model of baseline and post-instruction performance displayed in Figure 1A as a multigroup model (children, younger adults, and older adults) while including the cognitive composites of perceptual speed, episodic memory, reasoning, and verbal knowledge as observed variables. This starting model had an acceptable fit, χ2 = 39.46, df = 30, p = 0.116, CFI = 0.946, RMSEA = 0.055. In this model we tested the compensation view's prediction that interindividual differences in performance decrease after instructions by comparing the starting model with a model assuming that the standard deviations of the two latent factors were equal across time for all groups. This model produced a decrease in fit, Δχ2 = 57.52, df = 2, p < 0.001. Fixing the standard deviation to equal across time separately for the young children, young adults, and older adults resulted in decreases in fit for all these three models in comparison with the starting model, Δχ2 = 12.49, df = 1, p < 0.001 for children, Δχ2 = 34.84, df = 1, p < 0.001 for younger adults, and Δχ2 = 10.20, df = 1, p < 0.001 for older adults. The standard deviations decreased after instruction for all groups.
Next we estimated the LDM of instruction gains shown in Figure 1B. The starting model had a fit identical to the confirmatory factor model reported above. We started by examining the compensation view's prediction that groups starting out lower would gain more from instruction. The means at baseline and post-instruction assessments (predicted from the mean gain) are displayed as a function of age group in Figure 4. An inspection of this figure suggests age-group differences in baseline performance. Estimating the means of baseline performance to be equal across age groups, as an omnibus test of group differences, yielded a reliably less well fitting model than the starting model, Δχ2 = 40.79, df = 2, p < 0.001. Univariate tests showed that younger adults (μpre = 13.25) performed significantly better than both children (μpre = 7.74), Δχ2 = 35.53, df = 1, p < 0.001, and older adults (μpre = 7.09), Δχ2 = 32.81, df = 1, p < 0.001. Children and older adults did not differ significantly in baseline performance, Δχ2 = 0.53, df = 1, p > 0.467.
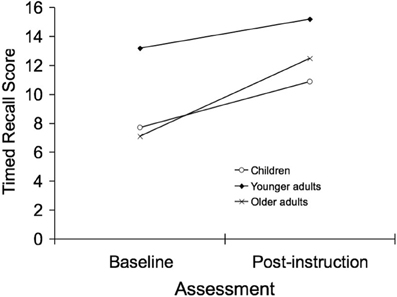
Figure 4. Baseline performance and gains from instruction. Mean performance (Timed Recall Score) at baseline and post-instruction assessment for children, younger adults, and older adults, as predicted from baseline performance and instruction gain.
All groups gained reliably from instruction. Children gained on average 3.21 scores (z = 6.60), younger adults gained 1.97 scores (z = 3.20), and older adults gained 5.38 scores (z = 7.22). The omnibus test involving average gains from instruction indicated significant age-group differences, Δχ2 = 10.93, df = 2, p < 0.004. Univariate tests showed that the group of older adults gained significantly more than both children, Δχ2 = 5.22, df = 1, p < 0.022, and younger adults, Δχ2 = 10.73, df = 1, p < 0.001. Note, however, that there was a tendency for ceiling effects at post-instruction assessment for the younger adults, which probably reduced the mean gains for this group.
Next we addressed the predicted negative correlation between baseline performance and gains from instruction. All variances and standard deviations were significant. Figure 5 displays individual baseline and post-instruction performances (average of the two lists at each assessment) separately for the children (a), younger adults (b), and older adults (c). An inspection of Figure 5 reveals pronounced between-person differences in instruction gains: within age groups, individuals differed in how much they gained in memory performance from mnemonic instruction. Table 3 displays the correlations among baseline memory performance, gains from mnemonic instruction, and the cognitive composites, separately for the three age groups. The most salient finding reported in Table 3 is the strong negative correlations between baseline performance and instruction gain observed in all age groups, indicating that individuals entering the study with low memory performance gained more from instruction than those who entered the study with good memory performance (see also Figure 5). Caution is, however, warranted when interpreting this finding for the group of younger adults because their tendency for a ceiling effect at post-instruction assessment may contribute to the negative correlation. Likewise, correlations between the cognitive composites and instruction gain indicated that Paired-associates performance was negatively related to instruction gain in the two adult groups.
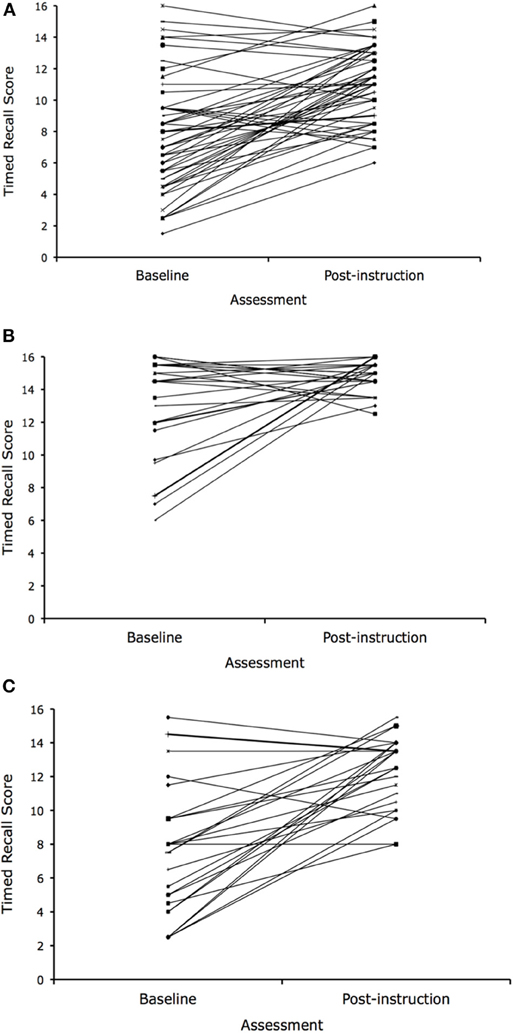
Figure 5. Individual baseline performance and gains from instruction. Performance at baseline and post-instruction assessments for each individual in the group of children (A), younger adults (B), and older adults (C). The scores at baseline and post-instruction assessments are unit-weighted composites of the two lists indicating performance at each assessment, respectively. To plot all scores on the positive axis, a constant of 10 has been added to all scores.
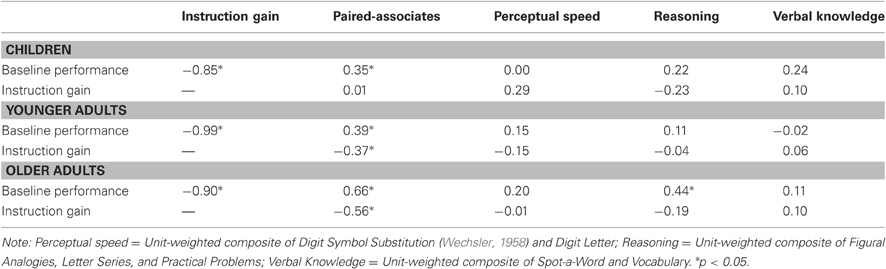
Table 3. Correlations among cognitive composites, baseline memory performance, and gain in memory performance from baseline to post-instruction assessments (instruction gain) separately for the age groups.
To sum up, the analyses of instruction gains reveal an empirical pattern consistent with the compensation account: interindividual differences in memory performance are reduced after instructions, group mean differences are reduced, and baseline performance correlates negatively with gains from instructions within the groups.
Baseline Performance and Practice Gains
To address the predictions regarding practice gains, we simultaneously estimated the LDM of instruction gains and a LCM of the practice gains. This model was estimated as a multigroup model (children, younger adults, and older adults) while allowing the cognitive composites to freely covary among themselves and with baseline performance, instruction gain, linear practice gain, and post-training performance. The starting model estimated 171 parameters with a log-likelihood function2 of 21,750.47.
We first tested the magnification view's prediction that interindividual differences in performance increase from training by comparing the starting model with a model assuming that the standard deviations of the baseline assessment and post-practice performance were equal across time for all groups. This model produced a decrease in fit, Δχ2 = 57.88, df = 3, p < 0.001. The standard deviations increased from baseline assessment to post-practice assessment for the groups of children (3.39–8.23), Δχ2 = 33.31, df = 1, p < 0.001, and younger adults (2.83–8.22), Δχ2 = 24.52, df = 1, p < 0.001, but not for the group of older adults (3.53–3.69), Δχ2 = 0.05, df = 1, p > 0.816.
Next, we examined the means predicted from the estimates of the intercept, linear slope, and quadratic slope of the practice period (see Figure 6). All groups gained in memory performance from practicing. Children had a linear mean gain (μS) of 0.17 (z = 8.31), younger adults gained 0.35 scores (z = 10.32), and older adults gained 0.04 scores (z = 3.70) per practiced list. The omnibus test indicated significant age-group differences, Δχ2 = 52.51, df = 2, p < 0.001. Pairwise comparisons showed that younger adults gained significantly more than children, Δχ2 = 17.37, df = 1, p < 0.001. In turn, children gained more than older adults, Δχ2 = 21.16, df = 1, p < 0.001.
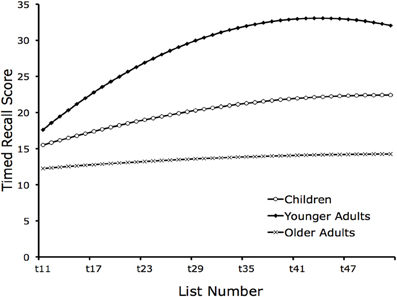
Figure 6. Practice gains. Mean performance (Timed Recall Score) during the practice phase as predicted from the parameter estimates of the intercept, linear slope, and quadratic slope as a function of list number and age group.
Figure 6 suggests that the practice-related improvements in memory performance took on a quadratic shape for children and younger adults. In fact, the quadratic mean slope (μS) was significant for children (−0.004; z = 4.62) and younger adults only (−0.015; z = 9.35). Note that follow up analyses showed that the apparent tendency for declining performance for younger adults toward the end of the time series could be partially removed by adding a cubic trend. However, this trend did not reach significance (p > 0.13) and we thus decided against including it in the final models.
Finally, we addressed the predicted positive correlation between baseline performance and gains from practice. Importantly, all estimated variances and standard deviations, including the linear practice gains, were statistically reliable. Table 4 displays the correlations among post-training memory performance, practice gain, and the cognitive ability composites. The most salient finding is the uniformly strong and positive correlations between post-training performance and practice gains, indicating that the magnitude of practice-related gains for an individual was strongly determining the individual's rank order at the end of training. All cognitive composites showed some significant and positive associations with post-practice performance and with linear practice gains, but it is difficult to discern any consistent and salient pattern within or across age groups for these correlations.
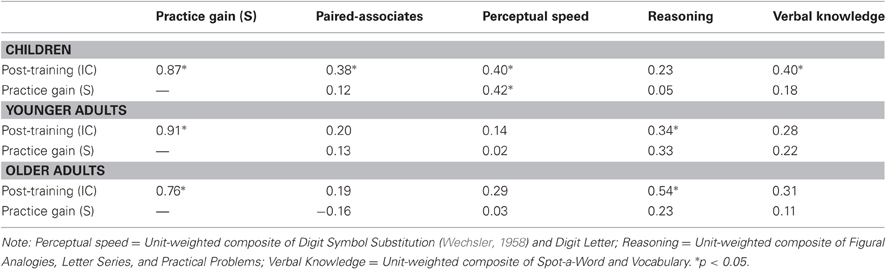
Table 4. Correlations among cognitive composites, post-training memory performance (IC), and linear gain in memory performance from practice (S) separately for the age groups.
Table 5 presents the correlations, separately for the three age groups, among all the estimated components of the training curve. The new information in this table is a weak pattern of positive correlations between baseline performance and post-practice performance. In addition, for children, baseline performance correlates positively with practice gains.
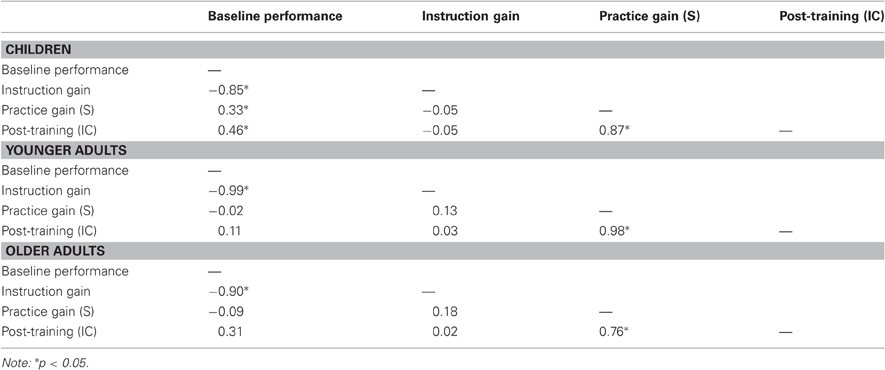
Table 5. Correlations among baseline memory performance, instruction gain, gain from practicing (S), and post-training performance (IC) separately for the age groups.
Because the main take-home messages from these analyses are based on a quite complex model fitted to a relatively small sample, we also double-checked these results in a simplified model of practice gains. In this model, fitted as a multigroup model (children, younger adults, and older adults), the practice gains were modeled in a similar way as the instruction gains, with a latent-difference score model. For the practice gains, a pre-practice factor was formed by the six first lists of the practice phase and a post-practice factor was formed by the last six lists completed by each participant. Initial analyses of these factors confirmed that within-group interindividual differences increased for children and younger adults. That is, the standard deviations increased from baseline assessment to post-practice assessment for the groups of children, Δχ2 = 22.09, df = 1, p < 0.001, and younger adults, Δχ2 = 19.91, df = 1, p < 0.001. When these factors were reformulated as latent-difference score model, we could confirm that younger adults increased on average more in memory performance than children, Δχ2 = 13.47, df = 1, p < 0.001 and that children increased more than older adults, Δχ2 = 12.89, df = 1, p < 0.001. Finally, the correlation between baseline performance and practice gains was significant in the group of children, r = 0.53, p = 0.010.
In summary, the main message from these analyses are that practice-related changes in memory performance partly follows a pattern consistent with the predictions from the magnification model: relative to baseline performance, age-group differences increased after practice; for children and younger adults, within-group interindividual differences increased after practice; and in children, baseline performance as well as cognitive abilities assessed before the intervention tended to be positively associated with practice gains.
Discussion
This article reports that between-person differences in associative memory performance are reduced after mnemonic instructions and that baseline performance within age groups correlates negatively with instruction gains. In contrast, age-group differences, and between-person differences among children and younger adults, increase as a function of extended adaptive practicing, and baseline performance and cognitive abilities tends to be weekly positively associated with practice gains for the group of children. Thus, the compensation view fit the pattern of instruction gains nicely, while the magnification model fit the interindividual differences in practice gains better than the compensation model.
Clearly, the present results are consistent with the distinction between flexibility and plasticity (Lövdén et al., 2010). Flexibility, in our view, denotes the capacity to optimize the brain's performance within current structural constraints, using the available range of existing representational states. In contrast to flexibility, plasticity denotes the capacity for changes in the possible range of cognitive performance enabled by flexibility. Instruction gains may be primarily acquired through flexibility, and if the brain's functioning is already appropriate for handling the task at hand, then little can be gained by altering the way a particular task is executed, and thus better performing individual will gain less. In contrast, gains primarily acquired through adaptive practice may reflect plasticity and extend the possible range of performance, possibly by boosting associative potential (Brehmer et al., 2007; Shing et al., 2008, 2010). Initial performance should then correlate with individual differences in plasticity because initial performance can be viewed as a reflection of past manifestations of plasticity.
These theoretical notions also help to explain why older adults gained more from instructions than children, whereas children gained more from practicing than older adults, despite the fact that both groups were performing similarly at baseline and on measures of fluid cognitive ability (see also Brehmer et al., 2007). Specifically, older adults may, perhaps due to their larger knowledge base, possess better possibilities to rapidly shift to a more effective mnemonic strategy, while children may possess a more plastic associative memory system (Werkle-Bergner et al., 2006; Shing et al., 2008, 2010).
This study has several benefits. One positive characteristic of the study is the lifespan sample, which gave us the opportunity to examine the validity of the magnification and compensation views across the lifespan and for both instructions and practice gains. Another advantage is the inclusion of an extensive training program using an adaptive procedure to encompass the wide measurement space. The adaptive procedure also ensured that all participants faced equally demanding conditions during training, thus minimizing confounding between-person differences in the impetus for change in performance (Lövdén et al., 2010). Finally, our use of modern statistical procedures appropriate for the explicit estimation of change provides an important addition to past research in this area and circumvents several of the methodological problems discussed in the psychometric literature on relations between initial performance and subsequent change (Jin, 1992). These methodological improvements gave us the opportunity to, in a rigorous manner, extend the evaluation of the magnification and compensation models to interindividual differences.
A number of limitations should be noted as well. First, generalization from the specific context in which this study was conducted to other forms of training is not straightforward. In particular, the present target task of training deviates somewhat from past studies on memory plasticity with the method of loci (e.g., Kliegl et al., 1990; Lindenberger et al., 1992; Kliegl and Lindenberger, 1993). In the present task, location cues were not presented in a fixed serial order but randomized at each list. Hence, the current task was less strategic but loaded more on the associative component of episodic memory (e.g., Shing et al., 2010). It is possible that this feature enhanced the compensatory pattern found for baseline plasticity. Specifically, encoding and retrieval strategies such as imagery might be relatively standard ways of dealing with to-be-learned materials whereas full application of the method of loci mnemonic may not. Thus, a subset of participants in this study may have applied some form of interactive-imagery strategy at baseline (cf. Dunlosky et al., 2005). Another issue is the ceiling effect of younger adults in the post-instruction session. Although we can interpret young adults' baseline performance, practice gains, and overall training gains, this ceiling effect renders it impossible to interpret younger adults' gains from instructions.
We also note that the key dependent variable was a composite score of presentation time and the number of correctly recalled items. The underlying assumption of this Timed Recall Score is that a reduction in processing time increases the effort for the participant to form a quick and effective association and that this mechanism is functionally equivalent across age groups. Previous age-comparative memory research in the field of cognitive aging supports these assumptions (Kliegl and Lindenberger, 1993; Kliegl et al., 1994), and lifespan comparisons in the domains of working memory and inductive reasoning have successfully used similar procedures (Mayr et al., 1996). Nevertheless, further methodological work on the issue of age equivalence of the Timed Recall Score is desirable. It should also be noted that our overall sample is positively selected (see Brehmer et al., 2007 for details), limiting generalizability to lower performing segments of the population. Finally, and most importantly, we note that the sample size was relatively small, especially considering the complex latent-growth curve approach to analyzing practice gains. Though follow-up analyses applying the less complex latent difference score model to this data delivered results that confirmed the main analyses, we acknowledge that the statistical power for addressing these research questions is limited. Due to this fact, we run a higher risk than usual of missing important effects and of reporting false alarms. In addition, we note that the procedure of imputing data missing due to the termination rule of the adaptive training procedure assumes that the last completed session provides an accurate description of asymptotic performance. The validity of this assumption is unknown. There is, therefore, a risk that the true shape of the mean practice gains looks different than the one we reported in Figure 6. Nevertheless, the main conclusion concerning the individual differences in practice gains remains valid regardless of the true shape of this learning process. This has been shown by the follow-up analyses, which only relies on the difference between initial and final performance of the practice phase. Overall, considering these limitations, future studies must confirm the present results before strong claims based on these results can be made.
Despite these limitations, the findings of this study suggest a resolution to the long-standing debate on the presence, direction, and meaning of aptitude by treatment interactions. In line with the conceptual distinction between flexibility and plasticity, we found that mnemonic instructions have compensatory effects, whereas subsequent practice magnifies between-person differences in memory performance. Future research needs to examine whether the explanatory framework introduced in this article is also helpful to interpret results from other data set with larger samples and whether it also helps to clarify the relation among initial performance, cognitive resources, and performance gains in cognitive domains other than memory. With educational issues in mind, it is clear that understanding the mechanisms that reduce and magnify between-person differences in performance is important, and may have practical and societal implications.
Conflict of Interest Statement
The authors declare that the research was conducted in the absence of any commercial or financial relationships that could be construed as a potential conflict of interest.
Acknowledgments
This study was carried out in the context of the Research Group, “Binding: functional architecture, neuronal correlates, and ontogeny,” funded by the German Research Foundation (DFG FOR 448). The authors thank Michael Schellenbach for technical assistance, the research assistants at Saarland University for their help in collecting the data, and the participants for their cooperation and endurance. Thanks also go to Lars Bäckman, Chris Hertzog, Viktor Müller, Timo von Oertzen, and Florian Schmiedek for productive discussions.
Footnotes
- ^In all models applied in this paper the psychometric composites were included as a single indicator of a latent variable with a variance of one and the path (now representing the standard deviation of the cognitive composite) as well as the intercept freely estimated. The latent variable was allowed to correlate with other variables. This implementation allows for direct estimation and comparison of standardized covariances (i.e., correlations) in the models.
- ^With FIML, the overall log-likelihood fitting function for a model is the sum of the casewise likelihoods. The chi-square statistic and derivate indices are calculated from the difference between the log-likelihood fitting functions of the saturated (unrestricted) model and the restricted model (e.g., the applied LCM) with the degrees of freedom equal to the difference in the number of estimated parameters between the models. This calculation was done for the LDM applied to the instruction gains. However, not enough information was available in the data set to fit the saturated model for the LCM. Thus, we report only the minimum value of the function of log-likelihood for the restricted model (i.e., the applied LCM). The lack of the conventional fit indices for the LCM is not problematic because the fit of the model is not critical per se; rather, the major focus is on the parameter estimates, differences in the estimates across age groups, and thus differences between alternative models.
References
Arbuckle, J. L. (1996). “Full information estimation in the presence of incomplete data,” in Advanced Structural Equation Modeling, eds G. A. Marcoulides and R. E. Schumacker (Mahwah, NJ: Erlbaum), 243–277.
Baltes, P. B. (1987). Theoretical propositions of life-span developmental psychology: on the dynamics between growth and decline. Dev. Psychol. 23, 611–626.
Baltes, P. B., Lindenberger, U., and Staudinger, U. M. (2006). “Lifespan theory in developmental psychology,” in Handbook of Child Psychology: Vol. 1. Theoretical Models of Human Development, 6th edn., eds W. Damon and R. M. Lerner (New York, NY: Wiley), 569–664.
Bjorklund, D. F., and Douglas, R. N. (1997). “The development of memory strategies,” in The Development of Memory in Childhood, eds N. Cowan and C. Hulme (Sussex, UK: Psychology Press), 201–246.
Bjorklund, D. F., Miller, P. H., Coyle, T. R., and Slawinski, J. L. (1997). Instructing children to use memory strategies: evidence of utilization deficiencies in memory training studies. Dev. Rev. 17, 411–441.
Brehmer, Y., Li, S.-C., Mueller, V., von Oertzen, T., and Lindenberger, U. (2007). Memory plasticity across the life span: uncovering children's latent potential. Dev. Psychol. 43, 465–478.
Brehmer, Y., Li, S.-C., Straube, B., Stoll, G., von Oertzen, T., Mueller, V., and Lindenberger, U. (2008). Comparing memory skill maintenance across the life span: preservation in adults, increase in children. Psychol. Aging 23, 227–238.
Brehmer, Y., Stoll, G., Bergner, S., Benoit, R., von Oertzen, T., and Lindenberger, U. (2004). Selection of Unambiguous Visual Words, Appropriate for Children in Age-Comparable Memory Experiments: Results of a Pilot Study. Available: http://psydoc.sulb.uni-saarland.de/volltexte/2004/189
Bryk, A. S., and Raudenbush, S. W. (1987). Application of hierarchical linear models to assessing change. Psychol. Bull. 101, 147–158.
Cox, B. D. (2001). Children's use of mnemonic strategies: variability in response to metamemory training. J. Genet. Psychol. 155, 423–442.
Duncan, T. E., Duncan, S. C., and Li, F. (1998). A comparison of model- and multiple imputation-based approaches to longitudinal analyses with partial missingness. Struct. Equ. Model. 5, 1–21.
Dunlosky, J., Hertzog, C., and Powell-Moman, A. (2005). The contribution of mediator-based deficiencies to age differences in associative learning. Dev. Psychol. 41, 389–400.
Enders, C. K. (2001). The impact of non-normality of full information maximum-likelihood estimation for structural equation models with missing data. Psychol. Methods 6, 352–370.
Finkbeiner, C. (1979). Estimation for the multiple factor model when data are missing. Psychometrika 44, 409–420.
Garlick, D. (2002). Understanding the nature of the general factors of intelligence: the role of individual differences in neural plasticity as an explanatory mechanism. Psychol. Rev. 109, 116–136.
Gaultney, J. F., Bjorklund, D. F., and Goldstein, D. (1996). To be young, gifted, and strategic: advantages for memory performance. J. Exp. Child Psychol. 61, 43–66.
Hertzog, C., von Oertzen, T., Ghisletta, P., and Lindenberger, U. (2008). Evaluating the power of latent growth curve models to detect individual differences in change. Struct. Equ. Model. 15, 541–563.
Jin, P. (1992). Toward a reconceptualization of the law of initial value. Psychol. Bull. 111, 176–184.
Kliegl, R., and Lindenberger, U. (1993). Modeling intrusions and correct recall in episodic memory: adult age differences in encoding of list context. J. Exp. Psychol. Learn. Mem. Cogn. 19, 617–637.
Kliegl, R., Mayr, U., and Krampe, R. T. (1994). Time-accuracy functions of determining process and person differences: an application to cognitive aging. Cognit. Psychol. 26, 134–164.
Kliegl, R., Smith, J., and Baltes, P. B. (1990). On the locus and process of magnification of age differences during mnemonic training. Dev. Psychol. 26, 894–904.
Kramer, A. F., and Willis, S. L. (2002). Enhancing the cognitive vitality of older adults. Curr. Dir. Psychol. Sci. 11, 173–177.
Kwon, Y.-J., and Lawson, A. E. (2000). Linking brain growth with the development of scientific reasoning ability and conceptual change during adolescence. J. Res. Sci. Teach. 37, 44–62.
Li, S.-C., Lindenberger, U., Hommel, B., Aschersleben, G., Prinz, W., and Baltes, P. B. (2004). Transformation in the coupling among intellectual abilities and constituent cognitive processes across the life span. Psychol. Sci. 15, 155–163.
Lindenberger, U., Kliegl, R., and Baltes, P. B. (1992). Professional expertise does not eliminate age differences in imagery-based memory performance during adulthood. Psychol. Aging 7, 585–593.
Lindenberger, U., Mayr, U., and Kliegl, R. (1993). Speed and intelligence in old age. Psychol. Aging 8, 207–220.
Lövdén, M., Ghisletta, P., and Lindenberger, U. (2004). Cognition in the Berlin aging study (BASE): the first 10 years. Aging Neuropsychol. Cogn. 11, 104–133.
Lövdén, M., Bäckman, L., Lindenberger, U., Schäfer, S., and Schmiedek, F. (2010). A theoretical framework for the study of adult cognitive plasticity. Psychol. Bull. 4, 659–676.
Mayr, U., Kliegl, R., and Krampe, R. (1996). Sequential and coordinative processing dynamics in figural transformations across the life span. Cognition 59, 61–90.
McArdle, J. J. (1994). Structural factor analysis experiments with incomplete data. Multivariate Behav. Res. 29, 409–454.
McArdle, J. J. (2006). “Dynamic structural equation modeling in longitudinal experimental studies,” in Longitudinal Models in the Behavioural and Related Sciences, eds Kees van Montfort, Han Oud, and Alberto Satorra (Mahwah, NJ: Erlbaum, EAM Book Series), 159–187.
McArdle, J. J., and Epstein, D. (1987). Latent growth curves within developmental structural equation models. Child Dev. 58, 110–133.
McArdle, J. J., and Nesselroade, J. R. (1994). “Using multivariate data to structure development change,” in Life-Span Developmental Psychology: Methodological Contributions, eds S. H. Cohen and H. W. Reese (Hillsdale, NJ: LEA), 223–268.
Neisser, U., Boodoo, G., Bouchard, T. J., Boykin, A. W., Brody, N., Ceci, S. J., Halpern, D. F., Loechlin, J. C., Perloff, R., Sternberg, R. J., and Urbina, S. (1996). Intelligence: knowns and unknowns. Am. Psychol. 51, 77–101.
Rönnlund, M., Nyberg, L., Bäckman, L., and Nilsson, L.-G. (2005). Stability, growth, and decline in adult life span development of declarative memory: cross-sectional and longitudinal data from a population-based study. Psychol. Aging 20, 3–18.
Schafer, J. L., and Graham, J. W. (2002). Missing data: our view of the state of the art. Psychol. Methods 7, 147–177.
Schaie, K. W. (1996). Intellectual Development in Adulthood: The Seattle Longitudinal Study. New York, NY: Cambridge University Press.
Schneider, W. (2012). “Memory development in childhood” in Blackwell Handbook of Childhood Cognitive Development, ed U. Goswami (London, UK: Blackwell), 236–256.
Shing, Y. L., Werkle-Bergner, M., Brehmer, Y., Muller, V., Li, S. C., and Lindenberger, U. (2010). Episodic memory across the lifespan: the contributions of associative and strategic components. Neurosci. Biobehav. Rev. 34, 1080–1091.
Shing, Y. L., Werkle-Bergner, M., Li, S.-C., and Lindenberger, U. (2008). Associative and strategic components of episodic memory: a life-span dissociation. J. Exp. Psychol. Gen. 137, 495–513.
Sternberg, R. J., and Detterman, D. K. (eds). (1986). What Is Intelligence? Contemporary Viewpoints on Its Nature and Definition. Norwood, NJ: Ablex.
Sullivan, A. M. (1964). The Relation Between Intelligence and Transfer. Unpublished doctoral dissertation. McGill University, Montreal, QC: Canada.
Verhaeghen, P., and Kliegl, R. (2000). The effects of learning a new algorithm on asymptotic accuracy and execution speed in old age: a reanalysis. Psychol. Aging 15, 648–656.
Verhaeghen, P., and Marcoen, A. (1996). On the mechanisms of plasticity in young and older adults after instruction in the method of loci: evidence for an amplification model. Psychol. Aging 11, 164–178.
Verhaeghen, P., Marcoen, A., and Goossens, L. (1992). Improving memory performance in the aged through mnemonic training: a meta-analytic study. Psychol. Aging 7, 242–251.
Wechsler, D. (1958). The Measurement and Appraisal of Adult Intelligence, 4th edn. Baltimore, MD: Williams and Wilkins.
Werkle-Bergner, M., Müller, V., Li, S.-C., and Lindenberger, U. (2006). Cortical EEG correlates of successful memory encoding: implications for lifespan comparisons. Neurosci. Biobehav. Rev. 30, 839–854.
Keywords: memory plasticity, magnification, amplification, compensation, associative memory, aptitude by treatment interactions
Citation: Lövdén M, Brehmer Y, Li S-C and Lindenberger U (2012) Training-induced compensation versus magnification of individual differences in memory performance. Front. Hum. Neurosci. 6:141. doi: 10.3389/fnhum.2012.00141
Received: 14 February 2012; Accepted: 02 May 2012;
Published online: 15 May 2012.
Edited by:
Julia Karbach, Saarland University, GermanyCopyright: © 2012 Lövdén, Brehmer, Li and Lindenberger. This is an open-access article distributed under the terms of the Creative Commons Attribution Non Commercial License, which permits non-commercial use, distribution, and reproduction in other forums, provided the original authors and source are credited.
*Correspondence: Martin Lövdén, Aging Research Center, Karolinska Institutet, Gävlegatan 16, 113 30 Stockholm, Sweden. e-mail: martin.lovden@ki.se