The lesioned brain: still a small-world?
- 1 Department of Neurology, VU University Medical Center, Amsterdam, Netherlands
- 2 Department of Neurosurgery, VU University Medical Center, Amsterdam, Netherlands
- 3 Department of Medical Psychology, VU University Medical Center, Amsterdam, Netherlands
- 4 Department of Clinical Neurophysiology and The Epilepsy Monitoring Unit, Dutch Epilepsy Clinics Foundation, Heemstede, Netherlands
- 5 Department of Psychology, Dutch Epilepsy Clinics Foundation, Heemstede, Netherlands
- 6 Department of Neurology, Academic Medical Center, Amsterdam, Netherlands
- 7 Department of Clinical Neurophysiology, VU University Medical Center, Amsterdam, Netherlands
The intra-arterial amobarbital procedure (IAP or Wada test) is used to determine language lateralization and contralateral memory functioning in patients eligible for neurosurgery because of pharmaco-resistant epilepsy. During unilateral sedation, functioning of the contralateral hemisphere is assessed by means of neuropsychological tests. We use the IAP as a reversible model for the effect of lesions on brain network topology. Three artifact-free epochs (4096 samples) were selected from each electroencephalogram record before and after amobarbital injection. Functional connectivity was assessed by means of the synchronization likelihood. The resulting functional connectivity matrices were constructed for all six epochs per patient in four frequency bands, and weighted network analysis was performed. The clustering coefficient, average path length, small-world index, and edge weight correlation were calculated. Recordings of 33 patients were available. Network topology changed significantly after amobarbital injection: clustering decreased in all frequency bands, while path length decreased in the theta and lower alpha band, indicating a shift toward a more random network topology. Likewise, the edge weight correlation decreased after injection of amobarbital in the theta and beta bands. Network characteristics after injection of amobarbital were correlated with memory score: higher theta band small-world index and increased upper alpha path length were related to better memory score. The whole-brain network topology in patients eligible for epilepsy surgery becomes more random and less optimally organized after selective sedation of one hemisphere, as has been reported in studies with brain tumor patients. Furthermore, memory functioning after injection seems related to network topology, indicating that functional performance is related to topological network properties of the brain.
Introduction
The Wada test (intra-arterial amobarbital procedure, IAP) is a commonly used test to determine language dominance and memory capacity in surgery candidates with temporal lobe epilepsy (TLE; Wada and Rasmussen, 1960; Rosenow and Luders, 2001). During the IAP, functioning of the non-anesthetized hemisphere can temporarily be assessed by means of standardized neuropsychological testing, while sodium amobarbital selectively suppresses neural activity in the barbiturate-perfused cerebral regions of the hemisphere ipsilateral to the internal carotid artery catheterized. The IAP has for long been a clinically essential tool in determining patients’ eligibility for epilepsy surgery, since it determines language dominance and whether the non-sedated hemisphere has sufficient reserve capacity to sustain memory functions after resection of (parts of) the affected temporal lobe.
In addition to its clinical application, the IAP can be considered a research model of reversibly “shutting down” the greater part of one hemisphere of the brain. Functional connectivity refers to the statistical interdependencies between time series (Aertsen et al., 1989), and may change when lesions occur in the brain. Functional connectivity is thought to reflect communication between different brain areas, thus having a major impact on optimal brain functioning (Tononi and Edelman, 1998; Singer, 1999; Varela et al., 2001; Bressler, 2002; Reijneveld et al., 2007). Previous research at our department showed that functional connectivity of the electroencephalogram (EEG) changed dramatically after amobarbital injection (Douw et al., 2009). Changes in connectivity were found not only in the injected and contralateral hemispheres themselves, but also in the interaction between both hemispheres. These results suggest that connectivity throughout the whole brain immediately reacts to changes in activity level in one part of the brain.
The brain functions as a complex integrated network, in which focal changes influence the integrity and functional status of the brain as a whole. Patterns of connectivity between brain areas may change when suppressing activity in one hemisphere. Visual representations of these patterns can be constructed from neurophysiological time series, such as recorded with EEG. The electrodes or brain areas are nodes in the network, while functional connectivity is the strength of the link between these vertices. The application of complex network theory or “graph theory” to the brain has proven to be relevant for brain functioning (Reijneveld et al., 2007; Bullmore and Sporns, 2009). Not only does graph theory provide information about the level of communication throughout different parts of the brain, it may also prove possible to define an “optimal” network for brain functioning. This optimal network would include concepts that are pivotal in many types of complex networks, such as localized segregation combined with overall integration. Watts and Strogatz proposed a theoretical framework for a network that may contain two of the essential features of brain networks, the so-called “small-world” network (Watts and Strogatz, 1998; Stam, 2010). This network combines both high local “clustering” with short “path length,” which refers to the average number of links or “edges” that have to be crossed to reach any other node or “vertex” in the network. Another important feature of brain network topology may be the edge weight correlation, referring to the extent to which connections to one node have similar weights. A network consisting of nodes with high edge weight correlation seems to be most beneficial to information processing (Ramasco and Goncalves, 2007). Although a complete model of brain functioning does not exist at this point (Stam, 2010), exploration of the small-world topology does help us understand networks in the brain, using relatively simple measures such as clustering and path length.
Several studies have shown that both structural and functional brain networks in healthy humans and animals can be characterized by the small-world principle (Watts and Strogatz, 1998; Hilgetag et al., 2000; Salvador et al., 2005; Achard et al., 2006; He et al., 2007; Supekar et al., 2008). Network theory is also increasingly applied to patients with brain disease, for instance in Alzheimer’s disease (Stam et al., 2009) and schizophrenia (Micheloyannis et al., 2006b). However, investigations regarding the impact of circumscribed lesions on network features in the human brain are rather sparse up till now. Studies in brain tumor patients have shown that these patients display a loss of the small-world configuration of the brain when compared to healthy controls (Bartolomei et al., 2006; Honey and Sporns, 2008; Bosma et al., 2009). Moreover, network topology in these patients was related to poorer cognitive functioning (Bosma et al., 2009).
The reversible IAP is a highly useful model to investigate acute adaptation of global functional brain networks after lesioning. In this study, we use the IAP as a simulation of the acute effects of a lesion on graph theoretical features of the brain. We hypothesize that “shutting down” parts of one complete hemisphere has significant effects on functioning and network topology of the whole brain, possibly having an impact similar to brain tumors. Furthermore, we investigate the association between these network properties and cognitive performance during the Wada test.
Materials and Methods
Patients
Electroencephalogram data from all patients who underwent the IAP between November 2003 and October 2007 at the VU University Medical Center were visually inspected for this retrospective study. Functional connectivity in these patients has been described earlier (Douw et al., 2009). All patients suffered from pharmaco-resistant epilepsy and were selected for TLE surgery, warranting a preoperative IAP. Only patients of whom three artifact-free epochs of 8 s directly before and after amobarbital injection could be selected were included. The EEGs and neuropsychological data that were used were recorded as part of regular patient care, and data were analyzed anonymously in this study. The medical ethical committee approved this retrospective study and decided informed consent was not needed.
Intra-Arterial Amobarbital Procedure
In order to inject the amobarbital selectively into the internal carotid artery, a 4F catheter was placed via a femoral artery approach, guided by angiography. In order to observe flow patterns through the circle of Willis, selective angiography of the internal carotid artery and visualization in posterior–anterior and lateral projection was performed in all patients before injection of the sodium amobarbital. None of the patients showed cross-flow into the contralateral arteria cerebri media. The injections of amobarbital were administered by hand through a catheter which was removed immediately after injection. Patients were typically injected with a bolus of 125 mg sodium amobarbital in 2.5 cc. Patients had their eyes open, and were instructed to lie still as much as possible during the procedure. The aim of the IAP is to assess language lateralization and memory functioning of the hemisphere contralateral to the temporal lobe that is to be resected. Approximately 2.5 min after amobarbital injection, the patients are visually presented with five pictures of random objects, which they must try to remember. When the amobarbital effects wear out after on average 15 min (as seen on the EEG recording), recognition of the objects patients have been presented with during the sedated period is assessed. This yields a correct percentage of 0, 20, 40, 60, 80, or 100%. A score above 60% indicates that enough memory functioning is present in the contralateral presumed healthy hemisphere, rendering the patient eligible for resection.
EEG Recording and Data Selection
Electroencephalography was performed continuously from approximately 1 h before to half an hour after the Wada procedure. EEGs were recorded with a digital EEG apparatus (Brainlab, manufactured by OSG) from Fp2, Fp1, F8, F7, F4, F3, A2, A1, T4, T3, C4, C3, T6, T5, P4, P3, O2, O1, Fz, Cz, and Pz with tin electrodes. Impedance was kept below 5 kΩ. Initial filter settings were: time constant 1 s and high frequency cut-off 70 Hz. Sampling frequency was 500 Hz per channel, no data skew with a 16-bit AD conversion precision. As reference for the EEG, an average montage was used during measurements.
During the Wada procedure, patients are firstly injected with amobarbital in the lesioned side of the brain. Some patients also undergo sedation of the contralateral hemisphere after the effect of the first injection has faded. However, in order to ensure that no delayed sedation effects could account for our results, we only used first injection epochs, which were all performed in the lesioned hemisphere. The amobarbital effect is maximal up to the first minute after starting the injection. Therefore, the three most artifact-free epochs of 8 s (i.e., 4096 samples) were visually selected [LD] both from the 40 s directly before and directly after injection. The two frontoparietal (Fp2,1) as well as the auricular (A2,1) electrodes were excluded to minimize artifacts due to eye movements. Further analyses of functional connectivity were performed off-line with software developed at the Department of Clinical Neurophysiology of the VU University Medical Center [DIGEEGXP (CJS)].
Functional Connectivity and Graph Analysis
In order to calculate graph theoretical variables, the synchronization likelihood (SL, see Stam and van Dijk, 2002; Montez et al., 2006), a non-linear measure of synchrony between two time series, was used as an index of functional connectivity. Synchronization likelihoods between all combinations of the 17 included electrodes were determined, providing us with a 17 × 17 matrix of SL values. These matrices were calculated in the following four frequency bands: theta (4–8 Hz), lower alpha (8–10 Hz), upper alpha (10–13 Hz), and beta (13–30 Hz) (see Stam et al., 2006). The delta and gamma bands were not analyzed, because these frequency bands are sensitive to sedation effects and movement artifacts, respectively (Hong et al., 2000; Whitham et al., 2007; Pope et al., 2009). The results of our functional connectivity analysis in this patient group have been published previously (Douw et al., 2009).
Graph theory was used to analyze the effects of IAP on neural network topology. A graph is a topographical representation of a network, constructed by vertices and edges between these nodes. Various measures can be used to characterize a graph, three of which were used in this study (see Bullmore and Sporns, 2009; Rubinov and Sporns, 2010, for recent reviews). The clustering coefficient C, which is the likelihood that neighbors of a vertex will also be connected, characterizes the tendency of nodes to form local clusters. The average path length L, which is the average shortest path length connecting two vertices counted as a number of edges, is a measure for global integration of the network. The combination of high local clustering and a short average path length seems to be the optimal configuration for efficient communication in a network (Watts and Strogatz, 1998). A small-world network, which is thought to be a feasible model for human brain networks, has such a configuration. In our analysis, we constructed weighted graphs, in which a certain weight is given to each edge that reflects the importance or strength of the edge (Stam et al., 2009). The strength of each edge was defined as the SL between the pair of vertices. Based on these weights, the clustering coefficient Cw and average shortest path length Lw were calculated while assuming networks to be symmetric. Clustering coefficient was defined as:
This coefficient per node was averaged over the entire network with the following formula:

Average path length of the network was computed as follows:
For a more extensive description of the procedures see Stam et al. (2009).
All network properties depend not only on edge weights and network structure but also on network size. The use of a certain reference which corrects for network size would increase comparability of network characteristics. We therefore compared all characteristics to those of 1000 surrogate random networks of the same size, resulting in the measures Cw/Cws, Lw/Lws. The surrogate networks were obtained from the original networks by randomly reshuffling the edge weights, which produces an equal probability over the whole matrix. Symmetry was retained in this network, but node strength is not retained exactly in these weighted random networks. More information on the surrogate networks can be found in Sporns and Zwi (2004). The small-world characteristics of the network were measured using the small-world index S (Humphries et al., 2008), which is defined as S = (Cw/Cws)/(Lw/Lws). A network is considered a small-world network if Cw/Cws > 1 and Lw/Lws ∼ 1. Any value of S > 1 thus is account for small-world network.
Finally, we calculated the edge weight correlation. This is a measure for the correlation between weights of neighboring edges, i.e., edges that connect to the same vertex (Ramasco and Goncalves, 2007). The weight correlation is calculated as the range between the highest and lowest weight of all edges per vertex. This range is then compared to that of the random equivalent of the network, in which the edges are randomly redistributed over the vertices while their weights are kept unchanged (as described above for other network characteristics). When the resulting value Wr < 1, a positive weight correlation exists (because the range of neighboring weight values is smaller than in a random network), whereas the weights are anti-correlated when Wr > 1. It has been shown that a positive weight correlation dramatically increases transport over the network, and especially as Wr reaches 0; a positive correlation indicates that highly connected paths are present (Ramasco and Goncalves, 2007).
Statistical Analysis
All statistical analyses were performed using SPSS 15.0 for Windows (SPSS Inc., Chicago, IL, USA). Since the data regarding network characteristics did not show a normal distribution, non-parametric tests were used to analyze differences between groups. Wilcoxon signed rank tests were used to compare within subject Cw/Cws, Lw/Lws, S, and Wr values before and after amobarbital injection. Non-parametric Mann–Whitney tests were performed to explore differences regarding network characteristics between patients with left or right hemisphere lesions, patients with mesial temporal sclerosis (MTS) or a tumor, and male and female patients. The false discovery rate (FDR) was applied per frequency band to correct our results for multiple testing and avoid type I error when investigating network properties (Benjamini and Hochberg, 1995; Nolte et al., 2004). This method is less conservative than for example the Bonferroni correction, and it is used frequently in imaging experiments.
In our analysis of the correlation between topological features and test performance during the IAP, we used the non-parametric Kendall’s tau. Because of the exploratory nature of these analyses, no correction for multiple testing was applied, and significance was set at p < 0.05.
Results
Patient Characteristics
Fifty-seven patients underwent the IAP during the inclusion period. Artifact free epochs from the first injection into the lesioned hemisphere were not available in 24 patients. All statistical analyses were performed on the remaining 33 patients. These 33 patients (18 male) had a mean age of 37 years (SD = 12.2). The cause of localization-related epilepsy was a histopathologically confirmed tumor in 19 patients (58%), of whom 13 had the tumor in the left hemisphere. Thirteen patients (39%) had MTS, left-sided in four patients. One patient (2%) suffered from gliosis in the right hemisphere due to trauma. In total, 17 patients suffered from a lesion in the left hemisphere and had amobarbital injected into this hemisphere. The other 16 patient had right-sided lesions and underwent the IAP with injection in the right hemisphere. The lesion was located in the temporal lobe in 30 patients (91%), while a fronto-temporal lesion was present in 3 patients (9%). The 24 patients who could not be included due to artifacts in EEG recordings and non-lesioned first injection side did not differ from the included patients with respect to age, sex, lesion type, and lesion lateralization.
Network Changes
Neural network characteristics after injection of amobarbital were compared to the resting-state before injection by means of Wilcoxon signed rank tests (see Table 1). Results for clustering coefficient, path length, and small-world index are shown in Figure 1A, while changes in edge weight correlation are depicted in Figure 1B.
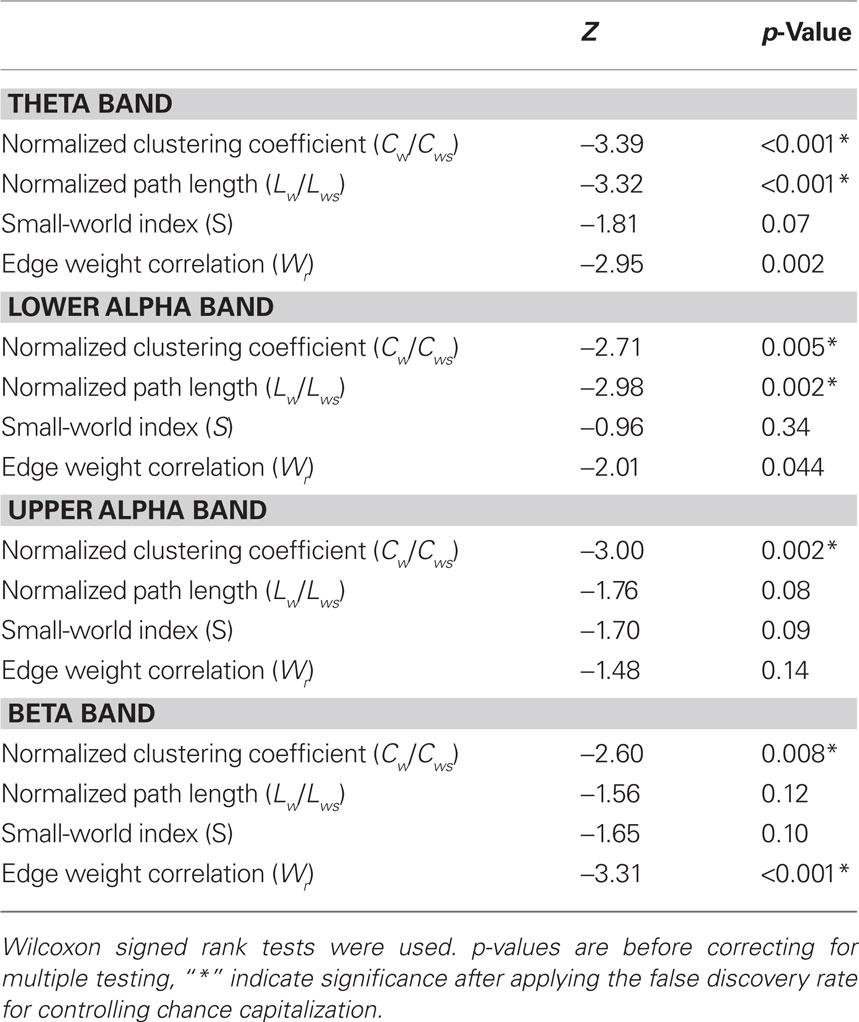
Table 1. Test statistics of all comparisons between network characteristics before and after injection of amytal.
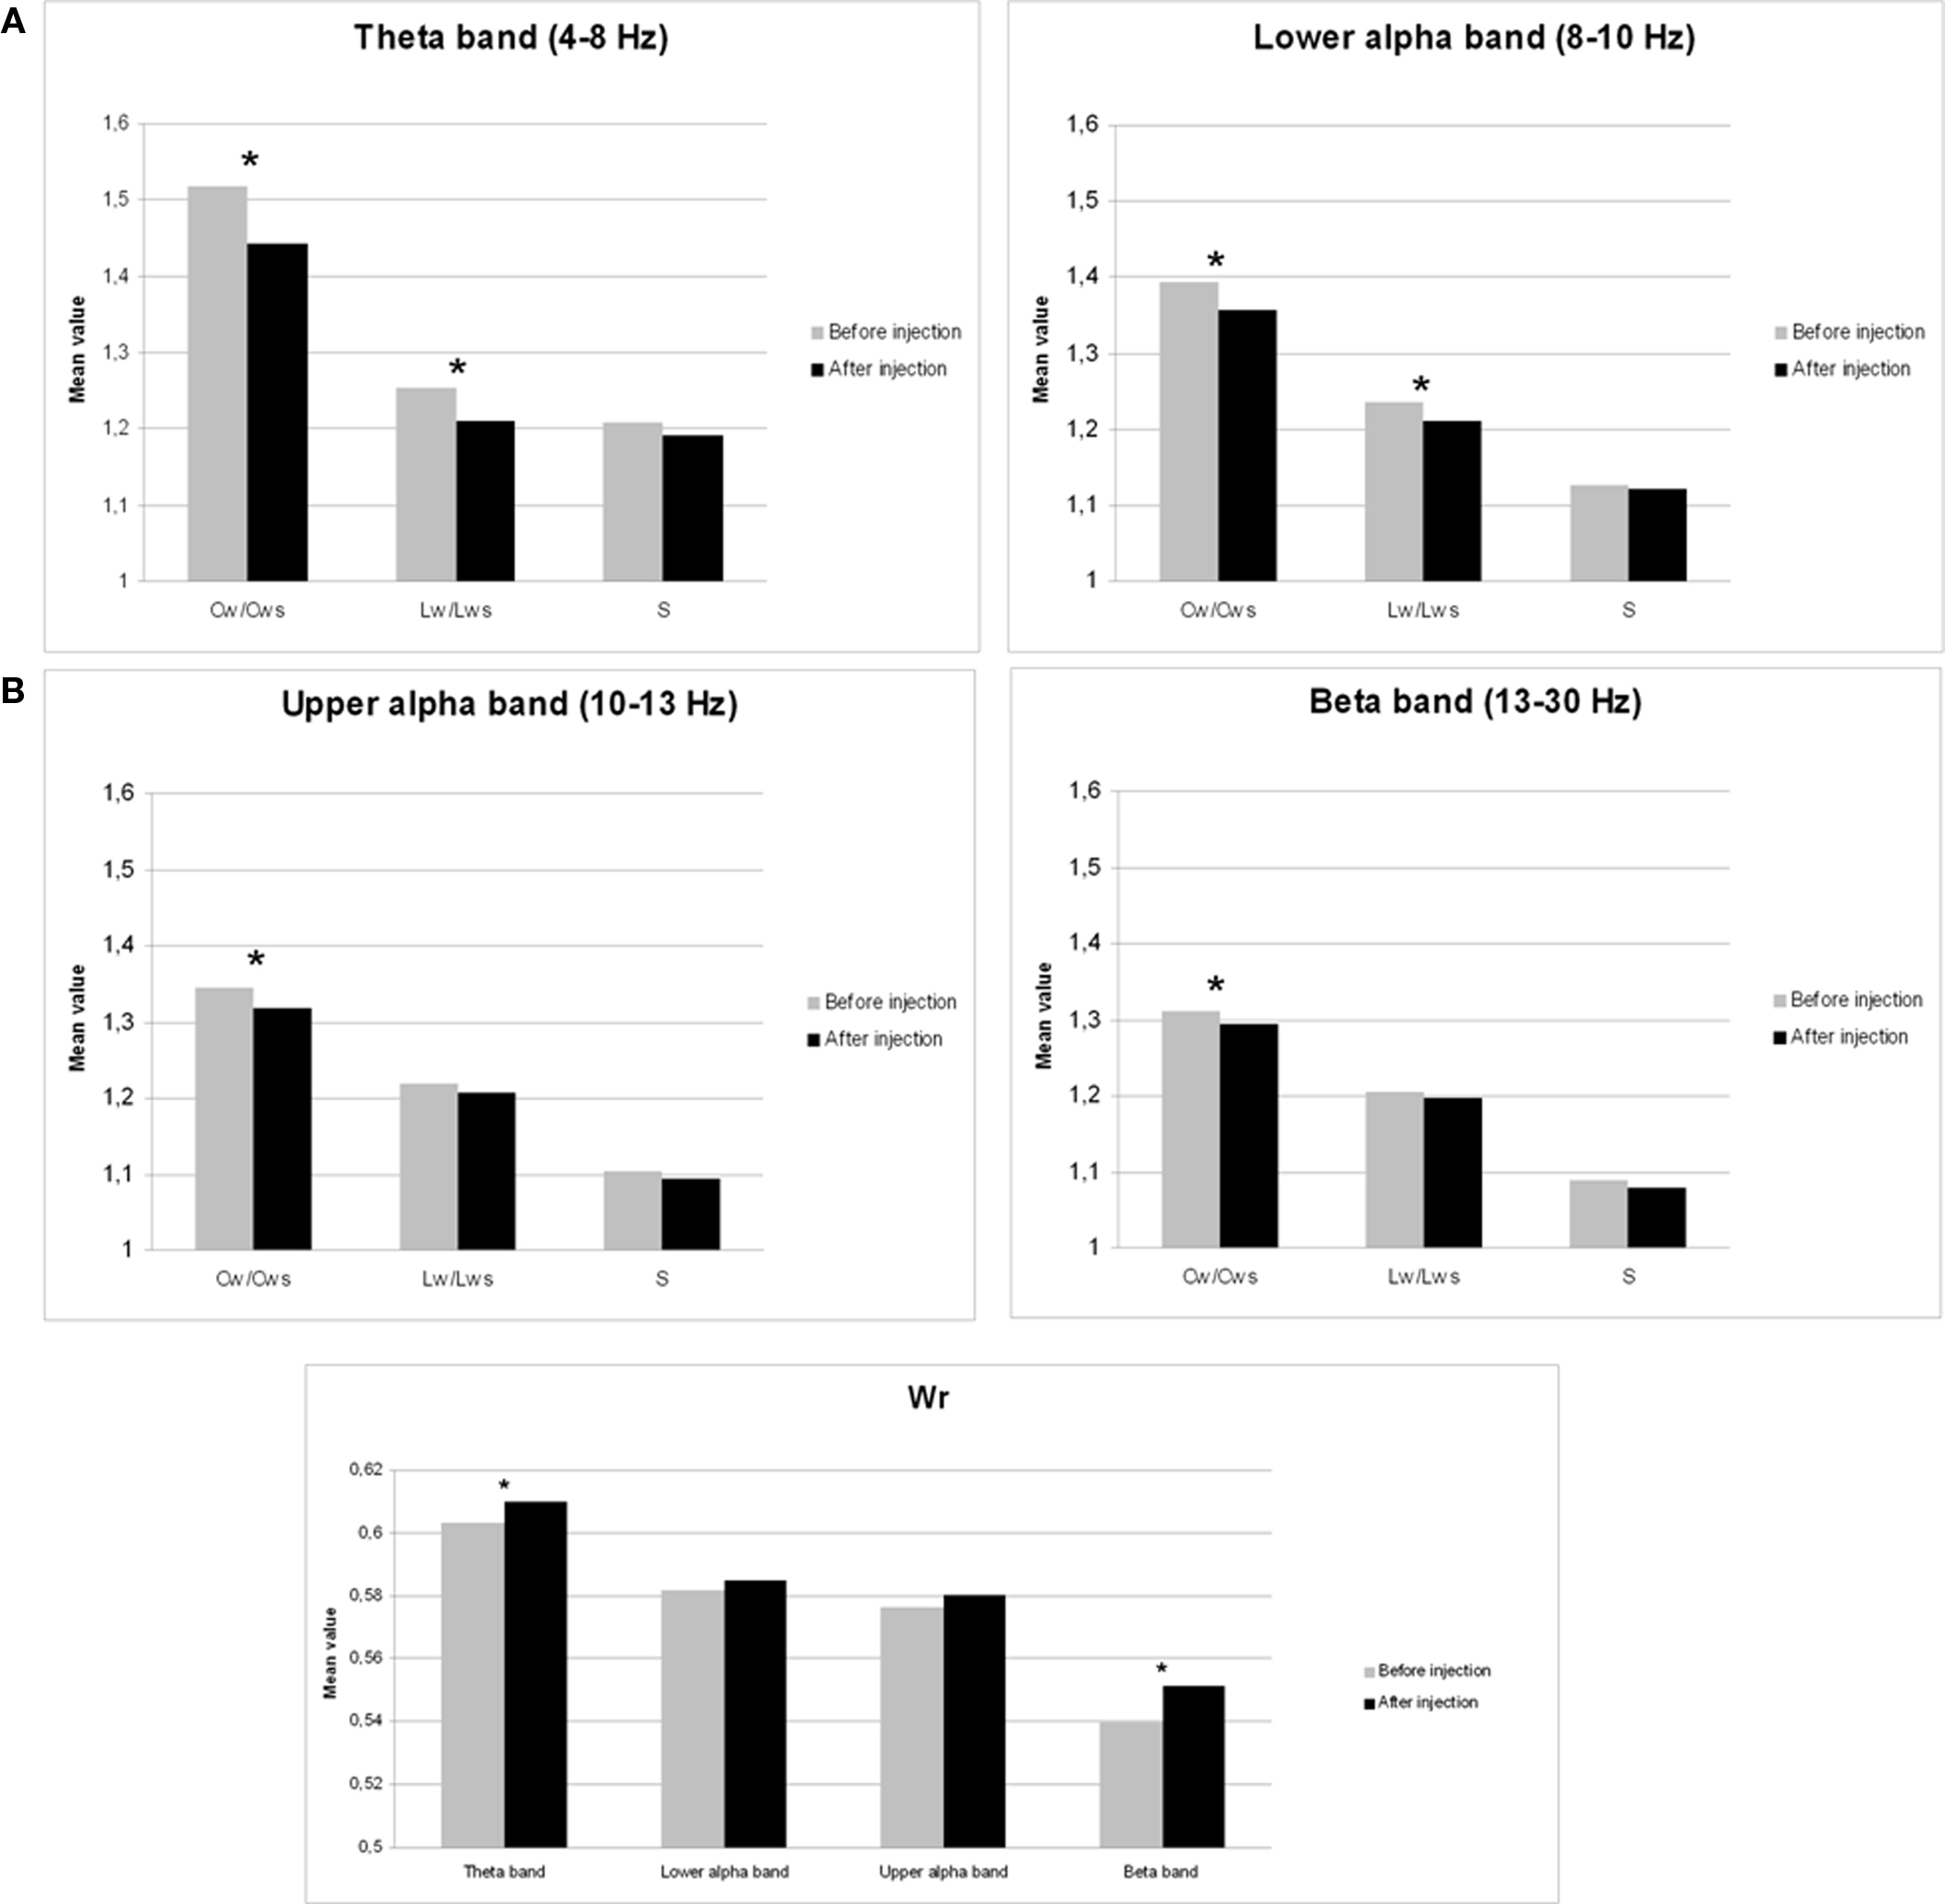
Figure 1. Mean changes in network features after injection of sodium amobarbital. *p < 0.05 (corrected for multiple comparisons). (A) Cw/Cws = normalized clustering coefficient, Lw/Lws = normalized average path length, S = small-world index. (B) Wr = edge weight correlation.
The normalized clustering coefficient significantly decreased after injection of amobarbital across all frequency bands: the theta band (p < 0.001), lower and upper alpha band (p = 0.006 and p = 0.002 respectively), and in the beta band (p = 0.008; note that the given p = values are uncorrected, but pass the FDR multiple comparisons test for p < 0.05). The post-injection theta band average path length also decreased when compared to resting-state (p = 0.001), as it did in the lower alpha band (p = 0.002). Furthermore, edge weight correlation decreased significantly after injection in the theta band (p = 0.002) and in the beta band (p = 0.001). These findings indicate that amobarbital generally caused a more random and less optimal network topology after injection, while results are not inherent to changes in SL due to the normalization of all network measures with random networks. To confirm this finding, correlations between SL levels and memory scores were also explored, but no significant correlations were found. An example of synchronization strength per node is shown in Figure 2A, while connectivity within both hemispheres, between the central areas and the hemispheres, and between the two hemispheres is depicted in the Figures 2B–D, respectively.
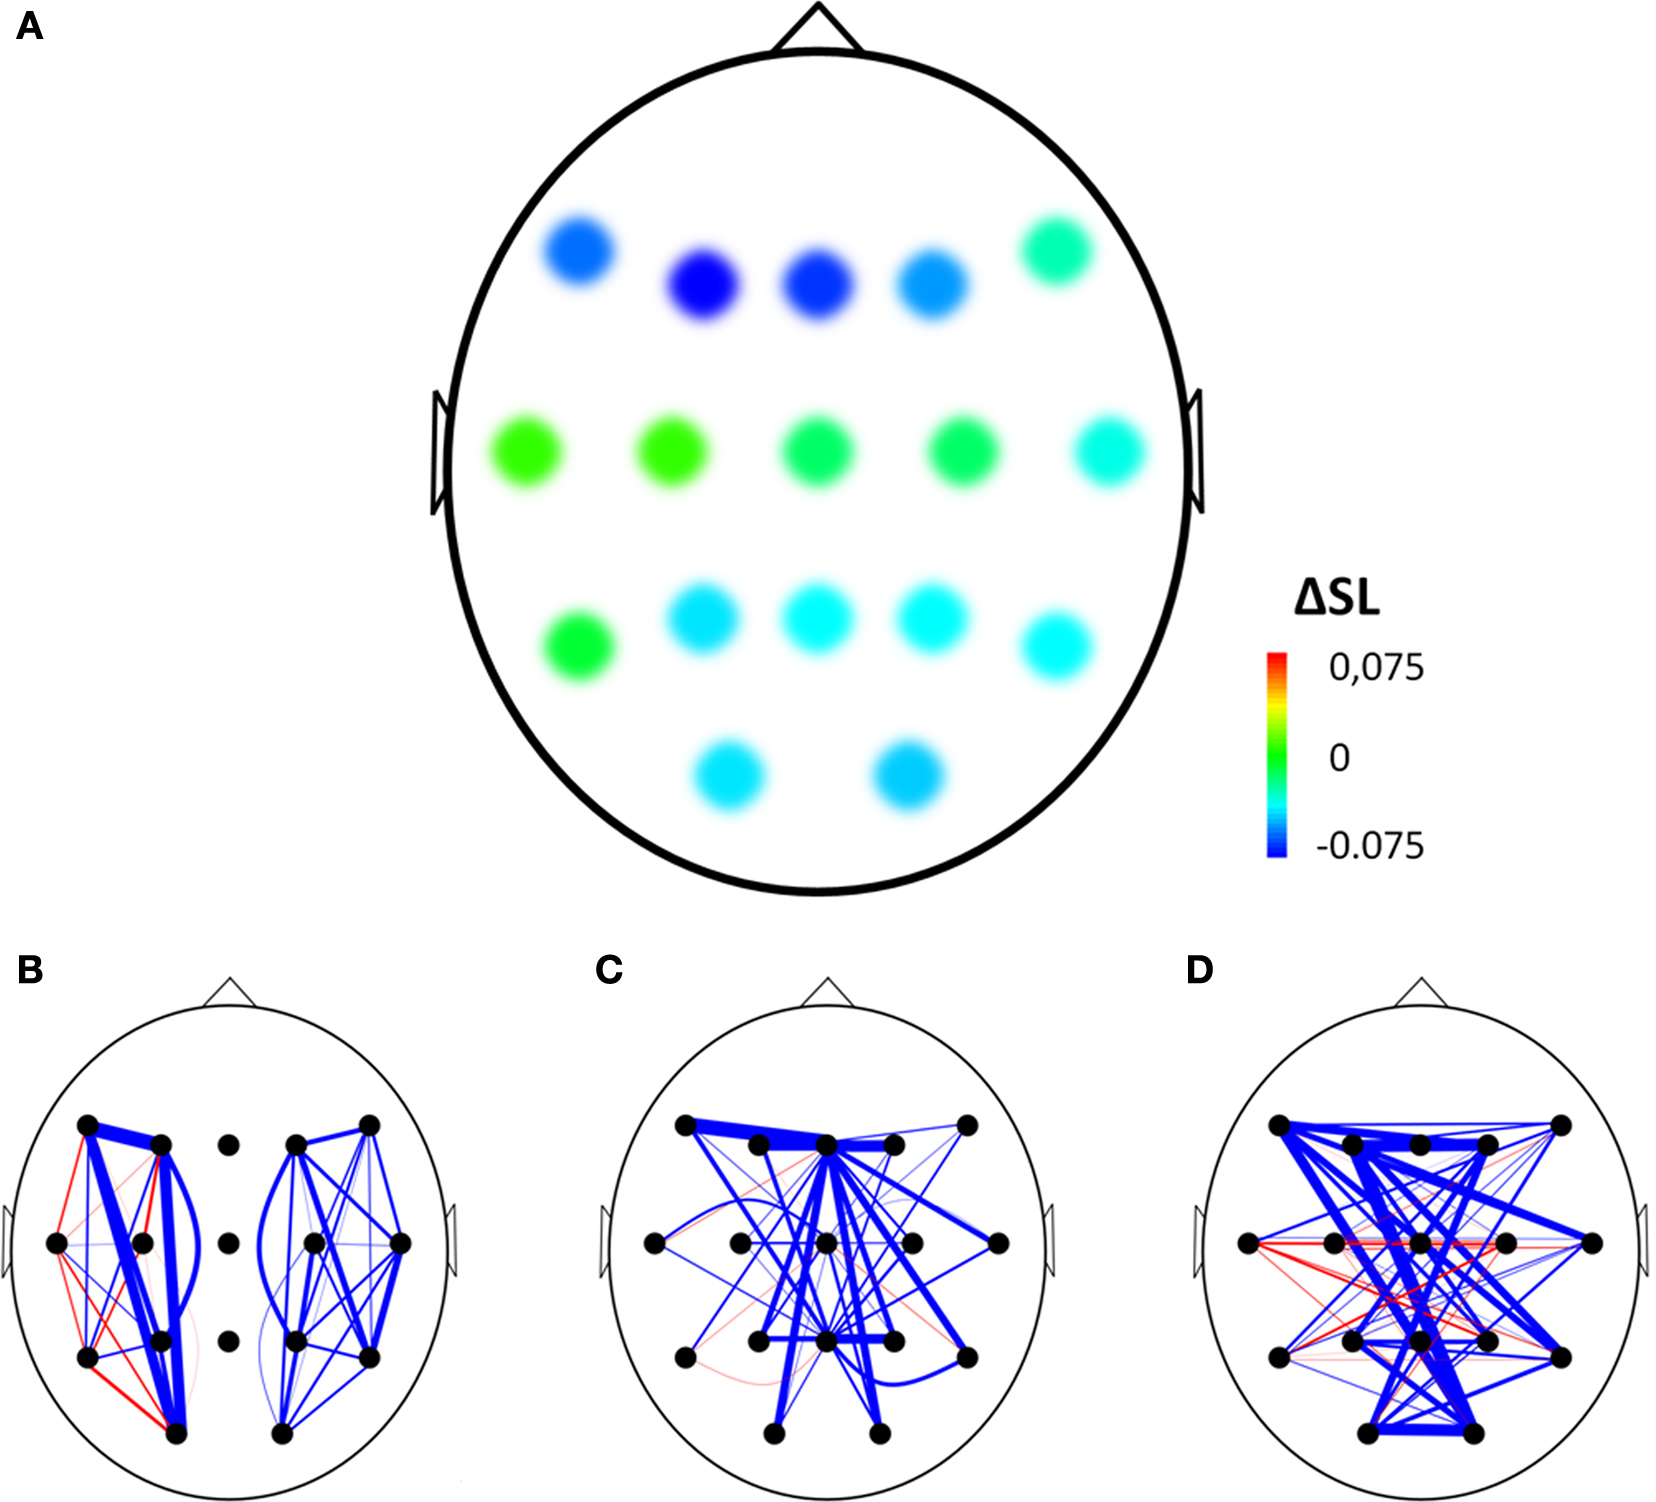
Figure 2. Example of changes in synchronization from before to after injection of amobarbital in the right hemisphere of one representative subject. (A) Mean changes in synchronization for each electrode with all other electrodes, ΔSL = difference in mean synchronization likelihood between before and after injection of amobarbital. (B–D) Blue line indicates decrease of synchronization likelihood between two electrodes, red line indicates increase. Thickness of lines indicates extent of change after injection (thin = small, thick = large). Three types of edges are depicted: (B) within hemisphere edges, (C) edges between the central (midline) electrodes and the other electrodes, and (D) interhemispheric edges.
Patients differed on a number of clinical variables, which could influence network topology. Because of the small sample size and non-parametric distribution of network properties, multivariate analyses of several covariates was not performed. Instead, possible differences in network topology change were explored by means of post hoc non-parametric Mann–Whitney tests, with which differences between property deltascores between patient groups (i.e., subtraction of the after injection value from the before injection value) were tested. Differences between patients with tumors (n = 19) and MTS (n = 13) were tested, excluding the one patient with gliosis due to trauma. No significant differences in deltascores were found (see Table 2). The possible impact of lesion lateralization and thus side of injection (left n = 17, right n = 16) was also explored. Changes in network properties were not significantly influenced by lateralization of the lesion (see Table 2). We were also interested in possible gender effects on our results, so the same methods were used to explore differences between men (n = 18) and women (n = 15). In the beta band, men’s clustering coefficient deltascore was significantly lower (M = −0.004) when compared to the women’s score (M = −0.034; p = 0.007), indicating that beta band clustering significantly decreased in women but not in men (see Table 2).
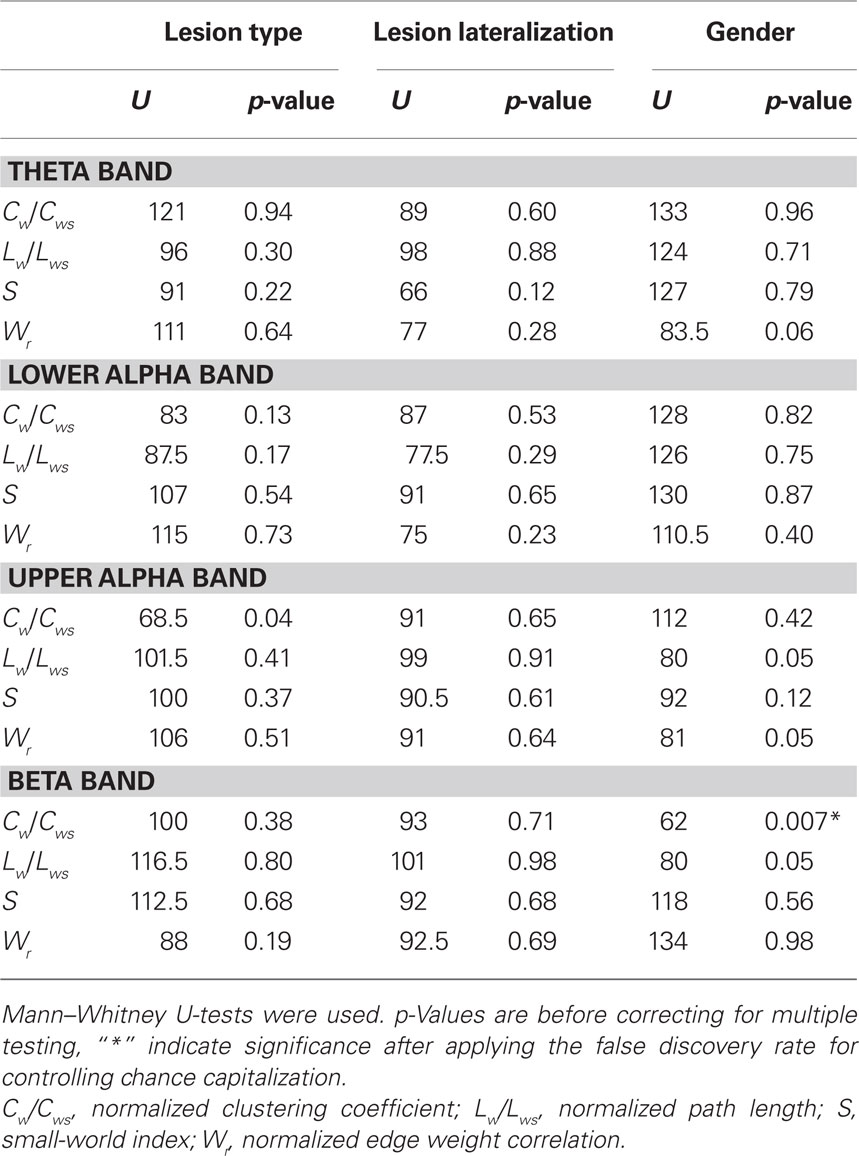
Table 2. Test statistics of variables (lesion type, lesion lateralization, gender) possibly confounding changes in network characteristics.
Exploring Network Characteristics and IAP Memory Score
Previous research has shown that network topology may be important for cognitive functioning (Micheloyannis et al., 2006a; Bosma et al., 2009; van den Heuvel et al., 2009); therefore we explored the association between network topology after injection and IAP memory score. Kendall’s tau was used to correlate network features with memory score of the healthy hemisphere (i.e., after injection in the lesioned hemisphere). Results showed a significant association between better memory score and higher small-world index in the theta band after injection (Kendall’s tau = 0.299, p = 0.033), and a significant correlation was present between longer upper alpha path length after injection and better memory score (Kendall’s tau = 0.313, p = 0.026; see Table 3 and Figure 3). No correlations were present between memory performance and network topology before injection of amobarbital, nor were changes in topology associated with better or poorer cognitive functioning. These results indicate that more ordered networks in the theta band and longer upper alpha band path length after injection were related to better memory score.
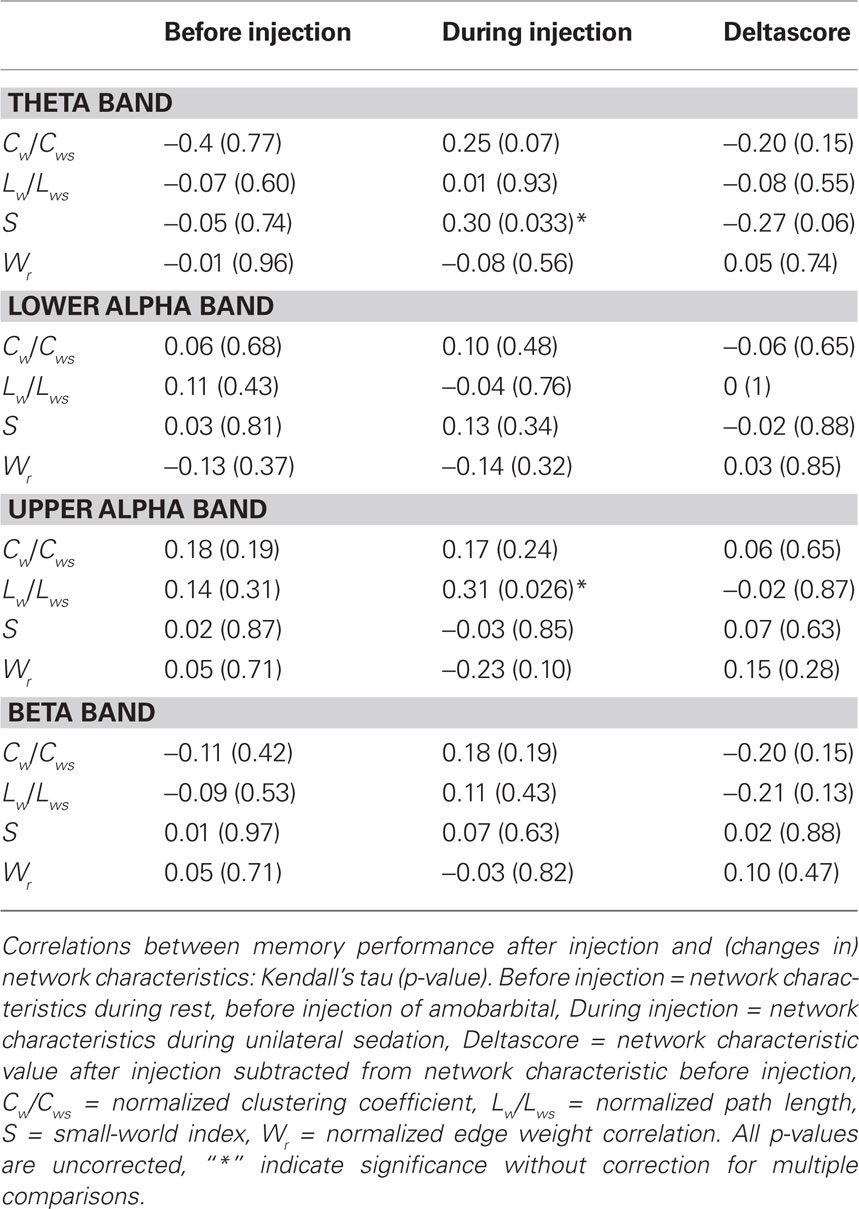
Table 3. Correlations between memory performance after injection and (changes in) network characteristics.

Figure 3. Scatterplots of correlations between network variables and memory performance during the IAP. (A) Correlation between theta band small-worldness (S) and memory score. (B) Correlation between upper alpha band path length and memory score.
Discussion
Our results indicate that the topology of whole-brain functional networks become more random after sedation of one hemisphere by means of the intra-arterial amobarbital procedure, marked by a decrease in the Normalized values of both local clustering and average path length. Changes in edge weight correlation in the theta and beta bands indicate that the network is closer to random and may be less optimized for information transport after injection. These changes are not related to lesion type, lesion lateralization, or age. Network properties are related to function to some extent: both higher theta band small-world index and longer path length in the upper alpha band are associated with better memory performance of the presumably non-affected hemisphere.
Our study shows acute network effects in a human in vivo model for acute (reversible) brain lesioning, which seem related to memory functioning. These findings may lead to hypotheses about possible mechanisms of network changes in the brain after acute lesions occur. Research into the impact of such lesions on functional connectivity is rather sparse, and network features have rarely been investigated in this respect. Some work has been done on the influence of stroke on human functional connectivity: elaborate changes in connectivity throughout the brain have been shown in patients more than 6 months after their first stroke (Mintzopoulos et al., 2009). Decreased connectivity was even found between the topologically remote primary motor cortex and the cerebellum, while most short-distance connections gained coupling strength. Brain network effects of lesions in human subjects have only been researched in brain tumor patients. A mixed group of glioma patients showed both lower clustering coefficients and shorter average path length than healthy controls in the theta, beta, and gamma bands, pointing toward a more random network topology (Bartolomei et al., 2006). Contradictory findings have been reported in a more homogeneous group of low-grade glioma patients, which were compared to a control group matched on age, sex, and educational level (Bosma et al., 2009). These patients showed higher clustering than controls in the theta band, while the opposite was true in the beta band. Average path length did not differ between patients and controls in this study. A computational study, using a macaque-based model of cortical functional connectivity, reports widespread changes in connectivity, especially when the most connected parts of the network (“hubs”) were lesioned (Honey and Sporns, 2008). In the only human study simulating functional effects of lesions, a computational model based on human MRI data was used (Alstott et al., 2009). Functional connectivity mainly decreased in the lesioned hemisphere, but significant changes herein were also reported in the contralateral hemisphere and the brain as a whole. Unfortunately, Alstott and colleagues have not investigated changes in overall network topology after structural lesions.
Our current results partly corroborate previously mentioned studies, since sparse evidence suggests that brain networks become more random after the occurrence of lesions. But, how may these changes be explained? On the cellular level, several studies have indicated that structural plasticity occurs immediately after lesions (Duffau, 2006; Butz et al., 2009b), but these effects are not in the same time-scale as the IAP. In induced stroke in monkeys, increased levels of sprouting-promoting environmental factors have been reported, inducing new connections in the area of the lesion (Carmichael et al., 2005). Interestingly, this sprouting-boost may also occur at sites remote from the actual lesion, and might impact structural connectivity of the whole brain (Dancause et al., 2005; Butz et al., 2009b). A study modeling structural effects of stroke has shown that plastic responses occur in the actual area that is infarcted, in the penumbra (i.e., the region surrounding the infarction), and at remote locations as well (Nudo, 2007). Possibly, dynamic changes in connectivity and network topology are similar to structural plasticity: immediate random functional connectivity may be a “stress-response” of the brain to local damage. Later, some sort of pruning of these (temporary) functional connections may occur, which may optimize network structure once again. An acute random connective boost would be congruent with our finding of network randomization directly after injection of the sedative.
In order to put our results into perspective, it would be of great interest to explore the longitudinal effects of lesions on brain networks. Several studies suggest that changes in connectivity and network topology may proceed during several phases (Holme et al., 2002; Butz et al., 2009a; Rubinov et al., 2009). These studies indicate that plasticity is not stationary, but evolves within itself. Moreover, functional rehabilitation is strongly shaped by activity (Butz et al., 2009b), indicating that a great variability of changes may occur at an individual level. Furthermore, differences in plasticity may occur between lesion types. It is highly probable that network changes induced by slow-growing tumors are fundamentally different from the effects of an acute lesion such as stroke or the IAP. However, no attempt has been made up till now to compare different types of lesions, although these questions are addressed in ongoing studies of our group.
In our study, preserved small-worldness and longer path length after injection correlated with better cognitive performance during the IAP. Network changes also seem to have a functional correlate as well as clinical relevance in other studies (Bassett et al., 2009). The removal of hubs in a scale-free Barabási–Albert model has been shown to relate to memory recall in the computational Hopfield memory model (Rodrigues et al., 2008). Research in non-human primates shows the importance of integration of several brain areas for normal functioning as well as functional rehabilitation after brain damage occurs (Nudo et al., 1996; Nudo, 2007). Post-lesional recovery in monkeys is characterized by marked changes in both intra- and inter-areal changes in connectivity and network structure (Dancause et al., 2005). Widespread connectivity changes in stroke seem related to functional status: neglect and its recovery has been shown to be related to functional connectivity in human stroke patients (Nudo, 2007). Furthermore, task-related connectivity analysis in stroke patients has shown that recovery of motor tasks is related to newly formed connectivity patterns (Grefkes et al., 2008; James et al., 2009). However, it is not clear what may be an optimal network topology for cognition. Better performance has previously been related to shorter path length in an fMRI study in very low frequency ranges (van den Heuvel et al., 2009). In an MEG study in brain tumor patients, we found an association between higher path length and poorer cognitive score in the lower alpha band (Bosma et al., 2009). The reported association between higher upper alpha path length and better memory performance in the current study are in line with the latter results.
A subtle but highly interesting finding of this study was the changing beta band clustering coefficient in women but not in men. Pre-existent differences in connectivity and network topology between men and women have not been reported as yet, but adaptation during mental challenge and reaction to disease may vary across genders according to previous reports. Local theta band complexity (which is related to decreased coupling or connectivity) measured by EEG is higher in men during a working memory task (Stam, 2000), while interhemispheric coherence (a measure of connectivity) is higher in women during photic stimulation (Wada et al., 1996) and cognitive testing (Beaumont and Rugg, 1979). An MEG study investigating changes in functional connectivity during an attentional task showed gender differences in the lower alpha band (Gootjes et al., 2006). Further research into possible pre-existent differences between men and women regarding connectivity and network architecture should be performed in future studies. Moreover, longitudinal studies should focus on differences in network adaptation after lesions between men and women.
A limitation of this report includes the suboptimal setting of EEG recordings, since patients had their eyes open, and minimal (eye) movement artifacts could not be avoided. However, these factors are likely to influence only very low and very high frequency bands, and those were excluded from the current analyses (Lawson et al., 2003; Pope et al., 2009). Also, volume conduction is always an issue in EEG studies. Volume conduction refers to the tendency of neighboring EEG electrodes to pick up activity of identical sources, resulting in strong correlations that do not reflect true functional connectivity. Although this problem may have impacted absolute values of our network analysis, the fact that this was a repeated measure design greatly diminishes the confounding influence of volume conduction on our results. A further shortcoming of this study is the fact that we did not investigate changes in network topology within the injected and non-injected hemispheres. Main reason for this was the number of electrodes of the EEG; the brain network consisted of only 17 nodes. This small number of nodes unfortunately prevented further study into network changes in the separate hemispheres. Furthermore, the current study investigates network topology of the brain. These analysis are based on raw time series in first place, after which functional connectivity was analyzed. It is important to note that all findings of the high-level network analysis are based on the previous two levels.
In conclusion, our results are new in the sense that they provide evidence for the global effects of sedation of one hemisphere of the brain, after which functional brain networks become more random and less optimally wired. This is especially interesting when comparing our results to previous studies in brain tumor patients, in whom similar findings have been reported. We also report a link between network properties and memory status, as have several previous studies. These results provide important evidence that brain network topology and cognitive functioning are interrelated. Further research should focus on brain network changes in lesions of varying origin (such as stroke), longitudinal network-related effects of lesions, and gender differences in these network parameters.
Conflict of Interest Statement
The authors declare that the research was conducted in the absence of any commercial or financial relationships that could be construed as a potential conflict of interest.
References
Achard, S., Salvador, R., Whitcher, B., Suckling, J., and Bullmore, E. (2006). A resilient, low-frequency, small-world human brain functional network with highly connected association cortical hubs. J. Neurosci. 26, 63–72.
Aertsen, A. M., Gerstein, G. L., Habib, M. K., and Palm, G. (1989). Dynamics of neuronal firing correlation: modulation of “effective connectivity”. J. Neurophysiol. 61, 900–917.
Alstott, J., Breakspear, M., Hagmann, P., Cammoun, L., and Sporns, O. (2009). Modeling the impact of lesions in the human brain. PLoS Comput. Biol. 5, e1000408. doi: 10.1371/journal.pcbi.1000408.
Bartolomei, F., Bosma, I., Klein, M., Baayen, J. C., Reijneveld, J. C., Postma, T. J., Heimans, J. J., van Dijk, B. W., de Munck, J. C., de Jongh, A., Cover, K. S., and Stam, C. J. (2006). Disturbed functional connectivity in brain tumour patients: evaluation by graph analysis of synchronization matrices. Clin. Neurophysiol. 117, 2039–2049.
Bassett, D. S., Bullmore, E. T., Meyer-Lindenberg, A., Apud, J. A., Weinberger, D. R., and Coppola, R. (2009). Cognitive fitness of cost-efficient brain functional networks. Proc. Natl. Acad. Sci. U.S.A. 106, 11747–11752.
Beaumont, J. G., and Rugg, M. D. (1979). The specificity of intrahemispheric EEG alpha coherence asymmetry related to psychological task. Biol. Psychol. 9, 237–248.
Benjamini, Y., and Hochberg, Y. (1995). Controlling the false discovery rate: a practical and powerful approach to multiple testing. J. R. Stat. Soc. Ser. B 57, 289–300.
Bosma, I., Reijneveld, J. C., Klein, M., Douw, L., van Dijk, B. W., Heimans, J. J., and Stam, C. J. (2009). Disturbed functional brain networks and neurocognitive function in low-grade glioma patients: a graph theoretical analysis of resting-state MEG. Nonlinear Biomed. Phys. 3, 9.
Bressler, S. (2002). Understanding cognition through large-scale cortical networks. Curr. Dir. Psychol. Sci. 11, 58–61.
Bullmore, E., and Sporns, O. (2009). Complex brain networks: graph theoretical analysis of structural and functional systems. Nat. Rev. Neurosci. 10, 186–198.
Butz, M., van Ooyen, A., and Worgotter, F. (2009a). A model for cortical rewiring following deafferentation and focal stroke. Front Comput Neurosci 3:10. doi: 10.3389/neuro.10.010.2009.
Butz, M., Worgotter, F., and van Ooyen, A. (2009b). Activity-dependent structural plasticity. Brain Res. Rev. 60, 287–305.
Carmichael, S. T., Archibeque, I., Luke, L., Nolan, T., Momiy, J., and Li, S. (2005). Growth-associated gene expression after stroke: evidence for a growth-promoting region in peri-infarct cortex. Exp. Neurol. 193, 291–311.
Dancause, N., Barbay, S., Frost, S. B., Plautz, E. J., Chen, D., Zoubina, E. V., Stowe, A. M., and Nudo, R. J. (2005). Extensive cortical rewiring after brain injury. J. Neurosci. 25, 10167–10179.
Douw, L., Baayen, J. C., Klein, M., Velis, D., Alpherts, W. C., Bot, J., Heimans, J. J., Reijneveld, J. C., and Stam, C. J. (2009). Functional connectivity in the brain before and during intra-arterial amobarbital injection (Wada test). Neuroimage 46, 584–588.
Duffau, H. (2006). Brain plasticity: from pathophysiological mechanisms to therapeutic applications. J. Clin. Neurosci. 13, 885–897.
Gootjes, L., Bouma, A., Van Strien, J. W., Scheltens, P., and Stam, C. J. (2006). Attention modulates hemispheric differences in functional connectivity: evidence from MEG recordings. Neuroimage 30, 245–253.
Grefkes, C., Nowak, D. A., Eickhoff, S. B., Dafotakis, M., Kust, J., Karbe, H., and Fink, G. R. (2008). Cortical connectivity after subcortical stroke assessed with functional magnetic resonance imaging. Ann. Neurol. 63, 236–246.
He, Y., Chen, Z. J., and Evans, A. C. (2007). Small-world anatomical networks in the human brain revealed by cortical thickness from MRI. Cereb. Cortex 17, 2407–2419.
Hilgetag, C. C., Burns, G. A., O’Neill, M. A., Scannell, J. W., and Young, M. P. (2000). Anatomical connectivity defines the organization of clusters of cortical areas in the macaque monkey and the cat. Philos. Trans. R. Soc. Lond., B, Biol. Sci. 355, 91–110.
Holme, P., Kim, B. J., Yoon, C. N., and Han, S. K. (2002). Attack vulnerability of complex networks. Phys. Rev. E. Stat. Nonlin. Soft Matter Phys. 65, 056109.
Honey, C. J., and Sporns, O. (2008). Dynamical consequences of lesions in cortical networks. Hum. Brain Mapp. 29, 802–809.
Hong, S. B., Kim, K. W., Seo, D. W., Kim, S. E., Na, D. G., and Byun, H. S. (2000). Contralateral EEG slowing and amobarbital distribution in Wada test: an intracarotid SPECT study. Epilepsia 41, 207–212.
Humphries, M. D., and Gurney, K. (2008). Network ‘small-worldness’: a quantitative method for determining canonical network equivalence. PLoS ONE 3, e0002051. doi: 10.1371/journal.pone.0002051.
James, G. A., Lu, Z. L., VanMeter, J. W., Sathian, K., Hu, X. P., and Butler, A. J. (2009). Changes in resting-state effective connectivity in the motor network following rehabilitation of upper extremity poststroke paresis. Top. Stroke. Rehabil. 16, 270–281.
Lawson, J. S., Galin, H., Adams, S. J., Brunet, D. G., Criollo, M., and MacCrimmon, D. J. (2003). Artefacting reliability in QEEG topographic maps. Clin. Neurophysiol. 114, 883–888.
Micheloyannis, S., Pachou, E., Stam, C. J., Vourkas, M., Erimaki, S., and Tsirka, V. (2006a). Using graph theoretical analysis of multi channel EEG to evaluate the neural efficiency hypothesis. Neurosci. Lett. 402, 273–277.
Micheloyannis, S., Pachou, E., Stam, C. J., Breakspear, M., Bitsios, P., Vourkas, M., Erimaki, S., and Zervakis, M. (2006b). Small-world networks and disturbed functional connectivity in schizophrenia. Schizophr. Res. 87, 60–66.
Mintzopoulos, D., Astrakas, L. G., Khanicheh, A., Konstas, A. A., Singhal, A., Moskowitz, M. A., Rosen, B. R., and Tzika, A. A. (2009). Connectivity alterations assessed by combining fMRI and MR-compatible hand robots in chronic stroke. Neuroimage 47(Suppl. 2), T90–T97.
Montez, T., Linkenkaer-Hansen, K., van Dijk, B. W., and Stam, C. J. (2006). Synchronization likelihood with explicit time-frequency priors. Neuroimage 33, 1117–1125.
Nolte, G., Bai, O., Wheaton, L., Mari, Z., Vorbach, S., and Hallett, M. (2004). Identifying true brain interaction from EEG data using the imaginary part of coherency. Clin. Neurophysiol. 115, 2292–2307.
Nudo, R. J., Milliken, G. W., Jenkins, W. M., and Merzenich, M. M. (1996). Use-dependent alterations of movement representations in primary motor cortex of adult squirrel monkeys. J. Neurosci. 16, 785–807.
Pope, K. J., Fitzgibbon, S. P., Lewis, T. W., Whitham, E. M., and Willoughby, J. O. (2009). Relation of gamma oscillations in scalp recordings to muscular activity. Brain Topogr. 22, 13–17.
Ramasco, J. J., and Goncalves, B. (2007). Transport on weighted networks: when the correlations are independent of the degree. Phys. Rev. E. Stat. Nonlin. Soft Matter Phys. 76, 066106.
Reijneveld, J. C., Ponten, S. C., Berendse, H. W., and Stam, C. J. (2007). The application of graph theoretical analysis to complex networks in the brain. Clin. Neurophysiol. 118, 2317–2331.
Rodrigues, E. P., Barbosa, M. S., and Costa, L. Da F. (2008). On the importance of hubs in Hopfield complex neuronal networks under attack. Arxiv: cond-mat/0507677v1.
Rubinov, M., McIntosh, A. R., Valenzuela, M. J., and Breakspear, M. (2009). Simulation of neuronal death and network recovery in a computational model of distributed cortical activity. Am. J. Geriatr. Psychiatry 17, 210–217.
Rubinov, M., and Sporns, O. (2010). Complex network measures of brain connectivity: Uses and interpretations. Neuroimage 52, 1059–1069.
Salvador, R., Suckling, J., Schwarzbauer, C., and Bullmore, E. (2005). Undirected graphs of frequency-dependent functional connectivity in whole brain networks. Philos. Trans. R. Soc. Lond., B, Biol. Sci. 360, 937–946.
Singer, W. (1999). Neuronal synchrony: a versatile code for the definition of relations? Neuron 24, 49–65, 111–125.
Sporns, O., and Zwi, J. D. (2004). The small world of the cerebral cortex. Neuroinformatics 2, 145–162.
Stam, C. J. (2000). Brain dynamics in theta and alpha frequency bands and working memory performance in humans. Neurosci. Lett. 286, 115–118.
Stam, C. J. (2010). Characterization of anatomical and functional connectivity in the brain: a complex networks perspective. Int. J. Psychophysiol. 77, 186–194.
Stam, C. J., de Haan, W., Daffertshofer, A., Jones, B. F., Manshanden, I., van Cappellen van Walsum, A. M., Montez, T., Verbunt, J. P., de Munck, J. C., van Dijk, B. W., Berendse, H. W., and Scheltens, P. (2009). Graph theoretical analysis of magnetoencephalographic functional connectivity in Alzheimer’s disease. Brain 132, 213–224.
Stam, C. J., Jones, B. F., Manshanden, I., van Cappellen van Walsum, A. M., Montez, T., Verbunt, J. P., de Munck, J. C., van Dijk, B. W., Berendse, H. W., and Scheltens, P. (2006). Magnetoencephalographic evaluation of resting-state functional connectivity in Alzheimer’s disease. Neuroimage 32, 1335–1344.
Stam, C. J., and van Dijk, B. W. (2002). Synchronization likelihood: an unbiased measure of generalized synchronization in multivariate data sets. Physica D 163, 236–241.
Supekar, K., Menon, V., Rubin, D., Musen, M., and Greicius, M. D. (2008). Network analysis of intrinsic functional brain connectivity in Alzheimer’s disease. PLoS Comput. Biol. 4, e1000100. doi: 10.1371/journal.pcbi.1000100.
Tononi, G., and Edelman, G. M. (1998). Consciousness and the integration of information in the brain. Adv. Neurol. 77, 245–279; discussion 279–280.
van den Heuvel, M. P., Stam, C. J., Kahn, R. S., and Hulshoff Pol, H. E. (2009). Efficiency of functional brain networks and intellectual performance. J. Neurosci. 29, 7619–7624.
Varela, F., Lachaux, J. P., Rodriguez, E., and Martinerie, J. (2001). The brainweb: phase synchronization and large-scale integration. Nat. Rev. Neurosci. 2, 229–239.
Wada, J., and Rasmussen, T. B. (1960). Intracarotid injection of sodium amytal for the lateralization of cerebral speech dominance. J. Neurosurg. 17, 266–282.
Wada, Y., Nanbu, Y., Kadoshima, R., Jiang, Z. Y., Koshino, Y., and Hashimoto, T. (1996). Interhemispheric EEG coherence during photic stimulation: sex differences in normal young adults. Int. J. Psychophysiol. 22, 45–51.
Watts, D. J., and Strogatz, S. H. (1998). Collective dynamics of ‘small-world’ networks. Nature 393, 440–442.
Whitham, E. M., Pope, K. J., Fitzgibbon, S. P., Lewis, T., Clark, C. R., Loveless, S., Broberg, M., Wallace, A., DeLosAngeles, D., Lillie, P., Hardy, A., Fronsko, R., Pulbrook, A., and Willoughby, J. O. (2007). Scalp electrical recording during paralysis: quantitative evidence that EEG frequencies above 20 Hz are contaminated by EMG. Clin. Neurophysiol. 118, 1877–1888.
Keywords: small-world networks, Wada test, functional connectivity, brain network, graph theory
Citation: Douw L, van Dellen E, Baayen JC, Klein M, Velis DN, Alpherts WCJ, Heimans JJ, Reijneveld JC and Stam CJ (2010) The lesioned brain: still a small-world? Front. Hum. Neurosci. 4:174. doi: 10.3389/fnhum.2010.00174
Received: 16 June 2010;
Paper pending published: 09 July 2010;
Accepted: 19 August 2010;
Published online: 11 November 2010.
Edited by:
Francisco Barcelo, University of Illes Balears, SpainReviewed by:
Danielle S. Bassett, University of California at Santa Barbara, USANazareth Castellanos, Universidad Politécnica de Madrid, Spain
Copyright: © 2010 Douw, van Dellen, Baayen, Klein, Velis, Alpherts, Heimans, Reijneveld and Stam. This is an open-access article subject to an exclusive license agreement between the authors and the Frontiers Research Foundation, which permits unrestricted use, distribution, and reproduction in any medium, provided the original authors and source are credited.
*Correspondence: Linda Douw, Department of Neurology (2F-019), VU University Medical Center, PO Box 7057, 1007 MB Amsterdam, Netherlands. e-mail: l.douw@vumc.nl