 Ruth Ann Marrie1,2*
 Ronak Patel3
 Chase R. Figley4,5,6
 Jennifer Kornelsen4,5,6
 James M. Bolton7Lesley A. Graff3
 Erin L. Mazerolle8Carl Helmick9
 Md Nasir Uddin4,10Teresa D. Figley4
 James J. Marriott1
 Charles N. Bernstein1
 John D. Fisk11 for the Comorbidity Cognition in Multiple Sclerosis (CCOMS) Study Group
- 1Department of Internal Medicine, Max Rady College of Medicine, Rady Faculty of Health Sciences, University of Manitoba, Winnipeg, MB, Canada
- 2Department of Community Health Sciences, Max Rady College of Medicine, Rady Faculty of Health Sciences, University of Manitoba, Winnipeg, MB, Canada
- 3Department of Clinical Health Psychology, Max Rady College of Medicine, Rady Faculty of Health Sciences, University of Manitoba, Winnipeg, MB, Canada
- 4Department of Radiology, Max Rady College of Medicine, Rady Faculty of Health Sciences, University of Manitoba, Winnipeg, MB, Canada
- 5Division of Diagnostic Imaging, Winnipeg Health Sciences Centre, Winnipeg, MB, Canada
- 6Neuroscience Research Program, Kleysen Institute for Advanced Medicine, Winnipeg Health Sciences Centre, Winnipeg, MB, Canada
- 7Department of Psychiatry, Max Rady College of Medicine, Rady Faculty of Health Sciences, University of Manitoba, Winnipeg, MB, Canada
- 8Department of Psychology, St. Francis Xavier University, Antigonish, NS, Canada
- 9Department of Psychiatry and Division of Geriatric Medicine, Dalhousie University, Halifax, NS, Canada
- 10Department of Neurology, University of Rochester, Rochester, New York, NY, United States
- 11Nova Scotia Health and the Departments of Psychiatry, Psychology & Neuroscience, and Medicine, Dalhousie University, Halifax, NS, Canada
Objective: Vascular comorbidities are associated with reduced cognitive performance and with changes in brain structure in people with multiple sclerosis (MS). Understanding causal pathways is necessary to support the design of interventions to mitigate the impacts of comorbidities, and to monitor their effectiveness. We assessed the inter-relationships among vascular comorbidity, cognition and brain structure in people with MS.
Methods: Adults with neurologist-confirmed MS reported comorbidities, and underwent assessment of their blood pressure, HbA1c, and cognitive functioning (i.e., Symbol Digit Modalities Test, California Verbal Learning Test, Brief Visuospatial Memory Test-Revised, and verbal fluency). Test scores were converted to age-, sex-, and education-adjusted z-scores. Whole brain magnetic resonance imaging (MRI) was completed, from which measures of thalamic and hippocampal volumes, and mean diffusivity of gray matter and normal-appearing white matter were converted to age and sex-adjusted z-scores. Canonical correlation analysis was used to identify linear combinations of cognitive measures (cognitive variate) and MRI measures (MRI variate) that accounted for the most correlation between the cognitive and MRI measures. Regression analyses were used to test whether MRI measures mediated the relationships between the number of vascular comorbidities and cognition measures.
Results: Of 105 participants, most were women (84.8%) with a mean (SD) age of 51.8 (12.8) years and age of symptom onset of 29.4 (10.5) years. Vascular comorbidity was common, with 35.2% of participants reporting one, 15.2% reporting two, and 8.6% reporting three or more. Canonical correlation analysis of the cognitive and MRI variables identified one pair of variates (Pillai's trace = 0.45, p = 0.0035). The biggest contributors to the cognitive variate were the SDMT and CVLT-II, and to the MRI variate were gray matter MD and thalamic volume. The correlation between cognitive and MRI variates was 0.50; these variates were used in regression analyses. On regression analysis, vascular comorbidity was associated with the MRI variate, and with the cognitive variate. After adjusting for the MRI variate, vascular comorbidity was not associated with the cognitive variate.
Conclusion: Vascular comorbidity is associated with lower cognitive function in people with MS and this association is partially mediated via changes in brain macrostructure and microstructure.
Introduction
Multiple sclerosis (MS) is a central nervous system disease characterized by multiple signs and symptoms, including cognitive impairment. Over 40% of individuals with MS struggle with cognitive impairment (1, 2) and its adverse effects on daily function (3). MS is characterized by demyelination and axonal injury, therefore it is associated with macrostructural changes in the brain such as atrophy, as well as microstructural changes in normal appearing white matter (NAWM). Lower whole brain and regional gray matter volumes, particularly thalamic volumes (4) are associated with cognitive dysfunction (5–7). Microstructural abnormalities, as measured using diffusion tensor imaging (DTI) appear to provide even stronger prediction of cognitive impairment than macrostructural abnormalities (8–10).
Comorbid conditions are highly prevalent among individuals with MS (11). The vascular comorbidities of hypertension and hyperlipidemia are among the most common comorbidities with MS, and increase in prevalence with age. They are associated with outcomes such as relapses, disability progression and lower quality of life (12, 13). More recent studies suggest that hypertension and diabetes are also associated with reduced cognitive function in domains such as processing speed, verbal learning and visual memory for persons with MS (14–16). However, findings have varied across studies, possibly reflecting differences in study populations, comorbidity measurement and cognitive tests employed. Although findings are inconsistent as to the magnitude of the effect and the specific comorbidities involved (14, 17–19), vascular comorbidities have been associated with macrostructural brain changes such as lower brain volumes in people with MS. In the general population widespread changes in white matter microstructure are known to be associated with vascular risk factors; mean diffusivity (MD) appears to be more sensitive to these effects than FA or mean kurtosis (20, 21). The association of vascular comorbidity and brain microstructure has not been explored in people with MS.
Depression and anxiety disorders are other common comorbidities associated with lower cognitive performance in people with MS (22). Depression has also been associated with lower brain volumes, specifically affecting the temporal lobes and hippocampus (23–25), and has also been associated with altered microstructure in the form of higher MD in NAWM and gray matter in the left temporal lobe in persons with MS (26). Therefore these comorbidities need to be accounted for when the effects of vascular comorbidities on brain structure and cognition are assessed.
Better understanding of the relationships among comorbidities, brain structural changes, and outcomes such as cognitive functioning is needed for persons with MS. Understanding causal pathways is necessary to support the design of interventions to mitigate the impacts of comorbidities, and to monitor their effectiveness. For example, if the effects of vascular comorbidity on cognition were mediated by changes in brain structure, intervention studies aimed at treating vascular comorbidity to improve cognition could use MRI measures as intermediate outcomes to enable shorter, smaller studies. We aimed to extend our prior work examining relations between comorbidity and cognition (15) and hypothesized that the effects of vascular comorbidity on cognition would be mediated by changes in brain structure in people with MS.
Methods
Study Population
As described previously (15), our study sample was drawn from a subgroup of adults with MS participating in a longitudinal study regarding psychiatric comorbidity in immune-mediated inflammatory diseases (the “IMID” study). This subgroup included persons aged ≥18 years with definite MS (27), as confirmed by a neurologist and medical records review. Exclusion criteria included comorbid brain tumors, neurodegenerative disorders, or contraindications to MRI. We did not exclude any other comorbidities because comorbidities (predominantly vascular and psychiatric) were the focus of the sub-study.
We also enrolled healthy controls who have been described in detail elsewhere (28). Briefly, healthy controls were aged 18 years or older. Exclusion criteria for this group included any chronic medical condition including vascular comorbidities, cognitive impairment, a positive response to the Structured Clinical Interview for DSM-IV (SCID-IV) screening questions for depressive or anxiety disorders, head injury associated with loss of consciousness or amnesia, or chronic medication use (29). Hypertension, as measured during the study visit, was also an exclusion criterion. For this analysis, they predominantly served to allow us to develop regression-based norms for cognitive and MRI measures.
All participants in the sub-study underwent standardized assessments of physical, cognitive, and mental health functioning, which they completed the same day. They also had a brain MRI, which was completed within a maximum of 4 weeks of the study visit in which they completed their standardized assessments (30). All participants provided written informed consent. The University of Manitoba Health Research Ethics Board approved the study. Study data were collected and managed using REDCap electronic data capture tools (31) hosted at the University of Manitoba.
Sociodemographic Information
Participants reported gender, date of birth, race and ethnicity, highest level of education attained, annual household income, and marital status using self-administered questionnaires. Race and ethnicity were assessed using response options from Statistics Canada; race was categorized as white vs. non-white because the number of non-white participants was too small to further subdivide. We categorized level of education as high school or less, vs. more than high school (including college, university, technical/trade).
Clinical Characteristics
Age at MS symptom onset, clinical course (relapsing remitting, secondary progressive, primary progressive), relapses in the last 12 months, and current disease-modifying therapy (DMT) were determined based on patient report and medical records review. The Expanded Disability Status Scale (EDSS) was assessed by a certified neurologist (RAM/JJM) (32).
Comorbidity and Health Behaviors
Participants reported their lifetime history of comorbidities (including hypertension, diabetes, hyperlipidemia, and heart disease) using a validated questionnaire (33), including the year of diagnosis and whether the condition was currently treated. This information was complemented by medical records review and other assessments (15). During the study visit, we recorded blood pressure in the seated position using an automatic blood pressure machine. Participants were classified as currently having hypertension if they reported physician-diagnosed hypertension, or had an elevated blood pressure of at least 140/90 mm Hg, and/or used anti-hypertensive medications. Participants were classified as currently having diabetes if they self-reported physician-diagnosed diabetes, used medications for diabetes and/or had a hemoglobin A1c measured at the study visit >6.5% (34). We did not discriminate between type 1 and type 2 diabetes. Participants were classified as currently having heart disease if they self-reported physician-diagnosed heart disease. We classified current smoking status as yes/no. We calculated body mass index (BMI, kg/m2) based on measured height and weight.
Given prior findings in the literature indicating that psychiatric comorbidity affects cognition in MS including our prior work (22, 35), current major depression and anxiety disorders were assessed for inclusion as covariates using the Structured Clinical Interview for DSM-IV (SCID-IV) (36), which was administered by trained study staff, as described elsewhere (30). We classified each condition as present or absent.
Cognitive Function
As delineated elsewhere, we chose validated neuropsychological assessments included in the Brief International Cognitive Assessment for Multiple Sclerosis (BICAMS) (37), and which tested most cognitive domains addressed via the Minimal Assessment of Cognitive Function in MS (MACFIMS) (38). BICAMS uses the Symbol Digit Modalities Test (SDMT) (39), the California Verbal Learning Test (CVLT-II; Trial 1–5 total recall score) (40), and the Brief Visuospatial Memory Test-Revised (BVMT-R; summed recall score for all three learning trials) (41). The MACFIMS includes all of the tests from BICAMS, the Controlled Oral Word Association Test (fluency) as well as the Paced Auditory Serial Addition Test (processing speed and working memory), Delis-Kaplan Executive Function System Sorting Test (executive function), and Judgement of Line Orientation Test (spatial processing). Specifically, we used the SDMT (39) to assess information processing speed, the CVLT-II; Trial 1–5 total recall score (40) to assess verbal learning and memory, the BVMT-R (summed recall score for all three learning trials) (41) to assess visual learning and memory, and tests of verbal fluency (letter and animal categories) (42) to assess language and executive abilities. We converted raw test scores to age-, sex- and education-adjusted z-scores using local regression-based norms because we previously demonstrated that these performed better in our population than other published regression-based norms (28). Z-scores of ≤ -1.5 were classified as impaired. To characterize the sample we also included the Wechsler Test of Adult Reading (WTAR) (43) that provided an age-, sex-, education-, and ethnicity-adjusted Full Scale IQ estimate of premorbid intelligence. Test administration was completed by trained study staff, overseen by a registered clinical neuropsychologist.
Magnetic Resonance Imaging
Acquisition
As described previously (18), all participants underwent a 3 Tesla brain MRI (Siemens TIM Trio, software version VB17a, Siemens Healthcare, Erlangen, Germany; Siemens 32-channel receive-only head coil), within 4 weeks of their study visit. The images acquired included a high-resolution T1-weighted (T1w) whole brain 3D magnetization prepared rapid gradient echo (MPRAGE), dual-echo proton density-weighted (PDw), T2-weighted (T2w), fluid attenuated inversion recovery (FLAIR) images, and two 55-direction high angular resolution diffusion imaging (HARDI) scans that had phase encoding in opposite directions (see Supplementary Table e1 for scan parameters). Gadolinium was not administered. A radiologist reviewed the MRIs to screen for any clinically relevant findings unrelated to MS. All images were visually reviewed to assess for bulk motion or other artifacts.
T1-Weighted Images
We used FSL's FLIRT, and FNIRT (https://fsl.fmrib.ox.ac.uk/fsl/fslwiki/FLIRT) to linearly and non-linearly warp the T1w brain images to the MNI152 template (44, 45). We created lesion masks from FLAIR and T1w images using the Lesion Segmentation Tool (LST) for SPM (46), and FSL's automated Brain Intensity AbNormality Classification Algorithm (BIANCA; https://fsl.fmrib.ox.ac.uk/fsl/fslwiki/BIANCA) (47). We created final lesion masks for each participant as a binary cluster overlap of the BIANCA and LST maps, as we have found that LST is more specific but less sensitive and BIANCA is more sensitive but less specific. This allowed us to eliminate spurious small clusters identified by only one technique, reducing false positives. Lesions were filled using the lesion filling command in FSL by inputting each participant's: (1) cluster-overlapped T1w_final_lesion_map, (2) binary WM tissue map, and (3) bias-corrected T1w_brain (48). We estimated whole brain volume and gray matter volume from lesion-filled T1w images using FSL's SIENA (https://fsl.fmrib.ox.ac.uk/fsl/fslwiki/SIENA) (49, 50). Volume estimates for the thalamus (total of right and left) and hippocampus (total of right and left) were obtained using FSL FIRST (https://fsl.fmrib.ox.ac.uk/fsl/fslwiki/FIRST). All volumes were normalized relative to intracranial volume for each participant.
Diffusion-Weighted Images
Artifact Correction
Diffusion-weighted images were processed using SPM12 Artifact Correction in Diffusion MRI Toolbox (ACID; version beta 02; http://diffusiontools.com). This included simultaneous motion and eddy current correction (51), and EPI distortion correction based on the opposite polarity DWI images using the Hyperelastic Susceptibility artifact Correction (HySCo) algorithm (52, 53).
Tensor Model Fitting
We used the Fit Diffusion Tensor module to generate fractional anisotropy (FA), mean diffusivity (MD), radial diffusivity (RD) and axial diffusivity (AD) maps. The robust least-squares fitting algorithm was used to down-weight potential outliers in the diffusion signal (54).
Registration
We non-linearly warped each participant's high resolution, lesion-filled T1w image to the MNI52 Template (using the geodesic shooting method in the Computational Anatomy Toolbox for SPM12 (CAT12 version r1318; http://www.neuro.uni-jena.de/cat/)), then co-registered each of the diffusion maps to the participant's T1w image (by co-registering the b0 image and applying the same transformations). Then we spatially normalized the diffusion maps to the MNI152_T1_1mm template using subject-specific deformation fields generated previously using CAT12. We extracted mean values of these four DTI metrics for whole brain white matter (WM) as well as gray matter (GM) using each participant's CAT12 tissue segmentations, and calculated mean values for NAWM by removing voxels within each participant's lesion mask from their CAT12 WM segmentation.
Choice of Diffusion Metric
It is increasingly recognized that a large proportion of white matter fiber tracts have complex architecture including crossing fibers such that variations in DTI measures do not necessarily reflect variations in structural integrity of myelin or axons (55, 56). Of the four DTI measures, FA, AD, and RD are most affected by this and therefore we focused our analyses on MD (57).
Regression-Based Norms
Using a healthy control population which was enrolled concurrently and underwent the same study procedures, we developed regression-based norms for each MRI measure that incorporated age and gender, similar to the approach used to develop norms for cognitive tests in this population (28). This allowed us to convert each MRI measure to a z-score, enhancing their comparability despite the differences in their value ranges, and normalizing them for subsequent regression analyses. Because this was a healthy control population this means that negative z-scores for a brain volume, for example, indicated that the brain volume is lower than in a healthy person.
Analyses
Descriptive
We described the study population using means (standard deviation [SD]), medians (interquartile range [IQR]), and frequencies (percent). We observed strong Spearman correlations between several of the MRI measures (Supplementary Figure e1 and Supplementary Table e2).
Summarizing MRI Measures
We selected 4 measures for our analyses which captured brain macrostructure and microstructure [thalamic and hippocampal volumes, MD of NAWM and of gray matter (GM)] based on as their established associations with cognition in the MS literature. These measures also met the statistical criteria of no multicollinearity amongst them (Supplementary Table e3), and met the assumption of multivariate normality required for our subsequent analyses (Supplementary Table e4).
Summarizing Vascular Comorbidity
Given the high degree of overlap between vascular comorbidities, and our limited sample size, we summarized the four vascular comorbidities (diabetes, hypertension, hyperlipidemia, heart disease) as a count (0, 1, 2, 3+). We used an unweighted count for consistency with a prior study showing a dose-response association between an unweighted vascular comorbidity count and brain volumes, and with performance-based measures including a cognitive test of processing speed (17). Moreover, comorbidity counts are readily understood measures that have been associated with multiple outcomes in MS (58, 59). The prior study did not include smoking or BMI in the vascular comorbidity count. Although we included smoking in the vascular count in a complementary analysis as described further below, we did not include higher BMI (i.e., being overweight or obese) in the count. Seventy-five percent of the cohort was overweight or obese. We had previously observed that higher BMI was associated with better cognitive performance (15), an effect opposite to those anticipated for other vascular comorbidities of interest on cognition, and an effect opposite to that expected on MRI outcomes. Studies in the general population suggest that higher BMI may be protective of cognition (60–62) and that this effect may be non-linear. The assumption of using an unweighted comorbidity count is that the effects of comorbidities are additive with the effects in the same direction.
Primary Analyses
Our goal was to understand the relationship between vascular comorbidity and cognition, and whether this was mediated via brain structure (Figure 1). First, a multivariate approach was used, due to the large number of variables assessing each of cognition and MRI, the size of our sample, and to minimize the number of comparisons made. Specifically, our primary analysis began with canonical correlation analysis to model the association between cognition and MRI; (63) vascular comorbidity was not evaluated in this step. Canonical correlation analysis has been used in other studies of cognition in MS (64). In this situation we view the cognitive variables as assessing a common underlying latent construct, and the MRI variables as assessing the underlying latent construct of brain structural integrity. In canonical correlation analysis, weighted linear combinations of variables (“variates”) are created within each dataset that account for the most correlation between the two datasets. The first pair of variates has the highest possible correlation, and successive pairs of variates are orthogonal and independent of other variates. Variable loadings measure the correlation between the original variable and the variate, indicating the relative contribution of the variable to the variate. This analytic approach is more powerful and reduces the number of comparisons. We assessed the assumptions of multicollinearity using correlations, multivariate normality using the Doornik-Hansen test, and linearity (Supplementary Figures e1, e2). We report the redundancy index (amount of variance explained).
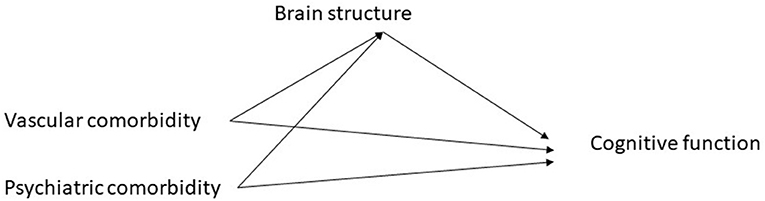
Figure 1. Hypothesized pathways between comorbidity and cognitive function.
Second, we constructed a series of linear regression models. In the first model, we tested the association between the count of vascular comorbidities and the cognitive variate (dependent variable). In the second model we changed the dependent variable to the MRI variate. In the third model, we tested the association between the count of vascular comorbidities and the cognitive variate (dependent variable), adjusting for the MRI variate. The count of vascular comorbidities was included as indicator variables. These regression analyses did not include age or gender since these were captured in the z-scores for the cognitive and MRI measures. In all models, covariates included current depressive disorder, current anxiety disorder and use of disease-modifying therapy (yes/no). We included use of disease-modifying therapy as a covariate because of literature suggesting that vascular comorbidity is associated with initiation (or not) of disease-modifying therapy (65), and the association of disease-modifying therapy with cognition (66). Regression analyses were bootstrapped 1,000 times, and we report bias-corrected 95% confidence intervals (95%CI). We assessed the proportion of the direct effect of comorbidity on cognition mediated by MRI as described for multi-level categorical variables (67).
Secondary Analyses
Third, we performed exploratory secondary analyses using multivariate regression models. These analyses aimed to provide insight into the relationships between vascular comorbidity, cognitive and MRI measures at a more granular level. However, these analyses need to be interpreted cautiously given the number of comparisons (68). We used the same three model approach as described using the canonical variates but we included the z-scores for each of the cognitive measures as dependent variables rather than the single cognitive variate, and included all of the z-scores for the MRI measures as independent variables rather than the single MRI variate. If a statistically significant global association was identified between an independent variable of interest and cognition, we explored this further using linear models which included only one cognitive z-score as the dependent variable. Non-significant global associations were not examined further.
Complementary Analyses
We performed complementary analyses to test the sensitivity of our findings to changes in sub-population or inclusion of other variables. First, we limited the primary analyses to women. Second, we included a history of ever smoking in the count of vascular comorbidities, and repeated the regression analyses that tested the association between the count of vascular comorbidities and the cognitive variate (dependent variable), adjusting for current depressive disorder, current anxiety disorder and use of disease-modifying therapy (yes/no) and for the MRI variate. Third, we repeated the primary analyses after limiting the study population to participants who were overweight or obese since the overlap between overweight/obesity and vascular comorbidity was too substantial to include it as a covariate.
Statistical analyses used SAS V9.4 (SAS Institute Inc., Cary, NC) and STATA 17.0 (Statacorp LLC, College Station, TX).
Results
We included 105 participants. Most participants were women, and most had a moderate level of disability (Table 1). Vascular comorbidity was common, affecting 62 (59.0%). Just over half of participants had hypertension (50.5%), whereas only 11.4% had diabetes. Overlap between comorbidities was common. All 12 participants with diabetes had hypertension, while 10 (90.9%) were overweight or obese and 9 (75%) had hyperlipidemia. Twelve of the 53 participants with hypertension had diabetes (22.6%), while 47 (90.4%) were overweight or obese. Of six participants with heart disease, 5 (83.3%) had hypertension, and one-third had diabetes. Nearly 10% of participants currently had an anxiety disorder, of whom 8 (80%) were currently using a psychotropic medication. Fifteen percent of participants currently had a depressive disorder, of whom 13 (81.2%) were currently using a psychotropic medication. Based on average (standard error) z-scores determined using regression-based norms, cognitive performance was lowest for the SDMT (−0.76 [0.12]), followed by verbal fluency (animals, −0.61 [0.11]), verbal fluency (letter, −0.25 [0.10]), BVMT-R (−0.064 [0.11]), and the CVLT-II (0.031 [0.12]). Overall, 28 (26.7%) participants were classified as cognitively impaired based on the SDMT. In contrast, 11 (10.5%) were impaired on the CVLT-II, 13 (12.4%) on the BVMT-R, 12 (11.4%) on verbal fluency (averaging fluency for animals and letters).
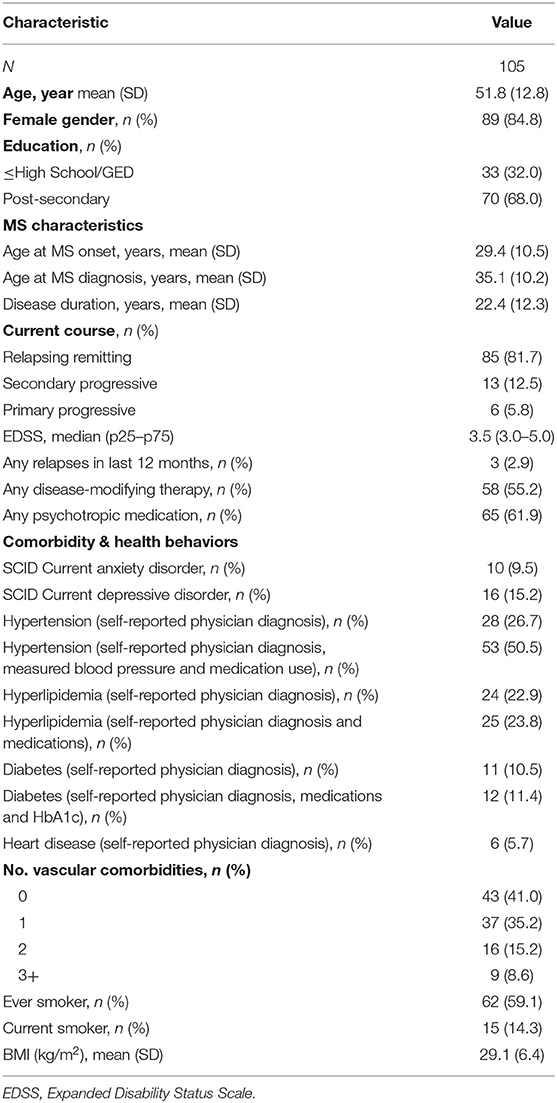
Table 1. Cohort demographic and clinical characteristics.
The number of vascular comorbidities correlated with MD of NAWM (r = −0.27; 95%CI: −0.44, −0.086) but not with MD of GM (0.18; −0.014, 0.36), nor with thalamic (−0.084; 95%CI: −0.27, 0.11) or hippocampal (r = 0.001; −0.19, 0.19) volumes. Age at MS symptom onset was not correlated with the number of vascular comorbidities after accounting for age at assessment (r = 0.12, p = 0.21). Similarly, disease duration was not correlated with the number of vascular comorbidities after accounting for age at assessment (r = −0.12, p =0.21).
Canonical Correlation Analysis
The canonical correlation analysis identified one statistically significant pair of variates (Pillai's trace = 0.45, p = 0.0035), which had a correlation of 0.50 (Supplementary Figure e3). Based on variable loadings, the biggest contributor to the cognitive variate was the SDMT (0.88), followed by verbal fluency (letter, 0.76), visual memory (0.52), verbal fluency (animals, 0.49); the CVLT-II verbal learning score was the smallest contributor (0.20) (Supplementary Figure e4). The biggest contributors to the MRI variate were gray matter MD (−0.79) and thalamic volume (0.63), followed by hippocampal volume (0.26) and NAWM MD (0.20) (Supplementary Figure e5). The canonical redundancy index for the cognitive variate (i.e., the total fraction of variance accounted for by the MRI variables) was 9.7%. The canonical redundancy index for the MRI variate was 7.2%. Age at MS symptom onset was not correlated with the cognitive variate (r = −0.13, p = 0.20).
After adjusting for disease-modifying therapy, vascular comorbidity was associated with the MRI variate (Table 2, global test χ2 = 16.88, p = 0.0007). We observed that the higher the number of vascular comorbidities, the lower the value of (i.e., the more abnormal) the MRI variate. Similarly, vascular comorbidity was associated with the cognitive variate (Table 2, global test χ2 = 9.78, p = 0.021) and we observed that the higher the number of vascular comorbidities the lower the value of the cognitive variate. After we added the MRI variate to the model, vascular comorbidity was no longer associated with the cognitive variate (global test χ2 = 2.0, p = 0.57) but the MRI variate was associated with the cognitive variate (χ2 = 22.98, p = <0.0001). Over one-third (37%) of the effect of vascular comorbidities on the cognitive variate was mediated by the MRI variate.
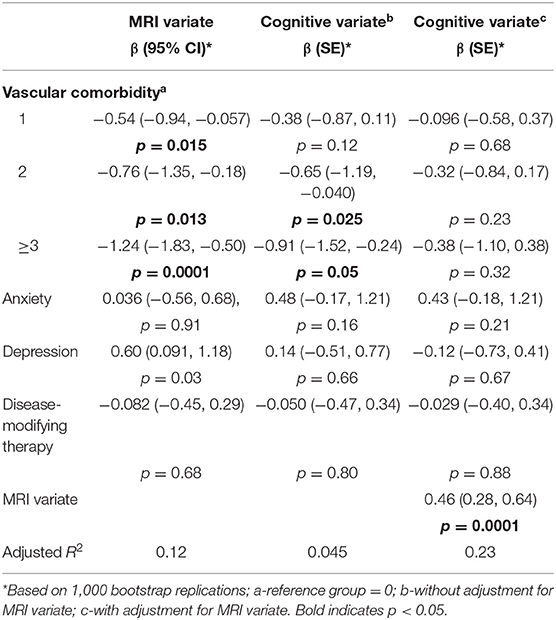
Table 2. Association of comorbidity with cognitive variate and magnetic resonance imaging (MRI) variate.
Multivariate Regression Analyses
In the multivariate regression analysis which included all cognitive variables as dependent variables, vascular comorbidity remained associated with cognition in the global test (χ2 = 26.9, p = 0.03). In the follow-up individual regression analyses, vascular comorbidity was associated with lower performance on the SDMT, CVLT-II, and verbal fluency (animal) (Table 3).
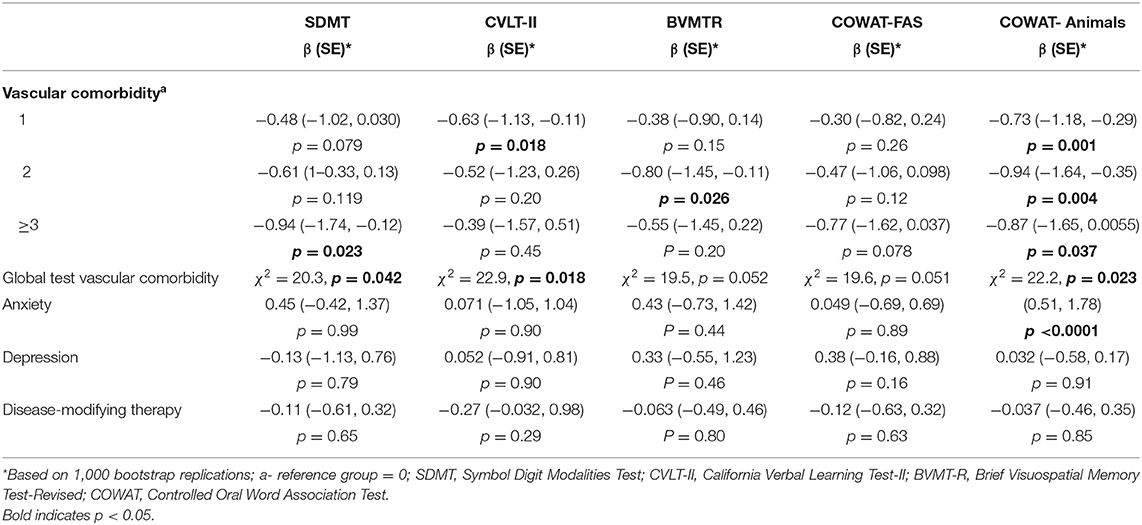
Table 3. Association of vascular comorbidity with individual cognitive tests.
In the multivariate regression analysis which included all MRI variables as dependent variables, the number of vascular comorbidities was associated with the MRI variables overall (χ2 = 39.7, p = 0.0001). In the follow-up individual regression analyses, the number of vascular comorbidities was associated was not associated with individual MRI measures (Table 4), indicating it was important to consider them in aggregate.
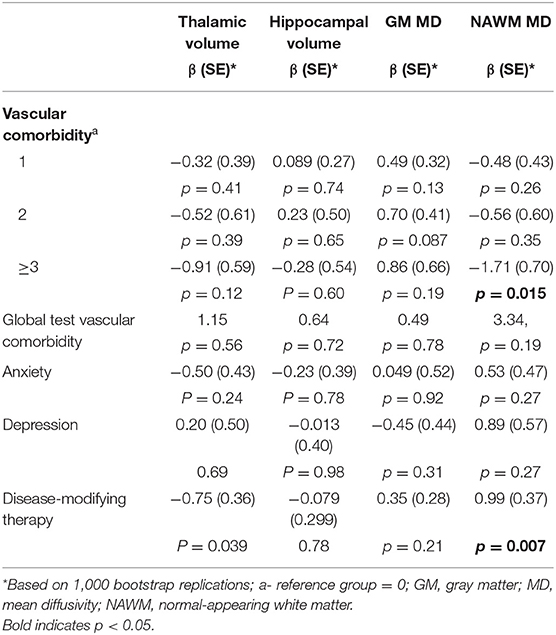
Table 4. Association of vascular comorbidity with individual magnetic resonance imaging measures.
Therefore, subsequent analyses focused on the association of vascular comorbidity with the SDMT, CVLT-II, and verbal (animal) fluency. After addition of the MRI variables to the model, vascular comorbidity was no longer associated with the cognitive variate in the global test (χ2 = 18.9, p = 0.22), nor with the individual cognitive variables SDMT (χ2 = 12.0, p = 0.36), CVLT-II (χ2 = 14.4, p = 0.21) or animal fluency (χ2 = 13.5, p = 0.26). Collectively, the MRI variables were associated with cognition in a global test (χ2 = 45.4, p = 0.001), and specifically with the SDMT (χ2 = 45.4, p = 0.001), the CVLT-II (χ2 = 28.5, p = 0.028) and animal fluency (χ2 = 28.3, p = 0.029).
Complementary Analyses
After we limited our primary analyses to women, our findings were similar. Vascular comorbidity was associated with the cognitive variate in the model that did not include the MRI variate (χ2 = 18.8, p = 0.0003) but not when the MRI variate was added to the model (χ2 = 1.15, p = 0.76). After we included ever smoking in the count of vascular comorbidities, and repeated the primary analyses our findings were similar (Supplementary Table e5). When we limited the analysis to participants who were overweight or obese, our findings were similar (Supplementary Table e6).
Discussion
In this cross-sectional study we assessed the inter-relationships between vascular comorbidity, brain structure as measured by MRI, and cognition among 105 individuals with MS enrolled from a population-based MS Clinic. We found that a higher number of vascular comorbidities was associated with lower cognitive function overall, and specifically with measures of processing speed, verbal learning and memory, and oral fluency. These associations were fully attenuated after we accounted for MRI measures of thalamic and hippocampal volume, and mean diffusivity of gray matter and NAWM, consistent with our hypothesis that the impacts of vascular comorbidity on cognition in people with MS are mediated by differences in brain structure (as depicted in Figure 1). This suggests that future intervention studies targeted at treating vascular comorbidity to improve cognition could use MRI measures as intermediate outcomes. It also highlights the complexity of relationships between comorbidity and outcomes in MS. Impacts of vascular comorbidity on brain health, including brain structure and cognition, may reflect increased peripheral inflammation, endothelial injury, and alterations in blood vessel function, cerebral blood flow and metabolism (69–72).
Some prior studies have reported an association between vascular comorbidities and brain volumes in persons with MS. The largest cross-sectional study to date, which included 6,409 from the MS-PATHS study, found that the presence of two or more vascular comorbidities was associated with lower whole brain and gray matter volumes (17). However, another MS-PATHS study including some of these participants, but based at a single center, found that while depression was associated with lower whole brain and gray matter volumes, hyperlipidemia was associated with higher whole brain volumes for unclear reasons (14). In the general population vascular comorbidities are also reportedly associated with differences in brain structure. A recent study including 9,722 participants from the UK Biobank found that the higher the total number of vascular risk factors the lower the brain volume and the greater the changes in brain microstructure (73). To our knowledge, prior studies in the MS population have not examined the association between vascular comorbidity and DTI measures. In the general population, vascular comorbidity is associated with differences in FA and MD in the NAWM. Higher systolic blood pressure and higher glucose in midlife are reportedly associated with worse white matter microstructure as measured using FA and MD (20, 74).
A handful of studies have examined the association between vascular comorbidity and cognition in people with MS. A study involving 11,506 individuals in the MS-PATHS study found that those with two or more vascular comorbidities, including diabetes, hypertension and hyperlipidemia, had lower correct scores on a test of processing speed, though no other cognitive domains were examined (17). A retrospective study involving 69 persons with MS found that a one-point increase in the Framingham risk score was associated with lower CVLT-II scores, and this appeared to be driven by male sex and higher lipid levels, though they did not observe any associations with the SDMT and BVMT-R (16). Even without overt cerebrovascular disease, hypertension, hypercholesterolemia, and diabetes are associated with cognitive impairment, an increased risk of dementia (75–77). However, a systematic review of several studies that included individuals without dementia reported that diabetes and hypertension were associated with reduced cognitive function (78). A 10-point increment in diastolic blood pressure (BP) is associated with increased odds of cognitive impairment (7%; 1–14%) in a North American sample even after controlling for numerous other factors (79). Thus, the findings reported for studies of MS samples appear consistent with these adverse impacts of vascular comorbidity, including diabetes and hypertension, on cognition in the general population.
Limitations to our study include our modest sample size, though we were careful to take several steps to reduce the number of variables examined and the number of comparisons performed in our primary analysis. Nonetheless, our findings should be replicated in other, larger populations. Most of our participants were women, consistent with the general female predominance of MS, thus our findings may not generalize as well to men with MS. While we did not comprehensively measure all cognitive domains, we assessed those most often affected in people with MS, those included in the BICAMS, and those affected by the comorbidities investigated here. Like other studies to date we were unable to account for the severity of vascular and other comorbidities or their treatments, and could not discriminate the effects of individual vascular comorbidities or behavioral factors such as smoking; this warrants further investigation. Prior studies have reported that depression and anxiety disorders are associated with lower cognitive performance and alterations in brain structure, and we did incorporate these variables into all of our regression models as covariates (80–82). Use of psychotropic medications may adversely influence cognition, however, their use overlapped substantially with the depression and anxiety disorders in our cohort, precluding an assessment of their effects (including whether they were mediated by changes in brain structure as illustrated in Figure 1 or via other pathways). Psychotropic medications may improve cognition as the psychiatric disorder remits, or worsen cognition (83). These effects on cognitive function may vary by drug class and possibly by specific agent, mandating the use of large samples to elucidate their effects. However, though we used the gold standard structured interview to identify these conditions, the small number of individuals affected precluded more detailed analysis. Our MRI protocol did not include gadolinium so it is possible that we included participants with focal inflammatory activity, which might have affected cognitive performance (84, 85). Other studies have suggested that vascular comorbidities, such as hyperlipidemia, are associated with an increase in gadolinium-enhancing lesions. Therefore, it is possible that a larger proportion of cognitive performance might have been mediated by MRI measures if we had been able to capture gadolinium-enhancing lesions. However, the proportion of participants with a relapse in the prior year was quite low. We used a small number of MRI measures to address multicollinearity and meet assumptions of our analyses. We focused on a subset of readily available MRI measures. Use of more advanced imaging measures, and incorporating other measures such as lesion volume might have increased the proportion of the vascular comorbidity effect on cognition mediated by MRI measures. That is, using a more limited set of measures may have biased our findings toward the null. Moreover, targeting more focal hypotheses may provide greater insight into the mechanisms evaluated herein. Although our study suggests that changes in MRI measures mediate the effects of vascular comorbidity on cognition, we cannot determine whether the changes in MRI measures solely reflect vascular effects similar to those in the general population, or whether the vascular comorbidities lead to increases in MS-specific pathologic changes. Finally, the cross-sectional nature of the study design limits causal inference. Nonetheless, cross-sectional studies that use mediation analyses can provide strong theoretical frameworks to guide future research, and more appropriately account for variables that lie in the same causal pathway than other approaches, as illustrated in the chronic pain literature (86). Future studies should examine these relationships longitudinally.
Our findings demonstrate that vascular comorbidity is associated with lower cognitive function in people with MS and this association is mediated, at least in part, via measurable changes in brain macrostructure and microstructure. This underscores the importance of preventing and treating vascular comorbidity effectively in persons with MS to mitigate their impacts on cognition and brain structure. Our findings highlight the importance of ensuring that etiologies other than MS, such as vascular comorbidity, are considered when evaluating individuals experiencing cognitive impairment. Our findings also suggest that additional MRI measures, such as DTI, may be considered useful methods of assessing the efficacy of interventions aimed at vascular comorbidities affecting persons with MS in the future, potentially warranting future consensus efforts (87).
Data Availability Statement
The datasets presented in this article are not readily available because some participants did not agree to data sharing. Components of the datasets may be made accessible to qualified investigators with the appropriate ethical approvals and data use agreements upon request. Requests to access the datasets should be directed to RM, rmarrie@hsc.mb.ca.
Ethics Statement
The studies involving human participants were reviewed and approved by University of Manitoba Health Research Ethics Board. The patients/participants provided their written informed consent to participate in this study.
Author Contributions
RM: conceptualization, project administration, supervision, funding acquisition, and writing—original draft. JF: conceptualization, project administration, supervision, funding acquisition, and writing—review and editing. RP: conceptualization and writing—review and editing. CF: conceptualization, funding acquisition, methodology, and writing—review and editing. JK, JB, EM, JM, CB, and LG: conceptualization, funding acquisition, and writing—review and editing. CH: methodology, analysis, resources, and writing—review and editing. MU: methodology and writing—review and editing. TF: analysis and writing—review and editing. All authors contributed to the article and approved the submitted version.
Funding
This study was funded by the Waugh Family Foundation MS Society of Canada Operating Grant (EGID 2639), CIHR (THC-135234), Crohn's and Colitis Canada, and the Waugh Family Chair in Multiple Sclerosis (to RM). CB was supported in part by the Bingham Chair in Gastroenterology.
Conflict of Interest
RM receives research funding from: CIHR, Research Manitoba, Multiple Sclerosis Society of Canada, Multiple Sclerosis Scientific Foundation, Crohn's and Colitis Canada, National Multiple Sclerosis Society, CMSC, The Arthritis Society, US Department of Defense and UK MS Society. She serves on the Editorial Board of Neurology and Multiple Sclerosis Journal. She is a co-investigator on studies funded in part by Biogen Idec and Roche no funds to her or her institution. RP receives research funding from the Workers Compensation Board of Manitoba. CF receives research funding from the Brain Canada Foundation, MS Society of Canada, Natural Sciences and Engineering Research Council of Canada, Research Manitoba, and Health Sciences Centre Foundation and serves as Associate Editor of Frontiers in Neurology (Section on Applied Neuroimaging). JK receives research funding from the MS Society of Canada, University of Manitoba and Health Sciences Centre Foundation. JB receives research funding from CIHR, Brain and Behavior Research Foundation and the MS Society of Canada. LG receives research funding from CIHR, the MS Society of Canada and the Health Sciences Centre Foundation. She has consulted to Roche Canada. EM receives research funding from NSERC and St. Francis Xavier University, and other grant funding from the Council of Atlantic University Libraries. JM has conducted trials for Biogen Idec and Roche, and receives research funding from the MS Society of Canada. CB has consulted to Abbvie Canada, Amgen Canada, Bristol Myers Squibb Canada, Janssen Canada, Pfizer Canada, Roche Canada, Sandoz Canada, Takeda Canada, Mylan Pharmaceuticals, and Avir Pharmaceuticals. He has received unrestricted educational grants from Abbvie Canada, Janssen Canada, Pfizer Canada, Takeda Canada and Bristol Myers Squibb Canada. He has received investigator initiated grants from Abbvie Canada, Pfizer Canada, Amgen Canada, and Sandoz Canada. He has been on speaker's bureau of Abbvie Canada, Janssen Canada, Pfizer Canada, and Takeda Canada. JF receives research grant support from the Canadian Institutes of Health Research, the National Multiple Sclerosis Society, the Multiple Sclerosis Society of Canada, Crohn's and Colitis Canada, Research Nova Scotia; consultation and distribution royalties from MAPI Research Trust.
The remaining authors declare that the research was conducted in the absence of any commercial or financial relationships that could be construed as a potential conflict of interest.
Publisher's Note
All claims expressed in this article are solely those of the authors and do not necessarily represent those of their affiliated organizations, or those of the publisher, the editors and the reviewers. Any product that may be evaluated in this article, or claim that may be made by its manufacturer, is not guaranteed or endorsed by the publisher.
Acknowledgments
This study was approved by Shared Health Manitoba. The authors thank Christopher O'Grady for assistance with image processing.
Supplementary Material
The Supplementary Material for this article can be found online at: https://www.frontiersin.org/articles/10.3389/fneur.2022.910014/full#supplementary-material
References
1. Rao SM, Leo GJ, Bernardin L, Unverzagt F. Cognitive dysfunction in multiple sclerosis I: frequency, patterns, and predictions. Neurology. (1991) 41:685–91. doi: 10.1212/WNL.41.5.685
2. Rocca MA, Amato MP, De Stefano N, Enzinger C, Geurts JJ, Penner I-K, et al. Clinical and imaging assessment of cognitive dysfunction in multiple sclerosis. Lancet Neurol. (2015) 14:302–17. doi: 10.1016/S1474-4422(14)70250-9
3. Goverover Y, Strober L, Chiaravalloti N, DeLuca J. Factors that moderate activity limitation and participation restriction in people with multiple sclerosis. Am J Occup Ther. (2015) 69:6902260020p1–9. doi: 10.5014/ajot.2015.014332
4. Houtchens MK, Benedict RH, Killiany R, Sharma J, Jaisani Z, Singh B, et al. Thalamic atrophy and cognition in multiple sclerosis. Neurology. (2007) 69:1213–23. doi: 10.1212/01.wnl.0000276992.17011.b5
5. Zivadinov R, Sepcic J, Nasuelli D, De Masi R, Bragadin LM, Tommasi MA, et al. A longitudinal study of brain atrophy and cognitive disturbances in the early phase of relapsing-remitting multiple sclerosis. J Neurol Neurosurg Psychiatry. (2001) 70:773–80. doi: 10.1136/jnnp.70.6.773
6. Comi G, Filippi M, Martinelli V, Sirabian G, Visciani A, Campi A, et al. Brain magnetic resonance imaging correlates of cognitive impairment in multiple sclerosis. J Neurol Sci. (1993) 115:S66–S73. doi: 10.1016/0022-510X(93)90212-H
7. Berg D, Maurer M, Warmuth-Metz M, Rieckmann P, Becker G. The correlation between ventricular diameter measured by transcranial sonography and clinical disability and cognitive dysfunction in patients with multiple sclerosis. Arch Neurol. (2000) 57:1289–92. doi: 10.1001/archneur.57.9.1289
8. Filippi M, Tortorella C, Rovaris M, Bozzali M, Possa F, Sormani MP, et al. Changes in the normal appearing brain tissue and cognitive impairment in multiple sclerosis. J Neurol Neurosurg Psychiatry. (2000) 68:157–61. doi: 10.1136/jnnp.68.2.157
9. Hulst HE, Steenwijk MD, Versteeg A, Pouwels PJW, Vrenken H, Uitdehaag BMJ, et al. Cognitive impairment in MS: Impact of white matter integrity, gray matter volume, and lesions. Neurology. (2013) 80:1025–32. doi: 10.1212/WNL.0b013e31828726cc
10. Rovaris M, Filippi M, Minicucci L, Iannucci G, Santuccio G, Possa F, et al. Cortical/subcortical disease burden and cognitive impairment in patients with multiple sclerosis. Am J Neuroradiol. (2000) 21:402–8.
11. Marrie RA, Reider N, Cohen J, Stuve O, Trojano M, Sorensen PS, et al. A systematic review of the incidence and prevalence of comorbidity in multiple sclerosis: overview. Mult Scler. (2015) 21:263–81. doi: 10.1177/1352458514564491
12. Salter A, Kowalec K, Fitzgerald KC, Cutter G, Marrie RA. Comorbidity is associated with disease activity in MS: findings from the CombiRx trial. Neurology. (2020) 95:e446–e56. doi: 10.1212/WNL.0000000000010024
13. McKay KA, Tremlett H, Fisk JD, Zhang T, Patten SB, Kastrukoff L, et al. Psychiatric comorbidity is associated with disability progression in multiple sclerosis. Neurology. (2018) 90:e1316–23. doi: 10.1212/WNL.0000000000005302
14. Abbatemarco JR, Ontaneda D, Nakamura K, Husak S, Wang Z, Alshehri E, et al. Comorbidity effect on processing speed test and MRI measures in multiple sclerosis patients. Mult Scler Relat Disord. (2020) 46:102593. doi: 10.1016/j.msard.2020.102593
15. Marrie RA, Patel R, Figley CR, Kornelsen J, Bolton JM, Graff L, et al. Diabetes and anxiety adversely affect cognition in multiple sclerosis. Mult Scler Relat Disord. (2019) 27:164–70. doi: 10.1016/j.msard.2018.10.018
16. Reia A, Petruzzo M, Falco F, Costabile T, Conenna M, Carotenuto A, et al. A retrospective exploratory analysis on cardiovascular risk and cognitive dysfunction in multiple sclerosis. Brain Sci. (2021) 11:502. doi: 10.3390/brainsci11040502
17. Fitzgerald KC, Damian A, Conway D, Mowry EM. Vascular comorbidity is associated with lower brain volumes and lower neuroperformance in a large multiple sclerosis cohort. Mult Scler. (2021) 27:1914–23. doi: 10.1177/1352458520984746
18. Marrie RA, Patel R, Figley CR, Kornelsen J, Bolton JM, Graff LA, et al. Higher framingham risk scores are associated with greater loss of brain volume over time in multiple sclerosis. Mult Scler Relat Disord. (2021) 54:103088. doi: 10.1016/j.msard.2021.103088
19. Lorefice L, Frau J, Coghe G, Pitzalis R, Gessa I, Contu F, et al. Assessing the burden of vascular risk factors on brain atrophy in multiple sclerosis: a case- control MRI study. Mult Scler Relat Disord. (2018) 27:74–8. doi: 10.1016/j.msard.2018.10.011
20. Fuhrmann D, Nesbitt D, Shafto M, Rowe JB, Price D, Gadie A, et al. Strong and specific associations between cardiovascular risk factors and white matter micro- and macrostructure in healthy aging. Neurobiol Aging. (2019) 74:46–55. doi: 10.1016/j.neurobiolaging.2018.10.005
21. Maniega SM, Valdés Hernández MC, Clayden JD, Royle NA, Murray C, Morris Z, et al. White matter hyperintensities and normal-appearing white matter integrity in the aging brain. Neurobiol Aging. (2015) 36:909–18. doi: 10.1016/j.neurobiolaging.2014.07.048
22. Arnett PA. Longitudinal consistency of the relationship between depression symptoms and cognitive functioning in multiple sclerosis. CNS Spectr. (2005) 10:372–82. doi: 10.1017/S1092852900022744
23. Gold SM, O'Connor M-F, Gill R, Kern KC, Shi Y, Henry RG, et al. Detection of altered hippocampal morphology in multiple sclerosis-associated depression using automated surface mesh modeling. Hum Brain Mapp. (2014) 35:30–7. doi: 10.1002/hbm.22154
24. Gold SM, Kern KC, O'Connor M-F, Montag MJ, Kim A, Yoo YS, et al. Smaller cornu ammonis 2–3/dentate gyrus volumes and elevated cortisol in multiple sclerosis patients with depressive symptoms. Biol Psychiatry. (2010) 68:553–9. doi: 10.1016/j.biopsych.2010.04.025
25. Zorzon M, Zivadinov R, Nasuelli D, Ukmar M, Bratina A, Tommasi MA, et al. Depressive symptoms and MRI changes in multiple sclerosis. Eur J Neurol. (2002) 9:491–6. doi: 10.1046/j.1468-1331.2002.00442.x
26. Feinstein A, O'Connor P, Akbar N, Moradzadeh L, Scott C, Lobaugh N. Diffusion tensor imaging abnormalities in depressed multiple sclerosis patients. Mult Scler. (2010) 16:189–96. doi: 10.1177/1352458509355461
27. Polman CH, Reingold SC, Banwell B, Clanet M, Cohen JA, Filippi M, et al. Diagnostic criteria for multiple sclerosis: 2010 revisions to the McDonald criteria. Ann Neurol. (2011) 69:292–302. doi: 10.1002/ana.22366
28. Marrie RA, Whitehouse CE, Patel R, Figley CR, Kornelsen J, Bolton JM, et al. Performance of regression-based norms for cognitive functioning of persons with multiple sclerosis in an independent sample. Front Neurol. (2021) 11:621010. doi: 10.3389/fneur.2020.621010
29. Mazziotta JC, Woods R, Iacoboni M, Sicotte N, Yaden K, Tran M, et al. The myth of the normal, average human brain—The ICBM experience: (1) Subject screening and eligibility. Neuroimage. (2009) 44:914–22. doi: 10.1016/j.neuroimage.2008.07.062
30. Marrie RA, Graff LA, Walker JR, Fisk JD, Patten SB, Hitchon CA, et al. A prospective study of the effects of psychiatric comorbidity in immune-mediated inflammatory disease: rationale, protocol and participation. JMIR Res Protoc. (2018) 7:e15. doi: 10.2196/resprot.8794
31. Harris PA, Taylor R, Thielke R, Payne J, Gonzalez N, Conde JG. Research electronic data capture (REDCap)—A metadata-driven methodology and workflow process for providing translational research informatics support. J Biomed Inform. (2009) 42:377–81. doi: 10.1016/j.jbi.2008.08.010
32. Kurtzke JF. Rating neurologic impairment in multiple sclerosis: an Expanded Disability Status Scale (EDSS). Neurology. (1983) 33:1444-52. doi: 10.1212/WNL.33.11.1444
33. Horton M, Rudick RA, Hara-Cleaver C, Marrie RA. Validation of a self-report comorbidity questionnaire for multiple sclerosis. Neuroepidemiology. (2010) 35:83–90. doi: 10.1159/000311013
34. American Diabetes Association. Standards of medical care in diabetes−2011. Diabetes Care. (2011) 34:S11–61. doi: 10.2337/dc11-S011
35. Whitehouse CE, Fisk JD, Bernstein CN, Berrigan LI, Bolton JM, Graff LA, et al. Comorbid anxiety, depression, and cognition in MS and other immune-mediated disorders. Neurology. (2019) 92:e406–e17. doi: 10.1212/WNL.0000000000006854
36. First M, Gibbon M, Spitzer R, Williams J. User's Guide for the Structured Clinical Interview for DSM-IV-TR Axis I Disorders - Research Version - (SCID-I for DSM-IV-TR, November 2002 Revision). New York, New York Biometrics Research Department, New York State Psychiatric Institute (2002).
37. Langdon DW, Amato MP, Boringa J, Brochet B, Foley F, Fredrikson S, et al. Recommendations for a Brief International Cognitive Assessment for Multiple Sclerosis (BICAMS). Mult Scler. (2012) 18:891–8. doi: 10.1177/1352458511431076
38. Benedict RHB, Fischer JS, Archibald CJ, Arnett PA, Beatty WW, Bobholz J, et al. Minimal neuropsychological assessment of MS patients: a consensus approach. Clin Neuropsychol. (2002) 16:381–97. doi: 10.1076/clin.16.3.381.13859
39. Smith A. Symbol Digit Modalities Test. 9th ed. Torrance, California: Western Psychological Services (2002).
40. Delis DC, Kramer JH, Kaplan E, Ober BA. California Verbal Learning Test Second Edition Adult Version Manual. San Antonio, TX: The Psychological Corporation (2000).
41. Benedict RHB, Hopkins BJ. Verbal Learning Test-Revised/Brief Visuospatial Memory Test-Revised Professional Manual Supplement. Odessa, FL: Psychological Assessment Resources. (2001).
42. Strauus E, Sherman E, Spreen O. A Compendium of Neuropsychological Tests: Administration, Norms, and Commentary. 3rd Edn. New York, NY: Oxford University Press (2006).
44. Jenkinson M, Smith S. A global optimisation method for robust affine registration of brain images. Med Image Anal. (2001) 5:143–56. doi: 10.1016/S1361-8415(01)00036-6
45. Jenkinson M, Bannister P, Brady M, Smith S. Improved optimization for the robust and accurate linear registration and motion correction of brain images. Neuroimage. (2002) 17:825–41. doi: 10.1006/nimg.2002.1132
46. Schmidt P, Gaser C, Arsic M, Buck D, Förschler A, Berthele A, et al. An automated tool for detection of FLAIR-hyperintense white-matter lesions in Multiple Sclerosis. Neuroimage. (2012) 59:3774–83. doi: 10.1016/j.neuroimage.2011.11.032
47. Griffanti L, Zamboni G, Khan A, Li L, Bonifacio G, Sundaresan V, et al. BIANCA (Brain Intensity AbNormality Classification Algorithm): a new tool for automated segmentation of white matter hyperintensities. Neuroimage. (2016) 141:191–205. doi: 10.1016/j.neuroimage.2016.07.018
48. Battaglini M, Jenkinson M, De Stefano N. Evaluating and reducing the impact of white matter lesions on brain volume measurements. Hum Brain Mapp. (2012) 33:2062–71. doi: 10.1002/hbm.21344
49. Smith SM, Zhang Y, Jenkinson M, Chen J, Matthews PM, Federico A, et al. Accurate, robust, and automated longitudinal and cross-sectional brain change analysis. Neuroimage. (2002) 17:479–89. doi: 10.1006/nimg.2002.1040
50. Smith SM, Jenkinson M, Woolrich MW, Beckmann CF, Behrens TE, Johansen-Berg H, et al. Advances in functional and structural MR image analysis and implementation as FSL. Neuroimage. (2004) 23:S208–19. doi: 10.1016/j.neuroimage.2004.07.051
51. Mohammadi S, Möller HE, Kugel H, Müller DK, Deppe M. Correcting eddy current and motion effects by affine whole-brain registrations: evaluation of three-dimensional distortions and comparison with slicewise correction. Magn Reson Med. (2010) 64:1047–56. doi: 10.1002/mrm.22501
52. Ruthotto L, Kugel H, Olesch J, Fischer B, Modersitzki J, Burger M, et al. Diffeomorphic susceptibility artifact correction of diffusion-weighted magnetic resonance images. Phys Med Biol. (2012) 57:5715–31. doi: 10.1088/0031-9155/57/18/5715
53. Ruthotto L, Mohammadi S, Heck C, Modersitzki J, Weiskopf N. Hyperelastic susceptibility artifact correction of DTI in SPM. In: Meinzer H-P, Deserno TM, Handels H, Tolxdorff T, editors. Bildverarbeitung für die Medizin 2013. Heidelberg: Springer. (2013) p. 344–9. doi: 10.1007/978-3-642-36480-8_60
54. Mohammadi S, Hutton C, Nagy Z, Josephs O, Weiskopf N. Retrospective correction of physiological noise in DTI using an extended tensor model and peripheral measurements. Magn Reson Med. (2013) 70:358–69. doi: 10.1002/mrm.24467
55. Jeurissen B, Leemans A, Tournier JD, Jones DK, Sijbers J. Investigating the prevalence of complex fiber configurations in white matter tissue with diffusion magnetic resonance imaging. Hum Brain Mapp. (2013) 34:2747–66. doi: 10.1002/hbm.22099
56. Figley CR, Uddin MN, Wong K, Kornelsen J, Puig J, Figley TD. Potential pitfalls of using fractional anisotropy, axial diffusivity, and radial diffusivity as biomarkers of cerebral white matter microstructure. Front Neurosci. (2021) 15:799576. doi: 10.3389/fnins.2021.799576
57. Soares J, Marques P, Alves V, Sousa N. A hitchhiker's guide to diffusion tensor imaging. Front Neurosci. (2013) 7:31. doi: 10.3389/fnins.2013.00031
58. Marrie RA, Elliott L, Marriott J, Cossoy M, Tennakoon A, Yu N. Comorbidity increases the risk of hospitalizations in multiple sclerosis. Neurology. (2015) 84:350–8. doi: 10.1212/WNL.0000000000001187
59. Marrie RA, Horwitz R, Cutter G, Tyry T. Cumulative impact of comorbidity on quality of life in MS. Acta Neurol Scand. (2012) 125:180–6. doi: 10.1111/j.1600-0404.2011.01526.x
60. Kim S, Kim Y, Park SM. Body mass index and decline of cognitive function. PLoS ONE. (2016) 11:e0148908. doi: 10.1371/journal.pone.0148908
61. Suemoto CK, Gilsanz P, Mayeda ER, Glymour MM. Body mass index and cognitive function: the potential for reverse causation. Int J Obes. (2015) 39:1383–9. doi: 10.1038/ijo.2015.83
62. Xiang X, An R. Body weight status and onset of cognitive impairment among U.S. middle-aged and older adults. Arch Gerontol Geriatr. (2015) 60:394–400. doi: 10.1016/j.archger.2015.02.008
63. Sherry A, Henson RK. Conducting and interpreting canonical correlation analysis in personality research: a user-friendly primer. J Pers Assess. (2005) 84:37–48. doi: 10.1207/s15327752jpa8401_09
64. Lin SJ, Lam J, Beveridge S, Vavasour I, Traboulsee A, Li DKB, et al. Cognitive performance in subjects with multiple sclerosis is robustly influenced by gender in canonical-correlation analysis. J Neuropsychiatry Clin Neurosci. (2017) 29:119–27. doi: 10.1176/appi.neuropsych.16040083
65. Zhang T, Tremlett H, Leung S, Zhu F, Kingwell E, Fisk JD, et al. Examining the effects of comorbidities on disease-modifying therapy use in multiple sclerosis. Neurology. (2016) 86:1287–95. doi: 10.1212/WNL.0000000000002543
66. Landmeyer N, Burkner P-C, Wiendl H, Ruck T, Hartung H-P, Holling H, et al. Disease-modifying therapies and cognition in relapsing remitting MS - a meta-analysis. Neurology. (2020) 94:e2373–e83. doi: 10.1212/WNL.0000000000009522
67. Hayes AF, Preacher KJ. Statistical mediation analysis with a multicategorical independent variable. Br J Math Stat Psychol. (2014) 67:451–70. doi: 10.1111/bmsp.12028
68. Goodman SN. Multiple comparisons, explained. Am J Epidemiol. (1998) 147:807–12; discussion 15. doi: 10.1093/oxfordjournals.aje.a009531
69. Jefferson AL, Massaro JM, Wolf PA, Seshadri S, Au R, Vasan RS, et al. Inflammatory biomarkers are associated with total brain volume: the Framingham Heart Study. Neurology. (2007) 68:1032–8. doi: 10.1212/01.wnl.0000257815.20548.df
70. Klein JP, Waxman SG. The brain in diabetes: molecular changes in neurons and their implications for end-organ damage. Lancet Neurol. (2003) 2:548–54. doi: 10.1016/S1474-4422(03)00503-9
71. Launer LJ. Diabetes and brain aging: epidemiologic evidence. Curr Diab Rep. (2005) 5:59–63. doi: 10.1007/s11892-005-0069-1
72. Waldstein SR. The relation of hypertension to cognitive function. Curr Dir Psychol Sci. (2003) 12:9–12. doi: 10.1111/1467-8721.01212
73. Cox SR, Lyall DM, Ritchie SJ, Bastin ME, Harris MA, Buchanan CR, et al. Associations between vascular risk factors and brain MRI indices in UK Biobank. Eur Heart J. (2019) 40:2290–300. doi: 10.1093/eurheartj/ehz100
74. Power MC, Tingle JV, Reid RI, Huang J, Sharrett AR, Coresh J, et al. Midlife and late-life vascular risk factors and white matter microstructural integrity: the atherosclerosis risk in communities neurocognitive study. J Am Heart Assoc. (2017) 6:e005608. doi: 10.1161/JAHA.117.005608
75. Elkins JS, O'Meara ES, Longstreth WT Jr, Carlson MC, Manolio TA, Johnston SC, et al. Stroke risk factors and loss of high cognitive function. Neurology. (2004) 63:793–9. doi: 10.1212/01.WNL.0000137014.36689.7F
76. Pavlik VN, Hyman DJ, Doody R. Cardiovascular risk factors and cognitive function in adults 30-59 years of age (NHANES III). Neuroepidemiology. (2005) 24:42–50. doi: 10.1159/000081049
77. Spinelli C, De Caro MF, Schirosi G, Mezzapesa D, De Benedittis L, Chiapparino C, et al. Impaired cognitive executive dysfunction in adult treated hypertensives with a confirmed diagnosis of poorly controlled blood pressure. Int J Med Sci. (2014) 11:771–8. doi: 10.7150/ijms.8147
78. van den Berg E, Kloppenborg RP, Kessels RPC, Kappelle LJ, Biessels GJ. Type 2 diabetes mellitus, hypertension, dyslipidemia and obesity: a systematic comparison of their impact on cognition. Biochim Biophys Acta. (2009) 1792:470–81. doi: 10.1016/j.bbadis.2008.09.004
79. Tsivgoulis G, Alexandrov AV, Wadley VG, Unverzagt FW, Go RCP, Moy CS, et al. Association of higher diastolic blood pressure levels with cognitive impairment. Neurology. (2009) 73:589–95. doi: 10.1212/WNL.0b013e3181b38969
80. Morrow SA, Rosehart H, Pantazopoulos K. Anxiety and depressive symptoms are associated with worse performance on objective cognitive tests in MS. J Neuropsychiatry Clin Neurosci. (2016) 28:118–23. doi: 10.1176/appi.neuropsych.15070167
81. Leavitt VM, Brandstadter R, Fabian M, Katz Sand I, Klineova S, Krieger S, et al. Dissociable cognitive patterns related to depression and anxiety in multiple sclerosis. Mult scler. (2019) 26:1247–55. doi: 10.1177/1352458519860319
82. Ribbons K, Lea R, Schofield PW, Lechner-Scott J. Anxiety levels are independently associated with cognitive performance in an australian multiple sclerosis patient cohort. J Neuropsychiatry Clin Neurosci. (2017) 29:128–34. doi: 10.1176/appi.neuropsych.16050085
83. Brooks JO, Hoblyn JC. Neurocognitive costs and benefits of psychotropic medications in older adults. J Geriatr Psychiatry Neurol. (2007) 20:199–214. doi: 10.1177/0891988707308803
84. Pardini M, Uccelli A, Grafman J, Yaldizli Ö, Mancardi G, Roccatagliata L. Isolated cognitive relapses in multiple sclerosis. J Neurol Neurosurg Psychiatry. (2014) 85:1035–7. doi: 10.1136/jnnp-2013-307275
85. Fenu G, Arru M, Lorefice L, Frau J, Coghe G, Fronza M, et al. Does focal inflammation have an impact on cognition in multiple sclerosis? An MRI study. Mult Scler Relat Disord. (2018) 23:83–7. doi: 10.1016/j.msard.2018.05.012
86. Rudy TE, Kerns RD, Turk DC. Chronic pain and depression: toward a cognitive-behavioral mediation model. Pain. (1988) 35:129–40. doi: 10.1016/0304-3959(88)90220-5
Keywords: multiple sclerosis, MRI, cognition, diabetes, hypertension
Citation: Marrie RA, Patel R, Figley CR, Kornelsen J, Bolton JM, Graff LA, Mazerolle EL, Helmick C, Uddin MN, Figley TD, Marriott JJ, Bernstein CN and Fisk JD (2022) Effects of Vascular Comorbidity on Cognition in Multiple Sclerosis Are Partially Mediated by Changes in Brain Structure. Front. Neurol. 13:910014. doi: 10.3389/fneur.2022.910014
Received: 31 March 2022; Accepted: 03 May 2022;
Published: 24 May 2022.
Edited by:
Marcello Moccia, University of Naples Federico II, ItalyReviewed by:
Lorena Lorefice, ATS Sardegna, ItalyMenno Michiel Schoonheim, VU Medical Center, Netherlands
Ruth Geraldes, Frimley Park Hospital NHS Foundation Trust, United Kingdom
Copyright © 2022 Marrie, Patel, Figley, Kornelsen, Bolton, Graff, Mazerolle, Helmick, Uddin, Figley, Marriott, Bernstein and Fisk. This is an open-access article distributed under the terms of the Creative Commons Attribution License (CC BY). The use, distribution or reproduction in other forums is permitted, provided the original author(s) and the copyright owner(s) are credited and that the original publication in this journal is cited, in accordance with accepted academic practice. No use, distribution or reproduction is permitted which does not comply with these terms.
*Correspondence: Ruth Ann Marrie, rmarrie@hsc.mb.ca