 Xia-an Bi
 Yang Wang
- College of Mathematics and Computer Science, Hunan Normal University, Changsha, China
Autism spectrum disorder (ASD) is mainly reflected in the communication and language barriers, difficulties in social communication, and it is a kind of neurological developmental disorder. Most researches have used the machine learning method to classify patients and normal controls, among which support vector machines (SVM) are widely employed. But the classification accuracy of SVM is usually low, due to the usage of a single SVM as classifier. Thus, we used multiple SVMs to classify ASD patients and typical controls (TC). Resting-state functional magnetic resonance imaging (fMRI) data of 46 TC and 61 ASD patients were obtained from the Autism Brain Imaging Data Exchange (ABIDE) database. Only 84 of 107 subjects are utilized in experiments because the translation or rotation of 7 TC and 16 ASD patients has surpassed ±2 mm or ±2°. Then the random SVM cluster was proposed to distinguish TC and ASD. The results show that this method has an excellent classification performance based on all the features. Furthermore, the accuracy based on the optimal feature set could reach to 96.15%. Abnormal brain regions could also be found, such as inferior frontal gyrus (IFG) (orbital and opercula part), hippocampus, and precuneus. It is indicated that the method of random SVM cluster may apply to the auxiliary diagnosis of ASD.
Introduction
Autism spectrum disorder (ASD) is mainly reflected in the communication and language barriers, difficulties in social communication, and it is a kind of neurological developmental disorder (Karten and Hirsch, 2015; Khundrakpam et al., 2017). The behavioral phenotype of ASD is well-depicted but its etiology and pathogenesis is rarely known (Amaral et al., 2008). According to the results of Hallmayer et al. (2011), the causes of ASD mainly include genetic and environmental risk factors. Some of the symptoms of ASD generally appear in about 2 years old (Ecker et al., 2015), thus the early diagnosis is needed (Plitt et al., 2015). It is recognized that traditional clinical methods cannot well distinguish patients from healthy controls (HC) (Mwangi et al., 2012). And it may not be complex enough to capture the abnormal brain regions in individuals who suffering from ASD (Uddin et al., 2011). To avoid this disadvantage, machine learning is introduced in the neuroimaging field. It is a valid means to extract messages from neuroimaging data and further predict the future changes of the disease (Klöppel et al., 2012; Orrù et al., 2012). Among numerous machine learning methods, support vector machines (SVM) is an excellent classification method (Zhang et al., 2015). SVM has distinct merits such as the higher classification accuracy (Zhang and Wu, 2012) and no need for a large number of training samples to avoid over-fitting (Li et al., 2010). Thus, SVM has aroused widespread concern of researchers in the field of neuroimaging (Sundermann et al., 2014).
In the researches of machine learning, SVM has been applied to classify ASD from corresponding controls. Gori et al. (2015) extracted features from the gray matter subregions, then these features were used in SVM to identity ASD from HC and the area under ROC curve (AUC) is 0.74. Jin et al. (2015) proposed an original multi-kernel SVM classification method to classify ASD from HC and the accuracy can reach to 76%. Chen et al. (2016) used the SVM to classify 112 adolescent subjects with ASD and 128 HC, and the classification accuracy was 79.17%. Odriozola et al. (2015) used the SVM based on functional magnetic resonance imaging (fMRI) data to classify 20 children with ASD and 20 typically developing (TD) peers, and the result showed 85% classification accuracy. Chanel et al. (2016) used the method of SVM and Recursive Feature Elimination (RFE) based on fMRI data to classify ASD from HC, and the result showed good classification accuracy (up to 92.3%).
These SVM classification studies on ASD have achieved relatively high classification accuracy in the range of 70–93% compared with traditional methods. They usually employed a single SVM and common features such as functional connections, gray matter volume to classify ASD from HC, and the classification accuracy is generally lower than 90%. In this paper, a novel method of random SVM cluster is proposed and several graph metrics of brain functional connectivity (e.g., local efficiency, shortest path) are employed to classify ASD and typical controls (TC). This method has some good performance. Firstly, the classification accuracy reaches to a higher level based on all the features. Then, we could find out the optimal feature set, the classification accuracy could also reach to the same level based on the optimal feature set. Thirdly, on the basis of the optimal feature set, we could find out the abnormal brain regions such as inferior frontal gyrus (IFG) (orbital and opercula part), hippocampus, and precuneus. Thus, the random SVM cluster may apply to the auxiliary diagnosis of ASD.
Materials and Methods
Demographic Information
The Autism Brain Imaging Data Exchange (ABIDE) database (http://fcon_1000.projects.nitrc.org/indi/abide/) (Di Martino et al., 2014) contains a variety of neuroimaging data. And the resting-state fMRI data include 539 ASD and 573 age-matched TC. There are 12 kinds of image protocols. This study chooses one of the image protocols, details as follows. MRI scanner = 3.0-T Siemens, TR = 3,000 ms, TE = 28 ms, data matrix = 64*64, Pixel Spacing X = 3.0 mm, Pixel Spacing Y = 3.0 mm, Flip Angle = 90°, Slice Thickness = 0.0 mm, no slice gap, axial slices = 34, time points = 120. Finally, 61 subjects with ASD and 46 TC met the image protocol. The original studies included in ABIDE received approval from each site's Institutional Review Board (IRB). All images were obtained with informed consent according to procedures established by human subject research boards.
Only 84 of 107 subjects are utilized in experiments because the translation or the rotation of 7 TC and 16 ASD patients has surpassed ± 2 mm or ± 2°. Table 1 shows the basic information of 84 participants. To assess the gender and age discrepancies between ASD group and TC group, we employed chi-square test and two-sample t-test respectively. The results show no considerable discrepancies between TC group and ASD group in gender (as the p-value is 0.359 and >0.05) and age (as the p-value is 0.278 and >0.05).
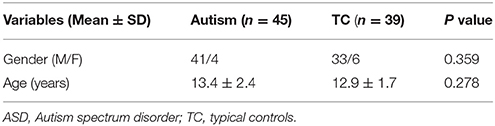
Table 1. Basic information of ASD and TC.
Data Preprocessing
Because of the lower signal-to-noise ratio, all the fMRI images are preprocessed by the Data Processing Assistant for Resting-State fMRI (DPARSF) software (Cui et al., 2015) (http://d.rnet.co/DPABI/DPABI_V2.3_170105.zip). The whole preprocessing procedures include:(1) Converting DICOM to NIFTI, (2) Removing the first 10 time points, (3) Slicing timing, (4) Realigning, (5) Normalizing with the echo-planar imaging (EPI) template, (6) Smoothing, (7) Removing the linear trend, (8) Temporal filtering, (9) Removing covariates.
Graph Theory Application
Our brain is consisted of different regions. Although each region carries out its own tasks, they often interconnect with each other, and the connections form the brain network. Graph could be employed to represent networks. A graph has two major components, nodes and links. fMRI image could be divided into 90 regions based on the Automatic Anatomical Labeling (AAL) (Tzourio-Mazoyer et al., 2002) atlas. We make these regions as the nodes of brain network, so there are 90 nodes. An average of the time series of a region's all voxels can be used to capture the mean time series of this region (Khazaee et al., 2016). The average time series of every two brain regions can be employed to calculate the Pearson correlation coefficient which is made as the link of the brain network (Khazaee et al., 2015), so there are 4,005 (90*89/2) weighted edges. Then we take the absolute value of the correlation coefficient and set a suitable threshold for the connectivity matrix to get an adjacency matrix. In this paper, the threshold is 0.25. Graph metrics calculated for this paper included: degree, shortest path, local efficiency and clustering coefficient. Thus, results have 90°, 4,005 shortest paths, 90 local efficiency, and 90 clustering coefficients. These graph metrics were the subsequent experimental features.
The Random SVM Cluster
The Design of the Random SVM Cluster
Previous classification studies generally used a single SVM as classifier. Although sometimes of the studies have good performance, it is not stable and always be affected by many factors such as the form of the kernel, the argument of the kernel, the penalty coefficient. A new classifier based on the random SVM cluster is proposed in this paper. It is featured with universality, stable performance and high accuracy.
The process of the random SVM cluster is as follows. Firstly, a sample set is divided into a training set and a test set. Then partial samples are randomly selected from the training set and partial features are extracted from all the sample features to establish a single SVM. The process is repeated for several times to form a random SVM cluster. When the sample of test set enters into the random SVM cluster, multiple SVMs make decisions at the same time and then we use the majority of votes to determine the category of the sample.
In the above process, the randomness of the random SVM cluster is reflected in two aspects, one is the randomness of sample selection, and another is the randomness of feature selection. Therefore, our model is universal and avoids the influence of many factors.
Based on the performance evaluation of a single SVM, the features of the classifier with higher classification accuracy constitute the feature matrix. Then the frequency of each feature in the features matrix is counted. The features with higher frequency is called “important feature.” Figure 1 is an overall flow chart of the random SVM cluster.
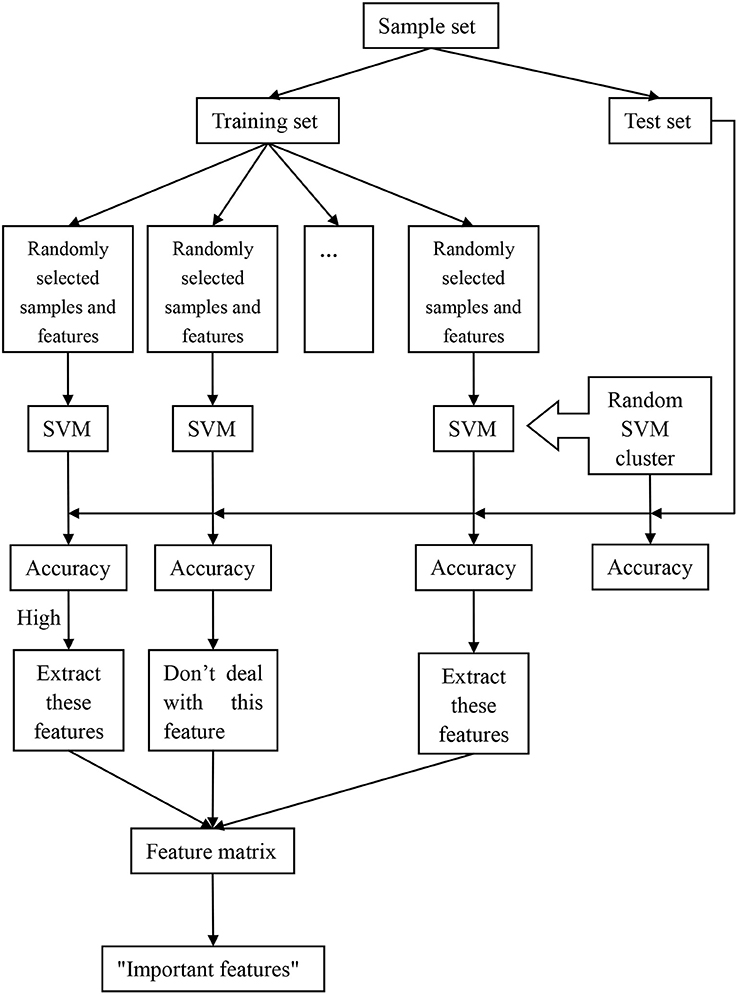
Figure 1. The overall framework of random SVM cluster.
The Classification of the Random SVM Cluster
The application of the random SVM cluster in fMRI is to construct a random SVM cluster based on the brain functional data of the subjects, and then it is used for classification as well as feature selection.
In this paper, the sample set is , where xi is the sample feature, yi is the category label. Each sample has 4,225 (90 + 4,005 + 90 + 90) features and the label of the ASD patient is −1 and the TC is +1.
Firstly, the 84 samples are divided into 58 training samples and 26 test samples based on the ratio of 7:3. Then 50 samples are randomly selected from the 58 training samples and 62 features are randomly selected from 4,225 features, which form a single SVM using Radial Basis Function (RBF) as kernel provided by the SVM toolbox (http://see.xidian.edu.cn/faculty/chzheng/bishe/indexfiles/indexl.htm) (Gunn, 1998). The width argument of RBF equals to 3, and penalty coefficient equals to Inf. The process is repeated for 500 times and these 500 SVMs constitute into a random SVM cluster.
When the 26 test samples enter into the random SVM cluster, and the 500 SVMs in the random SVM cluster make decisions simultaneously. The result of the 500 SVMs is counted, and the label with more votes is recorded as the predictive label of the sample. Thus, the predictive label of 26 test samples can be obtained. The number of samples with the same predictive label and the real label is divided by 26, which is the classification accuracy of the random SVM cluster.
We set up a random SVM cluster with 500 SVMs in the above, but we not sure whether the number of 500 is suitable. Therefore, it is necessary to find the optimal number of SVMs to set up the random SVM cluster. In this paper, we take the accuracy of the random SVM cluster as the criterion. The number of SVM in the random SVM cluster with the highest accuracy is the optimal SVM number.
Extracting Features from Random SVM Cluster
In the random SVM cluster, the performance of each SVM is different because the selected features for each SVM are different. Since the “important features” make a significant contribution to the classification performance of a single SVM, we could find the “important features” through the SVM with higher classification accuracy. The specific approach is as follows.
First of all, a random SVM cluster is built. Then the 26 test samples are used to test the classification of each SVM performance. The features of the first 100 SVMs with better classification performance constitute the feature matrix. The first 400 features with the higher frequency are referred as the “important features.”
We randomly select 62 features from the first q(70 ≤ q ≤ 400) features in the “important features” to build a random SVM cluster. The accuracy of the random SVM cluster is used as the criterion. The first q features that corresponding to the random SVM cluster with the highest accuracy are the optimal feature set. Those q features are the result of feature selection with random SVM cluster and can be seen as distinguishing features between the ASD patient and TC.
This paper uses the optimal feature set to find the abnormal brain regions. To show the abnormal brain region, the key is to find the weight of each brain region. Firstly, we find the features associated with certain region from the optimal feature set. Then the number of these features is made as the weight of the region.
Results
The Performance of a Random SVM Cluster
As shown in Figure 2, the overall accuracy of the 500 SVM is lower. On the contrary, the accuracy of the random SVM cluster is as high as 96.15%. This is sufficient to show that the performance of the random SVM cluster is much better than a single SVM.
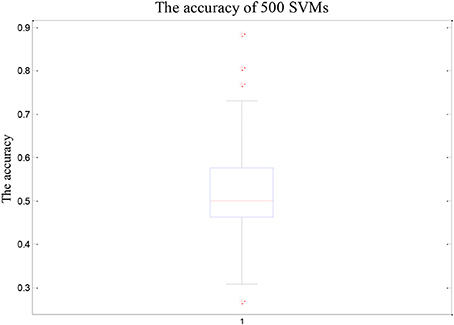
Figure 2. The accuracy of 500 SVMs.
The Optimal Number of Base Classifiers
The number of SVMs in the corresponding random SVM cluster with the highest classification accuracy is the optimal number of classifiers. First, we change the number of base classifiers from 5 to 700 and the step is 5. Then we count the classification accuracy of random SVM cluster with different number of classifiers. Finally, we sort the results and draw the corresponding graph as shown in Figure 3. The accuracy of the random SVM cluster reached a maximum of 96.15% and stabilized when the number of SVM is 500. Thus, 500 is regarded as the optimal number of base classifiers. In the subsequent experiments, we also use 500 as the number of classifiers.
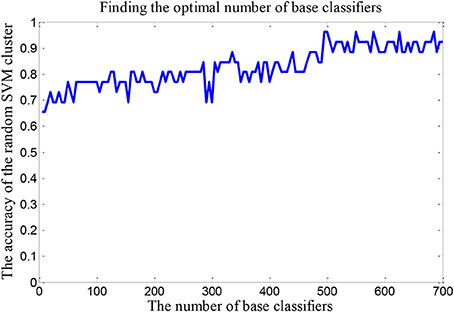
Figure 3. The optimal number of base classifiers.
Retention of the “Important Features”
The important features should meet the following two criterions: (1) The single SVM corresponding to these features has high classification accuracy. (2) These features have high frequency.
First of all, this study sorts the accuracy and picks out the features of first 100 SVMs to form a 100*62 matrix. Then we count the frequency of each feature number in this matrix. The highest frequency is 7 and the corresponding features are the shortest path between PreCG.R and IFGtriang.R, IFGoperc.R and PHG.L, REC.L and SMG.L, ORBsupmed.R and TPOmid.R. Table 2 lists the features whose frequency is 6 and 7. Since these features are all the shortest paths between two brain regions, only two brain regions corresponding to the shortest paths are listed in the Table 2.
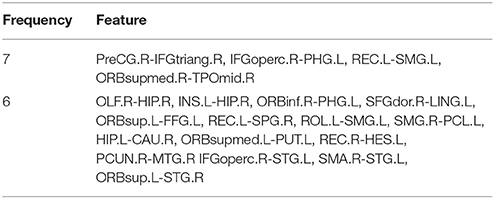
Table 2. The part of features with higher frequency.
The Optimal Feature Set
In order to find the optimal feature set, it is necessary to change the rule of the selected features. Firstly, we retain the first 70 dimensional features in the “important features” as the total dimension. Then the 62 dimensional features were randomly selected from the 70 dimensional features to build a random SVM cluster. Next, we change the number of the total dimension. The number of the total dimension is from 70 to 400 and the step is 2. Then we calculate the classification accuracy of random SVM cluster with different number of total dimension. Finally, we sort the results and draw the corresponding graph as shown in Figure 4. The accuracy of the random SVM cluster reached a maximum of 96.15% and stabilized when the first features number is 272. Therefore, the optimal feature set is composed by the first 272 features.
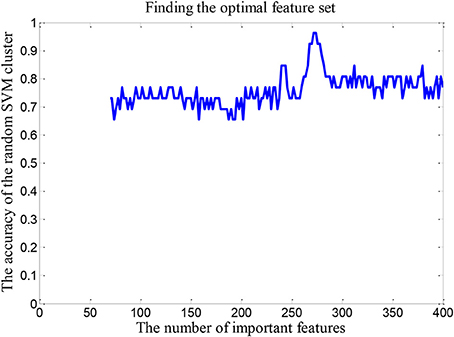
Figure 4. The number of optimal feature sets.
The Abnormal Brain Regions
The weight of each brain region is displayed in Figure 5. In this figure, the point represents the brain region. The brain regions with higher weight are shown in Table 3. The regions with the greater weight are listed as follows: the right IFG (opercular part), the right precuneus, superior frontal gyrus (orbital part), the left inferior occipital gyrus, the right hippocampus, the bilateral superior frontal gyrus (dorsolateral), the right median cingulate and paracingulate gyri, the right posterior cingulate gyrus, the left supramarginal gyrus, the right thalamus, the right superior, and middle temporal gyrus.
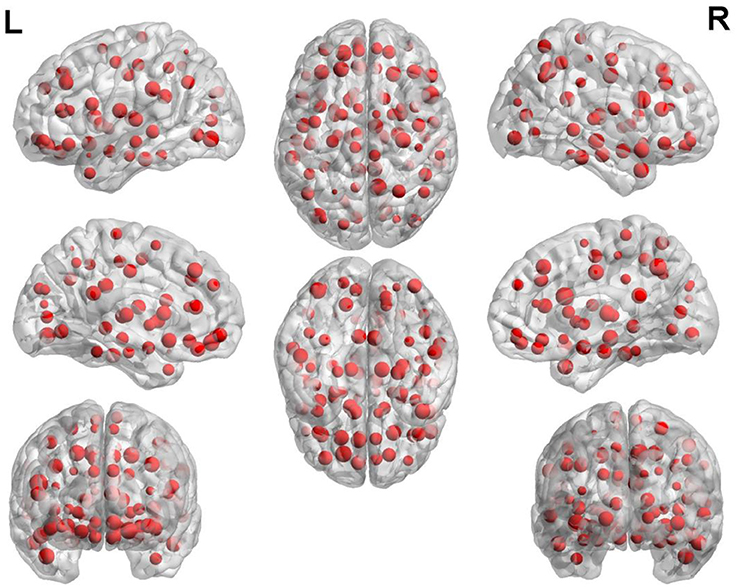
Figure 5. The weight of each brain region.
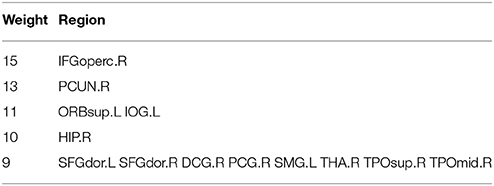
Table 3. The brain regions with higher weight.
Discussion
Classification Effect
In the experiment, we choose the specific values of some parameters of the random SVM cluster and now we discuss the parameter setting. On one hand, we make the RBF as kernel of a single SVM, the width argument of RBF equals to 3 and penalty coefficient equals to Inf. Although these parameter values are selected in this paper, we have tried other parameter values in the experiment and there is no significant difference in the performance of random SVM cluster. This shows that the random SVM cluster is universal. On the other hand, we make 0.25 as the threshold of the function connection network. Then we calculate the four graph metrics of the network. The larger the threshold is, the smaller the degree is and the larger the shortest path is. The usage of these graph metrics makes the accuracy of random SVM cluster lower. In turn, the smaller the threshold is, the greater the degree is and the smaller the shortest path is. Similarly, the usage of these graph metrics makes the accuracy of random SVM cluster lower. We found that the optimal threshold was 0.25 by dozens of experiments.
In recent years, there are various studies on the classification of ASD. For instance, Chen et al. (2015) used the SVM in combination with a fresh feature selection algorithm to classify 126 participants with ASD and 126 TD, and the classification accuracy was <70%. Jin et al. (2015) proposed an original multi-kernel SVM classification method to classify ASD from HC and the accuracy can reach to 76%. Anderson et al. (2011) used a leave-one-out classifier to discriminate 40 ASD from 40 controls with 79% total accuracy. Chen et al. (2016) used the SVM to classify 112 adolescent subjects with ASD and 128 HC, and the classification accuracy was 79.17%.
The majority of the classifier's accuracy is not higher than 90%. We employ a random SVM cluster to identify ASD and TC with the accuracy of 96.15%. Furthermore, the accuracy of the random SVM cluster reached a maximum of 96.15% and stabilized from 500 SVMs. It is sufficient shows that our method possesses an unexceptionable classification performance.
In this paper, we first establish a random SVM cluster, and then find the optimal number of classifiers based on the accuracy of the random SVM cluster. Then the important features are retained on the basis of the optimal number of the base classifiers. According to the accuracy of the random SVM cluster, the optimal feature set could also be discovered. Finally, the number of selected features is 272. These features constitute the optimal feature set for the random SVM cluster to distinguish ASD patients and TC, and the accuracy could also reach to 96.15%.
Analysis of the Brain Regions with Greater Weight
The experimental results show that the IFG, precuneus hippocampus, and cingulated cortex are the mainly abnormal regions of ASD. The following are the analyses of these regions in detail.
Inferior Frontal Gyrus (IFG)
The right IFG possesses the largest weight in the experimental results which implied that this region is an indispensable part in the classification of our method.
Inferior frontal gyrus, bilateral amygdala, and hippocampus are associated with facial emotion recognition (Ji et al., 2016). During target-oriented actions or when observing the same exercise behavior, the IFG is active (Hamzei et al., 2015). The IFG is a part region of lateral prefrontal cortex which affects regulating mood and attention (Sagaspe et al., 2011; Ochsner et al., 2012; Vanderhasselt et al., 2012). In healthy individuals, the responsiveness of IFG to terrible faces was positively related to the inhibition of amygdala responses, but was negatively related to trait anxiety (Mujica-Parodi et al., 2009). Doricchi et al. (2010) and Shulman et al. (2009) found that the right IFG was activated only when redirecting to an unexpected stimulus.
The abnormal IFG was found in several ASD studies. Keehn et al. (2016) found that compared with the TD group, the activation of the right IFG in the autism group increased obviously. In the study of Grezes et al. (2009) and Philip et al. (2010), the authors found that activation of the right IFG and inferior temporal gyrus in ASD participants decreased when doing the task of fearful gestures. Kim et al. (2015) found that ASD individuals appear to have lower activation in the right IFG than typically developing children (TDC) when fearful face were given to them. Gaffrey et al. (2007) found that less activation of left IFG in the ASD patients than controls.
The abnormal IFG probably bring about impairment in ASD patients such as facial emotion recognition impairment, attention impairment. The experimental result contributes to the clinical diagnosis and treatment of ASD.
Precuneus (PC)
The precuneus possesses the relatively larger weight in the experimental results which shows that the precuneus is a considerable part in the classification of our method.
Precuneus is a subregion of superior parietal cortex which is connected with consciousness and self-processing (Cavanna and Trimble, 2006). According to the previous studies, active precuneus is related to the degree of autocorrelation of the retrieved judgments (Lou et al., 2004), and the connectivity of the precuneus is related to the degree of consciousness of a person (Vanhaudenhuyse et al., 2009). It is observed that the precuneus is not activated at any stage of sleep (Maquet et al., 1997) or in vegetative states (Crone et al., 2011). Francis et al. (2016) observed that reduced activation in the precuneus when doing the recognition task. Ashizuka et al. (2015) disclosed that the precuneus is selectively activated during the polite judgment task. From the fMRI studies, we can see that the precuneus participated in a lot of highly integrated duty, including spatial guidance behavior, visual spatial images, and awareness (Mailo and Tang-Wai, 2015).
The abnormal precuneus was found in the abundant studies of ASD. For example, Schulte-Ruther et al. (2011) mentioned that the precuneus activation was positively related to compassion in ASD subjects rather than control subjects. Aoki et al. (2015) found hyperactivation in the cortical structures of ASD patients, including right precuneus and bilateral thalamus. Bookheimer et al. (2008) found that the precuneus was the only region in the ASD group which showed a strong activation when performed a post hoc identification. Cheng et al. (2017) found that functional connectivity of precuneus and orbitofrontal reduced significantly in autism. Silani et al. (2008) discovered that ASD patients displayed obviously less activities in precuneus.
The abnormal precuneus is likely to cause the consciousness disorder and poor integration ability in ASD patients. The experimental result may help in the clinical diagnosis and treatment of ASD.
Hippocampus
The hippocampus possesses the relatively larger weight in the experimental results which shows that the hippocampus also is a critical part in the classification of our method.
Hippocampus and amygdala are the key brain areas that involved in emotional memory (Mackiewicz et al., 2006). Some studies on fMRI in patients with depression have displayed that hippocampus is overactive when it comes to tasks related to working memory (Harvey et al., 2005; Walsh et al., 2007). The hippocampus is especially responsible for learning, making up fresh memories, and spatial navigation, and belongs to the limbic system (Ding et al., 2015). Dennis and Thompson (2014) found that the functional connectivity of hippocampus existed during the encoding memory task.
The abnormal hippocampus was found in several ASD studies. For instance, Cooper et al. (2017) found that functional connectivity of hippocampus reduced markedly in ASD group. ASD was associated with a raising relative hippocampus volume (Maier et al., 2015). Stanfield et al. (2008) found that the volume of hippocampus and amygdala was abnormal in ASD. Via et al. (2011) discovered that there was obviously decreased gray matter volume of bilateral amygdala-hippocampus complex in ASD patients. Yu et al. (2011) discovered that gray matter volume of hippocampus decreased distinctly in participants with ASD.
The abnormal hippocampus may result in memory and learning impairment in ASD patients. The experimental result may boost the clinical diagnosis and treatment of ASD.
Cingulate Gyrus
The cingulate gyrus possesses the comparatively larger weight in the experimental results which shows that cingulate gyrus is a decisive part in the classification of our method.
Numerous studies have pointed out that anterior cingulate cortex (ACC) affects basic cognitive processes, including motivation, making decision, learning, and monitoring errors to a large extent (Holroyd and McClure, 2015; Laubach et al., 2015; Verguts et al., 2015; Kolling et al., 2016). The human fMRI study reported that the posterior cingulate cortex (PCC) is associated with prospective memories (Andrews-Hanna et al., 2010). Silverman et al. (2015) discovered that PCC involved in reward processing in adolescent. The anterior cingulate may take part in the integration of emotional and control mechanisms (Pessoa, 2009). The ACC could influence response monitoring (Taylor et al., 2007).
The abnormal cingulate gyrus was found in several ASD studies. For example, Luna et al. (2002) discovered that subjects with ASD showed less task-related activation in PCC and dorsolateral prefrontal cortex when executing the space working memory task rather than (HC). Philip et al. (2012) discovered more activation of cingulate gyrus in controls compared to ASD patients. Doyle-Thomas et al. (2012) discovered that there is increased surface area (SA) of the right cingulate cortex in ASD patients. There is abnormal activation of ACC in ASD when performing tasks with different cognitive (Ashwin et al., 2007; Dichter and Belger, 2007). Kana et al. (2007) found abnormal connectivity between ACC and other regions in ASD during a requiring response task.
The cingulate gyrus abnormalities can be seen as the mark of ASD and which probably cause cognitive processes impairment and response monitoring disorder in ASD patients. The experimental result may enhance the clinical diagnosis and treatment of ASD.
To identity ASD patients from TD, we proposed a novel method, random SVM cluster, which has a better classification performance (accuracy is 96.15%). But it also has few limitations. Firstly, we only employed the brain level features in this paper, and we could employ voxel level features in the future studies. Secondly, our study only used four graph metrics as features. In the future studies, we could use more kinds of graph metrics as features. Finally, the random SVM cluster has excellent performance based on only one modal feature, we could boost its performance by multi-modal feature in the future studies.
Ethics Statement
This study was carried out in accordance with the recommendations of National Institute of Aging-Alzheimer's. This study was carried out in accordance s Association (NIA-AA) workgroup guidelines, IRB. The study was approved by IRB of each participating site, including the Banner Alzheimer's Institute, and was conducted in accordance with Federal Regulations, the Internal Conference on Harmonization (ICH), and Good Clinical Practices (GCP).
Author Contributions
XB proposed the design of the work and revised it critically for important intellectual content. QSun and QX carried out the experiment for the work and drafted part of the work. YW and QShu collected, interpreted the data, and drafted part of the work. All the authors approved the final version to be published and agreed to be accountable for all aspects of the work in ensuring that questions related to the accuracy or integrity of any part of the work are appropriately investigated and resolved.
Conflict of Interest Statement
The authors declare that the research was conducted in the absence of any commercial or financial relationships that could be construed as a potential conflict of interest.
Acknowledgments
This work is supported by the National Science Foundation of China (No. 61502167).
References
Amaral, D. G., Schumann, C. M., and Nordahl, C. W. (2008). Neuroanatomy of autism. Trends Neurosci. 31, 137–145. doi: 10.1016/j.tins.2007.12.005
Anderson, J. S., Nielsen, J. A., Froehlich, A. L., DuBray, M. B., Druzgal, T. J., Cariello, A. N., et al. (2011). Functional connectivity magnetic resonance imaging classification of autism. Brain 134, 3742–3754. doi: 10.1093/brain/awr263
Andrews-Hanna, J. R., Reidler, J. S., Sepulcre, J., Poulin, R., and Buckner, R. L. (2010). Functional-anatomic fractionation of the brain's default network. Neuron 65, 550–562. doi: 10.1016/j.neuron.2010.02.005
Aoki, Y., Cortese, S., and Tansella, M. (2015). Neural bases of atypical emotional face processing in autism: a meta-analysis of fMRI studies. World J. Biol. Psychiatry 16, 291–300. doi: 10.3109/15622975.2014.957719
Ashizuka, A., Mima, T., Sawamoto, N., Aso, T., Oishi, N., Sugihara, G., et al. (2015). Functional relevance of the precuneus in verbal politeness. Neurosci. Res. 91, 48–56. doi: 10.1016/j.neures.2014.10.009
Ashwin, C., Baron-Cohen, S., Wheelwright, S., O'Riordan, M., and Bullmore, E. T. (2007). Differential activation of the amygdala and the ‘social brain’ during fearful face-processing in asperger syndrome. Neuropsychologia 45, 2–14. doi: 10.1016/j.neuropsychologia.2006.04.014
Bookheimer, S. Y., Wang, A. T., Scott, A., Sigman, M., and Dapretto, M. (2008). Frontal contributions to face processing differences in autism: evidence from fMRI of inverted face processing. J. Int. Neuropsychol. Soc. 14, 922–932. doi: 10.1017/S135561770808140X
Cavanna, A. E., and Trimble, M. R. (2006). The precuneus: a review of its functional anatomy and behavioural correlates. Brain 129, 564–583. doi: 10.1093/brain/awl004
Chanel, G., Pichon, S., Conty, L., Berthoz, S., Chevallier, C., and Grèzes, J. (2016). Classification of autistic individuals and controls using cross-task characterization of fMRI activity. NeuroImage Clin. 10, 78–88. doi: 10.1016/j.nicl.2015.11.010
Chen, C. P., Keown, C. L., Jahedi, A., Nair, A., Pflieger, M. E., Bailey, B. A., et al. (2015). Diagnostic classification of intrinsic functional connectivity highlights somatosensory, default mode, and visual regions in autism. NeuroImage Clin. 8, 238–245. doi: 10.1016/j.nicl.2015.04.002
Chen, H., Duan, X., Liu, F., Lu, F., Ma, X., Zhang, Y., et al. (2016). Multivariate classification of autism spectrum disorder using frequency-specific resting-state functional connectivity—a multi-center study. Prog. Neuropsychopharmacol. Biol. Psychiatry 64, 1–9. doi: 10.1016/j.pnpbp.2015.06.014
Cheng, W., Rolls, E. T., Zhang, J., Sheng, W., Ma, L., Wan, L., et al. (2017). Functional connectivity decreases in autism in emotion, self, and face circuits identified by knowledge-based enrichment analysis. Neuroimage 148, 169–178. doi: 10.1016/j.neuroimage.2016.12.068
Cooper, R. A., Richter, F. R., Bays, P. M., Plaisted-Grant, K. C., Baron-Cohen, S., and Simons, J. S. (2017). Reduced hippocampal functional connectivity during episodic memory retrieval in autism. Cereb. Cortex 27, 888–902. doi: 10.1093/cercor/bhw417
Crone, J. S., Ladurner, G., Höller, Y., Golaszewski, S., Trinka, E., and Kronbichler, M. (2011). Deactivation of the default mode network as a marker of impaired consciousness: an fMRI study. PLoS ONE 6:e26373. doi: 10.1371/journal.pone.0026373
Cui, Z., Zhao, C., and Gong, G. (2015). Parallel workflow tools to facilitate human brain MRI post-processing. Front. Neurosci. 9:171. doi: 10.3389/fnins.2015.00171
Dennis, E. L., and Thompson, P. M. (2014). Functional brain connectivity using fMRI in aging and Alzheimer's disease. Neuropsychol. Rev. 24, 49–62. doi: 10.1007/s11065-014-9249-6
Dichter, G. S., and Belger, A. (2007). Social stimuli interfere with cognitive control in autism. Neuroimage 35, 1219–1230. doi: 10.1016/j.neuroimage.2006.12.038
Di Martino, A., Yan, C.-G., Li, Q., Denio, E., Castellanos, F. X., Alaerts, K., et al. (2014). The autism brain imaging data exchange: towards large-scale evaluation of the intrinsic brain architecture in autism. Mol. Psychiatry 19, 659. doi: 10.1038/mp.2013.78
Ding, Y., Xie, L., Chang, C. Q., Chen, Z. M., and Ai, H. (2015). Activation of gamma-aminobutyric acid (A) receptor protects hippocampus from intense exercise-induced synapses damage and apoptosis in rats. Chin. Med. J. 128, 2330–2339. doi: 10.4103/0366-6999.163392
Doricchi, F., Macci, E., Silvetti, M., and Macaluso, E. (2010). Neural correlates of the spatial and expectancy components of endogenous and stimulus-driven orienting of attention in the posner task. Cereb. Cortex 20, 1574–1585. doi: 10.1093/cercor/bhp215
Doyle-Thomas, K. A. R., Kushki, A., Duerden, E. G., Taylor, M. J., Lerch, J. P., Soorya, L. V., et al. (2012). The effect of diagnosis, age, and symptom severity on cortical surface area in the cingulate cortex and insula in autism spectrum disorders. J. Child Neurol. 28, 732–739. doi: 10.1177/0883073812451496
Ecker, C., Bookheimer, S. Y., and Murphy, D. G. (2015). Neuroimaging in autism spectrum disorder: brain structure and function across the lifespan. Lancet Neurol. 14, 1121–1134. doi: 10.1016/S1474-4422(15)00050-2
Francis, M. M., Hummer, T. A., Vohs, J. L., Yung, M. G., Liffick, E., Mehdiyoun, N. F., et al. (2016). Functional neuroanatomical correlates of episodic memory impairment in early phase psychosis. Brain Imag. Behav. 10, 1–11. doi: 10.1007/s11682-015-9357-9
Gaffrey, M. S., Kleinhans, N. M., and Haist, F. (2007). A typical participation of visual cortex during word processing in autism: an fMRI study of semantic decision. Neuropsychologia 45, 1672–1684. doi: 10.1016/j.neuropsychologia.2007.01.008
Gori, I., Giuliano, A., Muratori, F., Saviozzi, I., Oliva, P., Tancredi, R., et al. (2015). Gray matter alterations in young children with autism spectrum disorders: comparing morphometry at the voxel and regional level. J. Neuroimag. 25, 866–874. doi: 10.1111/jon.12280
Grèzes, J., Wicker, B., Berthoz, S., and de Gelder, B. (2009). A failure to grasp the affective meaning of actions in autism spectrum disorder subjects. Neuropsychologia 47, 1816–1825. doi: 10.1016/j.neuropsychologia.2009.02.021
Gunn, S. R. (1998). Support vector machines for classification and regression. ISIS Tech. Rep. 14, 85–86.
Hallmayer, J., Cleveland, S., Torres, A., Phillips, J., Cohen, B., Torigoe, T., et al. (2011). Genetic heritability and shared environmental factors among twin pairs with autism. Arch. Gen. Psychiatry 68, 1095–1102. doi: 10.1001/archgenpsychiatry.2011.76
Hamzei, F., Vry, M. S., Saur, D., Glauche, V., Hoeren, M., Mader, I., et al. (2015). The dual-loop model and the human mirror neuron system: an exploratory combined fMRI and DTI study of the inferior frontal gyrus. Cereb. Cortex 26, 2215–2224. doi: 10.1093/cercor/bhv066
Harvey, P.-O., Fossati, P., Pochon, J.-B., Levy, R., LeBastard, G., Lehéricy, S., et al. (2005). Cognitive control and brain resources in major depression: an fMRI study using the n-back task. Neuroimage 26, 860–869. doi: 10.1016/j.neuroimage.2005.02.048
Holroyd, C. B., and McClure, S. M. (2015). Hierarchical control over effortful behavior by rodent medial frontal cortex: a computational model. Psychol. Rev. 122, 54–83. doi: 10.1037/a0038339
Ji, E., Weickert, C. S., Lenroot, R., Kindler, J., Skilleter, A. J., Vercammen, A., et al. (2016). Adjunctive selective estrogen receptor modulator increases neural activity in the hippocampus and inferior frontal gyrus during emotional face recognition in schizophrenia. Transl. Psychiatry 6:e795. doi: 10.1038/tp.2016.59
Jin, Y., Wee, C. Y., Shi, F., Thung, K. H., Ni, D., Yap, P. T., et al. (2015). Identification of infants at high-risk for autism spectrum disorder using multiparameter multiscale white matter connectivity networks. Hum. Brain Mapp. 36, 4880–4896. doi: 10.1002/hbm.22957
Kana, R. K., Keller, T. A., Minshew, N. J., and Just, M. A. (2007). Inhibitory control in high-functioning autism: decreased activation and underconnectivity in inhibition networks. Biol. Psychiatry 62, 198–206. doi: 10.1016/j.biopsych.2006.08.004
Karten, A., and Hirsch, J. (2015). Brief report: anomalous neural deactivations and functional connectivity during receptive language in autism spectrum disorder: a functional MRI study. J. Autism Dev. Disord. 45, 1905–1914. doi: 10.1007/s10803-014-2344-y
Keehn, B., Nair, A., Lincoln, A. J., Townsend, J., and Müller, R. A. (2016). Under-reactive but easily distracted: an fMRI investigation of attentional capture in autism spectrum disorder. Dev. Cogn. Neurosci. 17, 46–56. doi: 10.1016/j.dcn.2015.12.002
Khazaee, A., Ebrahimzadeh, A., and Babajani-Feremi, A. (2015). Identifying patients with Alzheimer's disease using resting-state fMRI and graph theory. Clin. Neurophysiol. 126, 2132–2141. doi: 10.1016/j.clinph.2015.02.060
Khazaee, A., Ebrahimzadeh, A., and Babajani-Feremi, A. (2016). Application of advanced machine learning methods on resting-state fMRI network for identification of mild cognitive impairment and Alzheimer's disease. Brain Imag. Behav. 10, 799–817. doi: 10.1007/s11682-015-9448-7
Khundrakpam, B. S., Lewis, J. D., Kostopoulos, P., Carbonell, F., and Evans, A. C. (2017). Cortical thickness abnormalities in autism spectrum disorders through late childhood, adolescence, and adulthood: a large-scale MRI study. Cereb. Cortex 27, 1721–1731. doi: 10.1093/cercor/bhx038
Kim, S. Y., Choi, U. S., Park, S. Y., Oh, S. H., Yoon, H. W., Koh, Y. J., et al. (2015). Abnormal activation of the social brain network in children with autism spectrum disorder: an FMRI study. Psychiatry Investig. 12, 37–45. doi: 10.4306/pi.2015.12.1.37
Klöppel, S., Abdulkadir, A., Jack, C. R. Jr., Koutsouleris, N., Mourão-Miranda, J., and Vemuri, P. (2012). Diagnostic neuroimaging across diseases. Neuroimage 61, 457–463. doi: 10.1016/j.neuroimage.2011.11.002
Kolling, N., Behrens, T., Wittmann, M. K., and Rushworth, M. (2016). Multiple signals in anterior cingulate cortex. Curr. Opin. Neurobiol. 37, 36–43. doi: 10.1016/j.conb.2015.12.007
Laubach, M., Caetano, M. S., and Narayanan, N. S. (2015). Mistakes were made: neural mechanisms for the adaptive control of action initiation by the medial prefrontal cortex. J. Physiol. Paris 109, 104–117. doi: 10.1016/j.jphysparis.2014.12.001
Li, D., Yang, W., and Wang, S. (2010). Classification of foreign fibers in cotton lint using machine vision and multi-class support vector machine. Comp. Electron. Agric. 74, 274–279. doi: 10.1016/j.compag.2010.09.002
Lou, H. C., Luber, B., Crupain, M., Keenan, J. P., Nowak, M., Kjaer, T. W., et al. (2004). Parietal cortex and representation of the mental Self. Proc. Natl. Acad. Sci. U.S.A. 101, 6827–6832. doi: 10.1073/pnas.0400049101
Luna, B., Minshew, N., Garver, K. E., Lazar, N. A., Thulborn, K. R., and Eddy, W. F. (2002). Neocortical system abnormalities in autism an fMRI study of spatial working memory. Neurology 59, 834–840. doi: 10.1212/WNL.59.6.834
Mackiewicz, K. L., Sarinopoulos, I., Cleven, K. L., and Nitschke, J. B. (2006). The effect of anticipation and the specificity of sex differences for amygdala and hippocampus function in emotional memory. Proc. Nat. Acad. Sci. U.S.A. 103, 14200–14205. doi: 10.1073/pnas.0601648103
Maier, S., Tebartz van Elst, L., Beier, D., Ebert, D., Fangmeier, T., Radtke, M., et al. (2015). Increased hippocampal volumes in adults with high functioning autism spectrum disorder and an IQ>100: a manual morphometric study. Psychiatry Res. Neuroimag. 234, 152–155. doi: 10.1016/j.pscychresns.2015.08.002
Mailo, J., and Tang-Wai, R. (2015). Insight into the precuneus: a novel seizure semiology in a child with epilepsy arising from the right posterior precuneus. Epileptic Disord. 17, 321–327. doi: 10.1684/epd.2015.0759
Maquet, P., Degueldre, C., Delfiore, G., Aerts, J., Péters, J.-M., Luxen, A., et al. (1997). Functional neuroanatomy of human slow wave sleep. J. Neurosci. 17, 2807–2812.
Mujica-Parodi, L. R., Korgaonkar, M., Ravindranath, B., Greenberg, T., Tomasi, D., Wagshul, M., et al. (2009). Limbic dysregulation is associated with lowered heart rate variability and increased trait anxiety in healthy adults. Hum. Brain Mapp. 30, 47–58. doi: 10.1002/hbm.20483
Mwangi, B., Ebmeier, K. P., Matthews, K., and Douglas Steele, J. (2012). Multi-centre diagnostic classification of individual structural neuroimaging scans from patients with major depressive disorder. Brain 135, 1508–1521. doi: 10.1093/brain/aws084
Ochsner, K. N., Silvers, J. A., and Buhle, J. T. (2012). Functional imaging studies of emotion regulation: a synthetic review and evolving model of the cognitive control of emotion. Ann. N. Y. Acad. Sci. 1251, E1–E24. doi: 10.1111/j.1749-6632.2012.06751.x
Odriozola, P., Uddin, L. Q., Lynch, C. J., Kochalka, J., Chen, T., and Menon, V. (2015). Insula response and connectivity during social and non-social attention in children with autism. Soc. Cogn. Affect. Neurosci. 11, 433–444. doi: 10.1093/scan/nsv126
Orrù, G., Pettersson-Yeo, W., Marquand, A. F., Sartori, G., and Mechelli, A. (2012). Using support vector machine to identify imaging biomarkers of neurological and psychiatric disease: a critical review. Neurosci. Biobehav. Rev. 36, 1140–1152. doi: 10.1016/j.neubiorev.2012.01.004
Pessoa, L. (2009). How do emotion and motivation direct executive control? Trends Cogn. Sci. 13, 160–166. doi: 10.1016/j.tics.2009.01.006
Philip, R. C., Dauvermann, M. R., Whalley, H. C., Baynham, K., Lawrie, S. M., and Stanfield, A. C. (2012). A systematic review and meta-analysis of the fMRI investigation of autism spectrum disorders. Neurosci. Biobehav. Rev. 36, 901–942. doi: 10.1016/j.neubiorev.2011.10.008
Philip, R. C., Whalley, H. C., Stanfield, A. C., Sprengelmeyer, R., Santos, I. M., Young, A. W., et al. (2010). Deficits in facial, body movement and vocal emotional processing in autism spectrum disorders. Psychol. Med. 40, 1919–1929. doi: 10.1017/S0033291709992364
Plitt, M., Barnes, K. A., and Martin, A. (2015). Functional connectivity classification of autism identifies highly predictive brain features but falls short of biomarker standards. Neuroimage Clin. 7, 359–366. doi: 10.1016/j.nicl.2014.12.013
Sagaspe, P., Schwartz, S., and Vuilleumier, P. (2011). Fear and stop: a role for the amygdala in motor inhibition by emotional signals. Neuroimage 55, 1825–1835. doi: 10.1016/j.neuroimage.2011.01.027
Schulte-Rüther, M., Greimel, E., Markowitsch, H. J., Kamp-Becker, I., Remschmidt, H., Fink, G. R., et al. (2011). Dysfunctions in brain networks supporting empathy: an fMRI study in adults with autism spectrum disorders. Soc. Neurosci. 6, 1–21. doi: 10.1080/17470911003708032
Shulman, G. L., Astafiev, S. V., Franke, D., Pope, D. L., Snyder, A. Z., McAvoy, M. P., et al. (2009). Interaction of stimulus-driven reorienting and expectation in ventral and dorsal frontoparietal and basal ganglia-cortical networks. J. Neurosci. 29, 4392–4407. doi: 10.1523/JNEUROSCI.5609-08.2009
Silani, G., Bird, G., Brindley, R., Singer, T., Frith, C., and Frith, U. (2008). Levels of emotional awareness and autism: an fMRI study. Soc. Neurosci. 3, 97–112. doi: 10.1080/17470910701577020
Silverman, M. H., Jedd, K., and Luciana, M. (2015). Neural networks involved in adolescent reward processing: an activation likelihood estimation meta-analysis of functional neuroimaging studies. Neuroimage 122, 427–439. doi: 10.1016/j.neuroimage.2015.07.083
Stanfield, A. C., McIntosh, A. M., Spencer, M. D., Philip, R., Gaur, S., and Lawrie, S. M. (2008). Towards a neuroanatomy of autism: a systematic review and meta-analysis of structural magnetic resonance imaging studies. Eur. Psychiatry 23, 289–299. doi: 10.1016/j.eurpsy.2007.05.006
Sundermann, B., Herr, D., Schwindt, W., and Pfleiderer, B. (2014). Multivariate classification of blood oxygen level–dependent fMRI data with diagnostic intention: a clinical perspective. Am. J. Neuroradiol. 35, 848–855. doi: 10.3174/ajnr.A3713
Taylor, S. F., Stern, E. R., and Gehring, W. J. (2007). Neural systems for error monitoring: recent findings and theoretical perspectives. Neuroscientist 13, 160–172. doi: 10.1177/1073858406298184
Tzourio-Mazoyer, N., Landeau, B., Papathanassiou, D., Crivello, F., Etard, O., Delcroix, N., et al. (2002). Automated anatomical labeling of activations in SPM using a macroscopic anatomical parcellation of the MNI MRI single-subject brain. Neuroimage 15, 273–289. doi: 10.1006/nimg.2001.0978
Uddin, L. Q., Menon, V., Young, C. B., Ryali, S., Chen, T., Khouzam, A., et al. (2011). Multivariate searchlight classification of structural magnetic resonance imaging in children and adolescents with autism. Biol. Psychiatry 70, 833–841. doi: 10.1016/j.biopsych.2011.07.014
Vanderhasselt, M.-A., Kühn, S., and De Raedt, R. (2012). ‘Put on your poker face’: neural systems supporting the anticipation for expressive suppression and cognitive reappraisal. Soc. Cogn. Affect. Neurosci. 8, 903–910. doi: 10.1093/scan/nss090
Vanhaudenhuyse, A., Noirhomme, Q., Tshibanda, L. J., Bruno, M.-A., Boveroux, P., Schnakers, C., et al. (2009). Default network connectivity reflects the level of consciousness in non-communicative brain-damaged patients. Brain 133, 161–171. doi: 10.1093/brain/awp313
Verguts, T., Vassena, E., and Silvetti, M. (2015). Adaptive effort investment in cognitive and physical tasks: a neurocomputational model. Front. Behav. Neurosci. 9:57. doi: 10.3389/fnbeh.2015.00057
Via, E., Radua, J., Cardoner, N., Happé, F., and Mataix-Cols, D. (2011). Meta-analysis of gray matter abnormalities in autism spectrum disorder: should asperger disorder be subsumed under a broader umbrella of autistic spectrum disorder? Arch. Gen. Psychiatry 68, 409–418. doi: 10.1001/archgenpsychiatry.2011.27
Walsh, N. D., Williams, S. C., Brammer, M. J., Bullmore, E. T., Kim, J., Suckling, J., et al. (2007). A longitudinal functional magnetic resonance imaging study of verbal working memory in depression after antidepressant therapy. Biol. Psychiatry 62, 1236–1243. doi: 10.1016/j.biopsych.2006.12.022
Yu, K. K., Cheung, C., Chua, S. E., and McAlonan, G. M. (2011). Can Asperger syndrome be distinguished from autism? an anatomic likelihood meta-analysis of mri studies. J. Psychiatry Neurosci. 36, 412–421. doi: 10.1503/jpn.100138
Zhang, Y., Dong, Z., Phillips, P., Wang, S., Ji, G., Yang, J., et al. (2015). Detection of subjects and brain regions related to Alzheimer's disease using 3D MRI scans based on eigenbrain and machine learning. Front. Comput. Neurosci. 9:66. doi: 10.3389/fncom.2015.00066
Keywords: random support vector machine cluster, neuroimaging, autism spectrum disorder, classification, feature selection
Citation: Bi X, Wang Y, Shu Q, Sun Q and Xu Q (2018) Classification of Autism Spectrum Disorder Using Random Support Vector Machine Cluster. Front. Genet. 9:18. doi: 10.3389/fgene.2018.00018
Received: 16 November 2017; Accepted: 15 January 2018;
Published: 06 February 2018.
Edited by:
Quanxin Zhu, Nanjing Normal University, ChinaCopyright © 2018 Bi, Wang, Shu, Sun and Xu. This is an open-access article distributed under the terms of the Creative Commons Attribution License (CC BY). The use, distribution or reproduction in other forums is permitted, provided the original author(s) and the copyright owner are credited and that the original publication in this journal is cited, in accordance with accepted academic practice. No use, distribution or reproduction is permitted which does not comply with these terms.
*Correspondence: Xia-an Bi, bixiaan@hnu.edu.cn