 Marit de Jong1
 Sanne A. E. Peters1,2,3
 Rianneke de Ritter4,5Carla J. H. van der Kallen4,5
 Simone J. S. Sep4,5,6Mark Woodward2,3,7Coen D. A. Stehouwer4,5Michiel L. Bots1
 Rimke C. Vos1,8*
- 1Julius Center for Health Sciences and Primary Care, University Medical Center Utrecht, Utrecht University, Utrecht, Netherlands
- 2The George Institute for Global Health, Imperial College London, London, United Kingdom
- 3The George Institute for Global Health, University of New South Wales, Sydney, NSW, Australia
- 4Department of Internal Medicine, Maastricht University Medical Center, Maastricht, Netherlands
- 5CARIM Cardiovascular Research Institute Maastricht, Maastricht University, Maastricht, Netherlands
- 6Centre of Expertise in Rehabilitation and Audiology, Adelante, Hoensbroek, Netherlands
- 7Department of Epidemiology, Johns Hopkins University, Baltimore, MD, United States
- 8Department Public Health and Primary Care / LUMC-Campus The Hagua, Leiden University Medical Center, Hague, Netherlands
Background: Insight in sex disparities in the detection of cardiovascular risk factors and diabetes-related complications may improve diabetes care. The aim of this systematic review is to study whether sex disparities exist in the assessment of cardiovascular risk factors and screening for diabetes-related complications.
Methods: PubMed was systematically searched up to April 2020, followed by manual reference screening and citations checks (snowballing) using Google Scholar. Observational studies were included if they reported on the assessment of cardiovascular risk factors (HbA1c, lipids, blood pressure, smoking status, or BMI) and/or screening for nephropathy, retinopathy, or performance of feet examinations, in men and women with diabetes separately. Studies adjusting their analyses for at least age, or when age was considered as a covariable but left out from the final analyses for various reasons (i.e. backward selection), were included for qualitative analyses. No meta-analyses were planned because substantial heterogeneity between studies was expected. A modified Newcastle-Ottawa Quality Assessment Scale for cohort studies was used to assess risk of bias.
Results: Overall, 81 studies were included. The majority of the included studies were from Europe or North America (84%).The number of individuals per study ranged from 200 to 3,135,019 and data were extracted from various data sources in a variety of settings. Screening rates varied considerably across studies. For example, screening rates for retinopathy ranged from 13% to 90%, with half the studies reporting screening rates less than 50%. Mixed findings were found regarding the presence, magnitude, and direction of sex disparities with regard to the assessment of cardiovascular risk factors and screening for diabetes-related complications, with some evidence suggesting that women, compared with men, may be more likely to receive retinopathy screening and less likely to receive foot exams.
Conclusion: Overall, no consistent pattern favoring men or women was found with regard to the assessment of cardiovascular risk factors and screening for diabetes-related complications, and screening rates can be improved for both sexes.
Introduction
In 2019, an estimated 463 million adults aged between 20 and 79 years had diabetes, affecting 9.0% of women and 9.6% of men globally. Cardiovascular diseases (CVD) are one of the most common complications of diabetes, with individuals with diabetes being two to three times more likely to develop CVD compared to those without diabetes (1). Other common diabetes-related complications include diabetic nephropathy, retinopathy, neuropathy, certain cancers, physical and cognitive impairment, depression and several types of infectious diseases (1, 2).
Although incidence rates of major CVD have been reported to be higher in men than women with and without diabetes (3, 4), there is a growing body of evidence showing that the relative risk of major cardiovascular complications conferred by diabetes is larger in women than men (2–8). Several large studies have shown that the relative risk of ischemic heart disease conferred by diabetes can be up to 50% higher in women than men (3, 5, 8). A sex differential in the consequence of diabetes has also been reported for stroke, where the relative risk of stroke was 27% higher among women than men (6). Less is known about sex differences in the effects of diabetes on microvascular complications. A meta-analysis has demonstrated that diabetes confers a 19% higher relative risk of vascular dementia in women than men (9). Sex differences have also been shown for end-stage renal disease, but not for chronic kidney disease (10).
Underlying mechanisms that explain the higher excess risk of (vascular) complications, conferred by diabetes, in women remain uncertain but may include sex disparities in the uptake and provision of healthcare (2). Currently, many guidelines on diabetes management exist. These evidence-based guidelines provide similar recommendations for both sexes on the assessment of risk factors and screening for diabetes-related complications. Therefore, throughout this systematic review, the term “disparity” will be explicitly used to refer to differences in risk factor assessment and screening for cardiovascular risk factors between men and women.
More insight in sex disparities concerning the uptake and provision of diabetes management may eventually result in more personalized diabetes care, thereby helping to further diminish the burden in both sexes. We conducted a systematic review to study whether sex disparities exist in the assessment of cardiovascular risk factors and screening for diabetes-related complications among people with diabetes.
Methods
The protocol of this study was registered at the international prospective register of systematic reviews (PROSPERO) registry (registration number: CRD42018104414). We performed this review according to the guidelines of the preferred reporting items for systematic reviews and meta-analyses (PRISMA) (11).
Search Strategy and Study Selection
Observational studies (including before-after studies) on the assessment of cardiovascular risk factors (HbA1c, lipids, blood pressure, BMI, and smoking status), and screening for complications (retinopathy, nephropathy, and foot ulcerations/deformities/sensory decline), in men and women with diabetes, were identified through systematically searching PubMed (1/1/2009 up to April 2020) (Supplemental Table I). After having identified a set of eligible studies using our search strategy, we performed manual reference and citation screening (snowballing) using Google Scholar. This method has previously been described as a good alternative to database searches once a number of eligible studies have been identified (12). Studies were included if data on the assessment of cardiovascular risk factors or screening for diabetes-related complications were provided separately for men and women. Studies presenting insufficient information about the effect size or direction of sex disparities were excluded (i.e. studies only presenting p-values). Only full-text articles written in English or Dutch were considered eligible for inclusion. Studies also including individuals without diabetes were eligible if results for individuals with diabetes were presented separately. Studies on gestational diabetes were excluded, as well as studies on which data on risk factor assessment were only adjusted for, rather than analyzed by, sex. Furthermore, studies primarily focusing on children or adolescents were excluded.
Outcomes
The outcomes of interest were; assessment of HbA1c, lipids, blood pressure, smoking status, and BMI, screening for nephropathy, retinopathy, and performance of foot examinations, or any combination, all reported as binary variables (yes vs. no). For all outcomes of interest, we used “assessment of cardiovascular risk factors” and “screening for complications” as defined by the original article. When studies showed multiple outcome definitions, we chose the one closest to (inter)national guidelines.
Data Collection and Management
Data extraction was performed by one author (MJ) and checked by a second author (RV). Any discrepancies between the authors during data collection were discussed with a third author (SP). The extracted data comprised: authors’ names and year of publication, country, study period, number of participants (% women), age, reported outcomes (including measures of association with corresponding confidence intervals (CIs)), and data source (Supplemental Table II).
Quality Assessment
The methodological quality of the included studies was assessed by one author (MJ) and checked by a second author (RV), using a modified Newcastle-Ottawa Quality Assessment Scale for cohort studies (13). The modified scale includes six items under three categories: selection, comparability and outcome. Any discrepancies were discussed with a third author (SP).
Data Synthesis and Analyses
It was decided beforehand not to perform any meta-analyses due to the expected heterogeneity between the included studies. Qualitative analyses were restricted to studies adjusting their analyses for age or when age was considered as an important covariable but left out from the final analyses for various reasons (i.e. backward selection). Studies only presenting crude numbers and percentages or unadjusted results are presented in Supplemental Table III. Where reports with overlapping study populations were found and similar outcomes of interest were studied, the study presenting data from the most recent study period or the study with most participants was included. Similarly, where studies were repeated over time, only studies with the most recent data or largest number of study participants were included. For example, the UK National Diabetes Audit is repeated every year and only data from the most recent report relevant for the outcomes of interest were extracted. Characteristics of the studies excluded from qualitative analyses are shown in Supplemental Table IV.
The results are presented as odds ratios (ORs) or risk ratios (RRs) with 95% CIs, with men as the reference category, unless otherwise specified. When studies only reported stratified results, e.g. by age group, ORs/RRs and the 95% CIs in each stratum were summarized using a fixed effect model. For studies that stratified the results by year, with potential overlap of included participants between strata, results from the most recent year were extracted. If studies presented multiple models, only the most extensive adjusted models were extracted. Forest plots without pooled effects were used to visualize the adjusted estimates and corresponding CIs across studies included for qualitative analysis.
Results
Overall, 81 studies were included for qualitative analyses (14–92) (Figure 1). Characteristics of the included studies are presented in Supplemental Table II. The majority of studies were from Europe or Northern America (37% and 47% respectively), eight from Asia, two from Oceania, one from Africa, and one from South America. Of the 81 studies, 55 (68%) reported data on individuals with diabetes (without specifying the subtype), and 24 (30%) on individuals with type 2 diabetes. In addition, two reports from the UK National Diabetes Audit reported data on individuals stratified by diabetes subtype. Given that no other reports presented data on individuals with type 1 diabetes, only data from individuals with type 2 diabetes were extracted from the two reports. The number of included individuals per study ranged from 200 to 3,135,019. Data were extracted from various data sources (i.e. (population-based) surveys, medical records and administrative claims data) in a variety of settings, including primary care, outpatient clinics, and hospital settings.
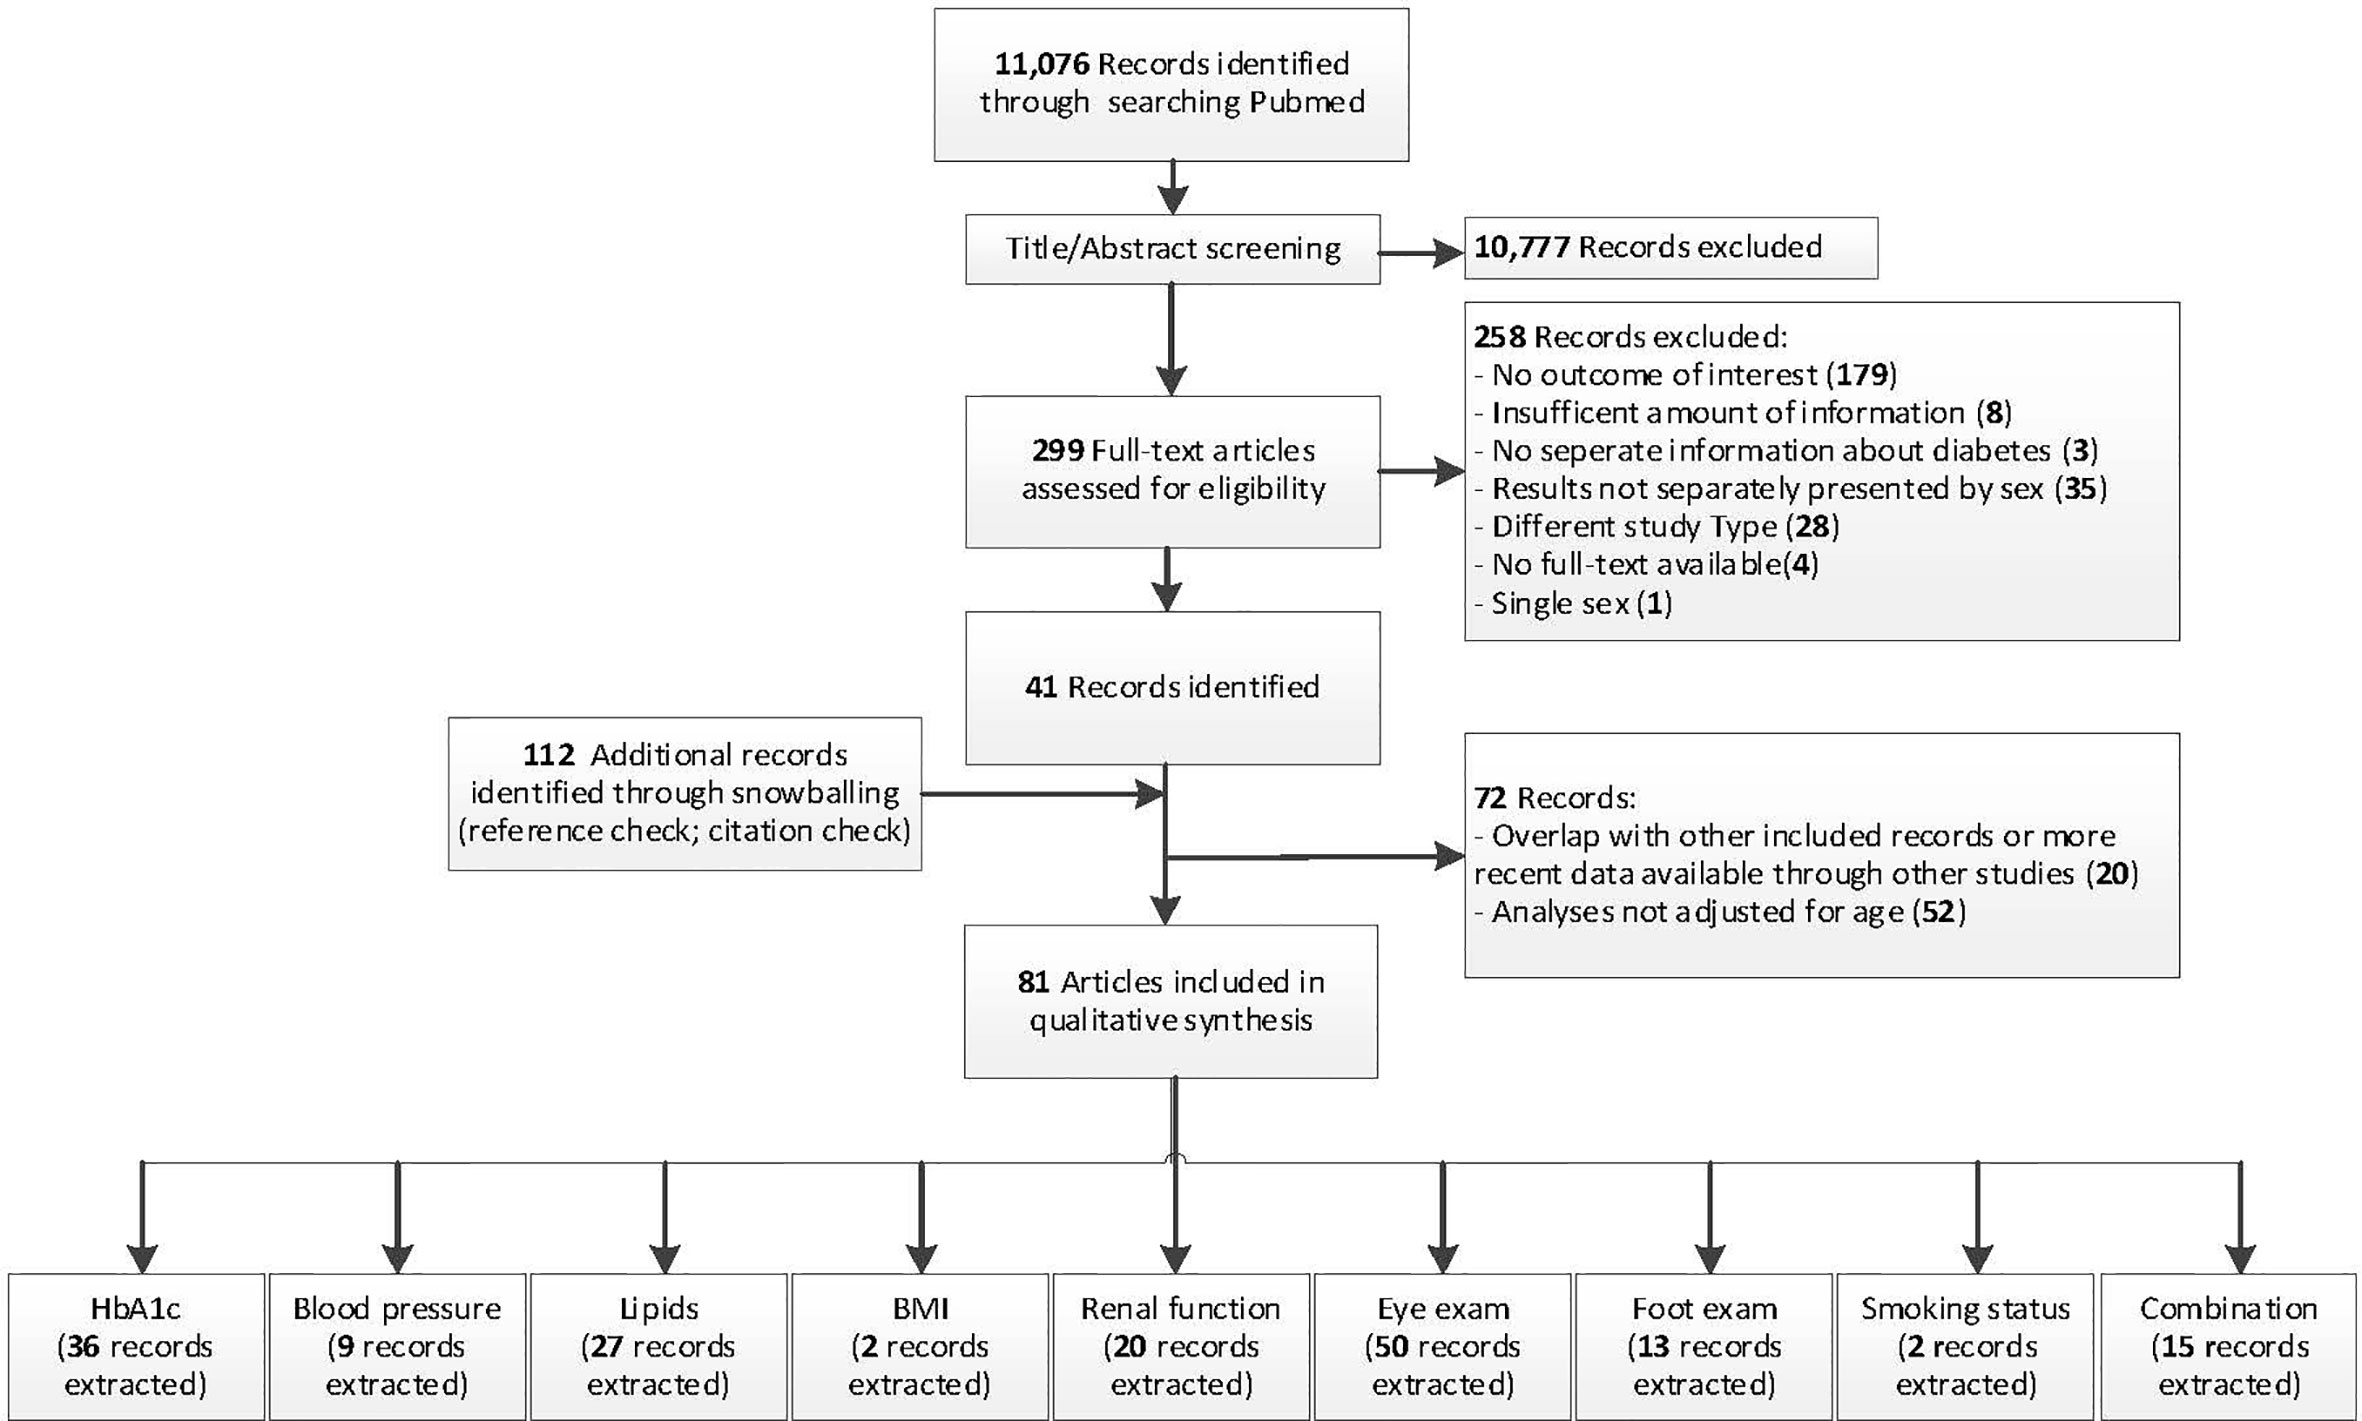
Figure 1 Flowchart of study selection. PubMed search was used to obtain a suitable start set for snowballing.
Risk of Bias
The risk of bias was moderate with 78% of studies showing either fair or good study quality with clearly reported information about study design, in- and exclusion criteria, data collection, and assessment of the outcome. Although most studies included a representative sample, there was considerable heterogeneity between studies with regard to the study populations making it more challenging to score this aspect (Supplemental Table IV).
Assessment of HbA1c
In total, 36 studies, including 6.6 million individuals, were included with median assessment rates of 74% in women and 73% in men. Most studies showed no statistically significant sex disparities in the assessment of HbA1c (70%), while 19% showed that women were more often receiving assessment of HbA1c than men, and 11% showed that men were more often receiving assessment of HbA1c than women (Figure 2).
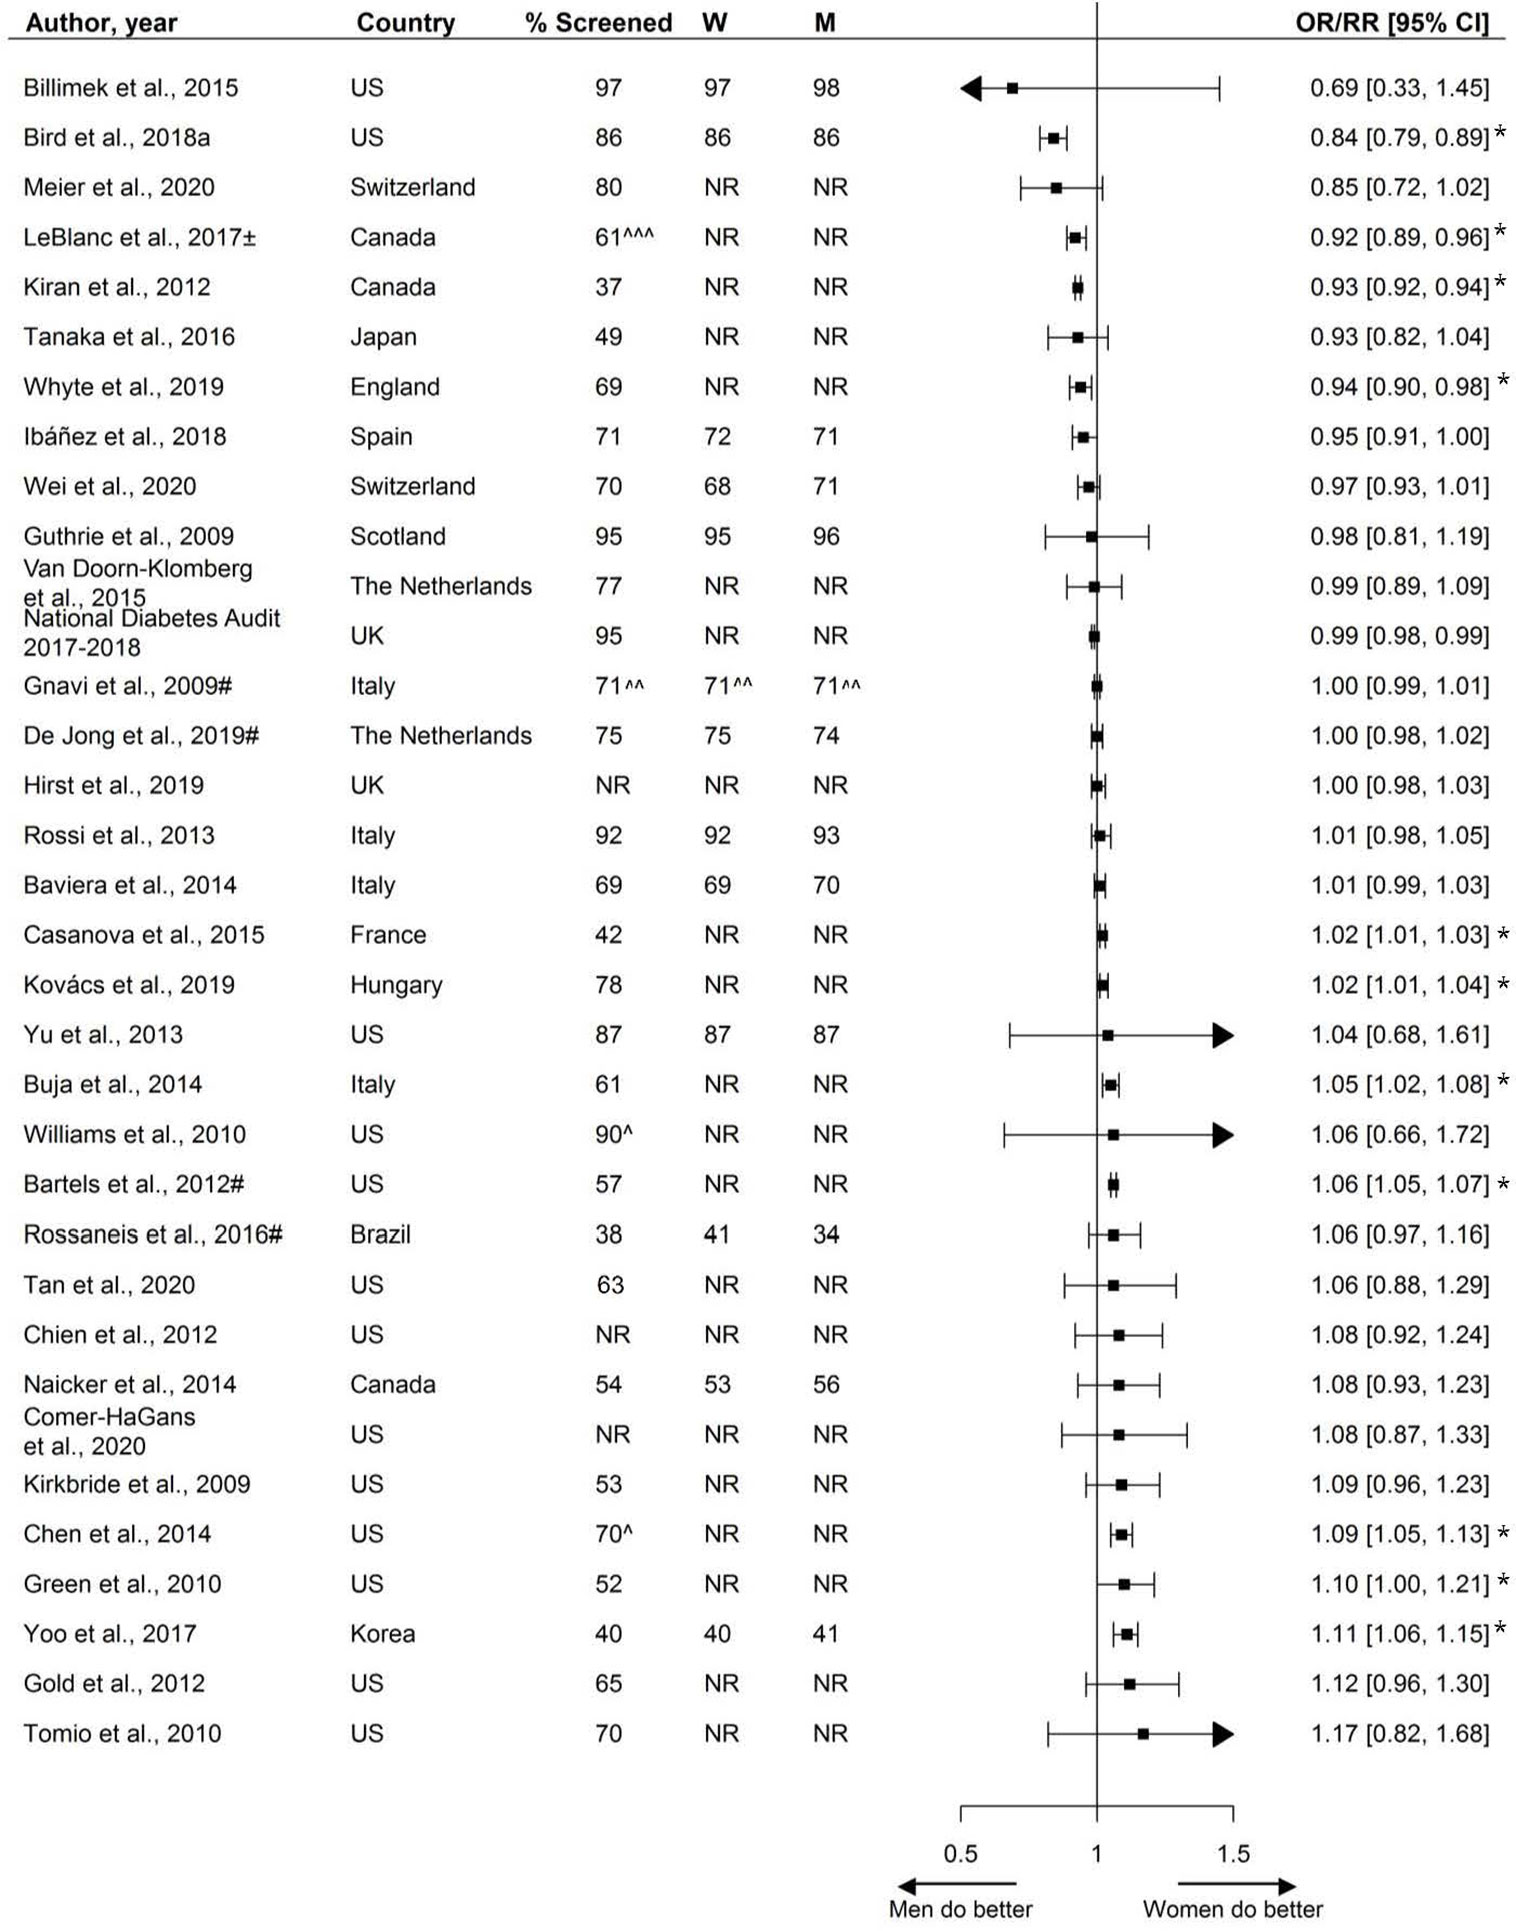
Figure 2 Assessment of HbA1c, expressed as adjusted odds ratios (OR) or relative risks (RR) with corresponding 95% confidence intervals (CI). Two studies are not presented in this figure because of their measure of association: Swietek et al. (33): Average Marginal Effect, (SE; p-value): −0.00031 (−0.0044; >0.05), Du et al. (92): Prevalence difference (95% CI): 3.5 (−1.0;8.0). W = % of screened women; M = % of screened men; US, United States; UK, United Kingdom; ± = 99% CI; # = Relative risk; ^ Weighted %; ^^ = Kaplan-Meyer estimates; ^^^ = Estimated %; * = statistically significant. Men = reference.
Assessment of Blood Pressure
The assessment of blood pressure, by sex, was reported by nine studies including 3.7 million individuals. Median assessment rate across studies was 79% (range 48% - 98%). Sex-specific percentages of blood pressure assessment were reported by three studies, ranging from 78% to 94% in women and 77% to 96% in men. Five studies showed no statistically significant disparities in the assessment of blood pressure, while three studies showed that women were more likely to receive blood pressure screening and one study reported men being more likely to receive blood pressure screening (Figure 3).
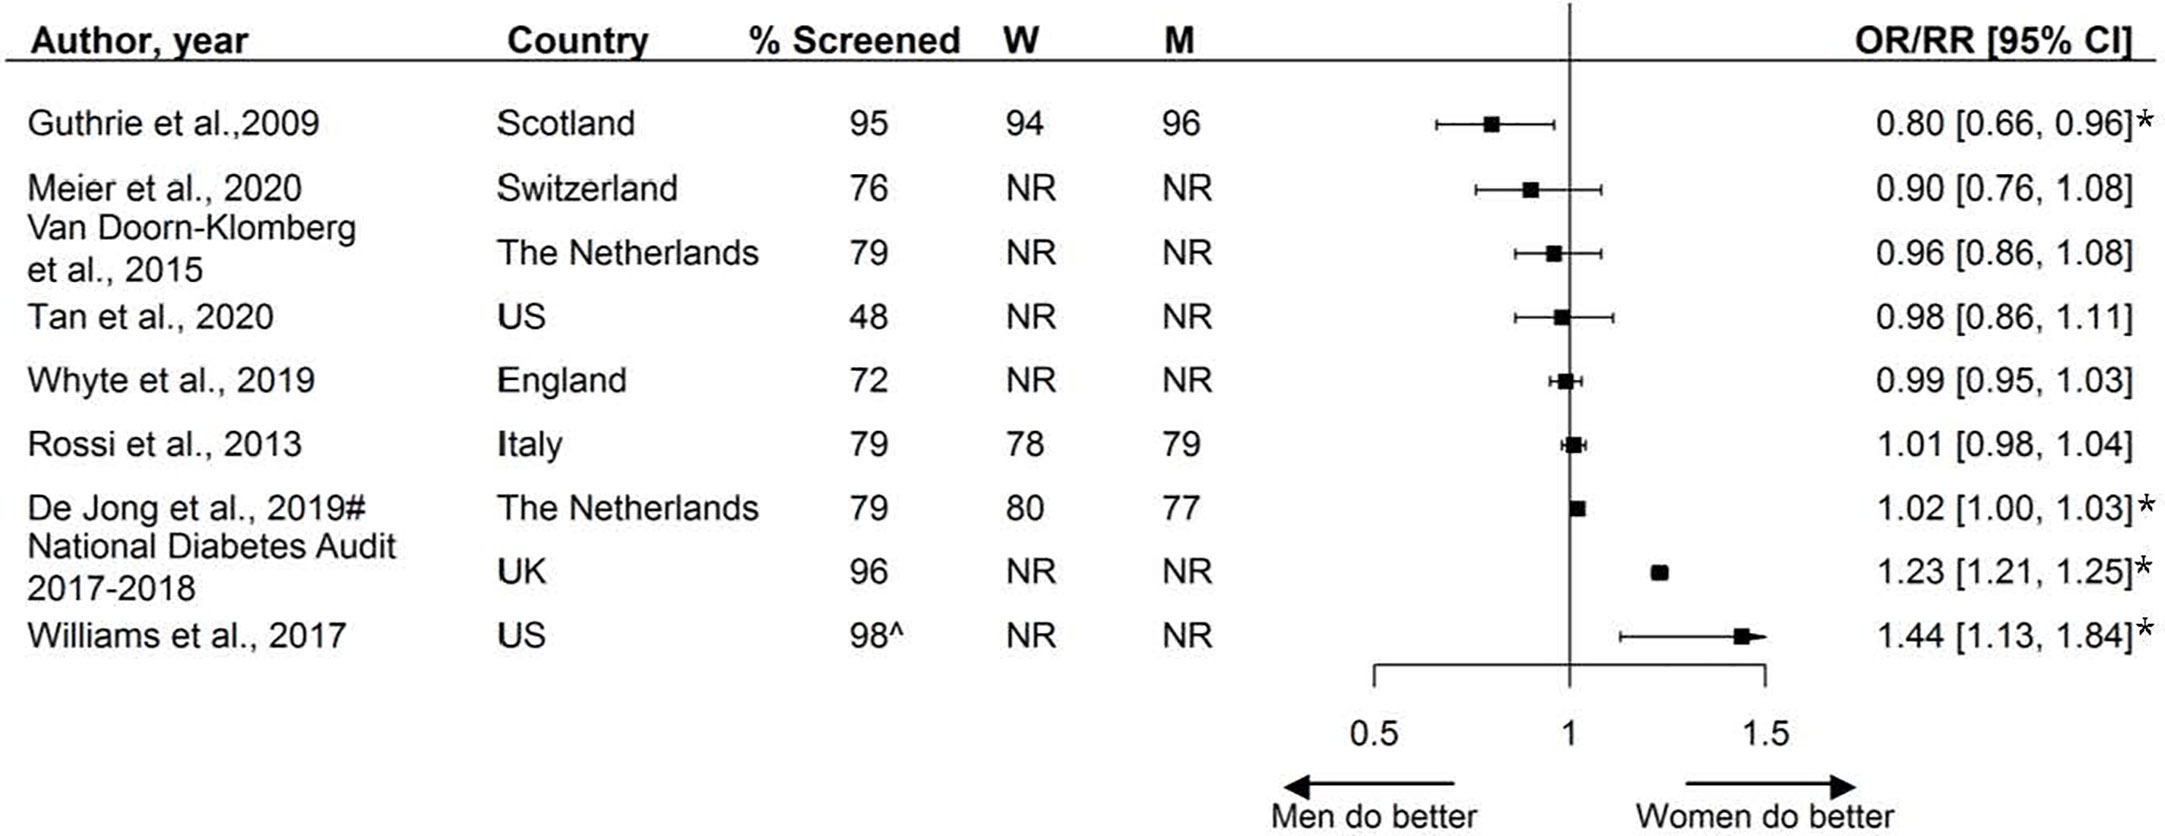
Figure 3 Assessment of blood pressure, expressed as adjusted odds ratios (OR) or relative risks (RR) with corresponding 95% confidence intervals (CI). W = % of screened women; M = % of screened men; US, United States; UK, United Kingdom; # = Relative risk; ^ Assumed to be weighted %; * = statistically significant. Men = reference.
Assessment of Lipids
The assessment of lipids, by sex, was reported by 27 studies, including 5.4 million individuals. These studies reported on various lipid measurements, including the assessment of LDL, HDL, lipid profile, (total) cholesterol, HDL/TC-ratio, and triglycerides. Among the fifteen studies reporting the assessment of either lipids or (total) cholesterol, assessment rates ranged from 40% to 96%, with a median of 73%.
Over half the studies (8/15) reported no statistically significant or only small sex disparities, while four studies reported that, compared with men, women were less likely to receive screening, and three studies showed that women were more likely to receive screening.
Twelve studies, including data from 829,819 individuals, reported sex-specific assessment of LDL. Five studies reported that women were less likely to receive screening, four studies reported that women were more likely to receive screening than men, and the remaining three studies showed no sex disparities.
Two studies investigated sex disparities in the assessment of HDL measurements, with one reporting that women were more likely to receive screening.
One study reported on the assessment of triglycerides, showing that women were less likely to receive screening than their male counterparts (Figure 4).
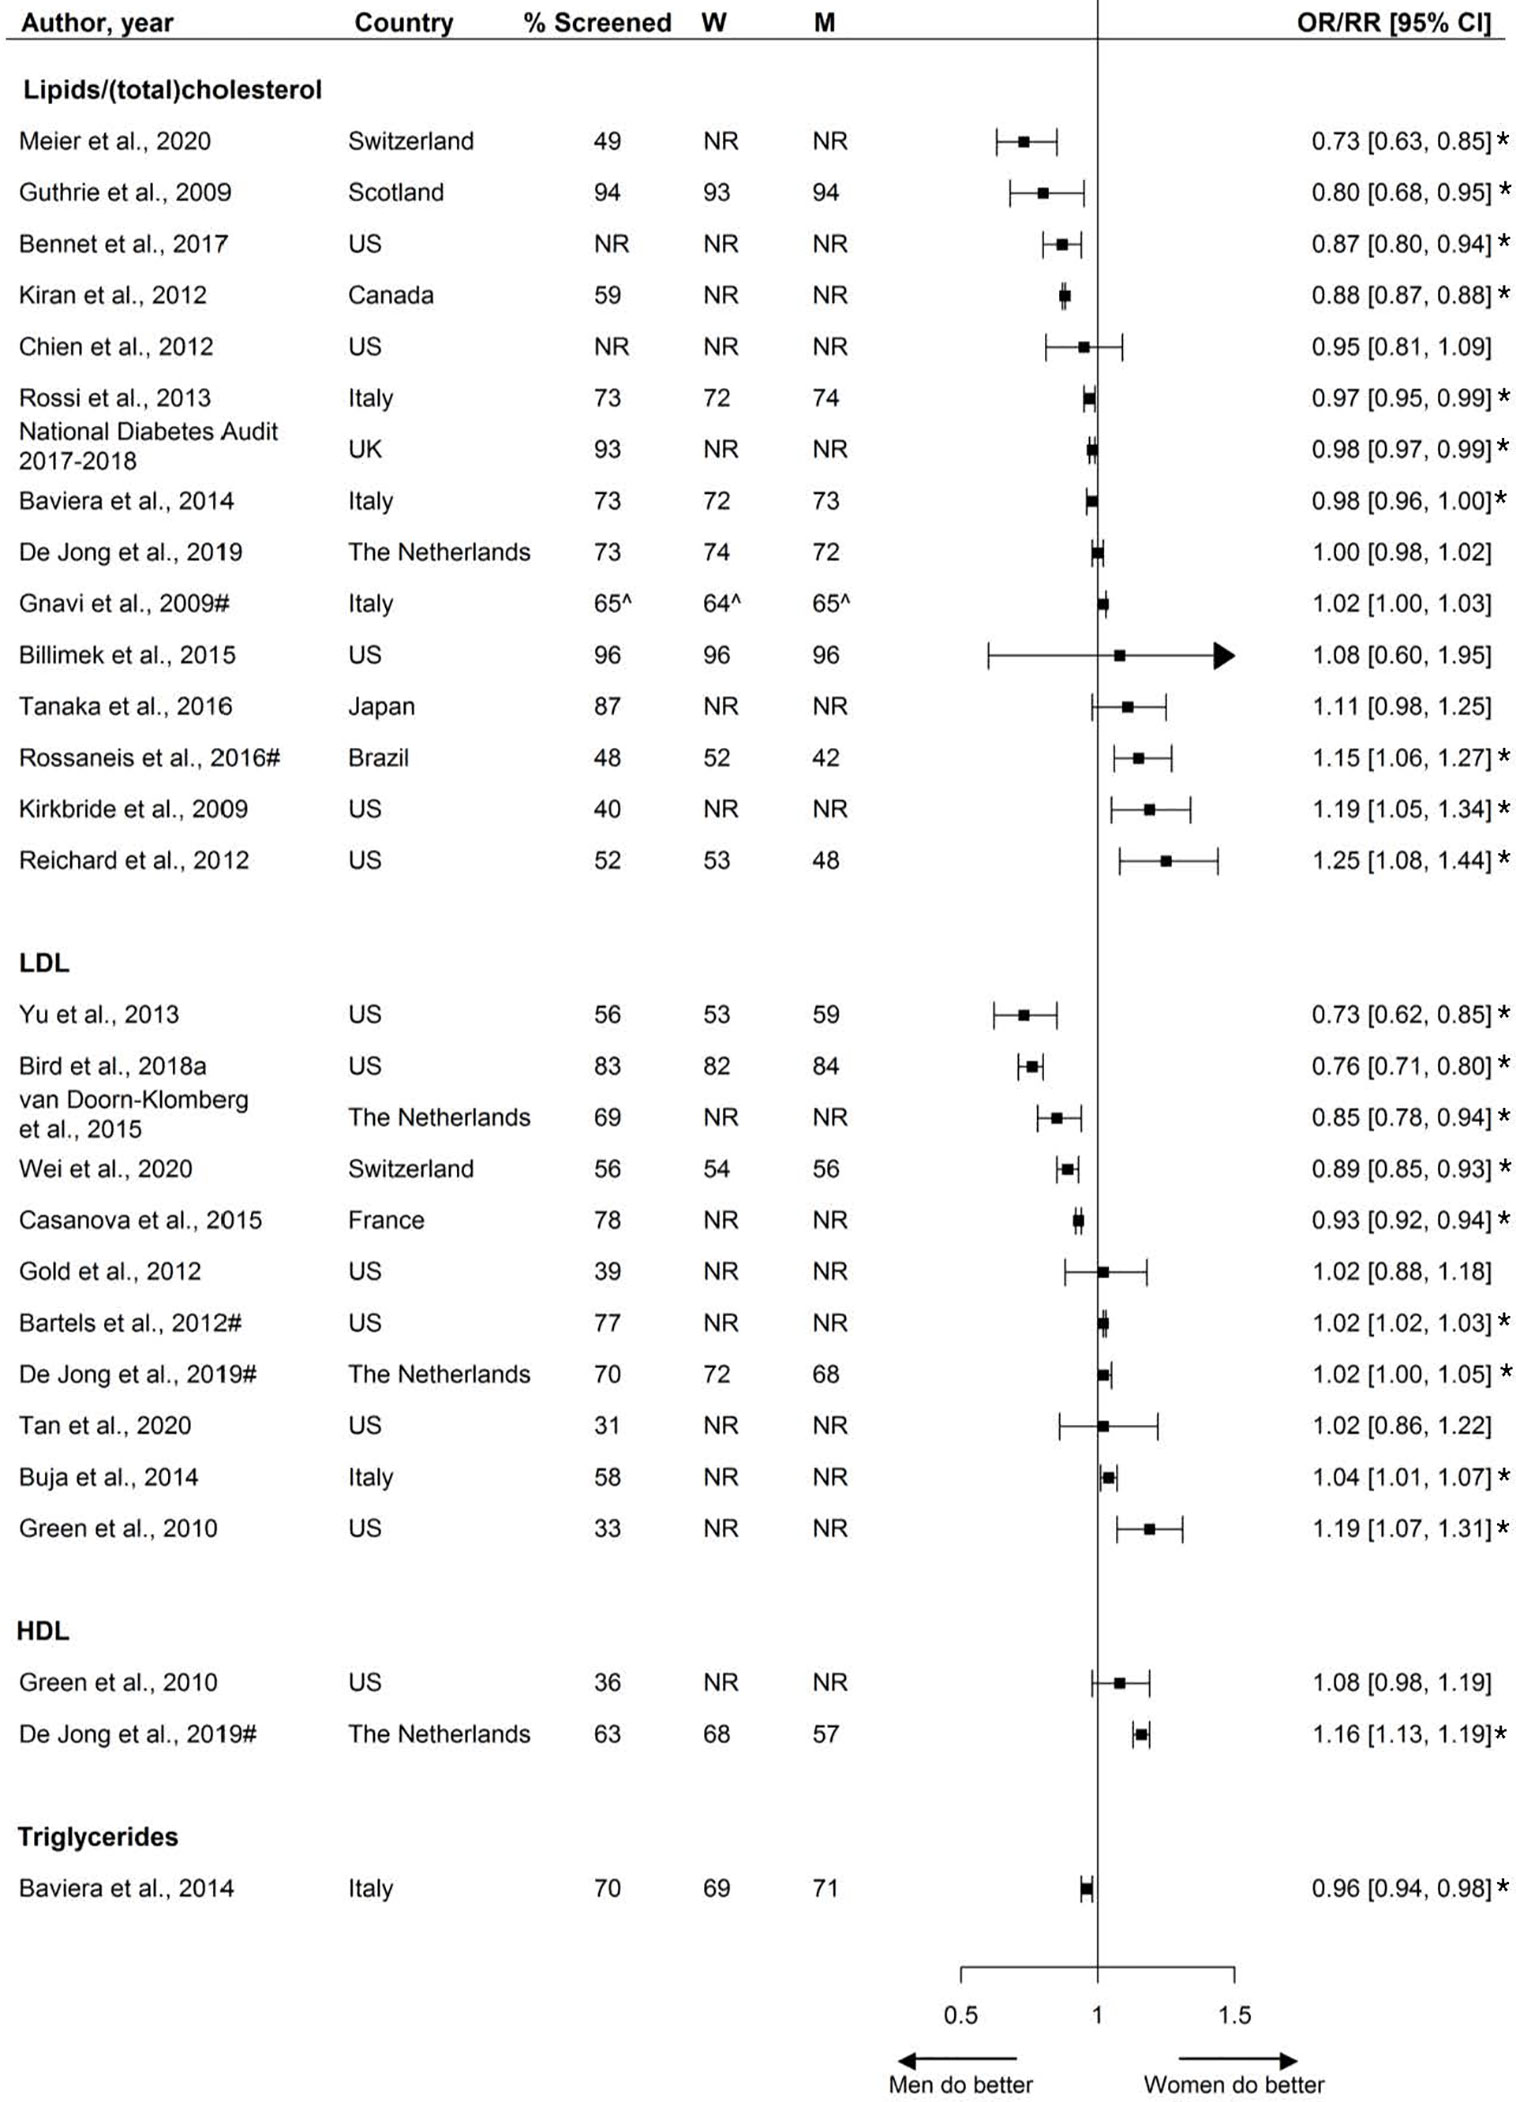
Figure 4 Assessment of lipids, expressed as adjusted odds ratios (OR) or relative risks (RR) with corresponding 95% confidence intervals (CI). One study is not presented in this figure because of the measure of association: Swietek et al. (33): Average Marginal Effect (LDL), (SE; p-value): 0.0045 (−0.0042; >0.05). W = % of screened women; M = % of screened men; US, United States; UK, United Kingdom; # = Relative risk; ^ = Kaplan-Meyer estimates; * = statistically significant. Men = reference.
Assessment of BMI
Two studies reported sex-specific BMI assessment; one study found that women were less likely to receive screening and the other found no sex differences (Figure 5).
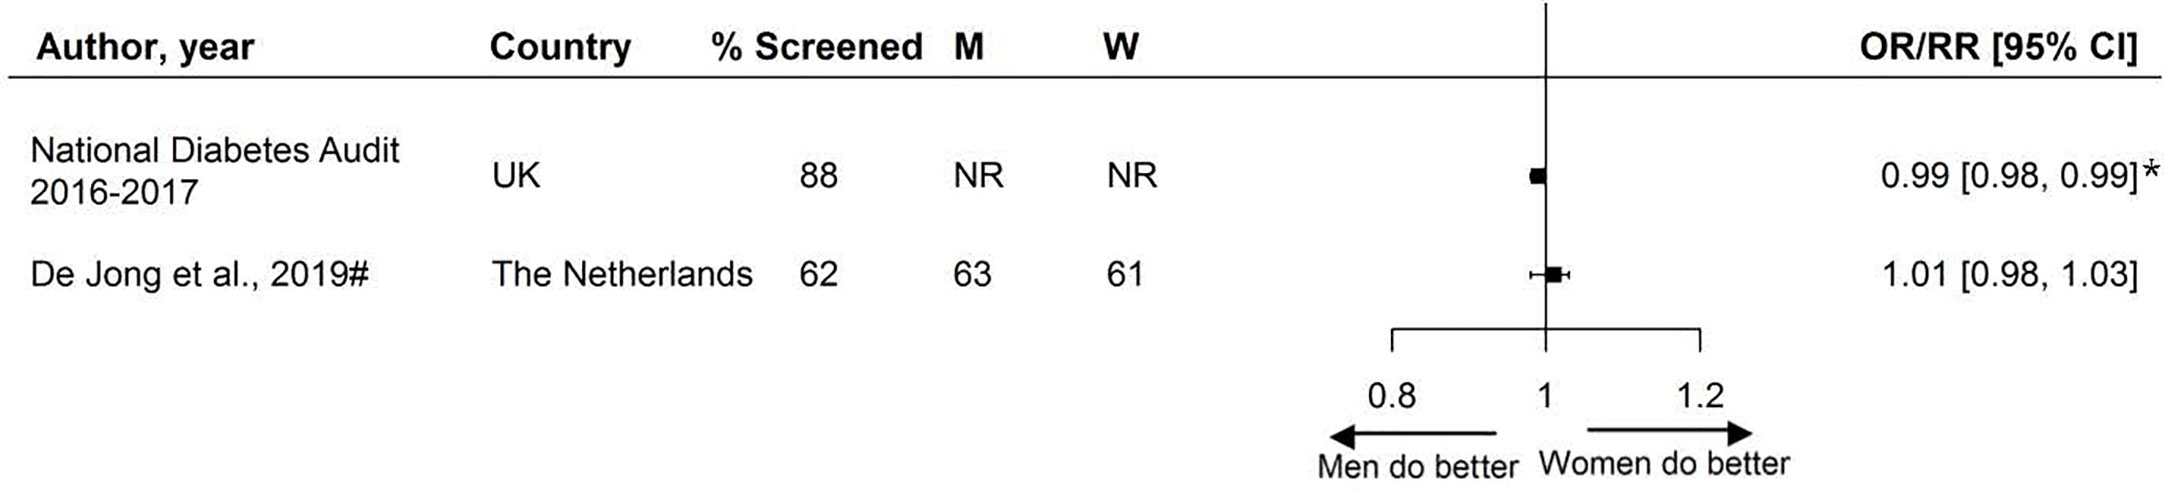
Figure 5 Assessment of BMI, expressed as adjusted odds ratios (OR) or relative risks (RR) with corresponding 95% confidence intervals (CI). W = % of screened women; M = % of screened men; UK, United Kingdom; # = Relative risk. Men = reference. * = statistically significant.
Nephropathy Screening
Twenty studies, including 3.9 million individuals, examined sex disparities in nephropathy screening. These studies reported on various measures to assess renal function, including estimated glomerular filtration rate (eGFR), microalbuminuria, urine albumin, albumin/creatinine ration, and serum creatinine. Two-thirds of studies reported screening rates less than 70%. Overall, there was no consistent pattern in nephropathy screening favoring either women or men (Figure 6).
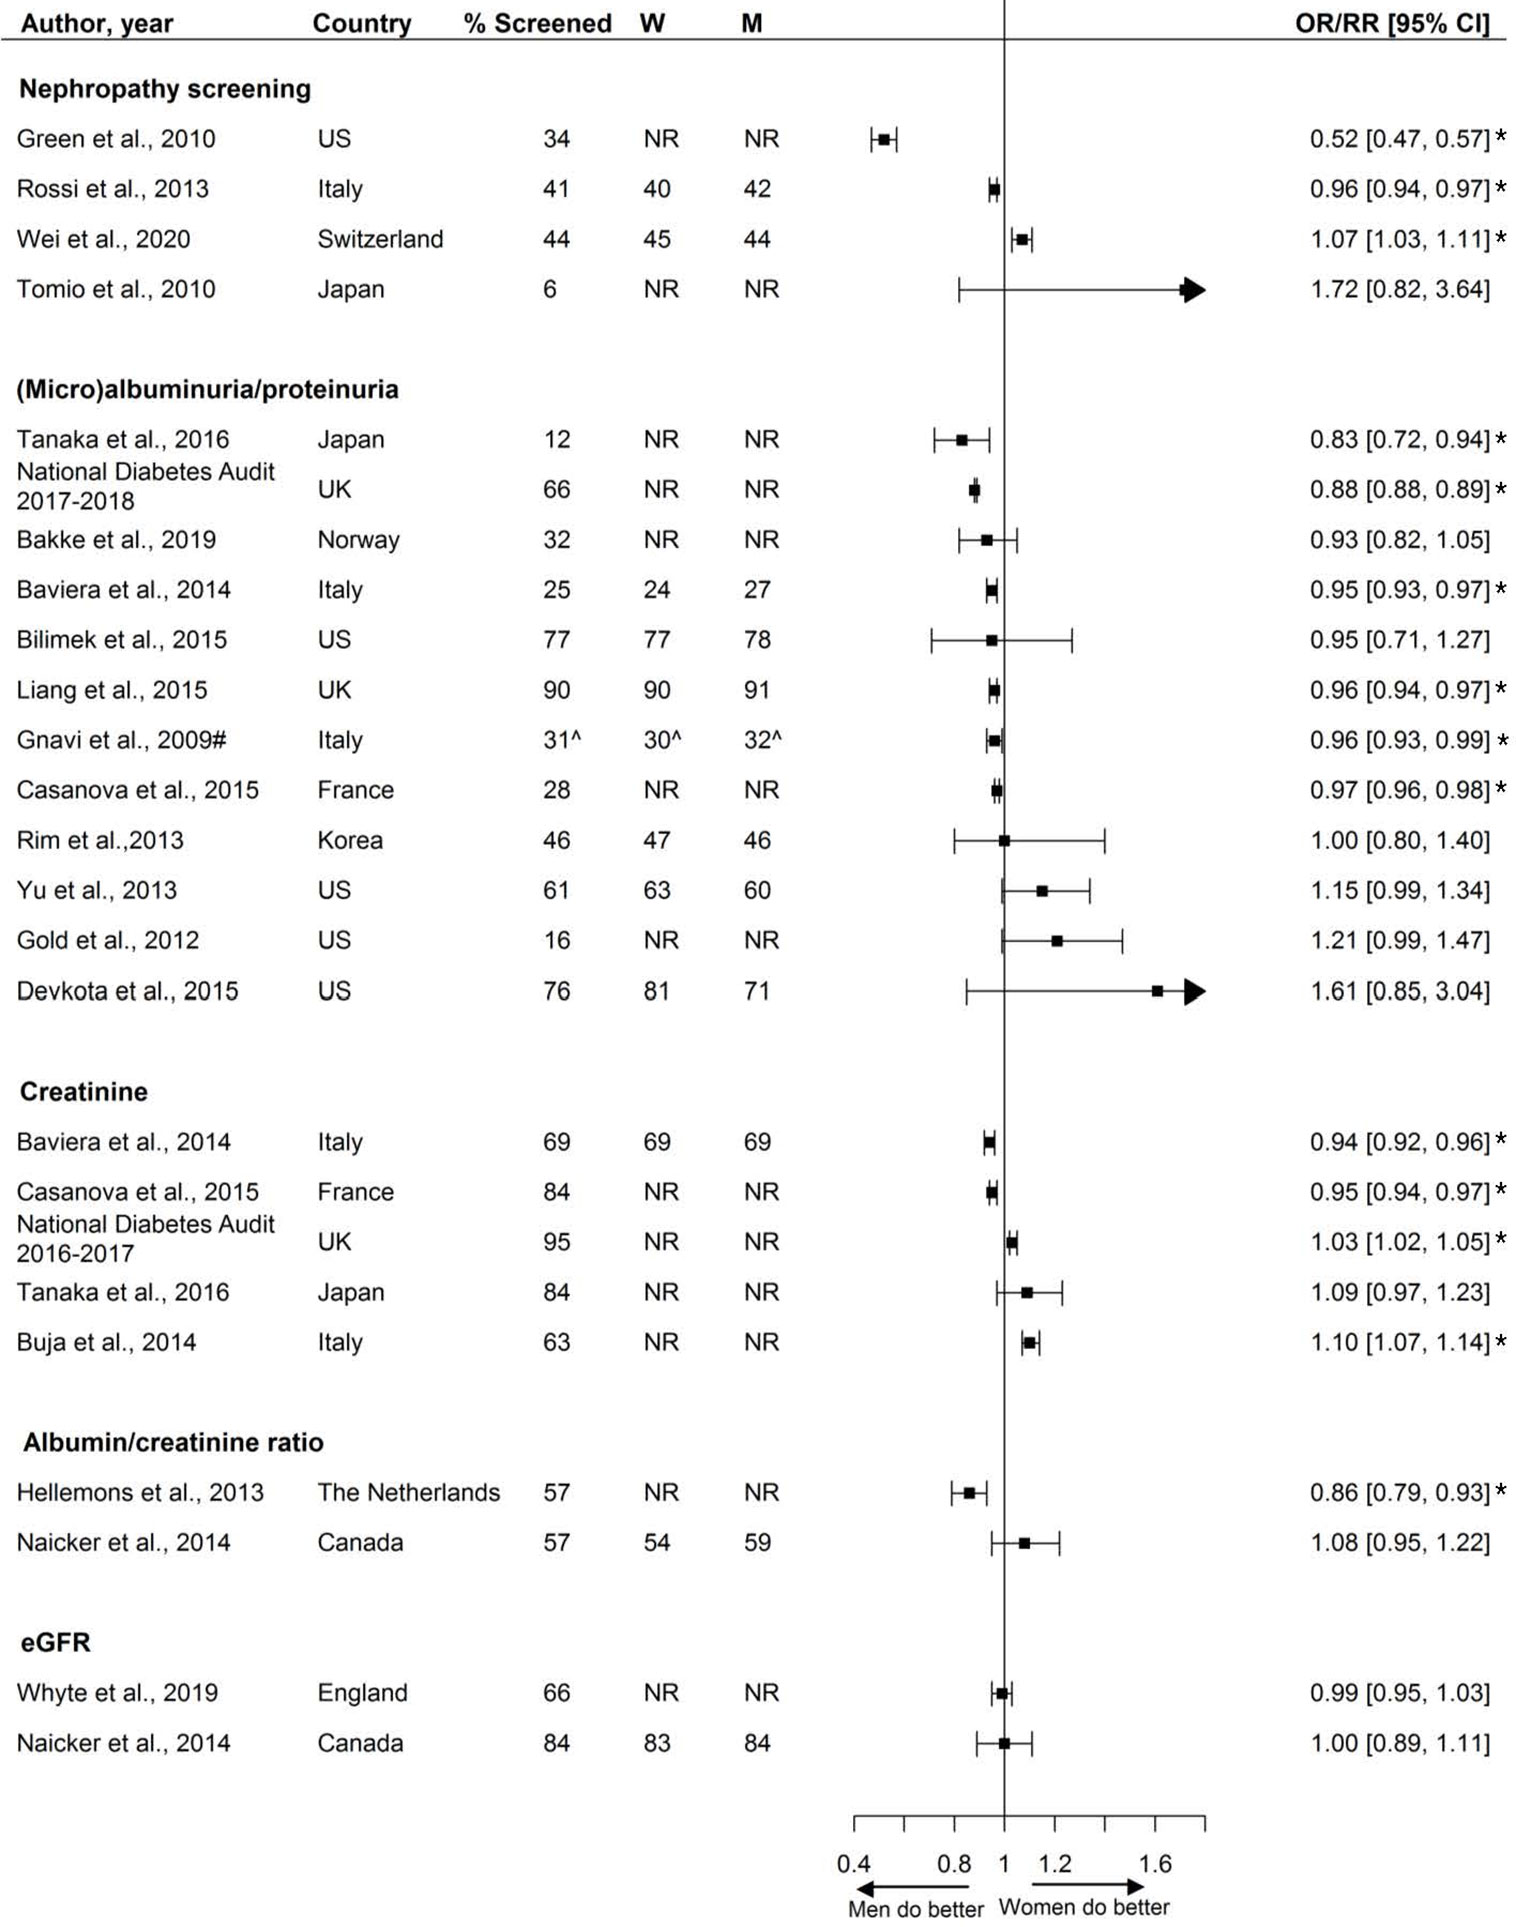
Figure 6 Nephropathy screening, expressed as adjusted odds ratios (OR) or relative risks (RR) with corresponding 95% confidence intervals (CI). One study is not presented in this figure because of the measure of association: Swietek et al. (33): Average Marginal Effect, (SE; p-value): −0.0073 (−0.0042; <0.05 (women less likely to receive screening). W = % of screened women; M = % of screened men; US, United States; UK, United Kingdom; # = Relative risk; ^ = Kaplan-Meyer estimate. Men = reference. * = statistically significant.
Retinopathy Screening
Fifty studies, including 3.4 million individuals, reported on retinopathy screening. Screening rates ranged from 13% to 90% across studies, with nearly half the studies reporting screening rates equal to or less than 50%. Five studies reported that women were less likely to receive retinopathy screening than men and 22 studies showed that women were more likely to receive screening (Figure 7).
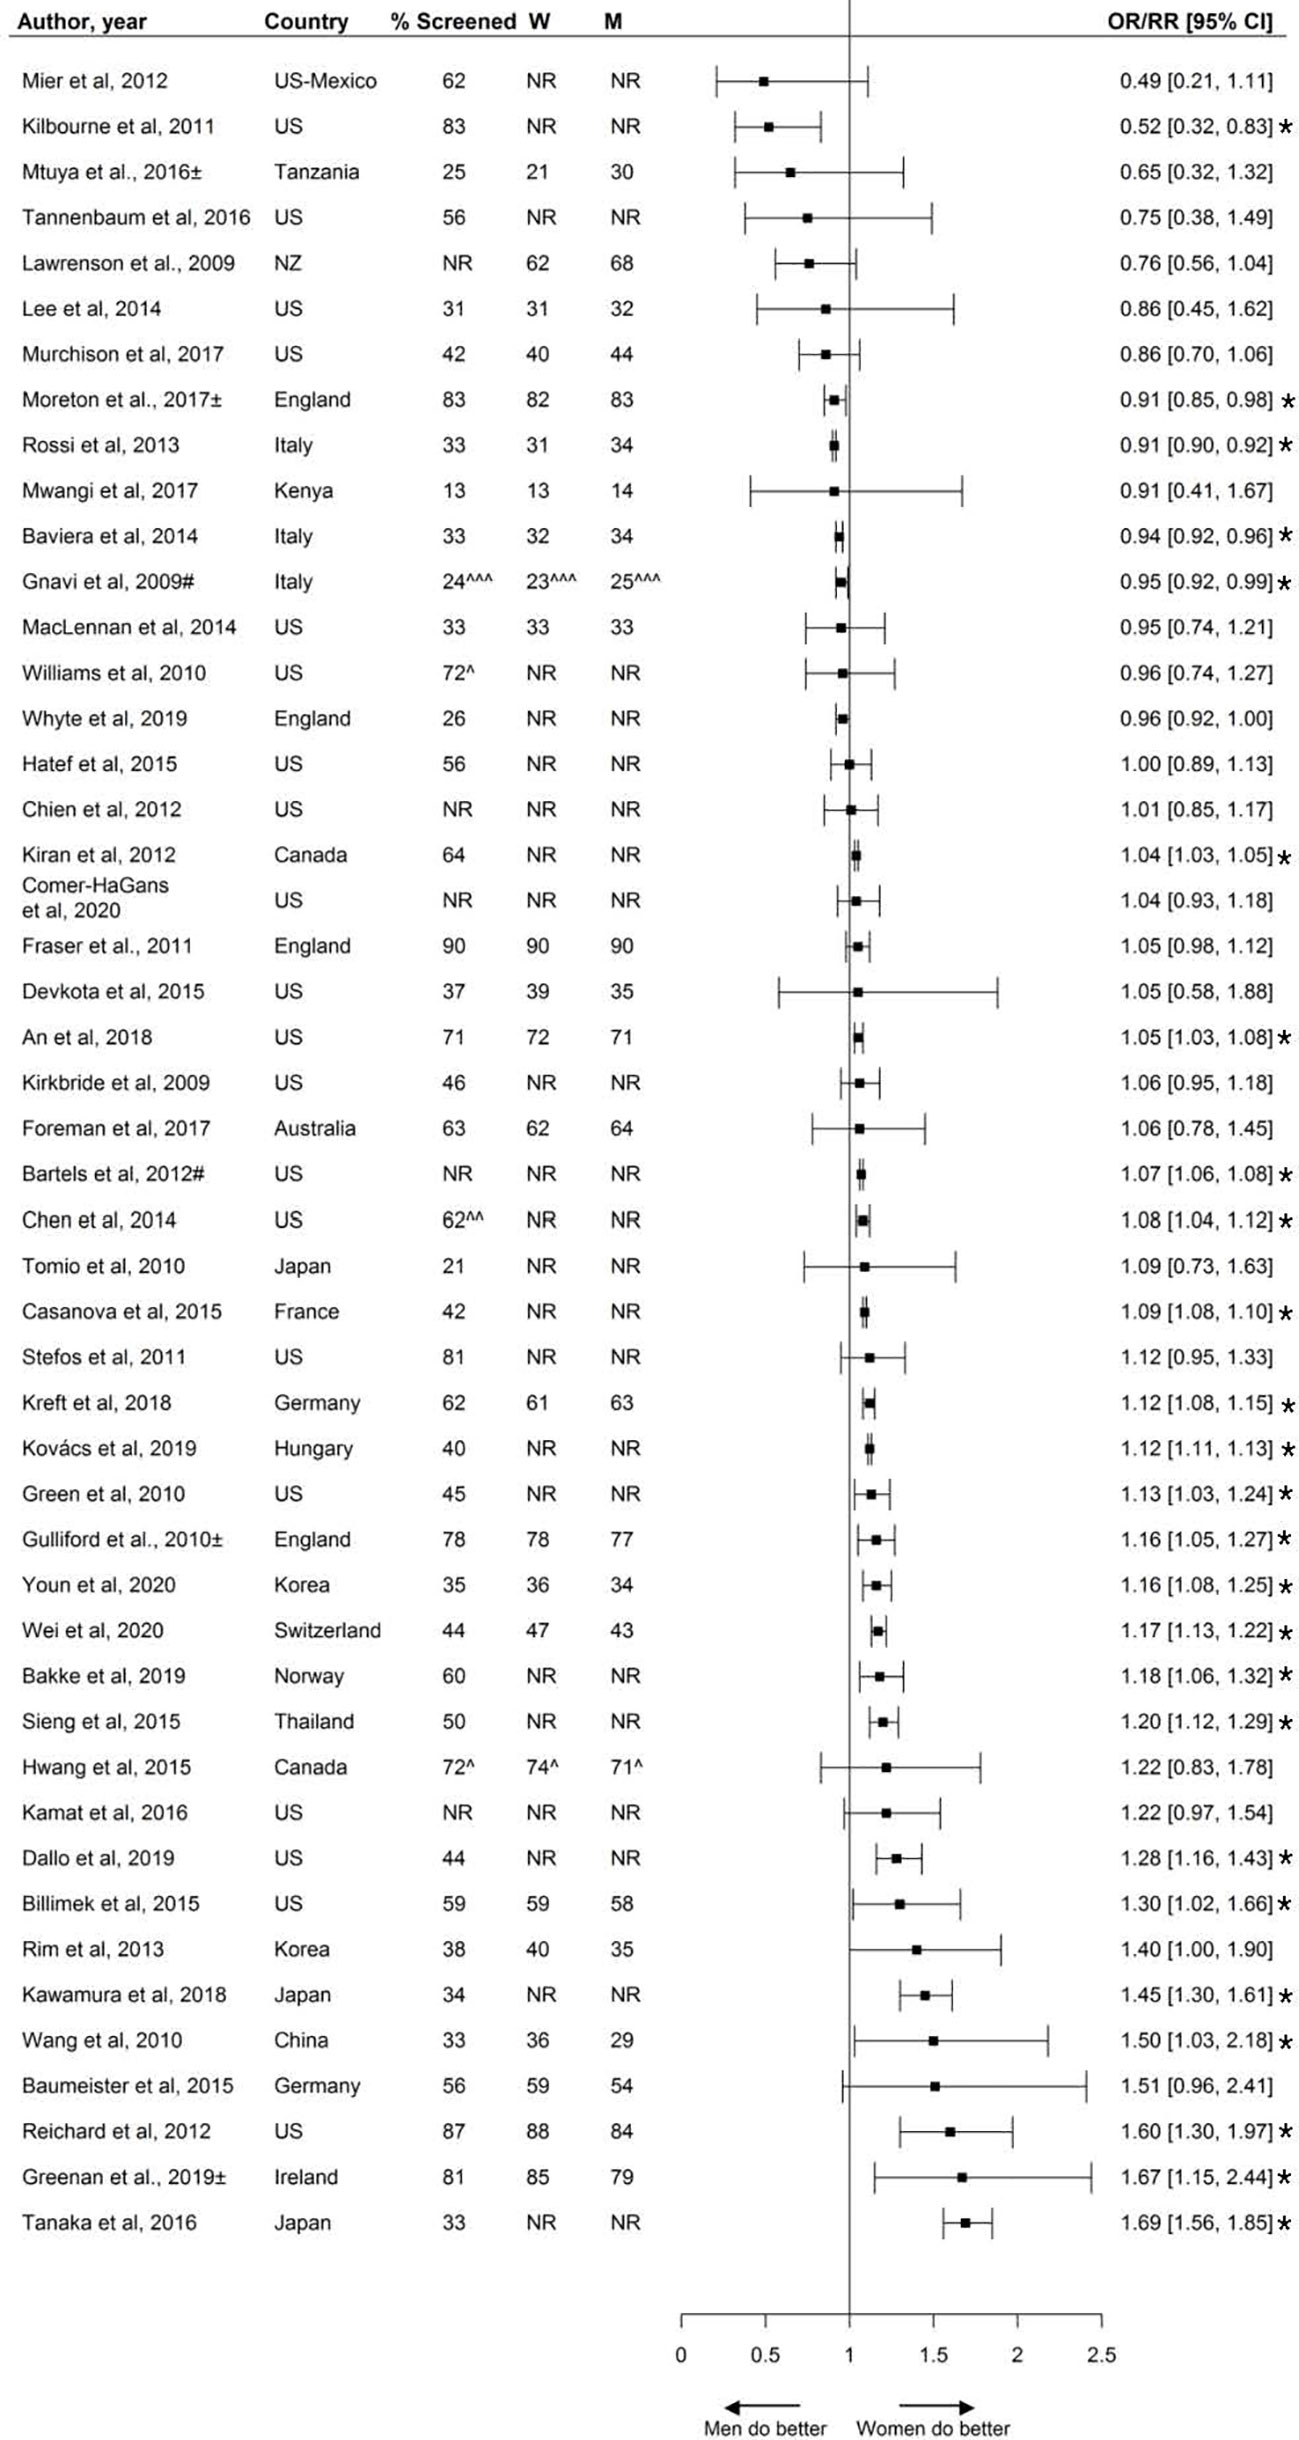
Figure 7 Retinopathy screening, expressed as adjusted odds ratios (OR) or relative risks (RR) with corresponding 95% confidence intervals (CI). Two studies are not presented in this figure because of their measure of association: Swietek et al. (33): Average Marginal Effect, (SE; p-value): 0.017 (−0.0043; <0.01 (women more likely to receive screening), Du et al. (92): Prevalence difference (95% CI): 12.6 (4.1;21.2). W = % of screened women; M = % of screened men; US, United States; UK, United Kingdom; # = Relative risk; ^ = 662 weighted %; ^^ = assumed to be weighted %; ^^^ = Kaplan-Meyer estimate; ± = Studies assessing screening adherence after screening invitation. Men = reference. * = statistically significant.
Foot Exams
Thirteen studies, including over 3.9 million individuals, reported on the sex-specific performance of foot exams. Screening rates varied from 13% to 99% across studies, with a median screening rate of 58%. Six reported that women were less likely to receive foot exams, and one study reported women being more likely to receive foot exams. The other studies reported no sex differences (Figure 8).
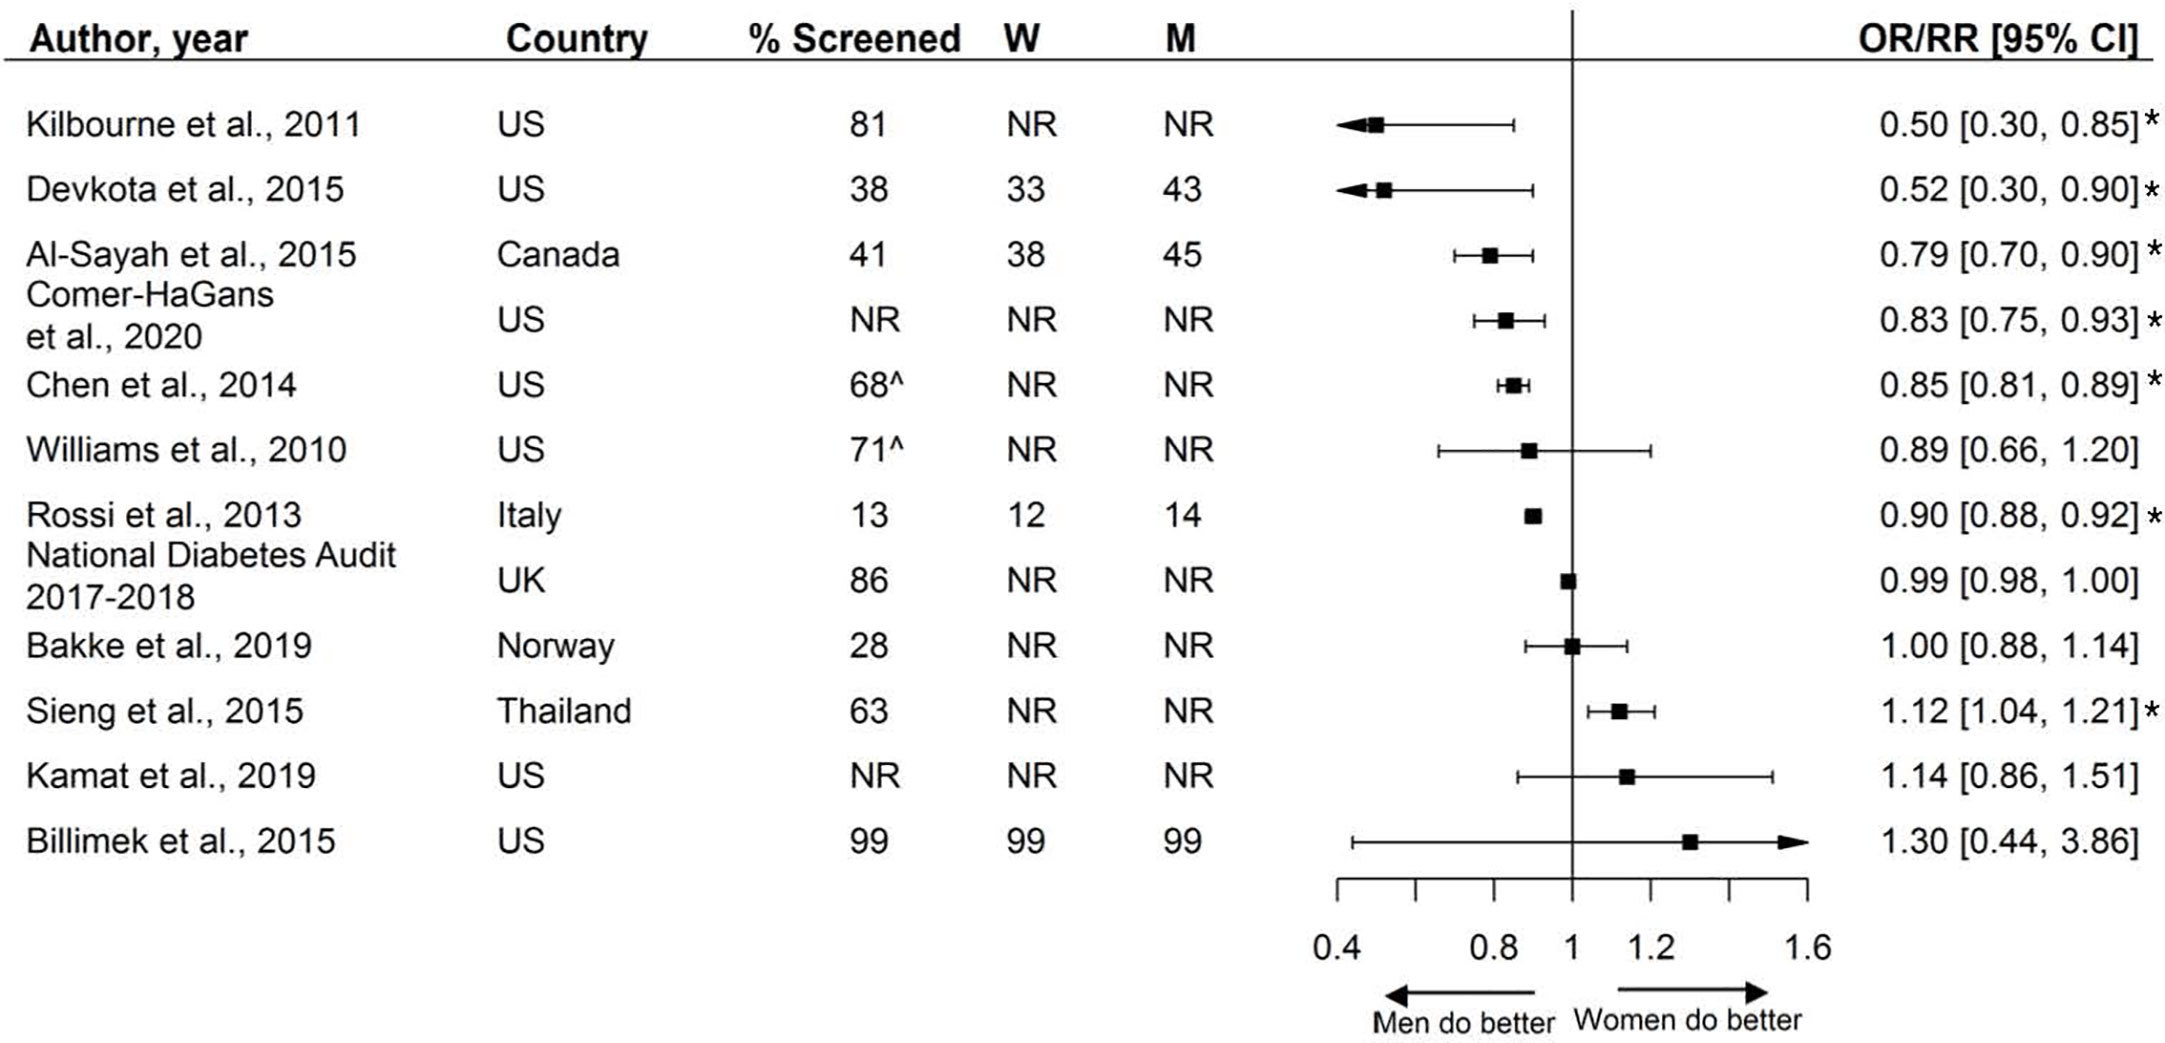
Figure 8 Foot exams, expressed as adjusted odds ratios (OR) with corresponding 95% confidence intervals (CI). One study is not presented in this figure because of the measure of association: Du et al., (92): Prevalence difference (95% CI 4.2 (−6.4; 14.9).W = % of screened women; M = % of screened men; US, United States; UK, United Kingdom; ^ = assumed to be weighted %. % Chen et al. extracted from the last available year. Men = reference. * = statistically significant.
Assessment of Smoking Status
Two studies reported on the assessment of smoking status. Both studies found high screening rates (95%), and women were more likely to be screened for smoking status than men (Figure 9).
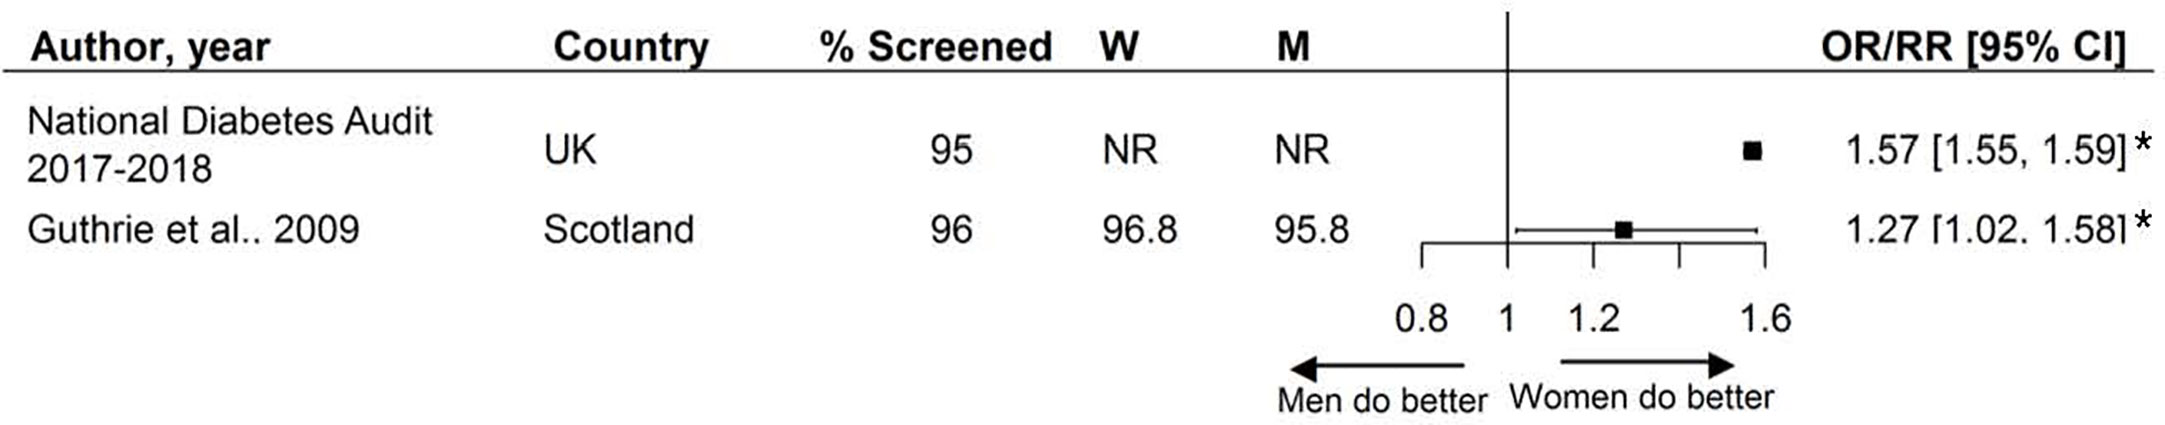
Figure 9 Assessment of smoking status, expressed as adjusted odds ratios (OR) with corresponding 95% confidence intervals (CI). W = % of screened women; M = % of screened men; Men = reference. * = statistically significant.
Combination
Fifteen studies reported on the assessment of a combination of risk factors and screening activities. The presence and direction of sex disparities varied across studies, with a third of the included studies reporting that, compared with men, women were less likely to receive a combination of care, one-third of studies found no sex disparities, and one-third found that women were more likely to receive a combination of care than men (Figure 10).
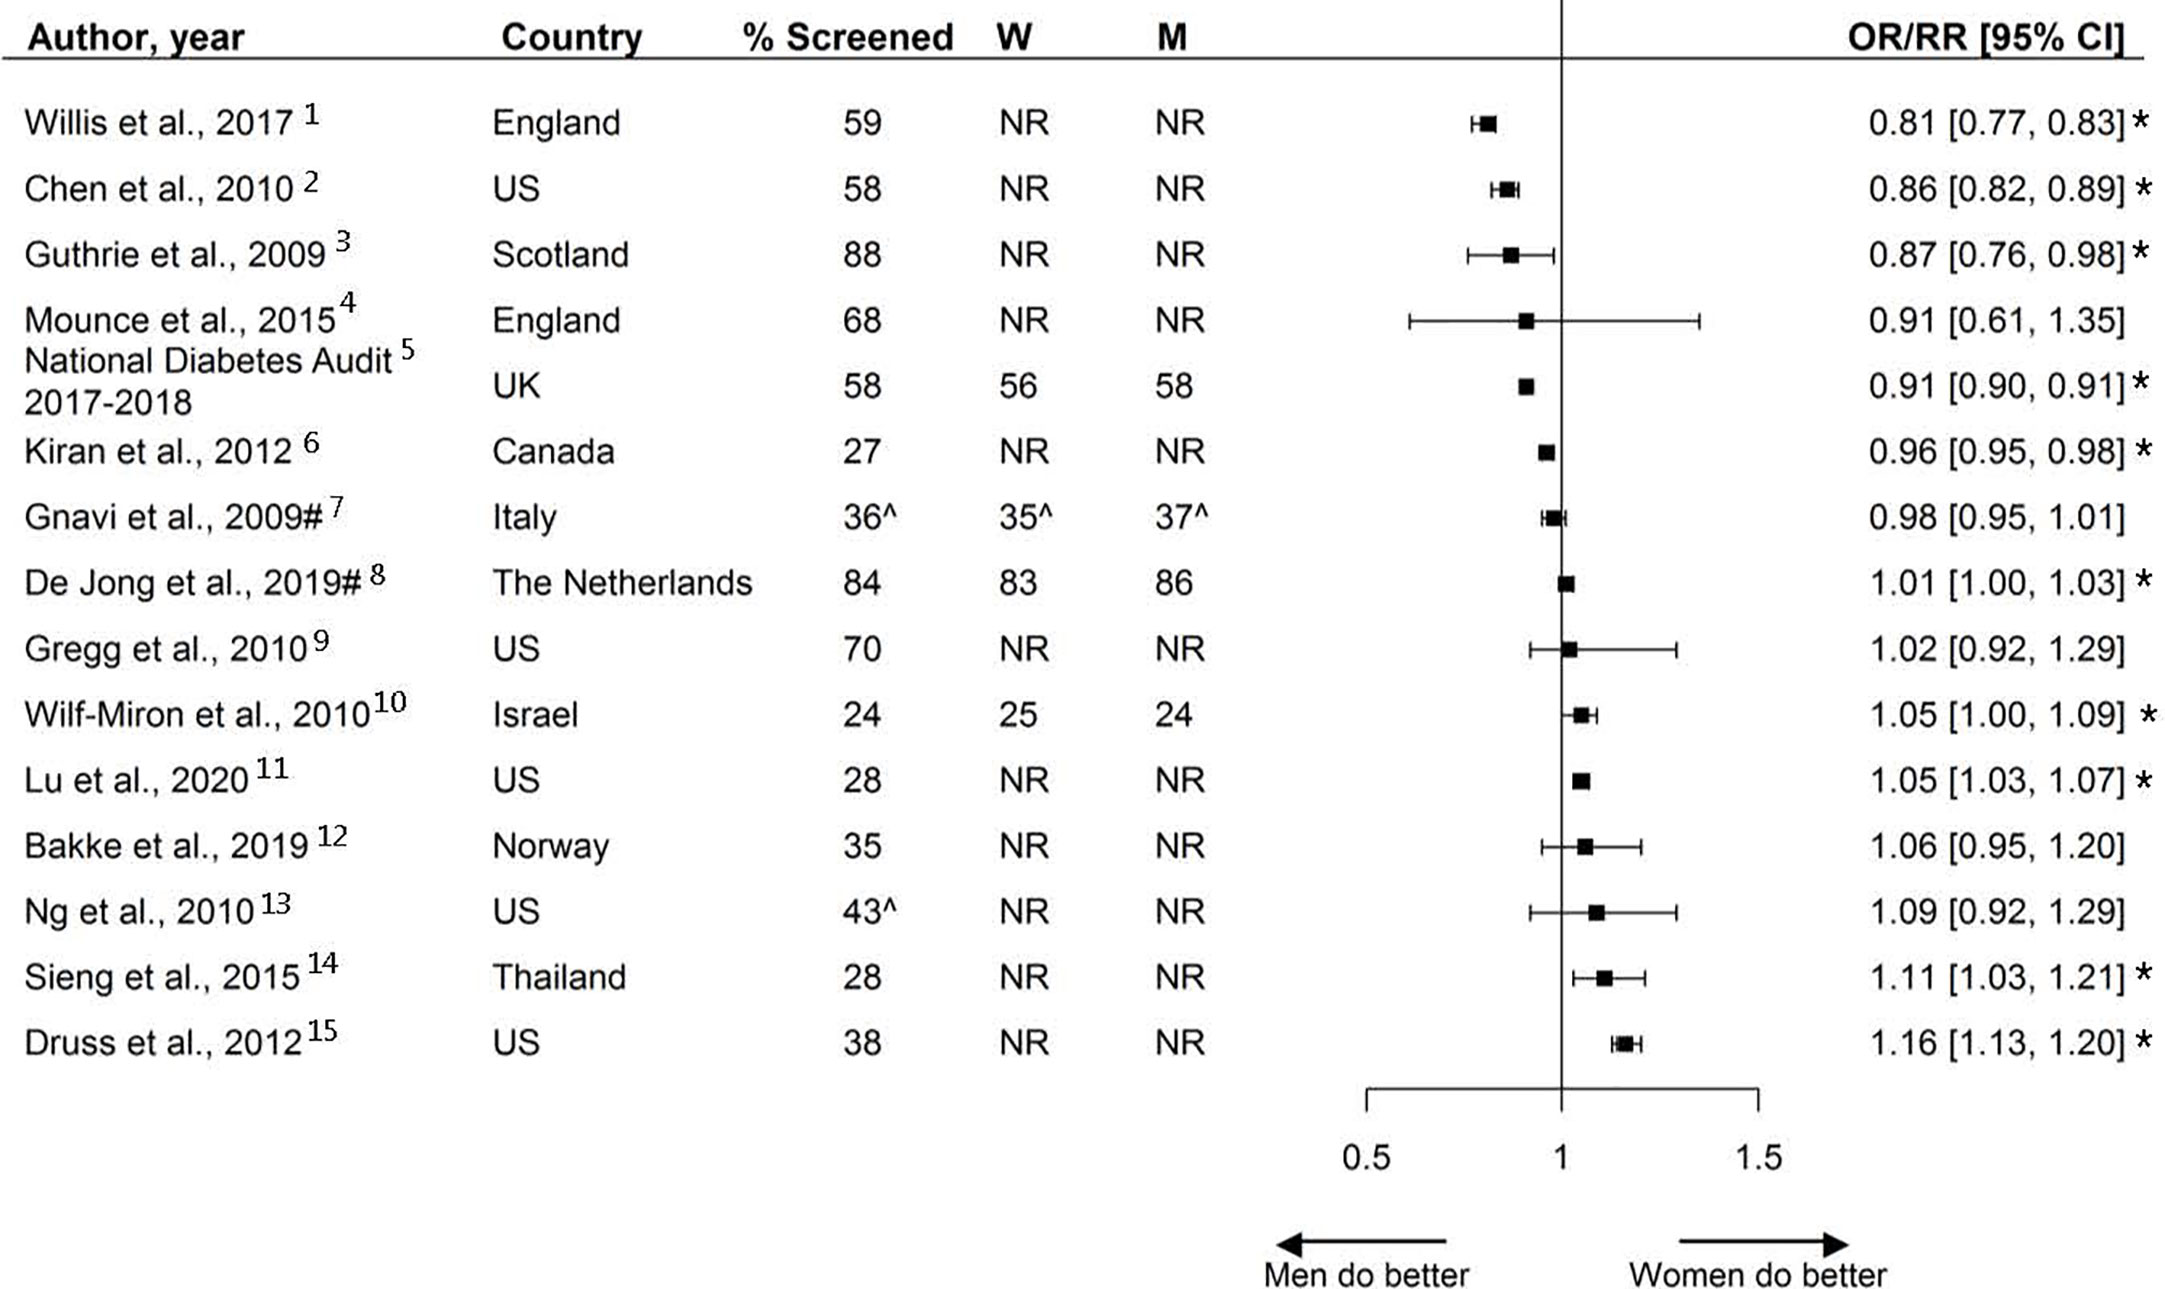
Figure 10 Combination of risk factor assessment and screening, expressed as adjusted odds ratios (OR) or risk ratios (RR) with corresponding 95% confidence intervals (CI). # = risk ratio; ^ = Kaplan-Meyer estimates; * = statistically significant. W = % of screened women; M = % of screened men; Men = reference. 1 = All measurements received within 12 months: blood pressure, HbA1c, cholesterol, urine albumin: creatinine ratio/protein:creatinine or proteinuria, eGFR or serum creatinine, foot and eye exams, BMI, smoking status, within 15 months (6 for HbA1c). 2 = Receiving at least 2 HbA1c measurements and 1 LDL measurement received within 12 months. 3 = All measurements received within 12 months: HbA1c, blood pressure, cholesterol, smoking status. 4 = At least one of the following measurements received within 12 months: HbA1c, proteinuria, foot exam. 5 = All measurements received within 15 months: HbA1c, blood pressure, cholesterol, serum creatinine, urine albumin, foot exam, BMI, smoking status. 6 = All measurements received within 24 months: eye exam, four HbA1c tests, and two cholesterol tests. 7 = Assessment of HbA1c and at least two measurements from among eye exams, total cholesterol, and microalbuminuria. 8 = Receiving one or more measurements within 12 months: HbA1c, blood pressure, total cholesterol, LDL, HDL, or BMI. 9 = All measurements received within 36 months: HbA1c, lipid profile, urine albumin, eye exam, and foot exam. 10 = All measurements received within 12 months: HbA1c, LDL, microalbuminuria, eye and foot exams, blood pressure and BMI. 11 = All measurements received within 12 months: HbA1c, LDL, eye exam, and medical attention for nephropathy (including screening and treatment). 12 = Receiving at least two out of three measurements: albuminuria and monofilament (foot exam) within 12 months, eye exam within 30 months. 13 = Receiving all measurements within 12 months: HbA1c, eye and foot exams. 14 = Receiving all measurements within 12 months: HbA1c, LDL, eye and foot exams. 15 = Receiving at least 2 measurements: HbA1c during 708 the measurement year, eye exam, LDL, and medical attention for nephropathy (screening test during the past year or evidence of nephropathy).
Discussion
This systematic review including 81 studies showed that the presence, magnitude, and direction of sex disparities in the assessment of cardiovascular risk factors and screening of diabetes-related complications varied considerably across studies, with some evidence suggesting that women, compared with men, may be more likely to receive retinopathy screening and less likely to receive foot exams. In addition, only two studies reported on the assessment of smoking status; both showing that women were more likely to be screened. Overall, screening rates can be improved for both sexes.
To our knowledge, this is the first systematic review studying sex disparities in the assessment and screening of cardiovascular risk factors and diabetes-related complications among individuals with diabetes. A recent meta-analysis, including 22 studies with 4,754,782 individuals from the general population in primary care setting, showed that assessment rates of CVD risk scores and risk factors were similar between the sexes (93). In contrast to our study, the authors did find evidence of women being less likely to be assessed for smoking (93). Nevertheless, the results were comparable to our study in that no consistent pattern in risk factor assessment and complication screening favoring either men or women was found and screening rates could be improved for both sexes.
Assessment of cardiovascular risk factors and screening for diabetes-related complications is critical in guiding treatment decisions. The present study demonstrates that there is no consistent pattern in screening activities favoring men or women, suggesting that disparities in risk factor assessment and screening activities do not account for the higher relative risk of CVD conferred by diabetes previously found in women compared with men (2–8). However, other factors related to the uptake and provision of healthcare, such as treatment and adherence, may still be involved in explaining these sex differences. Although assessment of cardiovascular risk factors is one of the first steps in guiding treatment decisions, it may not necessarily be followed by equal treatment. For example, a recently published meta-analyses, including data from 2.2 million individuals in primary care, showed that women at high risk or with established CVD were less likely to be prescribed aspirin, statins, and angiotensin-converting enzyme (ACE) inhibitors, and more likely to be prescribed diuretics, than men (94). Other studies have suggested that women are less adherent to statins than men (95–97). Differences in biology may also impact women’s excess risk of CVD and it has previously been hypothesized that women experience a relatively greater increase of cardiovascular risk factor levels in the transition from normal glycaemia to diabetes (98). Differences in body anthromorphy and fat storage may be of particular interest in explaining the women’s excess risk of CVD, as fat distribution differs by sex. Sex differences in fat distribution may impact the duration of the transition from normoglycemia to overt diabetes and consequently impact the increase of other related cardiovascular risk factor levels (2).
Strengths and Limitations
The main strength of this systematic review is the inclusion large number of studies providing sex-specific data. The majority of studies included more than 1000 individuals, of which 41 (51%) studies included over 10.000 individuals. This study also has several limitations. First, there was substantial heterogeneity between studies regarding patient population, outcome definitions, and data source and no meta-analyses were performed. Second, there was a lack of studies that specifically evaluated risk factor assessment in individuals diagnosed with type 1 diabetes. Of the studies that included individuals with diabetes without specifying the subtype, we assume that majority of the included study participants were diagnosed with type 2 diabetes. The results of this systematic review are therefore mainly applicable to those with type 2 diabetes. An appropriate method to study sex disparities separately for type 1 and type 2 diabetes would be an individual participants data (IPD) analysis, and future research should attempt to obtain individual-level patient data. Third, the majority of studies were from Europe and Northern America, thereby limiting the generalizability to other parts of the world. Fourth, screening rates varied widely between studies and across the outcomes of interest and can be improved for both sexes, nonetheless strategies on how to improve these rates are not discussed in this review. Further research is needed to explore the reasons for the suboptimal screening rates found in both sexes within the context of local and national healthcare settings.
Conclusion
Mixed findings were found regarding the presence, magnitude, and direction of sex disparities with regard to the assessment of cardiovascular risk factors and screening for diabetes-related complications. Overall, no consistent pattern favoring men or women was found and screening rates can be improved for both sexes.
Data Availability Statement
The original contributions presented in the study are included in the article/Supplementary Material. Further inquiries can be directed to the corresponding author.
Author Contributions
RV, SP, MB, and MJ conceived the research. MJ and RV conducted the analyses and drafted the manuscript. All authors contributed critical intellectual content and made important revisions to the manuscript. RV is the guarantor of this work. All authors contributed to the article and approved the submitted version.
Funding
This study was supported by the Netherlands Organization forHealth Research and Development (ZonMw), Gender andHealth Programme (Project no 849200001).
Conflict of Interest
The authors declare that the research was conducted in the absence of any commercial or financial relationships that could be construed as a potential conflict of interest.
Supplementary Material
The Supplementary Material for this article can be found online at: https://www.frontiersin.org/articles/10.3389/fendo.2021.617902/full#supplementary-material
References
1. IDF. Atlas 9th edition International Diabetes Federation 2019. Available at: https://diabetesatlas.org/en/resources/.
2. de Ritter R, de Jong M, Vos RC, van der Kallen CJH, Sep SJS, Woodward M, et al. Sex differences in the risk of vascular disease associated with diabetes. Biol Sex Differ (2020) 11:1. doi: 10.1186/s13293-019-0277-z
3. Millett ERC, Peters SAE, Woodward M. Sex differences in risk factors for myocardial infarction: cohort study of UK Biobank participants. BMJ (2018) 363:k4247. doi: 10.1136/bmj.k4247
4. de Jong M, Woodward M, Peters SAE. Diabetes, Glycated Hemoglobin, and the Risk of Myocardial Infarction in Women and Men: A Prospective Cohort Study of the UK Biobank. Diabetes Care (2020) 43(9):2050–9. doi: 10.2337/dc19-2363
5. Peters SAE, Huxley RR, Woodward M. Diabetes as risk factor for incident coronary heart disease in women compared with men: a systematic review and meta-analysis of 64 cohorts including 858,507 individuals and 28,203 coronary events. Diabetologia (2014) 57:1542–51. doi: 10.1007/s00125-014-3260-6
6. Peters SAE, Huxley RR, Woodward M. Diabetes as a risk factor for stroke in women compared with men: a systematic review and meta-analysis of 64 cohorts, including 775,385 individuals and 12,539 strokes. Lancet (London England) (2014) 383:1973–80. doi: 10.1016/S0140-6736(14)60040-4
7. Ohkuma T, Komorita Y, Peters SAE, Woodward M. Diabetes as a risk factor for heart failure in women and men: a systematic review and meta-analysis of 47 cohorts including 12 million individuals. Diabetologia (2019) 62:1550–60. doi: 10.1007/s00125-019-4926-x
8. Lee W, Cheung A, Cape D, Zinman B. Impact of diabetes on coronary artery disease in women and men: a meta-analysis of prospective studies. Diabetes Care (2000) 23:962–8. doi: 10.2337/diacare.23.7.962
9. Chatterjee S, Peters SAE, Woodward M, Arango SM, Batty GD, Beckett N, et al. Type 2 Diabetes as a Risk Factor for Dementia in Women Compared With Men: A Pooled Analysis of 2.3 Million People Comprising More Than 100,000 Cases of Dementia. Diabetes Care (2016) 39:300–7. doi: 10.2337/dc15-1588
10. Shen Y, Cai R, Sun J, Dong X, Huang R, Tian S, et al. Diabetes mellitus as a risk factor for incident chronic kidney disease and end-stage renal disease in women compared with men: a systematic review and meta-analysis. Endocrine (2017) 55:66–76. doi: 10.1007/s12020-016-1014-6
11. Moher D, Liberati A, Tetzlaff J, Altman DG, Group TP. Preferred Reporting Items for Systematic Reviews and Meta-Analyses: The PRISMA Statement. PloS Med (2009) 6:e1000097. doi: 10.1371/journal.pmed.1000097
12. Badampudi D, Wohlin C, Petersen K. Experiences from using snowballing and database searches in systematic literature studies. In: . Proceedings of the 19th International Conference on Evaluation and Assessment in Software Engineering - EASE "15. ACM Press (2015). p. 1–10. doi: 10.1145/2745802.2745818
13. Wells G, Shea B, O'Connell D, Peterson J, Welch V, Logos M, Tugwell P, et al. The Newcastle-Ottawa Scale (NOS) for assessing the quality of nonrandomised studies in meta-analyses. The Ottawa Hospital Research Institute1–2.http://www.ohri.ca/programs/clinical_epidemiology/oxford.asp
14. Tan SH, Tan SB. The correct interpretation of confidence intervals. Proc Singapore Healthc (2010) 19:276–8. doi: 10.1177/201010581001900316
15. National Diabetes Audit. NHS Digital NHS digital. Available at: https://digital.nhs.uk/data-and-information/publications/statistical/national-diabetes-audit.
16. Murchison AP, Hark L, Pizzi LT, Dai Y, Mayro EL, Storey PP, et al. Non-adherence to eye care in people with diabetes. BMJ Open Diabetes Res Care (2017) 5:1–10. doi: 10.1136/bmjdrc-2016-000333
17. Tanaka H, Tomio J, Sugiyama T, Kobayashi Y. Process quality of diabetes care under favorable access to healthcare: A 2-year longitudinal study using claims data in Japan. BMJ Open Diabetes Res Care (2016) 4:e000291. doi: 10.1136/bmjdrc-2016-000291
18. Sieng S, Thinkamrop B, Hurst C. Achievement of Processes of Care for Patients with Type 2 Diabetes in General Medical Clinics and Specialist Diabetes Clinics in Thailand. Epidemiol Open Access (2015) 1–9. doi: 10.4172/2161-1165.S2-004
19. Baumeister SE, Baumeister SE, Schomerus G, Andersen RM, Tost F, Markus MRP, et al. Trends of barriers to eye care among adults with diagnosed diabetes in Germany, 1997-2012. Nutr Metab Cardiovasc Dis (2015) 25:906–15. doi: 10.1016/j.numecd.2015.07.003
20. Hatef E, Vanderver BG, Fagan P, Albert M, Alexander M. Annual diabetic eye examinations in a managed care Medicaid population. Am J Manage Care (2015) 21:e297–302.
21. Kamat S, Gousse Y, Muzumdar J, Gu A. Trends and Disparities in Quality of Diabetes Care in the US: The National Health and Nutrition Examination Survey, 1999-2016. Inov Pharm (2019) 10:17. doi: 10.24926/iip.v10i4.2064
22. Bennett KJ, McDermott S, Mann JR, Hardin J. Receipt of recommended services among patients with selected disabling conditions and diabetes. Disabil Health J (2017) 10:58–64. doi: 10.1016/j.dhjo.2016.09.001
23. An JJ, Niu F, Turpcu A, Rajput Y, Cheetham TC. Adherence to the American Diabetes Association retinal screening guidelines for population with diabetes in the United States. Ophthalmic Epidemiol (2018) 25:257–65. doi: 10.1080/09286586.2018.1424344
24. Mwangi N, Macleod D, Gichuhi S, Muthami L, Moorman C, Bascaran C, et al. Predictors of uptake of eye examination in people living with diabetes mellitus in three counties of Kenya. Trop Med Health (2017) 45:1–10. doi: 10.1186/s41182-017-0080-7
25. LeBlanc E, Bélanger M, Thibault V, Babin L, Greene B, Halpine S, et al. Influence of a Pay-for-Performance Program on Glycemic Control in Patients Living with Diabetes by Family Physicians in a Canadian Province. Can J Diabetes (2017) 41:190–6. doi: 10.1016/j.jcjd.2016.09.008
26. Foreman J, Keel S, Xie J, Van Wijngaarden P, Taylor HR, Dirani M, et al. Adherence to diabetic eye examination guidelines in Australia: The national eye health survey. Med J Aust (2017) 206:402–6. doi: 10.5694/mja16.00989
27. Whyte MB, Hinton W, McGovern A, Van Vlymen J, Ferreira F, Whyte MB, et al. Disparities in glycaemic control, monitoring, and treatment of type 2 diabetes in England: A retrospective cohort analysis. PloS Med (2019) 16:1–18. doi: 10.1371/journal.pmed.1002942
28. de Jong M, Vos RC, de Ritter R, van der Kallen CJ, Sep SJ, Woodward M, et al. Sex differences in cardiovascular risk management for people with diabetes in primary care: A cross-sectional study. BJGP Open (2019) 3:1–11. doi: 10.3399/bjgpopen19X101645
29. Bakke Å, Tran AT, Dalen I, Cooper JG, Løvaas KF, Jenum Ak, et al. Population, general practitioner and practice characteristics are associated with screening procedures for microvascular complications in Type 2 diabetes care in Norway. Diabet Med (2019) 36:1431–43. doi: 10.1111/dme.13842
30. Rim THT, Byun IH, Kim HS, Lee SY, Yoon JS. Factors associated with diabetic retinopathy and nephropathy screening in Korea: The third and fourth Korea national health and nutrition examination survey (KNHANES III and IV). J Korean Med Sci (2013) 28:814–20. doi: 10.3346/jkms.2013.28.6.814
31. Wei W, Gruebner O, Von Wyl V, Dressel H, Ulyte A, Brüngger B, et al. Exploring geographic variation of and influencing factors for utilization of four diabetes management measures in Swiss population using claims data. BMJ Open Diabetes Res Care (2020) 8:1–11. doi: 10.1136/bmjdrc-2019-001059
32. Lu Z, Cogan L, McDermott S, Lauer E, Lindner S, Tracy K, et al. Disparities in diabetes management among medicaid recipients with intellectual and developmental disabilities (IDD): Evidence from five U.S. states. Disabil Health J (2020) 13:100880. doi: 10.1016/j.dhjo.2019.100880
33. Swietek KE, Gaynes BN, Jackson GL, Weinberger M, Domino ME. Effect of the Patient-Centered Medical Home on Racial Disparities in Quality of Care. J Gen Intern Med (2020) 35:2304–13. doi: 10.1007/s11606-020-05729-x
34. Meier R, Valeri F, Senn O, Rosemann T, Chmiel C. Quality performance and associated factors in Swiss diabetes care – A cross-sectional study. PloS One (2020) 15:1–14. doi: 10.1371/journal.pone.0232686
35. Hirst JA, Farmer AJ, Smith MC, Stevens RJ. Timings for HbA 1c testing in people with diabetes are associated with incentive payments: an analysis of UK primary care data. Diabet Med (2019) 36:36–43. doi: 10.1111/dme.13810
36. Mtuya C, Cleland CR, Philippin H, Paulo K, Njau B, Makupa WU, et al. Reasons for poor follow-up of diabetic retinopathy patients after screening in Tanzania: A cross-sectional study. BMC Ophthalmol (2016) 16:1–7. doi: 10.1186/s12886-016-0288-z
37. Fraser DS, Watkinson GE, Rennie CA, King D, Sanderson H, Edwards L, et al. Sociodemographic differences in diabetic retinopathy screening; using patient-level primary care data for health equity audit. Clin Audit (2011) 7. doi: 10.2147/ca.s25313
38. Greenan E, Salim M, Coakley DN, James M. The effect of geodemographic factors on the attendance rates at a regional diabetic retinopathy treatment centre. Ir J Med Sci (2019) 188:1207–12. doi: 10.1007/s11845-019-02009-4
39. Moreton RBR, Stratton IM, Chave SJ, Lipinski H, Scanlon PH. Factors determining uptake of diabetic retinopathy screening in Oxfordshire. Diabet Med (2017) 34:993–9. doi: 10.1111/dme.13350
40. Wang D, Ding X, He M, Yan L, Kuang J, Geng Q, et al. Use of eye care services among diabetic patients in Urban and Rural China. Ophthalmology (2010) 117:1755–62. doi: 10.1016/j.ophtha.2010.01.019
41. Gnavi R, Picariello R, La Karaghiosoff L, Costa G, Giorda C. Determinants of quality in diabetes care process: The population-based Torino study. Diabetes Care (2009) 32:1986–92. doi: 10.2337/dc09-0647
42. Kirkbride K, Wallace N. Rural health clinics and diabetes-related primary care for medicaid beneficiaries in oregon. J Rural Heal (2009) 25:247–52. doi: 10.1111/j.1748-0361.2009.00226.x
43. Guthrie B, Emslie-Smith A, Morris AD. Which people with Type 2 diabetes achieve good control of intermediate outcomes? Population database study in a UK region. Diabet Med (2009) 26:1269–76. doi: 10.1111/j.1464-5491.2009.02837.x
44. Tomio J, Toyokawa S, Tanihara S, Inoue K, Kobayashi Y. Quality of care for diabetes patients using National Health Insurance claims data in Japan. J Eval Clin Pract (2010) 16:1164–9. doi: 10.1111/j.1365-2753.2009.01287.x
45. Williams SL, Haskard-Zolnierek KB, Banta JE, Haviland MG, Dimatteo MR, Anderson D, et al. Serious psychological distress and diabetes care among California adults. Int J Psychiatry Med (2010) 40:233–45. doi: 10.2190/PM.40.3.a
46. Green JL, Gazmararian JA, Rask KJ, Druss BG. Quality of diabetes care for underserved patients with and without mental illness: Site of care matters. Psychiatr Serv (2010) 61:1204–10. doi: 10.1176/ps.2010.61.12.1204
47. Chen JY, Tian H, Juarez DT, Hodges KA Jr, Brand JC, Chung RS, et al. The effect of a PPO pay-for-performance program on patients with diabetes. Am J Manage Care (2010) 16:11–9.
48. Ng J, Scholle SH. Disparities in Quality of Care for Midlife Adults (Ages 45-64) Versus Older Adults (Ages >65). (2010), 1–72.
49. Gregg EW, Karter AJ, Gerzoff RB, Safford M, Brown AF, Tseng CW, et al. Characteristics of Insured Patients with Persistent Gaps in Diabetes Care Services: The Translating Research into Action for Diabetes (TRIAD) Study. Med Care (2010) 48:31–7. doi: 10.1097/MLR.0b013e3181bd4783
50. Stefos T, Burgess JF Jr, Mayo-Smith MF, Frisbee KL, Harvey HB, Lehner L, et al. The effect of physician panel size on health care outcomes. Heal Serv Manage Res (2011) 24:96–105. doi: 10.1258/hsmr.2011.011001
51. Kilbourne AM, Pirraglia PA, Lai Z, Bauer MS, Charns MP, Greenwald D, et al. Quality of general medical care among patients with serious mental illness: Does colocation of services matter? Psychiatr Serv (2011) 62:922–8. doi: 10.1176/ps.62.8.pss6208_0922
52. Bartels CM, Saucier JM, Thorpe CT, Kind AJ, Pandhi N, Hansen KE, et al. Monitoring diabetes in patients with and without rheumatoid arthritis: a Medicare study. Arthritis Res Ther (2012) 14:1–9. doi: 10.1186/ar3915
53. Mier N, Wang X, Lee Smith M, Irizarry D, Harvey HB, Treviño L, et al. Factors influencing health care utilization in older Hispanics with diabetes along the Texas-Mexico border. Popul Health Manage (2012) 15:149–56. doi: 10.1089/pop.2011.0044
54. Gold R, DeVoe JE, McIntire PJ, Puro JE, Chauvie SL, Shah AR, et al. Receipt of diabetes preventive care among safety net patients associated with differing levels of insurance coverage. J Am Board Fam Med (2012) 25:42–9. doi: 10.3122/jabfm.2012.01.110142
55. Kiran T, Victor JC, Kopp A, Shah BR, Glazier RH. The relationship between financial incentives and quality of diabetes care in Ontario, Canada. Diabetes Care (2012) 35:1038–46. doi: 10.2337/dc11-1402
56. Chien AT, Eastman D, Li Z, Rosenthal MB. Impact of a pay for performance program to improve diabetes care in the safety net. Prev Med (Baltim) (2012) 55:S80–5. doi: 10.1016/j.ypmed.2012.05.004
57. Yu MK, Lyles CR, Bent-Shaw LA, Young BA. Sex disparities in diabetes process of care measures and self-care in high-risk patients. J Diabetes Res (2013) 2013:575814. doi: 10.1155/2013/575814
58. Hellemons ME, Denig P, De Zeeuw D, Voorham J, Lambers Heerspink HJ. Is albuminuria screening and treatment optimal in patients with type 2 diabetes in primary care? Observational data of the GIANTT cohort. Nephrol Dial Transplant (2013) 28:706–15. doi: 10.1093/ndt/gfs567
59. Maclennan PA, McGwin G Jr, Heckemeyer C, Lolley VR, Hullett S, Saaddine J, et al. Eye Care Utilization among a High-Risk Diabetic Population Seen in a Public Hospital’s Clinics. JAMA Ophthalmol (2014) 132:162–7. doi: 10.1001/jamaophthalmol.2013.6046
60. Lee DJ, Kumar N, Feuer WJ, Chou CF, Rosa PR, Schiffman J, et al. Dilated eye examination screening guideline compliance among patients with diabetes without a diabetic retinopathy diagnosis: the role of geographic access. BMJ Open Diabetes Res Care (2014) 2:e000031. doi: 10.1136/bmjdrc-2014-000031
61. Chen R, Cheadle A, Johnson D, Duran B. US Trends in Receipt of Appropriate Diabetes Clinical and Self-care From 2001 to 2010 and Racial/Ethnic Disparities in Care. Diabetes Educ (2014) 40:756–66. doi: 10.1177/0145721714546721
62. Buja A, Gini R, Visca M, Damiani G, Federico B, Donato D, et al. Need and disparities in primary care management of patients with diabetes. BMC Endocr Disord (2014) 14:1–8. doi: 10.1186/1472-6823-14-56
63. Casanova L, Roses F, Carrier H, Gentile G, Verger P. Evolution of paraclinical monitoring between 2008 and 2011of treated type 2 diabetic patients. exercer la revue francophone de médecine générale (2015) 26:205–12.
64. Liang H, Kennedy C, Manne S, Lin JH-L, Dolin P. Monitoring for proteinuria in patients with type 2 diabetes mellitus. BMJ Open Diabetes Res Care (2015) 3:e000071. doi: 10.1136/bmjdrc-2014-000071
65. Hwang J, Rudnisky C, Bowen S, Johnson JA. Socioeconomic factors associated with visual impairment and ophthalmic care utilization in patients with type II diabetes. Can J Ophthalmol (2015) 50:119–26. doi: 10.1016/j.jcjo.2014.11.014
66. Tannenbaum SL, McClure LA, Zheng DD, Lam BL, Arheart KL, Joslin CE, et al. Ocular screening adherence across hispanic/latino heritage groups with diabetes: Results from the ocular SOL ancillary to the miami site of the hispanic community health study/study of latinos (HCHS/SOL). BMJ Open Diabetes Res Care (2016) 4. doi: 10.1136/bmjdrc-2016-000236
67. Rossaneis MA, Haddad M, do CFL, de F Mathias TA, Marcon SS. Diferenças entre mulheres e homens diabéticos no autocuidado com os pés e estilo de vida. Rev Lat Am Enfermagem (2016) 24:e2761. doi: 10.1590/1518-8345.1203.2761
68. Van Doorn-Klomberg AL, Braspenning JCC, Atsma F, Jansen B, Bouma M, Wolters R, et al. Patient Characteristics Associated with Measurement of Routine Diabetes Care: An Observational Study. PloS One (2015) 10. doi: 10.1371/journal.pone.0121845
69. Druss BG, Liping Z, Cummings JR, Shim RS, Rust GS, Marcus SC, et al. Mental comorbidity and quality of diabetes care under Medicaid: a 50-state analysis. Med Care (2012) 50:428–33. doi: 10.1097/MLR.0b013e318245a528
70. Kawamura T, Sato I, Tamura H, Nakao YM, Kawakami K. Influence of comorbidities on the implementation of the fundus examination in patients with newly diagnosed type 2 diabetes. Jpn J Ophthalmol (2018) 62:68–76. doi: 10.1007/s10384-017-0551-8
71. Ibáñez B, Galbete A, Goñi MJ, Forga L, Arnedo L, Aizpuru F, et al. Socioeconomic inequalities in cardiometabolic control in patients with type 2 diabetes. BMC Public Health (2018) 18:408. doi: 10.1186/s12889-018-5269-0
72. Kovács N, Pálinkás A, Sipos V, Nagy A, Nouh H, Kőrösi L, et al. Factors Associated with Practice-Level Performance Indicators in Primary Health Care in Hungary: A Nationwide Cross-Sectional Study. Int J Environ Res Public Health (2019) 16:3153. doi: 10.3390/ijerph16173153
73. Yoo K-H, Shin DW, Cho MH, Kim SH, Bahk HJ, Kim SH, et al. Regional variations in frequency of glycosylated hemoglobin (HbA1c) monitoring in Korea: A multilevel analysis of nationwide data. Diabetes Res Clin Pract (2017) 131:61–9. doi: 10.1016/j.diabres.2017.06.008
74. Reichard A, Stolzle H, Sella AC, Shireman TI. Quality of diabetes care for adults with physical disabilities in Kansas. Disabil Health J (2012) 5:34–40. doi: 10.1016/j.dhjo.2011.09.003
75. Devkota BP, Ansstas M, Scherrer JF, Salas J, Budhathoki C. Internal Medicine Resident Training and Provision of Diabetes Quality of Care Indicators. Can J Diabetes (2015) 39:133–7. doi: 10.1016/j.jcjd.2014.10.001
76. Williams JS, Bishu KG, St Germain A, Egede LE. Trends in sex differences in the receipt of quality of care indicators among adults with diabetes: United States 2002-2011. BMC Endocr Disord (2017) 17:31. doi: 10.1016/j.jcjd.2014.10.001
77. Dallo FJ, Ruterbusch JJ, McCullough JR, Sreedhar S, Schwartz K, Mulhem E, et al. Diabetes Management Among Arab Americans Who Sought Care at a Large Metropolitan Hospital System in Michigan. J Immigr Minor Heal (2019) 21:490–6. doi: 10.1007/s10903-018-0777-7
78. Lawrenson R, Gibbons V, Joshy G, Choi P. Are there disparities in care in people with diabetes? A review of care provided in general practice. J Prim Health Care (2009) 1:177–83. doi: 10.1071/HC09177
79. Wilf-Miron R, Peled R, Yaari E, Shem-Tov O, Weinner V, Porath A, et al. Disparities in diabetes care: role of the patient’s socio-demographic characteristics. BMC Public Health (2010) 10:729. doi: 10.1186/1471-2458-10-729
80. Naicker K, Liddy C, Singh J, Taljaard M, Hogg W. Quality of cardiovascular disease care in Ontario’s primary care practices: a cross sectional study examining differences in guideline adherence by patient sex. BMC Fam Pract (2014) 15:123. doi: 10.1186/1471-2296-15-123
81. Baviera M, Santalucia P, Cortessi L, Marzona I, Tattamanti M, Avanzini F, et al. Sex differences in cardiovascular outcomes, pharmacological treatments and indicators of care in patients with newly diagnosed diabetes: Analyses on administrative database. Eur J Intern Med (2014) 25:270–5. doi: 10.1016/j.ejim.2014.01.022
82. Willis TA, West R, Cortessi L, Marzona I, Tattamanti M, Avanzini F, et al. Variations in achievement of evidence-based, high-impact quality indicators in general practice: An observational study. PloS One (2017) 12:e0177949. doi: 10.1371/journal.pone.0177949
83. Bird CE, Manocchia M, Tomblin B, Payne P, Kulakodlu M, Iacolo E, et al. Mapping the Gaps: Gender Differences in Preventive Cardiovascular Care among Managed Care Members in Four Metropolitan Areas. Womens Health Issues (2018) 28:446–55. doi: 10.1016/j.whi.2018.04.008
84. Billimek J, Malik S, Sorkin DH, Schmalbach P, Ngo-Metzger Q, Greenfield S, et al. Understanding disparities in lipid management among patients with type 2 diabetes: gender differences in medication nonadherence after treatment intensification. Womens Health Issues (2015) 25:6–12. doi: 10.1016/j.whi.2014.09.004
85. Rossi MC, Cristofaro MR, Gentile S, Lucisano G, Manicardi V, Mulas MF, et al. Sex disparities in the quality of diabetes care: Biological and cultural factors may play a different role for different outcomes: A cross-sectional observational study from the amd annals initiative. Diabetes Care (2013) 36:3162–8. doi: 10.2337/dc13-0184
86. Mounce LTA, Steel N, Hardcastle AC, Henley WE, Bachmann MO, Campbell JL, et al. Patient characteristics predicting failure to receive indicated care for type 2 diabetes. Diabetes Res Clin Pract (2015) 107:247–58. doi: 10.1016/j.diabres.2014.11.009
87. Youn HM, Lee DW, Park EC. Association between community outpatient clinic care accessibility and the uptake of diabetic retinopathy screening: A multi-level analysis. Prim Care Diabetes (2020) 14(6):2–7. doi: 10.1016/j.pcd.2020.02.010
88. Al Sayah F, Soprovich A, Qiu W, Edwards AL, Johnson JA. Diabetic Foot Disease, Self-Care and Clinical Monitoring in Adults with Type 2 Diabetes: The Alberta’s Caring for Diabetes (ABCD) Cohort Study. Can J Diabetes (2015) 39:S120–6. doi: 10.1016/j.jcjd.2015.05.006
89. Gulliford M, Dodhia H, Chamley M, McCormick K, Mohamed M, Naithani S, et al. Socioeconomic and Ethnic Inequalities in Diabetes Retinal Screening. Diabet Med (2010) 27:282–8. doi: 10.1111/j.1464-5491.2010.02946.x
90. Kreft D, McGuinness MB, Doblhammer G, Finger RP. Diabetic retinopathy screening in incident diabetes mellitus type 2 in Germany between 2004 and 2013 - A prospective cohort study based on health claims data. PloS One (2018) 13:e0195426. doi: 10.1371/journal.pone.0195426
91. Comer-HaGans DL, Austin S, Ramamonjiarivelo Z, Matthews AK. Diabetes Standard of Care Among Individuals Who Have Diabetes With and Without Cognitive Limitation Disabilities. Diabetes Educ (2020) 46:94–107. doi: 10.1177/0145721719896262
92. Du Y, Baumert J, Paprott R, Neuhauser H, Heidemann C, Scheidt-Nave C, et al. Gender differences in cardiovascular risk profiles and diabetes care among adults with type 2 diabetes in Germany. (2019). doi: 10.1016/j.diabet.2018.05.011
93. Hyun KK, Millett ERC, Redfern J, Brieger D, Peters SAE, Woodward M, et al. Sex Differences in the Assessment of Cardiovascular Risk in Primary Health Care: A Systematic Review. Heart Lung Circ (2019) 28:1535–48. doi: 10.1016/j.hlc.2019.04.005
94. Zhao M, Woodward M, Vaartjes I, Millett ERC, Klipstein-Grobusch K, Hyun K, et al. Sex Differences in Cardiovascular Medication Prescription in Primary Care: A Systematic Review and Meta-Analysis. J Am Heart Assoc (2020) 9:e014742. doi: 10.1161/JAHA.119.014742
95. Lewey J, Shrank WH, Bowry ADK, Kilabuk E, Brennan TA, Choudhry NK, et al. Gender and racial disparities in adherence to statin therapy: A meta-analysis. Am Heart J (2013) 165:665–78.e1. doi: 10.1016/j.ahj.2013.02.011
96. Colantonio LD, Rosenson rs, Deng L, Monda KL, Dai Y, Farkouh ME, et al. Adherence to Statin Therapy Among US Adults Between 2007 and 2014. J Am Heart Assoc (2019) 8. doi: 10.1161/JAHA.118.010376
97. Goldstein KM, Zullig LL, Bastian LA, Bosworth HB. Statin Adherence: Does Gender Matter? Curr Atheroscler Rep (2016) 18:63. doi: 10.1007/s11883-016-0619-9
98. de Ritter R, Simone SJS, van der Kallen CJH, Schram MT, Koster A, Kroon AA, et al. Adverse differences in cardiometabolic risk factor levels between individuals with prediabetes and normal glucose metabolism are more pronounced in women than in men: The Maastricht Study. BMJ Open Diabetes Res Care (2019). doi: 10.1136/bmjdrc-2019-000787
Keywords: diabetes, sex disparities, risk factors, diabetes-related complications, healthcare provision, screening, systematic review
Citation: de Jong M, Peters SAE, de Ritter R, van der Kallen CJH, Sep SJS, Woodward M, Stehouwer CDA, Bots ML and Vos RC (2021) Sex Disparities in Cardiovascular Risk Factor Assessment and Screening for Diabetes-Related Complications in Individuals With Diabetes: A Systematic Review. Front. Endocrinol. 12:617902. doi: 10.3389/fendo.2021.617902
Received: 15 October 2020; Accepted: 11 February 2021;
Published: 30 March 2021.
Edited by:
Tine Willlum Hansen, Steno Diabetes Center Copenhagen (SDCC), DenmarkCopyright © 2021 de Jong, Peters, de Ritter, van der Kallen, Sep, Woodward, Stehouwer, Bots and Vos. This is an open-access article distributed under the terms of the Creative Commons Attribution License (CC BY). The use, distribution or reproduction in other forums is permitted, provided the original author(s) and the copyright owner(s) are credited and that the original publication in this journal is cited, in accordance with accepted academic practice. No use, distribution or reproduction is permitted which does not comply with these terms.
*Correspondence: Rimke C. Vos, R.C.Vos@lumc.nl