Triglyceride-glucose index and non-culprit coronary plaque characteristics assessed by optical coherence tomography in patients following acute coronary syndrome: A cross-sectional study
 Zi-Wei Zhao1
  Qi Zhao
 Yu-Jing Cheng
 Tie-Nan Sun
 Yu-Jie Zhou
- 1Beijing Key Laboratory of Precision Medicine of Coronary Atherosclerotic Disease, Department of Cardiology, Clinical Center for Coronary Heart Disease, Beijing Anzhen Hospital, Beijing Institute of Heart Lung and Blood Vessel Disease, Capital Medical University, Beijing, China
- 2Department of Cardiology, Cardiovascular Center, Beijing Friendship Hospital, Capital Medical University, Beijing, China
Background: Triglyceride-glucose (TyG) index, a novel surrogate marker of insulin resistance, has been demonstrated to be significantly associated with cardiovascular disease. It remains indistinct regarding the association between TyG index and non-culprit coronary plaque characteristics in patients following acute coronary syndrome (ACS).
Methods: The present study retrospectively recruited patients who were diagnosed with ACS and underwent non-culprit optical coherence tomography (OCT) examination. The study population was divided into 2 groups based on the median of TyG index, which was calculated as Ln [fasting triglyceride (TG) (mg/dL) × fasting blood glucose (FBG) (mg/dL)/2]. The non-culprit plaque characteristics were determined by interpreting OCT images in accordance with the standard of previous consensus.
Results: 110 patients (54.8 ± 12.1 years, 24.5% female) with 284 non-culprit plaques were included in the current analysis. TyG index was closely associated with high-risk plaque characteristics. Elevated TyG index was consistent to be an independent indicator for thin-cap fibroatheroma (TCFA) [odds ratio (OR) for per 1-unit increase 4.940, 95% confidence interval (CI) 1.652–14.767, P = 0.004; OR for taking lower median as reference 2.747, 95% CI 1.234–7.994, P = 0.011] and ruptured plaque (OR for per 1–unit increase 7.065, 95% CI 1.910–26.133, P = 0.003; OR for taking lower median as reference 4.407, 95% CI 1.208–16.047, P = 0.025) in fully adjusted model. The predictive value of TyG index for TCFA and ruptured plaque was moderate–to–high, with the area under the receiver operating characteristic curve (AUC) of 0.754 and 0.699 respectively. The addition of TyG index into a baseline model exhibited an incremental effect on the predictive value for TCFA, manifested as an increased AUC (0.681, 95% CI 0.570–0.793 vs. 0.782, 95% CI 0.688–0.877, P = 0.042), and significant continuous net reclassification improvement (0.346, 95% CI 0.235–0.458, P < 0.001) and integrated discrimination improvement (0.221, 95% CI 0.017–0.425, P = 0.034). TyG index failed to play an incremental effect on predicting ruptured plaque.
Conclusion: TyG index, which is simply calculated from fasting TG and FBG, can be served as an important and independent risk predictor for high-risk non-culprit coronary plaques in patients following ACS.
Background
Coronary artery disease (CAD) has become one of the most important chronic non-communicable diseases leading to death and disability, which brings heavy social and economic burden (1). Despite of the popularization and promotion for secondary preventive medications and revascularization therapies, patients with CAD remain to be at high risk of recurrent cardiovascular events, particularly for those who have ever experienced an acute coronary syndrome (ACS), the major pathogenesis of which has been recognized as thrombosis secondary to plaque rupture (2, 3). The close relationship between culprit plaque features and prognosis has been well established by previous studies (4). In clinical practice, the plaques in culprit lesions, indeed, are of the greatest concern and acquire the priority for intervention in patients with ACS. However, former study has also revealed that vulnerable plaques in non-culprit lesions are significantly associated with the subsequent ACS at the lesion level (5), indicating the important role of non-culprit plaque characteristics in prognostic prediction. Exploring novel risk factors with the aim of early identification of high-risk non-culprit plaques, therefore, is of great clinical significance for the prediction and prevention of recurrent cardiovascular events.
Insulin resistance (IR) has been recognized as one of the most significant risk factors associated with the development, progression, and prognosis of cardiovascular disease, independent of the glucometabolic status (6, 7). Triglyceride-glucose (TyG) index, a surrogate marker of IR being simple to calculate and easy to access from fasting triglyceride (TG) and fasting blood glucose (FBG), has been proposed and verified to be highly correlated to IR estimated by gold standard, the hyperinsulinaemic-euglycaemic clamp (8, 9). It has been demonstrated that higher TyG index can predict the incidence of cardiovascular risk factors including diabetes, prediabetes, and hypertension (10–12). More importantly, an increased level of TyG index has been also proved to play a pivotal role in the identification of individuals who are prone to cardiovascular disease and the prediction of adverse prognosis for patients with pre-existing cardiovascular disease (13–15).
At present, there is relatively inadequate evidence as regards the association between TyG index and non-culprit coronary plaque characteristics in patients who experienced ACS. The current study, therefore, was designed to explore the underlying relationship of TyG index with non-culprit plaque characteristics and phenotypes assessed by optical coherence tomography (OCT), a cross-sectional intracoronary imaging approach with high resolution providing the most detailed information about plaque morphology and microstructure, and to determine the potential of TyG index as a useful predictor for high-risk non-culprit plaques.
Methods
Study population
As a single-center cross-sectional study, we retrospectively screened patients admitted for coronary procedures at Beijing Anzhen Hospital, Capital Medical University, from January 2018 to December 2019. The inclusion criteria were summarized as follows: (1) age ≥ 18 years; (2) diagnosed as ST-segment elevation myocardial infarction or non-ST-segment elevation ACS; (3) underwent angiography and non-culprit OCT examination; (4) with at least one non-culprit plaque. Patients with missing medical records, extreme elevated body mass index (BMI), previous coronary artery bypass grafting, etc., and plaques with left main artery stenosis, extreme tortuosity, in-stent restenosis, etc. were excluded (details shown in Figure 1).
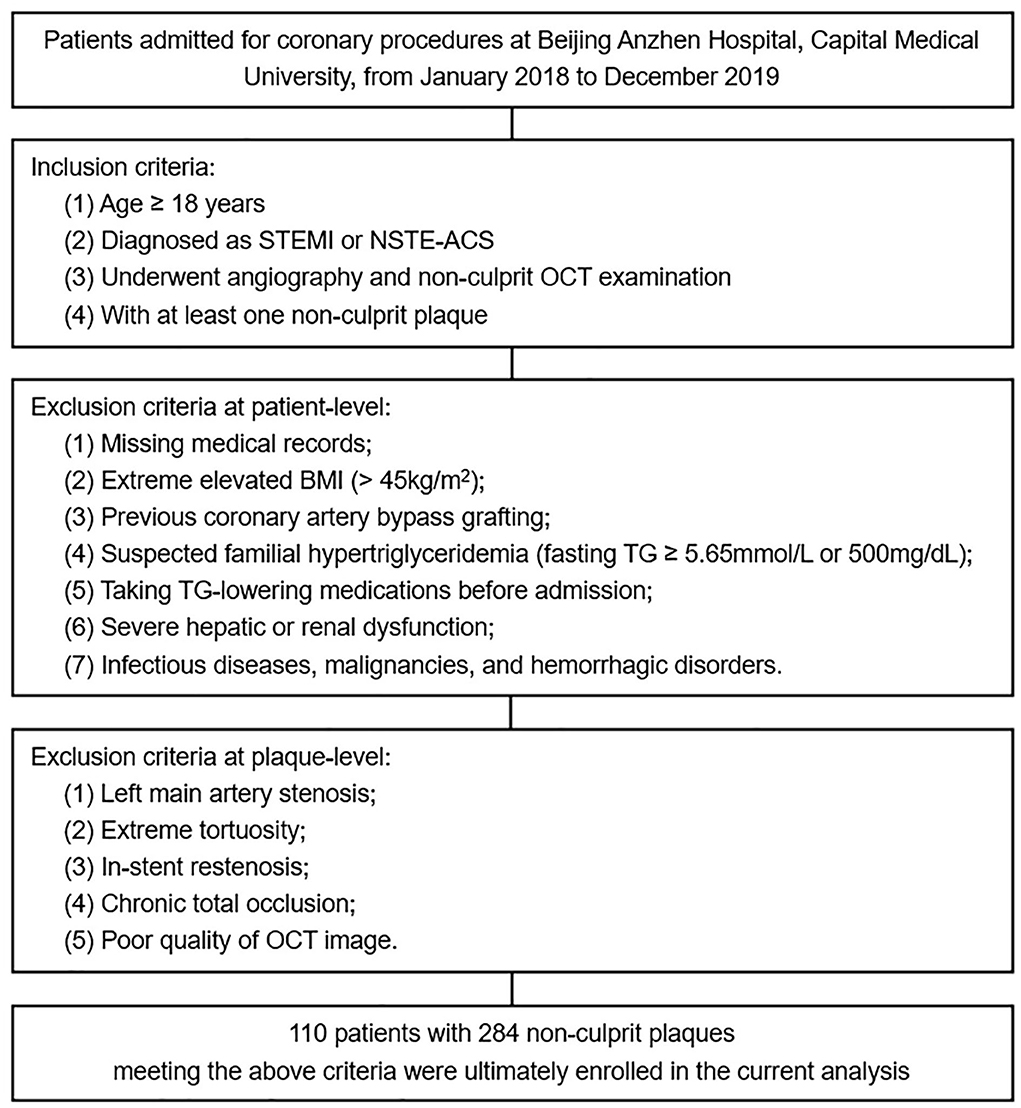
Figure 1. Flow diagram for the current study. STEMI, ST-segment elevation myocardial infarction; NSTE-ACS, non-ST-segment elevation acute coronary syndrome; OCT, optical coherence tomography; BMI, body mass index; TG, triglyceride.
The study was endorsed by the Clinical Research Ethics Committee of Beijing Anzhen Hospital, Capital Medical University. Consents were acquired from all enrolled patients for participating in the current analysis.
Baseline data collection
Information concerning demographics, anthropometrics, past medical history, and laboratory examinations was extracted from the medical record. Then the obtained information was inputted into an established electronic database by two independent personnel who were ignorant of the study design.
BMI was calculated as weight (kg)/[height (m)]2. Patients who were still smoking at admission or had been abstinent for <1 year were regarded as current smoking. Patients with pre-existing or newly diagnosed hypertension and/or diabetes mellitus during hospitalization were considered to have hypertension and/or diabetes mellitus. Previous medical history of myocardial infarction and percutaneous coronary intervention was acquired from self-report and then verified by referring to relevant data. Laboratory parameters collected for the current analysis were all tested in the central laboratory of the hospital by using venous samples with fasting time over 12 h. The TyG index was calculated as previously described: Ln [fasting TG (mg/dL) × FBG (mg/dL)/2] (8).
Angiographic and OCT-derived data interpretation
Coronary angiography and non-culprit OCT examination (The C7XR OCT system, St. Jude Medical, St. Paul, MN, USA) were performed by experienced cardiologists who were unaware of the study design. The angiographic and OCT-derived data were interpreted and recorded by two independent cardiologists who were blinded to the clinical and laboratory data of the study population. Disagreements encountered during the interpretation of angiographic and OCT images were settled by seeking help from another experienced cardiologist.
The cross-sectional OCT images were interpreted with 1 mm intervals. Non-culprit plaques were identified by OCT and defined as the presence of segments losing the normal 3-layered vessel structure in ≥ 3 consecutive cross-sectional images, excluding culprit plaques which were determined based on findings from angiogram, electrocardiogram, and/or echocardiogram. Segments with longitudinal distance of <5 mm or ≥ 5 mm were considered as single or independent plaques respectively.
Plaque characteristics were defined by referring to relevant consensus standards for OCT (16). Each plaque was categorized as fibrous plaque or lipid plaque. Fibrous plaque was characterized as homogeneous signal and high backscattering (Figure 2A), while lipid plaque was characterized as poor signal, low backscattering, and diffuse border (Figure 2B). When a lipid plaque was confirmed, fibrous cap thickness (FCT), lipid arc, lipid core length, and lipid index were determined subsequently. FCT was defined as the mean value of 3 measurements at the thinnest part of the fibrous cap (a signal-rich homogenous layer overlying the lipid plaque). Lipid arc was measured through the entire length of each lipid plaque, the maximum and mean value of which were then determined. Lipid core length was measured as the longitudinal span of the entire lipid core for each lipid plaque. Lipid index was calculated as lipid core length × mean lipid arc. Thin-cap fibroatheroma (TCFA) was defined as the lipid plaque with maximum lipid arc > 90° and FCT ≤ 65μm (Figure 2C). Ruptured plaque was characterized as the discontinuation of fibrous cap and the formation of cavity within the plaque (Figure 2D). Macrophage accumulation was manifested as signal-rich, distinct, or confluent punctuate region with higher intensity than background speckle noise (Figure 2E). Calcification was presented as the region with low backscattering, poor or heterogeneous signal, and sharp border inside the plaque (Figure 2F). Calcification arc was measured through the entire cross-sectional images and calcification length was acquired by interpreting the longitudinal view. Calcification with arc ≤ 90° and length of 1–4mm were classified as spotty calcification. Microchannel was identified as signal-poor tubular structure (50–300 μm) that presented in ≥3 consecutive cross-sectional images and not connected to the vessel lumen (Figure 2G). Cholesterol crystal was defined as the thin and linear structure within the plaque exhibited as high signal and backscattering (Figure 2H). Thrombus was manifested as the mass locating on the luminal surface of the plaque or floating within the lumen, the former of which was brought into the current analysis.
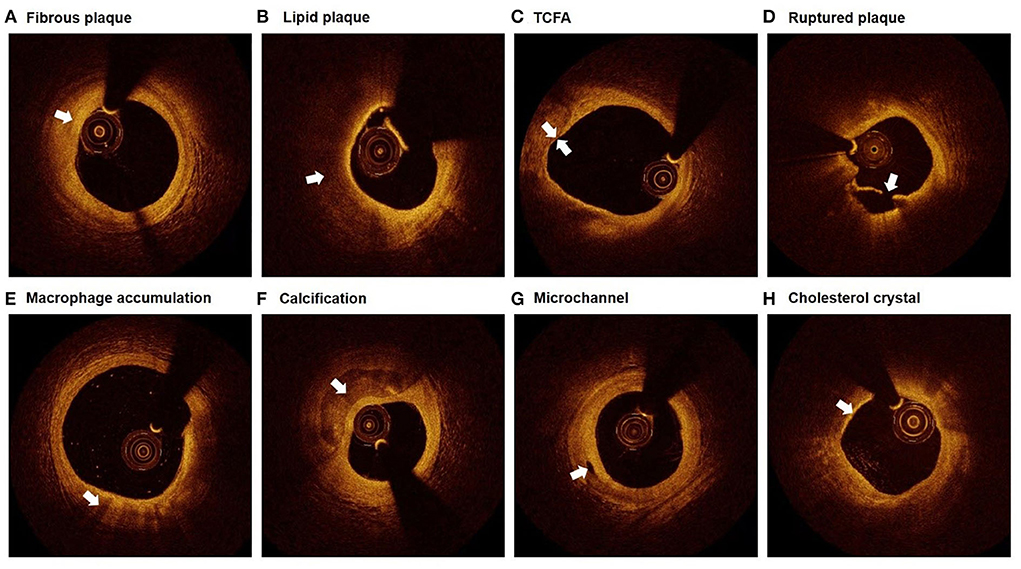
Figure 2. Representative plaque characteristics in OCT images. (A) Fibrous plaque: homogeneous signal and high backscattering; (B) Lipid plaque: poor signal, low backscattering, and diffuse border; (C) TCFA: lipid plaque with maximum lipid arc > 90° and FCT ≤ 65 μm; (D) Ruptured plaque: discontinuation of fibrous cap and the formation of cavity; (E) Macrophage accumulation: signal-rich, distinct, or confluent punctuate region with higher intensity than background speckle noise; (F) Calcification: low backscattering, poor or heterogeneous signal, and sharp border; (G) Microchannel: signal-poor tubular structure, present in ≥3 consecutive cross-sectional images, and not connected to the vessel lumen; (H) Cholesterol crystal: thin and linear structure with high signal and backscattering. TCFA, thin-cap fibroatheroma.
Statistical analysis
Continuous parameters with normal distribution were displayed as mean ± standard deviation and compared by T test. While for continuous variates with non-normal distribution, median with interquartile range was used for description and Mann-Whitney U test was performed to detect differences. Nominal parameters were described as absolute values with percentages and compared by Pearson chi-square test, chi-square test with continuity correction, or Fisher's exact test correspondingly. Correlation between TyG index and lipid plaque characteristics was evaluated by scatter plot and linear regression analysis. Univariate and multivariate logistic regression analyses were performed to evaluate the value of TyG index in the prediction of TCFA and ruptured plaque. Three multivariate models were established to investigate the independent role of TyG index in predicting TCFA and ruptured plaque, variates of which were selected with reference to univariate analysis and clinical experience. The odds ratio (OR) and 95% confidence interval (CI) were examined by taking TyG index as continuous (per 1-unit increase) and nominal (lower median as reference) variate respectively. The predictive value of TyG index for TCFA and ruptured plaque was further evaluated by receiver operating characteristic (ROC) analysis, basing on which the area under the ROC curve (AUC) and optimal cut-off value with sensitivity, specificity, positive predictive value (PPV), and negative predictive value (NPV) were determined. Moreover, to assess the improvement in predictive value after adding TyG index into the model of classical risk factors, AUCs for respective models were evaluated and compared by Z test. Meanwhile, continuous net reclassification improvement (NRI) and integrated discrimination improvement (IDI) were also calculated to further assess the incremental effect of TyG index on the predictive value.
Statistical analyses were performed with SPSS 26.0 (IBM, Armonk, New York, USA), MedCalc 19.1 (Ostend, Belgium), and R Programming Language 3.6.3. A two-side P < 0.05 was considered statistically significant.
Results
Baseline characteristics of the study population
In total, 110 patients with 284 non-culprit plaques who met the enrollment criteria were ultimately included in this study. The mean age of the study population was 54.8 ± 12.1 years, and 24.5% of them were female. Patients were divided into two groups based on the median of TyG index (median: 8.92), with 55 patients in each group. As manifested in Table 1, patients with higher median of TyG index, in comparison with those with lower median, exhibited higher levels of TG, uric acid, FBG, and glycosylated hemoglobin A1c. While the level of high-density lipoprotein cholesterol decreased significantly with the increasing median of TyG index.
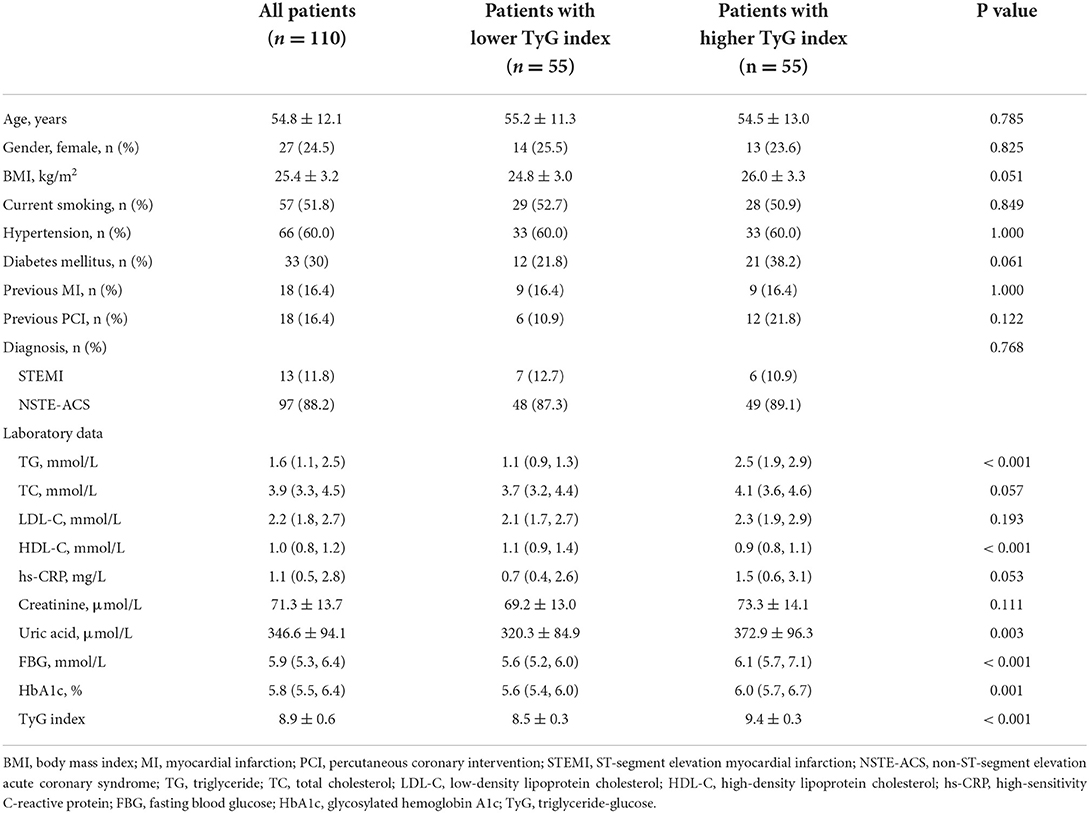
Table 1. Baseline characteristics of the study population.
TyG index is closely associated with nun-culprit plaque characteristics
As shown in Table 2, when evaluating the association of TyG index with OCT-derived plaque characteristics at patient-level, the results showed that patients with higher TyG index exhibited to have more non-culprit plaques [3.0 (2.0, 4.0) vs. 2.0 (1.0, 3.0), P = 0.036]. Moreover, the proportions of lipid plaque, TCFA, ruptured plaque, and macrophage accumulation were significantly higher in patients with higher TyG index.
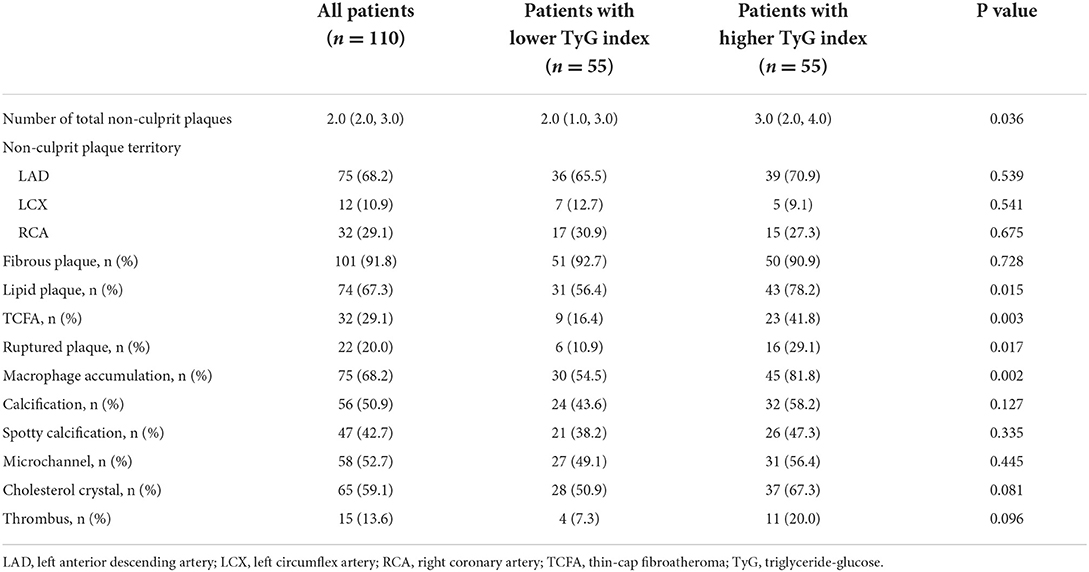
Table 2. Patient-level angiographic and OCT analysis of non-culprit plaques comparing lower vs. higher TyG index.
The relationship between TyG index and OCT-derived plaque characteristics was also assessed at plaque-level. Among the total 284 non-culprit plaques, those in higher TyG index group were more prone to be lipid plaque, TCFA, and ruptured plaque, and more likely to have macrophage accumulation, calcification, and microchannel (Table 3). Furthermore, as for lipid plaque characteristics, scatter plot and linear regression analysis were performed to investigate the correlation between TyG index and lipid plaque-related parameters, results of which revealed that there was a significant linear correlation between TyG index and FCT (R2 = 0.229, P = 0.008) (Figure 3A). The correlation of TyG index with maximum lipid arc, mean lipid arc, lipid core length, and lipid index, however, was not significant (all P > 0.05) (Figures 3B–E).
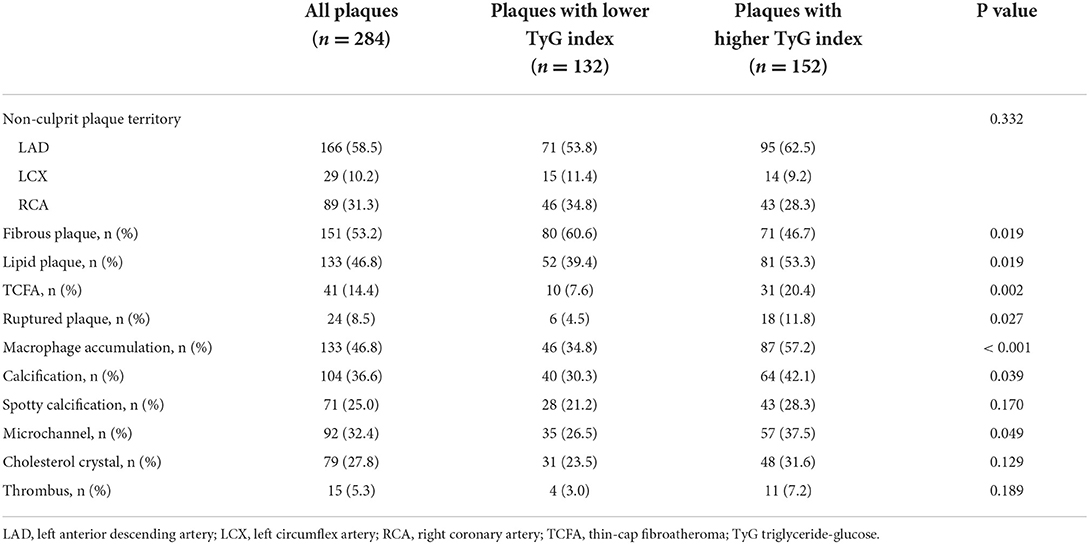
Table 3. Plaque-level angiographic and OCT analysis of non-culprit plaques comparing lower vs. higher TyG index.
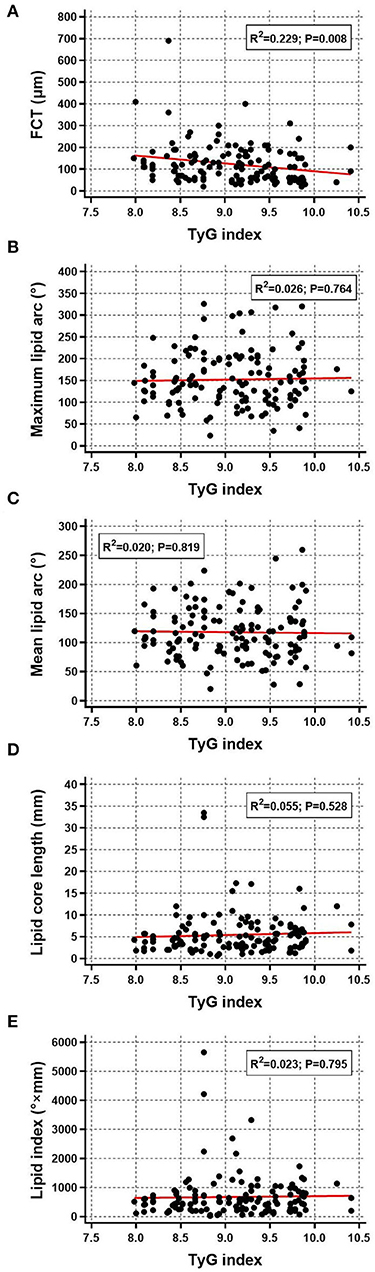
Figure 3. Correlation between TyG index and lipid plaque characteristics. Scatter plot and linear regression analysis were performed for TyG index and lipid plaque characteristics including (A) FCT, (B) maximum lipid arc, (C) mean lipid arc, (D) lipid core length, and (E) lipid index. FCT, fibrous cap thickness; TyG, triglyceride-glucose.
TyG index as an independent indicator of non-culprit TCFA and ruptured plaque
As mentioned above, the prevalence of TCFA and ruptured plaque went up as TyG index increased. Further univariate and multivariate logistic regression analyses were employed to confirm the association between TyG index and above two types of high-risk plaques. In univariate logistic regression analysis, elevated TyG index was consistent to be a significant indicator for TCFA (OR for per 1-unit increase 5.885, 95% CI 2.415–14.340, P < 0.001; OR for taking lower median as reference 3.674, 95% CI 1.504–8.972, P = 0.004) and ruptured plaque (OR for per 1–unit increase 3.905, 95% CI 1.566–9.736, P = 0.003; OR for taking lower median as reference 3.350, 95% CI 1.198–9.368, P = 0.021).
After taking the results from univariate analysis (Supplementary Table S1) and clinical experience into consideration, three multivariate models were established to investigate the independent association of TyG index with TCFA and ruptured plaque. The results revealed that a 1-unit increase of TyG index was independently and robustly associated with an increased risk of TCFA (Model 1: OR 5.838, 95% CI 2.353–14.485, P < 0.001; Model 2: OR 5.971, 95% CI 2.241–15.909, P < 0.001; Model 3: OR 4.940, 95% CI 1.652–14.767, P = 0.004) and ruptured plaque (Model 1: OR 5.349, 95% CI 1.883–15.197, P = 0.002; Model 2: OR 7.770, 95% CI 2.236–27.003, P = 0.001; Model 3: OR 7.065, 95% CI 1.910–26.133, P = 0.003). The independent association between TyG index and TCFA and ruptured plaque persisted when taking TyG index as a nominal variate (details shown in Table 4).
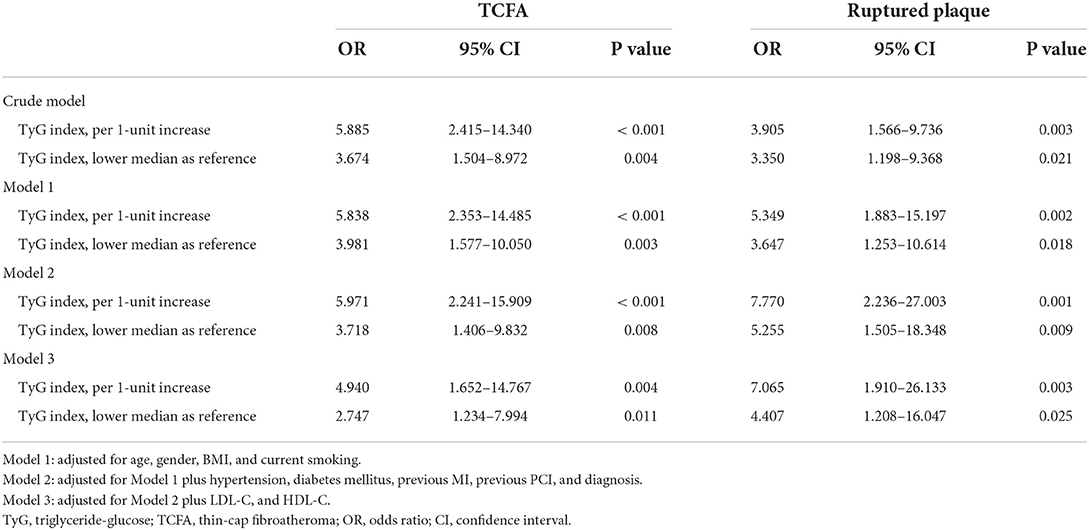
Table 4. Univariate and multivariate analysis evaluating the association of TyG index with non-culprit TCFA and ruptured plaque.
Predictive performance of TyG index for non-culprit TCFA and ruptured plaque
The predictive performance of TyG index for TCFA and ruptured plaque was evaluated by ROC curve analysis. As shown in Figure 4A, TyG index displayed a moderate-to-high strength in the prediction of TCFA, with an AUC of 0.754 (95% CI 0.651–0.856, P < 0.001). The optimal cut-off value was 9.07, under which the sensitivity, specificity, PPV, and NPV were 71.9, 70.5, 50.0%, and 85.9% respectively (Table 5). The predictive value of TyG index for ruptured plaque, however, was mild, with a relatively lower AUC (0.699, 95% CI 0.580–0.818, P = 0.001), and at the optimal cut-off value of 8.75, the sensitivity, specificity, PPV, and NPV were 81.8, 50.0, 29.0, and 91.7% separately (Figure 4B, Table 5).
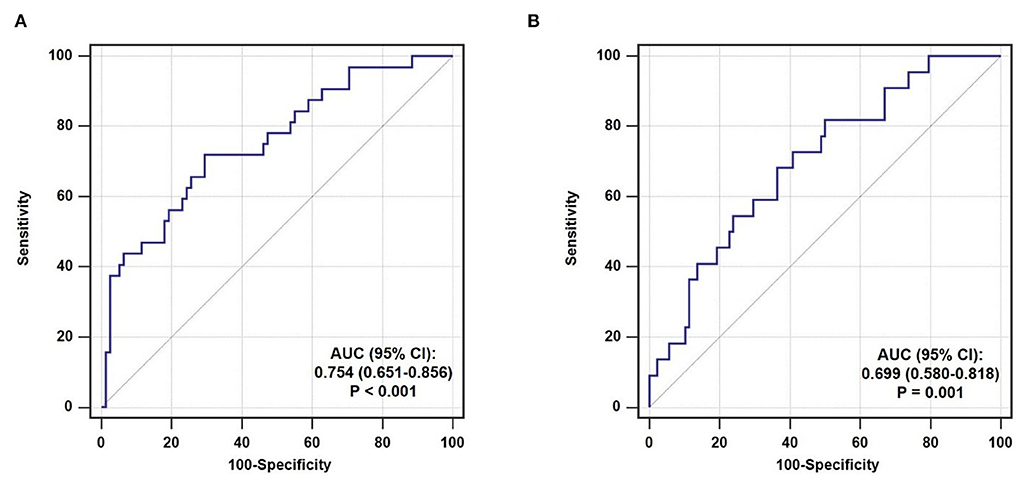
Figure 4. ROC curve analysis evaluating the predictive ability of TyG index for non-culprit (A) TCFA and (B) ruptured plaque. AUC, area under the ROC curve; CI, confidence interval.
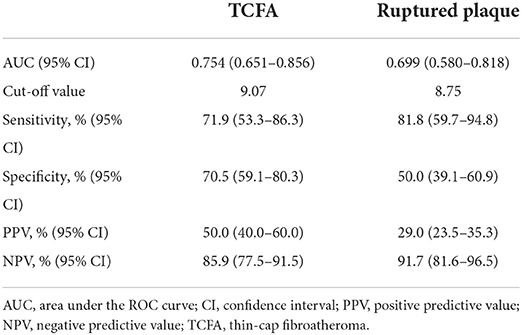
Table 5. Predictive performance of TyG index for non-culprit TCFA and ruptured plaque.
Incremental effect of TyG index on the prediction of non-culprit TCFA and ruptured plaque
After introducing TyG index into a baseline model, which consisted of classical risk factors including age, gender, BMI, current smoking, hypertension, diabetes mellitus, and low-density lipoprotein cholesterol, there was a significant incremental effect on the predictive value for TCFA, manifested as an increased AUC (0.681, 95% CI 0.570–0.793 vs. 0.782, 95% CI 0.688–0.877, P = 0.042) (Figure 5A). In addition, the continuous NRI (0.346, 95% CI 0.235–0.458, P < 0.001) and IDI (0.221, 95% CI 0.017–0.425, P = 0.034) were also significant (Table 6). Nevertheless, the addition of TyG index to the same baseline model failed to contribute to a significant incremental effect on the predictive value for ruptured plaque (AUC: 0.713, 95% CI 0.606–0.820 vs. 0.782, 95% CI 0.674–0.889, P = 0.162; continuous NRI: 0.000, 95% CI −0.191–0.191, P > 0.999; IDI: 0.000, 95% CI −0.194–0.194, P > 0.999) (Figure 5B, Table 6).
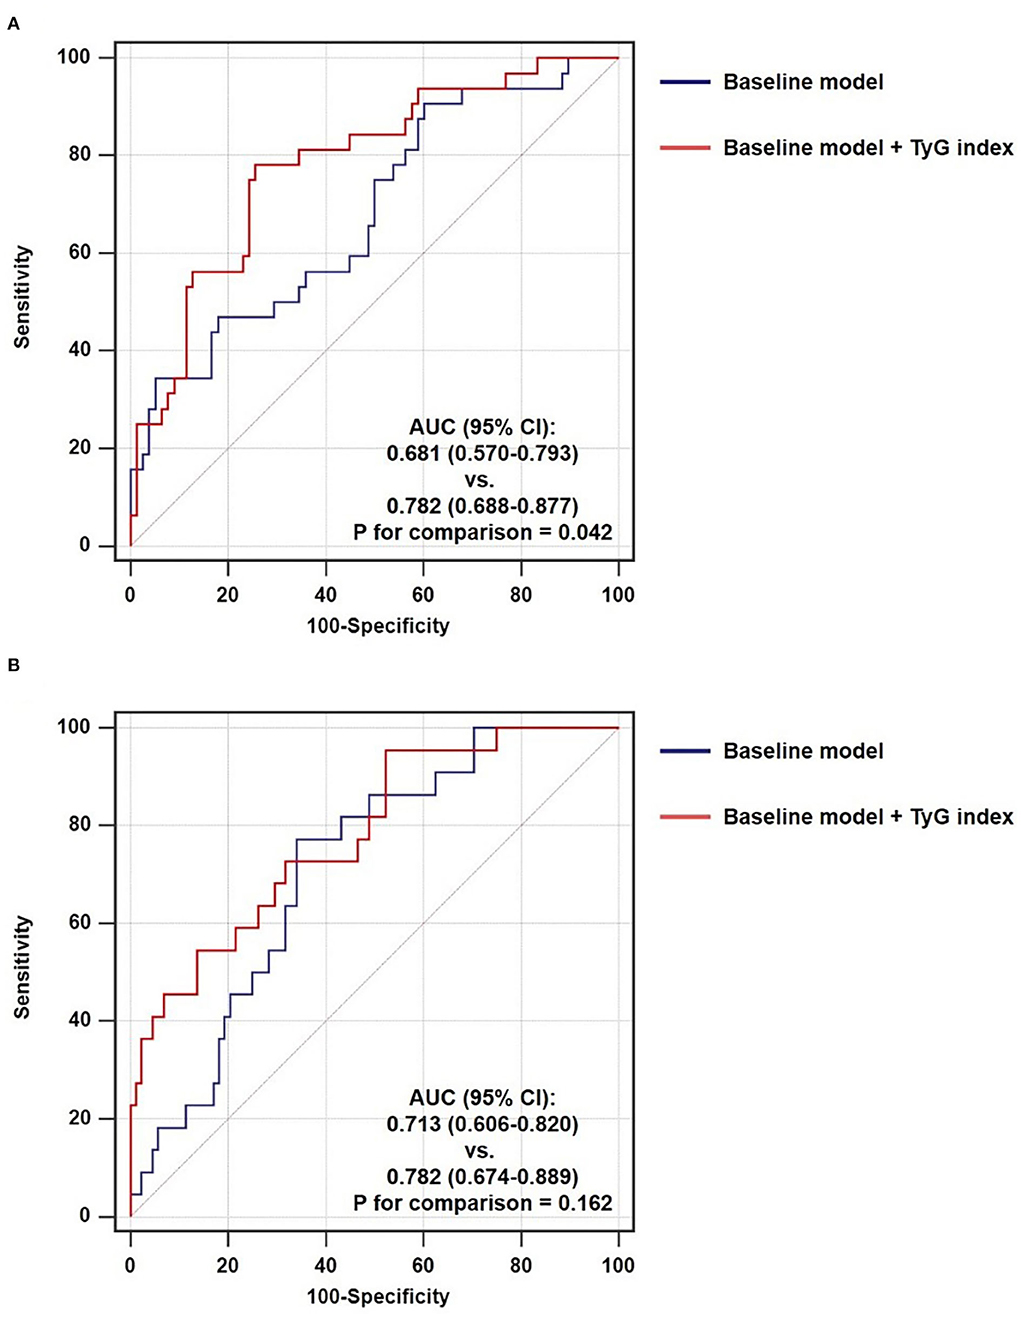
Figure 5. Incremental ability of TyG index on the prediction of non-culprit (A) TCFA and (B) ruptured plaque beyond a baseline model. AUC, area under the ROC curve; CI, confidence interval; TyG, triglyceride-glucose.
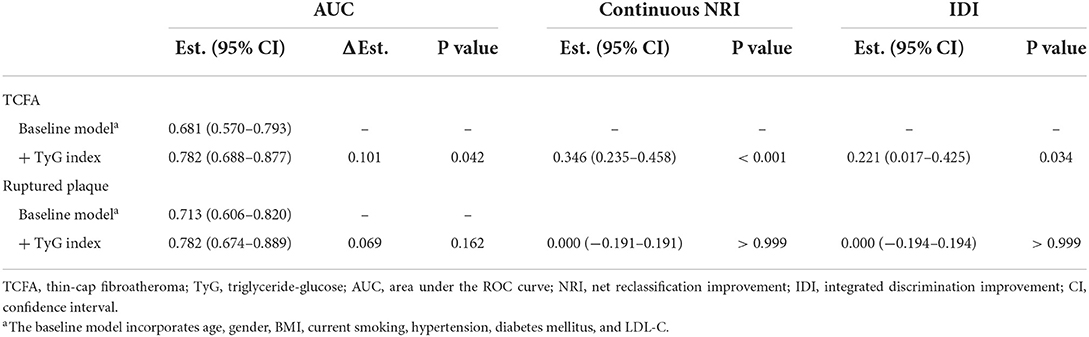
Table 6. Incremental ability of TyG index on the predictive performance for non-culprit TCFA and ruptured plaque beyond classical risk factors.
Discussion
To our knowledge, the present study is the first to investigate the association between IR evaluated by TyG index and non-culprit coronary plaque characteristics assessed by OCT in patients following ACS. The major findings are as follows: (1) there was a close association between TyG index and high-risk plaque characteristics; (2) TyG index remained to be independently and robustly associated with high-risk plaques including TCFA and ruptured plaque with the adjustment of various multivariate models, despite being taken as a continuous or nominal variate; (3) the predictive value of TyG index for TCFA and ruptured plaque was moderate-to-high; (4) after being introduced into a baseline model, TyG index exhibited a significant incremental effect on the predictive value for TCFA, but not for ruptured plaque.
Methods for estimation of IR and the superiority of TyG index
IR has been comprehensively demonstrated to be significantly associated with the prevalence, development, and prognosis of cardiovascular disease (6, 7). Thus, it appeals to great requirements on quantification of IR levels for individuals susceptible to or with pre-existing cardiovascular disease, with the aim to provide more information on risk prediction and stratification. Since the gold standard method for assessing IR, the hyperinsulinaemic-euglycaemic clamp, is complex, time-consuming, and expensive to operate, various surrogate markers of IR have been proposed for estimating the level of IR alternatively and verified to be highly correlated to the hyperinsulinaemic-euglycaemic clamp (17), which makes it possible to evaluate the extent of IR more quickly and feasibly, while maintaining accuracy.
Homeostasis model assessment of insulin resistance (HOMA-IR), which is calculated from FBG and fasting insulin, is used to being considered as the most recognized surrogate marker of IR (17). However, the examination of fasting insulin is not routinely performed in daily clinical processes, even for patients having experienced diabetes mellitus. In addition, although healthy subjects may manifest as a wide range of IR levels, fasting insulin values maintain within narrow ranges, suggesting that small but clinically relevant changes in IR may be masked by indicators calculated from fasting insulin that appear normal. Furthermore, there is a lack of consistent standards for the measurement of insulin, which results in nonnegligible heterogeneity across laboratories from different centers, especially for non-diabetic patients whose insulin concentration keeps at low levels. The limitations described above, therefore, make HOMA-IR relatively inadaptable for extensive application in clinical practice. As a surrogate marker of IR, the TyG index, which is simply derived from fasting TG and FBG, has been established and proved to be highly associated with IR evaluated by the gold standard (8). The merits of simplicity, accessibility, inexpensiveness, and insulin-independence make it a more promising indicator for the estimation of IR levels, particularly in daily clinical work and large-scale epidemiological researches.
Association between TyG index and cardiovascular disease
The significant association of TyG index with the occurrence of cardiovascular disease and recurrent cardiovascular events has been fully investigated and confirmed by certain previous studies. In general population who has never experienced a cardiovascular disease, an elevated TyG index was demonstrated to be observably related to the increased risk of developing CAD, ischemic stroke, and peripheral artery disease (18–21). More importantly, this relationship has been further verified by a recent meta-analysis of eight cohort studies (22), indicating that TyG index plays an important role in early identification of individuals who were at high risk of being subjected to cardiovascular disease. On the other hand, for patients who have experienced cardiovascular disease, a great deal of studies has shown that TyG index is significantly and independently associated with the risk of recurrent cardiovascular events (14, 23, 24), suggesting the great potential of TyG index as a valuable prognostic predictor.
Previous studies have revealed that IR assessed by HOMA-IR is significantly related to coronary plaque vulnerability (25, 26). However, as mentioned above, the insulin-dependence of HOMA-IR restrains it from extensive application in clinical practice. An elevated TyG index has been revealed to be closely related to higher prevalence of unstable carotid plaque identified by ultrasonography (27) and increased coronary plaque volume assessed by coronary computed tomography angiography (28). The association between TyG index and coronary plaque characteristics, confirmation of which can further expose the underlying mechanism mediating the relationship of TyG index with recurrent coronary events at the pathological and anatomical level, however, has not been fully investigated. The present study, which verified the close association of TyG index with non-culprit plaque characteristics and further identified the independent role of TyG index on the prediction of high-risk non-culprit plaques including TCFA and ruptured plaque, fills in the blank of previous studies in this field. It has been also revealed that after being introduced into a baseline model including traditional risk factors, TyG index significantly improved the predictive value for non-culprit TCFA, suggesting that more messages involving the prediction of vulnerable plaques can be offered by TyG index on the basis of traditional risk factors. The results of the present study indicate the great potential of TyG index to be served as a significant surrogate marker of IR providing valuable information on the evaluation of non-culprit plaque features in patients with ACS.
Potential mechanisms for the relationship of TyG index with cardiovascular disease
As previous study demonstrated, fasting TG and FBG, the determinants of TyG index, mainly reflects the level of IR from adipose tissue and liver respectively, which are the two most significant dimensions for the IR of whole organism (10). The close correlation between TyG index and the hyperinsulinaemic-euglycaemic clamp, the gold standard technique for assessing the IR, has been exactly confirmed by former studies (8, 9), indicating the important role of IR in mediating the association between TyG index and cardiovascular disease. It has been elucidated that IR is closely related to endothelial dysfunction, oxidative stress, proliferation and migration of smooth muscle cells, and activation of inflammatory reaction (6, 7, 29–31), all of which have been recognized as important pathogenesis for the formation of atherosclerosis. Furthermore, TyG index has been also revealed to be correlated to thrombosis imbalance, cardiovascular remodeling, microcirculatory dysregulation, and impaired myocardial perfusion (6, 7, 32), which may be the underlying explanations for the significant predictive value of TyG index for recurrent cardiovascular events.
Additionally, it has been also revealed that TyG index is significantly associated with vascular calcification (33, 34) and arterial stiffness (35), both of which are indicators of atherosclerosis and important for early prediction of cardiovascular disease. Moreover, former studies have also demonstrated that individuals with a higher level of TyG index were often exhibited to be more likely to combine with various traditional risk factors for cardiovascular disease including diabetes (10), prediabetes (11), hypertension (12, 36), renal dysfunction (37), and hyperuricemia (38).
Therapeutic implications of IR for cardiovascular disease
Previous studies showed that therapeutic lifestyle changes including Mediterranean diet, plenty of exercises, and loss of weight may significantly mitigate the degree of IR, then improve the condition of cardiovascular risk factors and decrease the risk of cardiovascular disease (39–42). As the most evidenced insulin-sensitizing agent, pioglitazone has been verified to have prominent effects on reducing cardiovascular risks in patients with various glucometabolic statuses, despite of with or without baseline cardiovascular disease (43–45). It has been further revealed that the protective effects of pioglitazone on cardiovascular disease may be induced by increased insulin sensitivity and improved IR, rather than decreased blood glucose (46). The results of previous studies indicated that interventions against IR may play an important role in the prevention of cardiovascular disease and recurrent adverse events. Regarding the significant association between TyG index and coronary plaque characteristics having been confirmed by the present study, there is a need for further interventional trials to investigate whether interventions targeting at alleviating the extent of IR assessed by TyG index perform a positive impact on the deferral or even reversion of the progression of coronary plaques.
Study limitations
Following limitations of the present study should be noted. Firstly, this is a single-center, observational, and cross-sectional study, which makes it hard to identify the causal relationship between TyG index and high-risk plaques. And the relatively smaller sample size may limit the statistical power. Secondly, only patients with ACS and received OCT examinations were enrolled for the current analysis, which may cause selection bias and inextensibility to other population. Thirdly, the hyperinsulinaemic-euglycaemic clamp and HOMA-IR were not accessible in this study, leading to the lack of comparison between TyG index and them in identifying high-risk plaques. Finally, TyG index and OCT-derived plaque characteristics were evaluated only once during hospitalization, further studies are required to dynamically monitor TyG index and plaque characteristics, with the aim to investigate the association between change in TyG index and plaque progression.
Conclusion
TyG index is significantly and independently associated with TCFA and ruptured plaque identified by OCT examination in patients who were diagnosed with ACS. TyG index, a surrogate marker of IR simply calculated from fasting TG and FBG, can be served as an important and independent risk predictor for high-risk non-culprit coronary plaques in patients who experience an ACS.
Data availability statement
The original contributions presented in the study are included in the article/Supplementary material, further inquiries can be directed to the corresponding author.
Ethics statement
Written informed consent was obtained from the individual(s) for the publication of any potentially identifiable images or data included in this article.
Author contributions
Z-WZ made substantial contributions to study design, data analysis, and manuscript writing. Y-JZ made substantial contributions to study design, intellectual direction, and manuscript revision. CL, QZ, Y-KX, Y-JC, and T-NS made substantial contributions to data collection and interpretation. All authors have read and approved the final manuscript.
Funding
This work was supported by the grant from National Key Research and Development Program of China (2017YFC0908800), Beijing Municipal Administration of Hospitals Mission plan (SML20180601), Capital's Funds for Health Improvement and Research (CFH2020-2-2063), KM200910025012, and Beijing Municipal Natural Science Foundation (7202041).
Conflict of interest
The authors declare that the research was conducted in the absence of any commercial or financial relationships that could be construed as a potential conflict of interest.
Publisher's note
All claims expressed in this article are solely those of the authors and do not necessarily represent those of their affiliated organizations, or those of the publisher, the editors and the reviewers. Any product that may be evaluated in this article, or claim that may be made by its manufacturer, is not guaranteed or endorsed by the publisher.
Supplementary material
The Supplementary Material for this article can be found online at: https://www.frontiersin.org/articles/10.3389/fcvm.2022.1019233/full#supplementary-material
References
1. Dai H, Much AA, Maor E, Asher E, Younis A, Xu Y, et al. Global, regional, and national burden of ischaemic heart disease and its attributable risk factors, 1990–2017: results from the Global Burden of Disease Study 2017. Eur Heart J. (2020) 8:50–60. doi: 10.1093/ehjqcco/qcaa076
2. Schwartz GG, Steg PG, Szarek M, Bhatt DL, Bittner VA, Diaz R, et al. Alirocumab and cardiovascular outcomes after acute coronary syndrome. N Engl J Med. (2018) 379:2097–107. doi: 10.1056/NEJMoa1801174
3. Sabatine MS, Giugliano RP, Keech AC, Honarpour N, Wiviott SD, Murphy SA, et al. Evolocumab and clinical outcomes in patients with cardiovascular disease. N Engl J Med. (2017) 376:1713–22. doi: 10.1056/NEJMoa1615664
4. Zhao X, Wang Y, Chen R, Li J, Zhou J, Liu C, et al. Triglyceride glucose index combined with plaque characteristics as a novel biomarker for cardiovascular outcomes after percutaneous coronary intervention in ST-elevated myocardial infarction patients: an intravascular optical coherence tomography study. Cardiovasc Diabetol. (2021) 20:131. doi: 10.1186/s12933-021-01321-7
5. Kubo T, Ino Y, Mintz GS, Shiono Y, Shimamura K, Takahata M, et al. Optical coherence tomography detection of vulnerable plaques at high risk of developing acute coronary syndrome. Eur Heart J Cardiovasc Imaging. (2021). doi: 10.1093/ehjci/jeab028
6. Laakso M, Kuusisto J. Insulin resistance and hyperglycaemia in cardiovascular disease development. Nat Rev Endocrinol. (2014) 10:293–302. doi: 10.1038/nrendo.2014.29
7. Ormazabal V, Nair S, Elfeky O, Aguayo C, Salomon C, Zuñiga FA. Association between insulin resistance and the development of cardiovascular disease. Cardiovasc Diabetol. (2018) 17:122. doi: 10.1186/s12933-018-0762-4
8. Guerrero-Romero F, Simental-Mendia LE, Gonzalez-Ortiz M, Martinez-Abundis E, Ramos-Zavala MG, Hernandez-Gonzalez SO, et al. The product of triglycerides and glucose, a simple measure of insulin sensitivity. Comparison with the euglycemic-hyperinsulinemic clamp. J Clin Endocrinol Metab. (2010) 95:3347–51. doi: 10.1210/jc.2010-0288
9. Fiorentino TV, Marini MA, Succurro E, Andreozzi F, Sesti G. Relationships of surrogate indexes of insulin resistance with insulin sensitivity assessed by euglycemic hyperinsulinemic clamp and subclinical vascular damage. BMJ Open Diabetes Res Care. (2019) 7:e911. doi: 10.1136/bmjdrc-2019-000911
10. Low S, Khoo K, Irwan B, Sum CF, Subramaniam T, Lim SC, et al. The role of triglyceride glucose index in development of type 2 diabetes mellitus. Diabetes Res Clin Pract. (2018) 143:43–9. doi: 10.1016/j.diabres.2018.06.006
11. Ramírez-Vélez R, Pérez-Sousa MÁ, González-Ruíz K, Cano-Gutierrez CA, Schmidt-RioValle J, Correa-Rodríguez M, et al. Obesity- and lipid-related parameters in the identification of older adults with a high risk of prediabetes according to the American Diabetes Association: an analysis of the 2015 Health, Well-Being, and Aging Study. Nutrients. (2019) 11:2654. doi: 10.3390/nu11112654
12. Wang Y, Yang W, Jiang X. Association between triglyceride-glucose index and hypertension: a meta-analysis. Front Cardiovasc Med. (2021) 8:644035. doi: 10.3389/fcvm.2021.644035
13. Tian X, Zuo Y, Chen S, Liu Q, Tao B, Wu S, et al. Triglyceride-glucose index is associated with the risk of myocardial infarction: an 11-year prospective study in the Kailuan cohort. Cardiovasc Diabetol. (2021) 20:19. doi: 10.1186/s12933-020-01210-5
14. Zhang Y, Ding X, Hua B, Liu Q, Gao H, Chen H, et al. Predictive effect of triglyceride-glucose index on clinical events in patients with type 2 diabetes mellitus and acute myocardial infarction: results from an observational cohort study in China. Cardiovasc Diabetol. (2021) 20:43. doi: 10.1186/s12933-021-01236-3
15. Jin JL, Cao YX, Wu LG, You XD, Guo YL, Wu NQ, et al. Triglyceride glucose index for predicting cardiovascular outcomes in patients with coronary artery disease. J Thorac Dis. (2018) 10:6137–46. doi: 10.21037/jtd.2018.10.79
16. Tearney GJ, Regar E, Akasaka T, Adriaenssens T, Barlis P, Bezerra HG, et al. Consensus standards for acquisition, measurement, and reporting of intravascular optical coherence tomography studies: a report from the International Working Group for Intravascular Optical Coherence Tomography Standardization and Validation. J Am Coll Cardiol. (2012) 59:1058–72. doi: 10.1016/j.jacc.2011.09.079
17. Antuna-Puente B, Disse E, Rabasa-Lhoret R, Laville M, Capeau J, Bastard JP. How can we measure insulin sensitivity/resistance? Diabetes Metab. (2011) 37:179–88. doi: 10.1016/j.diabet.2011.01.002
18. Cho Y, Ann SH, Won K, Park G, Kim Y, Yang DH, et al. Association between insulin resistance, hyperglycemia, and coronary artery disease according to the presence of diabetes. Sci Rep. (2019) 9:6129. doi: 10.1038/s41598-019-42700-1
19. Park G, Cho Y, Won K, Yang YJ, Park S, Ann SH, et al. Triglyceride glucose index is a useful marker for predicting subclinical coronary artery disease in the absence of traditional risk factors. Lipids Health Dis. (2020) 19:7. doi: 10.1186/s12944-020-1187-0
20. Wang A, Wang G, Liu Q, Zuo Y, Chen S, Tao B, et al. Triglyceride-glucose index and the risk of stroke and its subtypes in the general population: an 11-year follow-up. Cardiovasc Diabetol. (2021) 20:46. doi: 10.1186/s12933-021-01238-1
21. Gao JW, Hao QY, Gao M, Zhang K, Li XZ, Wang JF, et al. Triglyceride-glucose index in the development of peripheral artery disease: findings from the Atherosclerosis Risk in Communities (ARIC) Study. Cardiovasc Diabetol. (2021) 20:126. doi: 10.1186/s12933-021-01319-1
22. Ding X, Wang X, Wu J, Zhang M, Cui M. Triglyceride-glucose index and the incidence of atherosclerotic cardiovascular diseases: a meta-analysis of cohort studies. Cardiovasc Diabetol. (2021) 20:76. doi: 10.1186/s12933-021-01268-9
23. Jin JL, Sun D, Cao YX, Guo YL, Wu NQ, Zhu CG, et al. Triglyceride glucose and haemoglobin glycation index for predicting outcomes in diabetes patients with new-onset, stable coronary artery disease: a nested case-control study. Ann Med. (2018) 50:576–86. doi: 10.1080/07853890.2018.1523549
24. Mao Q, Zhou D, Li Y, Wang Y, Xu S, Zhao X. The triglyceride-glucose index predicts coronary artery disease severity and cardiovascular outcomes in patients with non-ST-segment elevation acute coronary syndrome. Dis Markers. (2019) 2019:6891537. doi: 10.1155/2019/6891537
25. Iguchi T, Hasegawa T, Otsuka K, Matsumoto K, Yamazaki T, Nishimura S, et al. Insulin resistance is associated with coronary plaque vulnerability: insight from optical coherence tomography analysis. Eur Heart J Cardiovasc Imaging. (2014) 15:284–91. doi: 10.1093/ehjci/jet158
26. Wu S, Liu W, Ma Q, Yu W, Guo Y, Zhao Y, et al. Association between insulin resistance and coronary plaque vulnerability in patients with acute coronary syndromes: insights from optical coherence tomography. Angiology. (2019) 70:539–46. doi: 10.1177/0003319718809931
27. Wang A, Tian X, Zuo Y, Zhang X, Wu S, Zhao X. Association between the triglyceride-glucose index and carotid plaque stability in nondiabetic adults. Nutr Metab Cardiovasc Dis. (2021). doi: 10.1016/j.numecd.2021.06.019
28. Won KB, Lee BK, Park HB, Heo R, Lee SE, Rizvi A, et al. Quantitative assessment of coronary plaque volume change related to triglyceride glucose index: the Progression of AtheRosclerotic PlAque DetermIned by Computed TomoGraphic Angiography IMaging (PARADIGM) registry. Cardiovasc Diabetol. (2020) 19:113. doi: 10.1186/s12933-020-01081-w
29. DeFronzo RA. Insulin resistance, lipotoxicity, type 2 diabetes and atherosclerosis: the missing links. The Claude Bernard Lecture 2009. Diabetologia. (2010) 53:1270–87. doi: 10.1007/s00125-010-1684-1
30. Zeng G, Nystrom FH, Ravichandran LV, Cong LN, Kirby M, Mostowski H, et al. Roles for insulin receptor, PI3-kinase, and Akt in insulin-signaling pathways related to production of nitric oxide in human vascular endothelial cells. Circulation. (2000) 101:1539–45. doi: 10.1161/01.CIR.101.13.1539
31. Wang CC, Goalstone ML, Draznin B. Molecular mechanisms of insulin resistance that impact cardiovascular biology. Diabetes. (2004) 53:2735–40. doi: 10.2337/diabetes.53.11.2735
32. Markus M, Rospleszcz S, Ittermann T, Baumeister SE, Schipf S, Siewert-Markus U, et al. Glucose and insulin levels are associated with arterial stiffness and concentric remodeling of the heart. Cardiovasc Diabetol. (2019) 18:145. doi: 10.1186/s12933-019-0948-4
33. Chen Y, Chang Z, Zhao Y, Liu Y, Fu J, Zhang Y, et al. Association between the triglyceride-glucose index and abdominal aortic calcification in adults: a cross-sectional study. Nutr Metab Cardiovasc Dis. (2021) 31:2068–76. doi: 10.1016/j.numecd.2021.04.010
34. Park K, Ahn CW, Lee SB, Kang S, Nam JS, Lee BK, et al. Elevated TyG index predicts progression of coronary artery calcification. Diabetes Care. (2019) 42:1569–73. doi: 10.2337/dc18-1920
35. Won K, Park G, Lee S, Cho I, Kim HC, Lee BK, et al. Relationship of insulin resistance estimated by triglyceride glucose index to arterial stiffness. Lipids Health Dis. (2018) 17:268. doi: 10.1186/s12944-018-0914-2
36. Zheng R, Mao Y. Triglyceride and glucose (TyG) index as a predictor of incident hypertension: a 9-year longitudinal population-based study. Lipids Health Dis. (2017) 16:175. doi: 10.1186/s12944-017-0562-y
37. Fritz J, Brozek W, Concin H, Nagel G, Kerschbaum J, Lhotta K, et al. The triglyceride-glucose index and obesity-related risk of end-stage kidney disease in Austrian adults. JAMA Netw Open. (2021) 4:e212612. doi: 10.1001/jamanetworkopen.2021.2612
38. Mazidi M, Katsiki N, Mikhailidis DP, Banach M. The link between insulin resistance parameters and serum uric acid is mediated by adiposity. Atherosclerosis. (2018) 270:180–6. doi: 10.1016/j.atherosclerosis.2017.12.033
39. Kastorini CM, Milionis HJ, Esposito K, Giugliano D, Goudevenos JA, Panagiotakos DB. The effect of Mediterranean diet on metabolic syndrome and its components: a meta-analysis of 50 studies and 534,906 individuals. J Am Coll Cardiol. (2011) 57:1299–313. doi: 10.1016/j.jacc.2010.09.073
40. Flegal KM, Kit BK, Orpana H, Graubard BI. Association of all-cause mortality with overweight and obesity using standard body mass index categories: a systematic review and meta-analysis. JAMA. (2013) 309:71–82. doi: 10.1001/jama.2012.113905
41. Fall T, Hägg S, Ploner A, Mägi R, Fischer K, Draisma HH, et al. Age- and sex-specific causal effects of adiposity on cardiovascular risk factors. Diabetes. (2015) 64:1841–52. doi: 10.2337/db14-0988
42. Eckel RH, Jakicic JM, Ard JD, de Jesus JM, Houston MN, Hubbard VS, et al. 2013 AHA/ACC guideline on lifestyle management to reduce cardiovascular risk: a report of the American College of Cardiology/American Heart Association Task Force on Practice Guidelines. Circulation. (2014) 129:S76–99. doi: 10.1161/01.cir.0000437740.48606.d1
43. Liao HW, Saver JL, Wu YL, Chen TH, Lee M, Ovbiagele B. Pioglitazone and cardiovascular outcomes in patients with insulin resistance, pre-diabetes and type 2 diabetes: a systematic review and meta-analysis. BMJ Open. (2017) 7:e13927. doi: 10.1136/bmjopen-2016-013927
44. Lincoff AM, Wolski K, Nicholls SJ, Nissen SE. Pioglitazone and risk of cardiovascular events in patients with type 2 diabetes mellitus: a meta-analysis of randomized trials. JAMA. (2007) 298:1180–8. doi: 10.1001/jama.298.10.1180
45. Kernan WN, Viscoli CM, Furie KL, Young LH, Inzucchi SE, Gorman M, et al. Pioglitazone after ischemic stroke or transient ischemic attack. N Engl J Med. (2016) 374:1321–31. doi: 10.1056/NEJMoa1506930
Keywords: triglyceride-glucose index, optical coherence tomography, non-culprit coronary plaque, acute coronary syndrome, risk predictor
Citation: Zhao Z-W, Liu C, Zhao Q, Xu Y-K, Cheng Y-J, Sun T-N and Zhou Y-J (2022) Triglyceride-glucose index and non-culprit coronary plaque characteristics assessed by optical coherence tomography in patients following acute coronary syndrome: A cross-sectional study. Front. Cardiovasc. Med. 9:1019233. doi: 10.3389/fcvm.2022.1019233
Received: 14 August 2022; Accepted: 27 September 2022;
Published: 12 October 2022.
Edited by:
Yoshihiro Miyamoto, National Cerebral and Cardiovascular Center, JapanReviewed by:
Thomas Milner, University of California, Irvine, United StatesFederico Vancheri, S. Elia Hospital, Italy
Copyright © 2022 Zhao, Liu, Zhao, Xu, Cheng, Sun and Zhou. This is an open-access article distributed under the terms of the Creative Commons Attribution License (CC BY). The use, distribution or reproduction in other forums is permitted, provided the original author(s) and the copyright owner(s) are credited and that the original publication in this journal is cited, in accordance with accepted academic practice. No use, distribution or reproduction is permitted which does not comply with these terms.
*Correspondence: Yu-Jie Zhou, azzyj12@163.com