The Triglyceride-Glucose Index, an Insulin Resistance Marker, Was Non-linear Associated With All-Cause and Cardiovascular Mortality in the General Population
 Xiao-cong Liu
 Guo-dong He
 Kenneth Lo
 Yu-qing Huang
 Ying-qing Feng
- 1Department of Cardiology, Guangdong Cardiovascular Institute, Guangdong Provincial People's Hospital, Guangdong Academy of Medical Sciences, Guangzhou, China
- 2Department of Epidemiology, Center for Global Cardio-Metabolic Health, Brown University, Providence, RI, United States
- 3Department of Applied Biology and Chemical Technology, The Hong Kong Polytechnic University, Hung Hom, China
Background: The triglyceride-glucose (TyG) index could serve as a convenient substitute of insulin resistance (IR), but epidemiological evidence on its relationship with the long-term risk of mortality is limited.
Methods: Participants from the National Health and Nutrition Examination Survey during 1999–2014 were grouped according to TyG index (<8, 8–9, 9–10, >10). Cox regression was conducted to compute the hazard ratios (HRs) and 95% confidence interval (CI). Restricted cubic spline and piecewise linear regression were performed to detect the shape of the relationship between TyG index and mortality.
Results: A total of 19,420 participants (48.9% men) were included. On average, participants were followed-up for 98.2 months, and 2,238 (11.5%) and 445 (2.3%) cases of mortality due to all-cause or cardiovascular disease were observed. After adjusting for confounders, TyG index was independently associated with an elevated risk of all-cause (HR, 1.10; 95% CI, 1.00–1.20) and cardiovascular death (HR, 1.29; 95% CI, 1.05–1.57). Spline analyses showed that the relationship of TyG index with mortality was non-linear (All non-linear P < 0.001), and the threshold value were 9.36 for all-cause and 9.52 for cardiovascular death, respectively. The HRs above the threshold point were 1.50 (95% CI, 1.29–1.75) and 2.35 (95% CI, 1.73–3.19) for all-cause and cardiovascular death. No significant difference was found below the threshold points (All P > 0.05).
Conclusion: Elevated TyG index reflected a more severe IR and was associated with mortality due to all-cause and cardiovascular disease in a non-linear manner.
Introduction
Insulin resistance (IR) is an insensitivity state of the peripheral tissues and has been recognized as a major pathological feature of type 2 diabetes (1, 2). IR implies the defects in glucose uptake, reduction in glycogenesis synthesis, and decrement in suppressing lipid oxidation (3). In such a condition, to maintain glucose homeostasis, insulin secretion is increased and leads to chronic hyperinsulinemia, and therefore elevated oxidative stress and inflammatory responses (1, 4). IR may also impair lipid and serum urate metabolism, and therefore associated with metabolic syndrome (5, 6). Thus, quantifying IR quickly and accurately is important for clinical practice. The most established method to measure IR is euglycemic–hyperinsulinemic clamp. However, this method has limited applicability due to time and monetary cost (7). Another approach for measurement refers to Homeostatic Model Assessment for Insulin Resistance (HOMA-IR), but is also expensive due to insulin measurement (8).
Previous studies have demonstrated that lipotoxicity and glucotoxicity are key factors in IR modulation (1, 3). The triglyceride-glucose (TyG) index is the logarithmized product of fasting triglycerides and fasting glucose and has been proposed as the alternative indicator of IR due to its relevance to lipotoxicity and glucotoxicity (9, 10). TyG index has demonstrated a close relationship with cardiometabolic outcomes, namely diabetes, arterial stiffness, hypertension, cardiovascular disease (CVD), stroke and obesity-related cancers in previous studies (11–18). However, epidemiological evidence on its relationship with all-cause mortality and CVD death is limited. Therefore, we will address the knowledge gap in the United States (US) general population.
Materials and Methods
Study Design and Participants
We analyzed data from the National Health and Nutrition Examination Survey (NHANES) 1999–2014. The data cut-off period was 31 December 2015. NHANES is a nationwide study to assess the health status of US citizens. The surveys were approved by the National Center for Health Statistics Research. Details of study implementation are available for online access (19). After excluding participants <18 years and those without complete medical records, 19,420 were included in the final analyses (Figure 1).
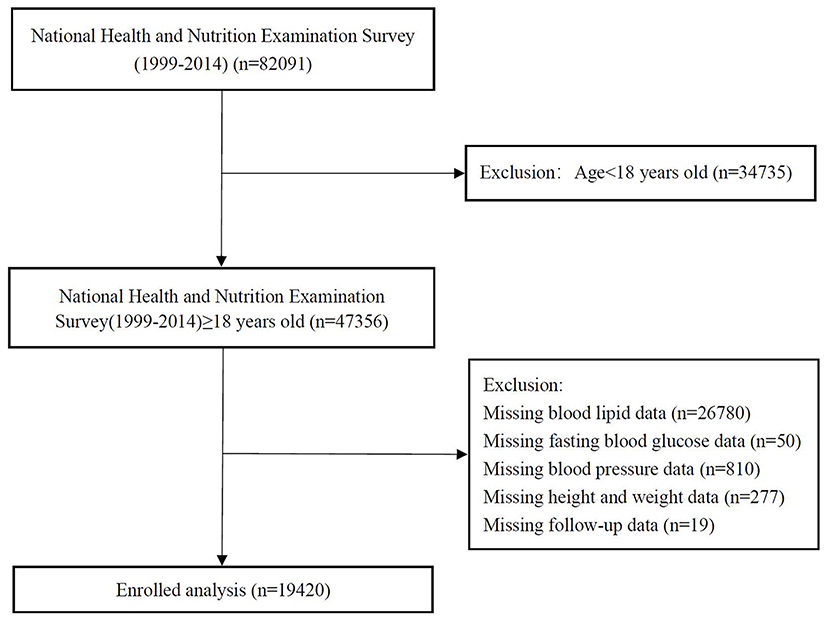
Figure 1. The research flow chart.
Exposure
Blood specimen collection was conducted in the morning session after at least 9 h of overnight fasting. Hexokinase method was used to measure fasting blood glucose (20). The measurement of serum triglycerides (TG) and total cholesterol (TC) was performed with enzymatic assays. The level of high-density lipoprotein cholesterol (HDL-C) was determined by direct immunoassay or precipitation (21). If TG was ≤400 mg/dL, low-density lipoprotein cholesterol (LDL-C) was computed by the Friedewald formula (22). TyG index was defined as TyG=Ln[fasting triglycerides (mg/dL) × fasting glucose (mg/dL)/2] (9, 10).
Covariates
With the use of standardized questionnaires, participants provided information on age, sex, race (classify as white or other), smoking (classify as yes or no), self-reported medical history, and medication use. Body mass index (BMI) was measured by anthropometric measurement, Modification of Diet in Renal Disease formula was used to compute the estimated glomerular filtration rate (eGFR) (23). CVD history was self-reported by the onset of coronary artery disease, angina, heart attack, or stroke. Blood pressure was also measured to identify participants with hypertension. The definition of hypertension was having systolic blood pressures (SBP) ≥140 mmHg, diastolic blood pressure (DBP) ≥90 mmHg, reported the usage of hypotensive drugs or history of hypertension (24). Participants were classified as having diabetes if fasting blood glucose ≥126 mg/dl, hemoglobin A1c ≥6.5%, reported the usage of hypoglycemic drugs or history of diabetes (25). Full procedures on data collection are available on the official website (26).
Outcomes
In the present study, included outcomes were mortality cases due to all-cause and CVD. NHANES dataset was linked with the National Death Index (NDI) based on a probabilistic match to obtain mortality data. This match was performed by The National Center for Health Statistics with personal data, including birth date and social security number. Death certificate was used for confirmation whenever possible. These mortality files are available for online access (https://www.cdc.gov/nchs/data-linkage/mortality-public.htm). The definition of cardiovascular mortality in our study was adapted from the International Classification of Diseases, 10th Clinical Modification (ICD-10) System codes (I00–I09, I11, I13, I20–I51, I60–I69) (27).
Statistical Analysis
Baseline characteristics of participants were classified by TyG index (<8, 8–9, 9–10, >10). For continuous variables, data were presented as average value with standard deviations (SD). For categorical variables, data were presented as numbers with percentages. Depending on the nature of data, Chi-square, ANOVA, or Kruskal-Wallis H-test were performed to detect subgroup differences. To examine the association of TyG index with mortality, three sets of Cox regression models were constructed. Model 1 only included TyG index. Model 2 was adjusted for age, sex, and race. On top of the variables in Model 2, SBP, eGFR, TC, HDL-C, CVD, diabetes, hypertension, hypotensive drugs, hypoglycemic drugs, lipid-lowering medication, and antiplatelet drugs were additionally adjusted in Model 3. A test of the trend across TyG index groups was also performed. The differential onset of all-cause mortality and cardiovascular death according to TyG index was tested by Kaplan–Meier survival analyses. The statistical significance in subgroup differences was evaluated by the log-rank test. Restricted cubic spline models were built to detect any non-linear relationship between TyG index and mortality. If non-linear relationships were identified, we used two-piecewise linear regression models to elucidate how the associations differed by the threshold point. The threshold value was estimated by trying all possible value and choosing the threshold point with highest likelihood. Logarithmic likelihood ratio test was employed to compare the differences in associations when using one-line linear regression models vs. two-piecewise linear regression models. We also evaluated how the results from regression analysis differed by age (≥65 years or <65 years), sex (male or female), race (white or other), diabetes (yes or no), hypertension (yes or no), and BMI (≥25 or <25 kg/m2). All analyses were performed with R version 3.6.3 (R Foundation for Statistical Computing, Vienna, Austria), with statistical significance being identified at the level of P < 0.05.
Results
Baseline Characteristics
Among 19,420 participants (48.9% men) in the present study, the average age was 47.1 (SD, 19.3) years. Across the average follow-up period of 98.2 (SD, 54.3) months, 2,238 (11.5%) death occurred and 445 (2.3%) died due to cardiovascular diseases. Table 1 has presented the remaining details of the baseline characteristics. The subgroup differences were statistically significant for all variables (all P < 0.001).
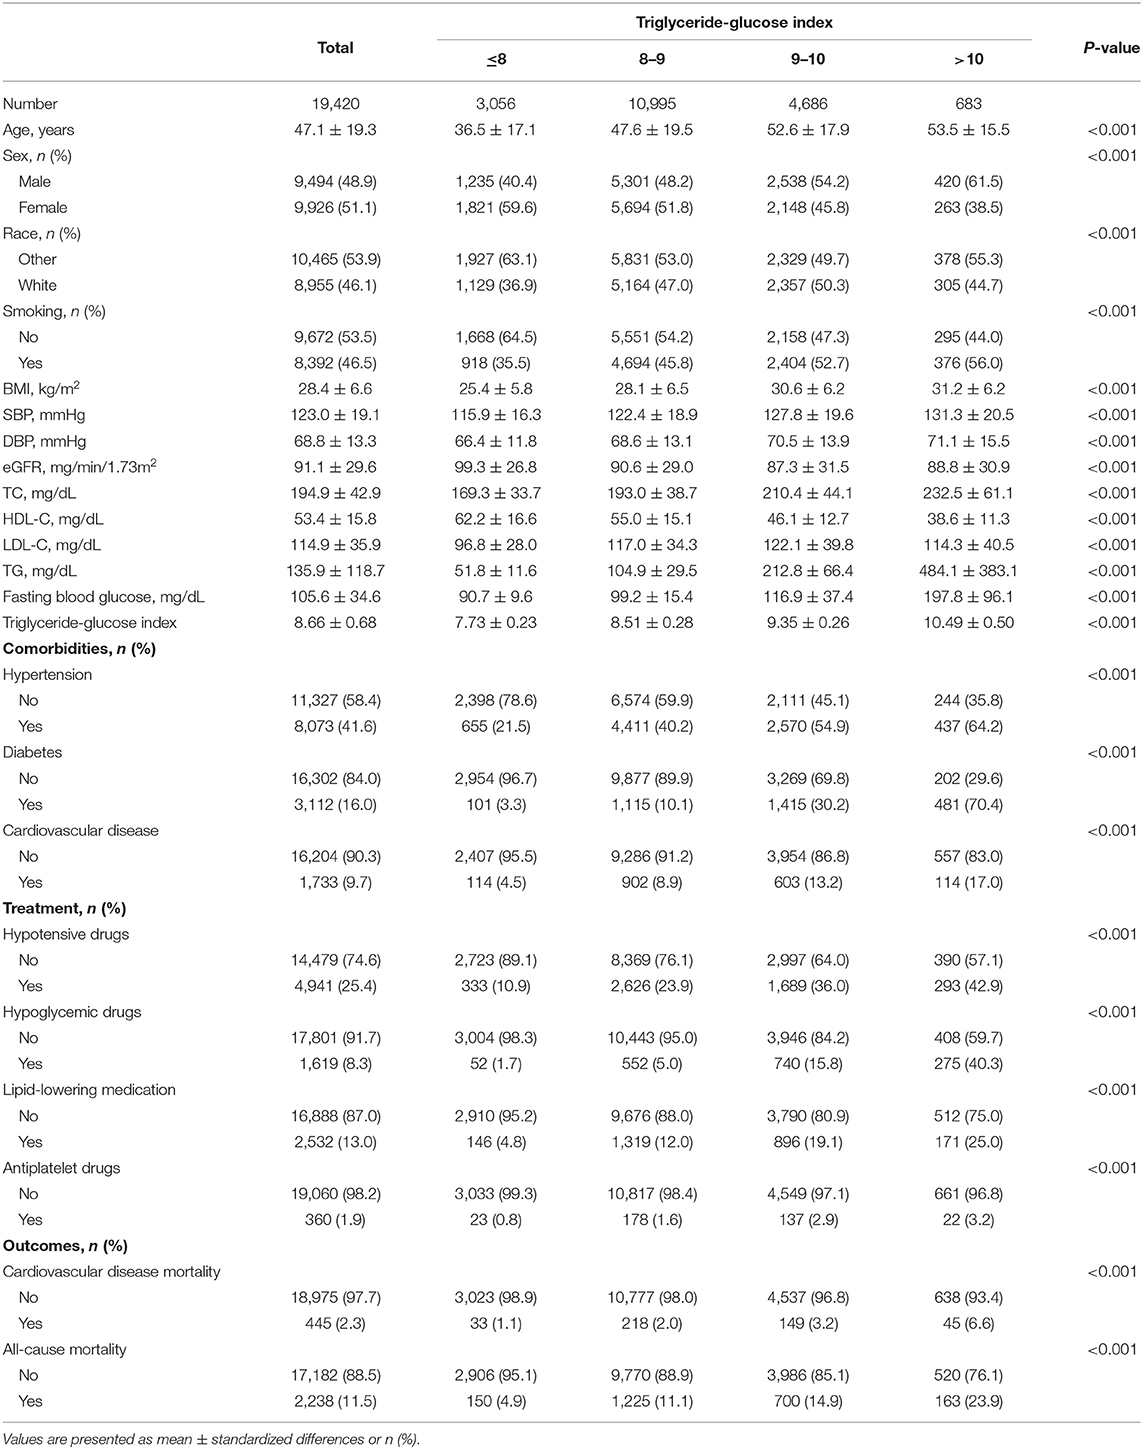
Table 1. Baseline characteristics according to triglyceride-glucose index.
The Relationship of TyG Index With All-Cause and Cardiovascular Mortality
Kaplan-Meier curves of the survival rate stratified by the TyG index were demonstrated in Figure 2. The cumulative incidence of death due to all-cause and CVD increased with TyG index (log-rank test, P < 0.001). Table 2 presents the results from Cox regression analysis. When treating TyG index as a continuous variable, a positive association with all-cause (HR, 1.10; 95% CI, 1.00–1.20) and cardiovascular mortality (HR, 1.29; 95% CI, 1.05–1.57) was found in Model 3. When treating TyG index as a categorical variable, compared with the lowest category (TyG index ≤8), participants with the highest TyG index (>10) had increased risks of all-cause (HR, 4.92; 95% CI, 3.94–6.14) and cardiovascular death (HR, 6.11; 95% CI, 3.90–9.58) in univariate analysis (Model 1). The association with all-cause mortality persisted in Model 3 (HR, 1.51; 95% CI, 1.15–1.98), but the positive effect sizes becoming non-significant with cardiovascular death (HR, 1.37; 95% CI, 0.78–2.42).
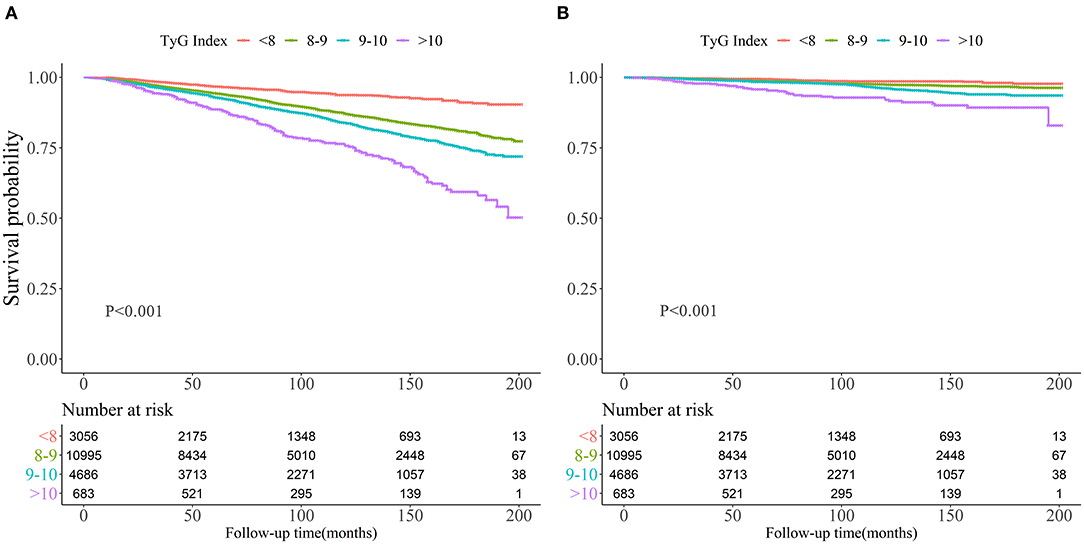
Figure 2. Kaplan-Meier survival curve for all-cause mortality (A) and cardiovascular mortality (B) by Triglyceride-glucose index.
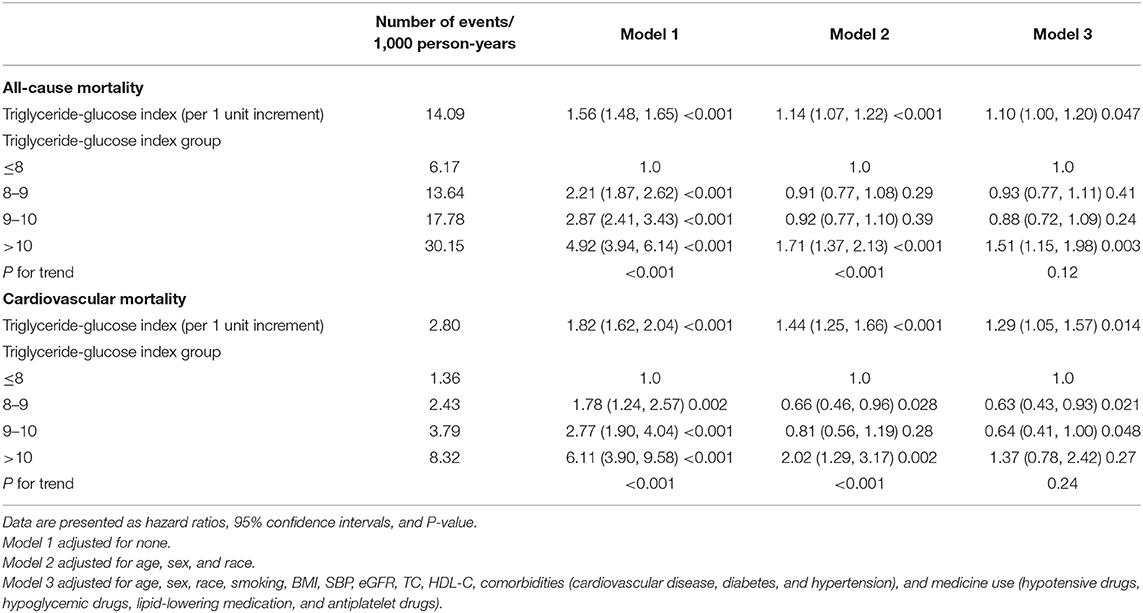
Table 2. Cox regression analysis of Triglyceride-glucose index with cause-specific mortality.
The Analyses of Non-linear Relationship
As shown in Figure 3, restricted cubic spline models suggested that the relationship between TyG index and mortality was non-linear (all non-linear P < 0.001). According to two-piecewise linear regression models (Table 3), the threshold value was 9.36 and 9.52 for all-cause and cardiovascular mortality, respectively. Below the threshold point, TyG index did not associate with all-cause mortality nor cardiovascular mortality. However, above the threshold point, the elevation in TyG index was associated with an increased risk of all-cause (HR, 1.50; 95% CI, 1.29–1.75) and cardiovascular (HR, 2.35; 95% CI, 1.73–3.19) mortality.

Figure 3. Hazard ratios for all-cause mortality (A) and cardiovascular mortality (B) according to Triglyceride-glucose index and the histogram of probability distribution was presented in the background (hazard ratios were calculated by Cox models after adjusting for age, sex, race, smoking, BMI, SBP, eGFR, TC, HDL-C, CVD, diabetes, hypertension, hypotensive drugs, hypoglycemic drugs, lipid-lowering medication, and antiplatelet drugs).
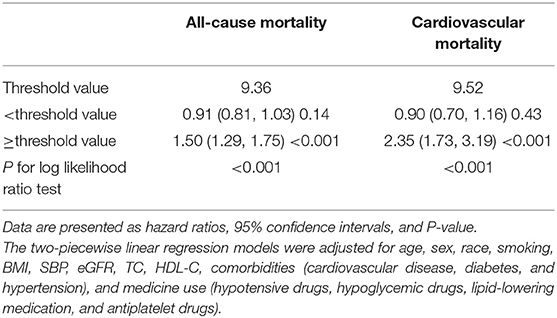
Table 3. The results of two-piecewise linear regression model between Triglyceride-glucose index and cause-specific mortality.
Stratification Analysis
Table 4 showed the result of the stratification analysis. Above the threshold point, TyG index only associated with all-cause mortality among participants age ≥65 years (HR, 1.50; 95% CI, 1.29–1.75), those with hypertension (HR, 1.67; 95% CI, 1.41–1.99) or diabetes (HR, 1.55; 95% CI, 1.29–1.86). The association of TyG index with cardiovascular death was significant in male (HR, 2.59; 95% CI, 1.81–3.72), people suffering from hypertension (HR, 1.67; 95% CI, 1.41–1.99) or diabetes (HR, 1.55; 95% CI, 1.29–1.86).
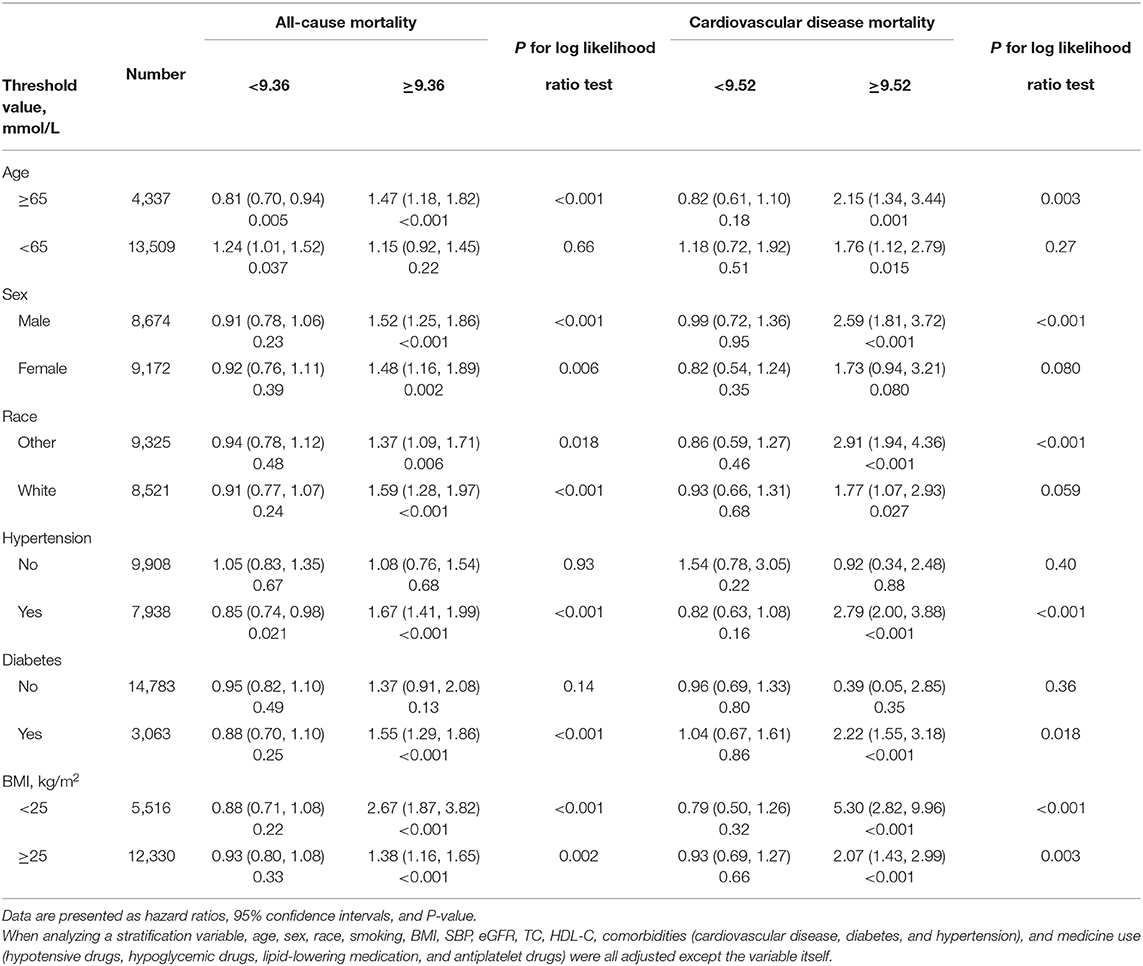
Table 4. Stratification analysis of Triglyceride-glucose index with cause-specific mortality.
Discussion
Our analysis has demonstrated the non-linear relationship of TyG index with mortality due to all-cause and CVD among US population. We also identified the threshold points where the association of TyG index with mortality was further increased.
Patients with IR were often accompanied by lipid and glucose metabolism disorders (16). The phenomenon of lipid-induced insulin resistance can be explained by glucose-fatty acid cycle hypothesis (28). Therefore, TyG index can serve as a practical alternative of IR measurement (29). When compared to HOMA-IR, Lee et al. found that TyG index is a better indicator of arterial stiffness in Korean adults (18). Chiu et al. and Zhao et al. found that TyG index was associated with macrovascular and microvascular damage (30, 31). TyG index was also found to associate with CVD incidence (14, 32), hypertension, diabetes, as well as metabolic syndrome (11, 12, 33). Our analyses demonstrated the threshold values to detect mortality risk using TyG index. In a study of 2,531 subjects, Wang et al. found the threshold value of TyG index to predict adverse cardiovascular events was 9.32 among patients with diabetes and acute coronary syndrome (34), which was similar to the threshold values we have found. However, not all studies have found significant associations. Laura et al. failed to detect any significant associations between the TyG index and CVD for people with diabetes or hypertension (35). Cho et al. reported that TyG index had no significant relationship with coronary artery disease among diabetic participants after adjusting for covariates (36).
The detail in the mechanism accounting for the relationship between TyG index and death is still under investigation. Several speculations have been summarized as follows. First, TyG index had a close relationship with a broad range of adverse health conditions including obesity, diabetes, CVD, higher blood pressure, lower eGFR, and HDL-C levels (11, 12, 37). Elevated TyG index may reflect the adverse effects of impaired cardiometabolic health. In our stratified analysis, the positive association of the TyG index with mortality was more profound among older participants and people with pre-existing diseases. Second, endothelial dysfunction may have a role in the association of TyG index with mortality. Compared with other IR indicators, TyG index mainly quantifies IR in muscle and is a better indicator for peripheral IR. Therefore, TyG index probably relates to the level of endothelial dysfunction, oxidative stress and inflammatory response (1, 3, 38). Positive associations of the TyG index with white blood cells count and high-sensitivity C-reactive protein levels were also revealed in previous studies (16, 17). Inflammation may impair vascular endothelium. That can lead to the leakage of blood contents into the perivascular spaces and further cause vascular damage (39). Third, insulin may cause lipohyalinosis through the elevation of sympathetic activity, which may lead to diffuse hypoperfusion or blocks small perforating arterioles (37, 39). IR can also promote atherogenesis and advanced plaque progression (37). Fourth, TyG index predicts the incidence of prediabetes (40), while meta-analyses have confirmed that prediabetes was positively associated with all-cause and CVD death in general population (41, 42). Nevertheless, the precise role of the TyG index in mortality remains to be investigated.
Despite the important findings being mentioned, some limitations of this study need to be recognized. First, insulin clamp was not available in this study, and thus we could not use the most accurate methods to evaluate IR. Second, the present study does not imply causality due to the cross-sectional nature. Lastly, the finding was mainly applicable in the United States and may not be directly extrapolated to other regions and ethnic groups.
Conclusions
There is a non-linear relationship of TyG index with mortality due to all-cause and CVD among US population. Whether the improvement of TyG index may reduce mortality risk in long run need to be further evaluated by intervention studies.
Data Availability Statement
Publicly available datasets were analyzed in this study. This data can be found at: https://www.cdc.gov/nchs/nhanes/index.htm.
Ethics Statement
The studies involving human participants were reviewed and approved by the Institutional Review Board of the Centers for Disease Control and Prevention (Protocol 98–12, 2005–06, and 2011–17). The patients/participants provided their written informed consent to participate in this study.
Author Contributions
Y-qH, G-dH, KL, Y-qF, and X-cL: conceptualization and methodology. Y-qH and X-cL: formal analysis. Y-qH and Y-qF: supervision and validation. X-cL and KL: writing and revision. All authors: contributed to the article and approved the submitted version.
Funding
This study was funded by the Science and Technology Plan Program of Guangzhou (No. 201803040012), the Key Area R&D Program of Guangdong Province (No. 2019B020227005), Guangdong Provincial People's Hospital Clinical Research Fund (Y012018085), Climbing Plan of Guangdong Provincial People's Hospital (DFJH2020022), and the National Key Research and Development Program of China (No. 2017YFC1307603).
Conflict of Interest
The authors declare that the research was conducted in the absence of any commercial or financial relationships that could be construed as a potential conflict of interest.
References
1. Petersen MC, Shulman GI. Mechanisms of insulin action and insulin resistance. Physiol Rev. (2018) 98:2133–223. doi: 10.1152/physrev.00063.2017
2. Rothman DL, Magnusson I, Cline G, Gerard D, Kahn CR, Shulman RG, et al. Decreased muscle glucose transport/phosphorylation is an early defect in the pathogenesis of non-insulin-dependent diabetes mellitus. Proc Natl Acad Sci USA. (1995) 92:983–7. doi: 10.1073/pnas.92.4.983
3. Ormazabal V, Nair S, Elfeky O, Aguayo C, Salomon C, Zuniga FA. Association between insulin resistance and the development of cardiovascular disease. Cardiovasc Diabetol. (2018) 17:122. doi: 10.1186/s12933-018-0762-4
4. Czech MP. Insulin action and resistance in obesity and type 2 diabetes. Nat Med. (2017) 23:804–14. doi: 10.1038/nm.4350
5. Di Pino A, DeFronzo RA. Insulin resistance and atherosclerosis: implications for insulin-sensitizing agents. Endocr Rev. (2019) 40:1447–67. doi: 10.1210/er.2018-00141
6. Shi W, Xing L, Jing L, Tian Y, Liu S. Usefulness of triglyceride-glucose index for estimating hyperuricemia risk: insights from a general population. Postgrad Med. (2019) 131:348–56. doi: 10.1080/00325481.2019.1624581
7. DeFronzo RA, Tobin JD, Andres R. Glucose clamp technique: a method for quantifying insulin secretion and resistance. Am J Physiol. (1979) 237:E214–23. doi: 10.1152/ajpendo.1979.237.3.E214
8. Matthews DR, Hosker JP, Rudenski AS, Naylor BA, Treacher DF, Turner RC. Homeostasis model assessment: insulin resistance and beta-cell function from fasting plasma glucose and insulin concentrations in man. Diabetologia. (1985) 28:412–9. doi: 10.1007/bf00280883
9. Guerrero-Romero F, Simental-Mendia LE, Gonzalez-Ortiz M, Martinez-Abundis E, Ramos-Zavala MG, Hernandez-Gonzalez SO, et al. The product of triglycerides and glucose, a simple measure of insulin sensitivity. Comparison with the euglycemic-hyperinsulinemic clamp. J Clin Endocrinol Metab. (2010) 95:3347–51. doi: 10.1210/jc.2010-0288
10. Simental-Mendia LE, Rodriguez-Moran M, Guerrero-Romero F. The product of fasting glucose and triglycerides as surrogate for identifying insulin resistance in apparently healthy subjects. Metab Syndr Relat Disord. (2008) 6:299–304. doi: 10.1089/met.2008.0034
11. Zhang M, Wang B, Liu Y, Sun X, Luo X, Wang C, et al. Cumulative increased risk of incident type 2 diabetes mellitus with increasing triglyceride glucose index in normal-weight people: the rural Chinese cohort study. Cardiovasc Diabetol. (2017) 16:30. doi: 10.1186/s12933-017-0514-x
12. Zhu B, Wang J, Chen K, Yan W, Wang A, Wang W, et al. A high triglyceride glucose index is more closely associated with hypertension than lipid or glycemic parameters in elderly individuals: a cross-sectional survey from the reaction study. Cardiovasc Diabetol. (2020) 19:112. doi: 10.1186/s12933-020-01077-6
13. Shi W, Xing L, Jing L, Tian Y, Yan H, Sun Q, et al. Value of triglyceride-glucose index for the estimation of ischemic stroke risk: insights from a general population. Nutr Metab Cardiovasc Dis. (2020) 30:245–53. doi: 10.1016/j.numecd.2019.09.015
14. da Silva A, Caldas APS, Hermsdorff HHM, Bersch-Ferreira AC, Torreglosa CR, Weber B, et al. Triglyceride-glucose index is associated with symptomatic coronary artery disease in patients in secondary care. Cardiovasc Diabetol. (2019) 18:89. doi: 10.1186/s12933-019-0893-2
15. Fritz J, Bjorge T, Nagel G, Manjer J, Engeland A, Haggstrom C, et al. The triglyceride-glucose index as a measure of insulin resistance and risk of obesity-related cancers. Int J Epidemiol. (2020) 49:193–204. doi: 10.1093/ije/dyz053
16. Nam KW, Kwon HM, Jeong HY, Park JH, Kwon H, Jeong SM. High triglyceride-glucose index is associated with subclinical cerebral small vessel disease in a healthy population: a cross-sectional study. Cardiovasc Diabetol. (2020) 19:53. doi: 10.1186/s12933-020-01031-6
17. Zhao Q, Zhang TY, Cheng YJ, Ma Y, Xu YK, Yang JQ, et al. Impacts of triglyceride-glucose index on prognosis of patients with type 2 diabetes mellitus and non-ST-segment elevation acute coronary syndrome: results from an observational cohort study in China. Cardiovasc Diabetol. (2020) 19:108. doi: 10.1186/s12933-020-01086-5
18. Lee SB, Ahn CW, Lee BK, Kang S, Nam JS, You JH, et al. Association between triglyceride glucose index and arterial stiffness in Korean adults. Cardiovasc Diabetol. (2018) 17:41. doi: 10.1186/s12933-018-0692-1
19. Centers for Disease Control and Prevention. NHANES - National Health and Nutrition Examination Survey Homepage. (2020). Available online at: https://www.cdc.gov/nchs/nhanes/index.htm (accessed March 15, 2020).
20. Tucker LA. Limited agreement between classifications of diabetes and prediabetes resulting from the OGTT, hemoglobin A1c, and fasting glucose tests in 7412 US adults. J Clin Med. (2020) 9:2207. doi: 10.3390/jcm9072207
21. Huang YQ, Liu XC, Lo K, Feng YQ, Zhang B. A dose-independent association of triglyceride levels with all-cause mortality among adults population. Lipids Health Dis. (2020) 19:225. doi: 10.1186/s12944-020-01400-w
22. Friedewald WT, Levy RI, Fredrickson DS. Estimation of the concentration of low-density lipoprotein cholesterol in plasma, without use of the preparative ultracentrifuge. Clin Chem. (1972) 18:499–502.
23. Inker LA, Schmid CH, Tighiouart H, Eckfeldt JH, Feldman HI, Greene T, et al. Estimating glomerular filtration rate from serum creatinine and cystatin C. N Engl J Med. (2012) 367:20–9. doi: 10.1056/NEJMoa1114248
24. Chobanian AV, Bakris GL, Black HR, Cushman WC, Green LA, Izzo JL, et al. The seventh report of the joint national committee on prevention, detection, evaluation, and treatment of high blood pressure: the JNC 7 report. JAMA. (2003) 289:2560–72. doi: 10.1001/jama.289.19.2560
25. Chamberlain JJ, Johnson EL, Leal S, Rhinehart AS, Shubrook JH, Peterson L. Cardiovascular disease and risk management: review of the American diabetes association standards of medical care in diabetes 2018. Ann Intern Med. (2018) 168:640–50. doi: 10.7326/m18-0222
26. Centers for Disease Control and Prevention. NHANES Questionnaires, Datasets, and Related Documentation. (2020). Available online at: https://wwwn.cdc.gov/nchs/nhanes/Default.aspx (accessed March 15, 2020).
27. Liu XC, Liu L, Yu YL, Huang JY, Chen CL, Lo K, et al. The association of subscapular skinfold with all-cause, cardiovascular and cerebrovascular mortality. Risk Manag Healthc Policy. (2020) 13:955–63. doi: 10.2147/rmhp.S262300
28. Randle PJ, Garland PB, Hales CN, Newsholme EA. The glucose fatty-acid cycle. Its role in insulin sensitivity and the metabolic disturbances of diabetes mellitus. Lancet. (1963) 1:785–9. doi: 10.1016/s0140-6736(63)91500-9
29. Vasques AC, Novaes FS, de Oliveira Mda S, Souza JR, Yamanaka A, Pareja JC, et al. TyG index performs better than HOMA in a Brazilian population: a hyperglycemic clamp validated study. Diabetes Res Clin Pract. (2011) 93:e98–100. doi: 10.1016/j.diabres.2011.05.030
30. Zhao S, Yu S, Chi C, Fan X, Tang J, Ji H, et al. Association between macro- and microvascular damage and the triglyceride glucose index in community-dwelling elderly individuals: the Northern Shanghai study. Cardiovasc Diabetol. (2019) 18:95. doi: 10.1186/s12933-019-0898-x
31. Chiu H, Tsai HJ, Huang JC, Wu PY, Hsu WH, Lee MY, et al. Associations between triglyceride-glucose index and micro- and macro-angiopathies in type 2 diabetes mellitus. Nutrients. (2020) 12:328. doi: 10.3390/nu12020328
32. Barzegar N, Tohidi M, Hasheminia M, Azizi F, Hadaegh F. The impact of triglyceride-glucose index on incident cardiovascular events during 16 years of follow-up: tehran lipid and glucose study. Cardiovasc Diabetol. (2020) 19:155. doi: 10.1186/s12933-020-01121-5
33. Moon S, Park JS, Ahn Y. The cut-off values of triglycerides and glucose index for metabolic syndrome in American and Korean adolescents. J Korean Med Sci. (2017) 32:427–33. doi: 10.3346/jkms.2017.32.3.427
34. Wang L, Cong HL, Zhang JX, Hu YC, Wei A, Zhang YY, et al. Triglyceride-glucose index predicts adverse cardiovascular events in patients with diabetes and acute coronary syndrome. Cardiovasc Diabetol. (2020) 19:80. doi: 10.1186/s12933-020-01054-z
35. Sanchez-Inigo L, Navarro-Gonzalez D, Fernandez-Montero A, Pastrana-Delgado J, Martinez JA. The TyG index may predict the development of cardiovascular events. Eur J Clin Invest. (2016) 46:189–97. doi: 10.1111/eci.12583
36. Cho YR, Ann SH, Won KB, Park GM, Kim YG, Yang DH, et al. Association between insulin resistance, hyperglycemia, and coronary artery disease according to the presence of diabetes. Sci Rep. (2019) 9:6129. doi: 10.1038/s41598-019-42700-1
37. Bornfeldt KE, Tabas I. Insulin resistance, hyperglycemia, and atherosclerosis. Cell Metab. (2011) 14:575–85. doi: 10.1016/j.cmet.2011.07.015
38. Han T, Cheng Y, Tian S, Wang L, Liang X, Duan W, et al. Changes in triglycerides and high-density lipoprotein cholesterol may precede peripheral insulin resistance, with 2-h insulin partially mediating this unidirectional relationship: a prospective cohort study. Cardiovasc Diabetol. (2016) 15:154. doi: 10.1186/s12933-016-0469-3
39. Pantoni L. Cerebral small vessel disease: from pathogenesis and clinical characteristics to therapeutic challenges. Lancet Neurol. (2010) 9:689–701. doi: 10.1016/s1474-4422(10)70104-6
40. Wen J, Wang A, Liu G, Wang M, Zuo Y, Li W, et al. Elevated triglyceride-glucose (TyG) index predicts incidence of prediabetes: a prospective cohort study in China. Lipids Health Dis. (2020) 19:226. doi: 10.1186/s12944-020-01401-9
41. Huang Y, Cai X, Mai W, Li M, Hu Y. Association between prediabetes and risk of cardiovascular disease and all cause mortality: systematic review and meta-analysis. BMJ. (2016) 355:i5953. doi: 10.1136/bmj.i5953
Keywords: insulin resistance, all-cause mortality, cardiovascular mortality, NHANES, risk factors, triglyceride-glucose index
Citation: Liu XC, He GD, Lo K, Huang YQ and Feng YQ (2021) The Triglyceride-Glucose Index, an Insulin Resistance Marker, Was Non-linear Associated With All-Cause and Cardiovascular Mortality in the General Population. Front. Cardiovasc. Med. 7:628109. doi: 10.3389/fcvm.2020.628109
Received: 11 November 2020; Accepted: 11 December 2020;
Published: 14 January 2021.
Edited by:
Yuli Huang, Southern Medical University, ChinaReviewed by:
Yunzhao Hu, Shunde Hospital of Southern Medical University Affiliated Chencun Hospital, ChinaDongfeng Zhang, Qingdao University, China
Copyright © 2021 Liu, He, Lo, Huang and Feng. This is an open-access article distributed under the terms of the Creative Commons Attribution License (CC BY). The use, distribution or reproduction in other forums is permitted, provided the original author(s) and the copyright owner(s) are credited and that the original publication in this journal is cited, in accordance with accepted academic practice. No use, distribution or reproduction is permitted which does not comply with these terms.
*Correspondence: Ying-qing Feng, 651792209@qq.com; Yu-qing Huang, hyq513@126.com
†These authors have contributed equally to this work