
The Behavioral and Psychological Symptoms of Dementia in Down Syndrome (BPSD-DS) Scale: Comprehensive Assessment of Psychopathology in Down Syndrome
Abstract
People with Down syndrome (DS) are prone to develop Alzheimer’s disease (AD). Behavioral and psychological symptoms of dementia (BPSD) are core features, but have not been comprehensively evaluated in DS. In a European multidisciplinary study, the novel Behavioral and Psychological Symptoms of Dementia in Down Syndrome (BPSD-DS) scale was developed to identify frequency and severity of behavioral changes taking account of life-long characteristic behavior. 83 behavioral items in 12 clinically defined sections were evaluated. The central aim was to identify items that change in relation to the dementia status, and thus may differentiate between diagnostic groups. Structured interviews were conducted with informants of persons with DS without dementia (DS, n = 149), with questionable dementia (DS+Q, n = 65), and with diagnosed dementia (DS+AD, n = 67). First exploratory data suggest promising interrater, test-retest, and internal consistency reliability measures. Concerning item relevance, group comparisons revealed pronounced increases in frequency and severity in items of anxiety, sleep disturbances, agitation & stereotypical behavior, aggression, apathy, depressive symptoms, and eating/drinking behavior. The proportion of individuals presenting an increase was highest in DS+AD, intermediate in DS+Q, and lowest in DS. Interestingly, among DS+Q individuals, a substantial proportion already presented increased anxiety, sleep disturbances, apathy, and depressive symptoms, suggesting that these changes occur early in the course of AD. Future efforts should optimize the scale based on current results and clinical experiences, and further study applicability, reliability, and validity. Future application of the scale in daily care may aid caregivers to understand changes, and contribute to timely interventions and adaptation of caregiving.
INTRODUCTION
The nearly six million people worldwide with Down syndrome (DS, trisomy 21) face an extremely high risk to develop dementia due to Alzheimer’s disease (AD) [1]. In the general, non-DS population approximately 1 in 9 individuals over 65 years of age presents with the disease [2], whereas 68–80% of individuals with DS develop AD by age 65 [3]. Virtually all persons with DS display extensive AD brain pathology by age 40, but the onset of clinical dementia symptoms varies substantially in time [4, 5]. Consequently, predicting and monitoring (the onset of) dementia is a major issue in contemporary care for elderly individuals with DS.
The (early) diagnosis of dementia in DS is fairly complex compared to the general population given the pre-existing intellectual disability (ID), behavior and co-morbidities [6, 7]. Unlike the general population, a sensitive and specific cerebrospinal fluid biomarker profile for AD in DS is not available [8], and the clinical utility of positron emission tomography (PET) for amyloid is questionable [4, 9]. Clinical diagnosis by physicians and (neuro)psychologists thus remains the gold standard [10]. Identification of early changes related to AD, however, is especially difficult, and there is need for validated tools that aid assessment and monitoring of AD in DS.
In that regard, behavioral and psychological symptoms of dementia (BPSD) are of great interest. BPSD, defined by Sanford Finkel as “a heterogeneous range of psychological reactions, psychiatric symptoms, and behaviors resulting from the presence of dementia” [11], are core to dementia alongside progressive decline in cognitive functions and activities of daily living. Interestingly, particular BPSD present early, even in the prodromal stage of the disease, while other symptoms are more prevalent in later stages [12]. Specific BPSD may thus serve as early ‘alarm signals’ of conversion to dementia.
BPSD are associated with a reduced quality of life, increased suffering, earlier institutionalization and increased caregiver burden [11]. Indeed, BPSD in DS were found to be a major cause for referral [13] and caregivers reported difficulty to understand and respond to the (unpredictable) behavioral changes [14]. Consequently, careful assessment of BPSD would likely improve understanding and acceptance of AD-related changes in daily care, and, as such, contribute to adaptive caregiving and appropriate therapeutic interventions [15].
Nearly all AD patients in the general population present one or more BPSD at some point in the course of the disease [16]. BPSD are commonly assessed using, for instance, the Behavioral Pathology in Alzheimer’s disease (BEHAVE-AD) rating scale [17] and the Neuropsychiatric Inventory (NPI) [18, 19]. Using these scales, among others, studies have reported the cross-sectional prevalence of various BPSD in AD patients: anxiety (20–48%), sleep disturbances (13–36%), irritability (25–42%), agitation/aggression (27–60%), apathy (48–72%), depression (36–43%), delusions (10–50%), hallucinations (0–27%), disinhibition (10–36%), and eating/appetite disturbances (21–24%) [20–25]. Evidently, BPSD are commonly associated with AD.
Surprisingly, BPSD have not been thoroughly evaluated in DS, despite the high risk to develop AD. In a recent review, we comprehensively discussed the existing literature on behavioral changes in relation to dementia in DS, and concluded that “the great variety of cohorts, diagnostic methodologies, covariates and outcome measures that have been used in the available BPSD studies in DS yielded diverse results and made comparisons generally hard to accomplish [15].” Nevertheless, various behavioral symptoms appear to be altered in relation to dementia in DS. Frontal lobe symptoms, such as apathy, have been implicated as early signs. Agitation and psychotic symptoms appeared more prevalent in individuals with dementia compared to those without dementia, while reports on depressive and aggressive symptoms presented more divergent results. In contrast, anxiety and eating disturbances have been hardly studied in DS [15].
Importantly, “due to the multitude of applied, sub-optimal scales, it is questionable whether BPSD have always been accurately assessed” in DS [15]. Indeed, BPSD scales used in the general population do not take specific circumstances of this population into account, while dementia questionnaires for people with intellectual disabilities, such as the commonly used Dementia Questionnaire for People with Intellectual Disabilities (DMR) [26], Dementia Scale for Down Syndrome (DSDS) [27, 28] and Cambridge Examination for Mental Disorders of Older People with Down Syndrome and Others with Intellectual Disabilities (CAMDEX-DS) [29] have a more limited focus on BPSD [15].
Therefore, we have established a multidisciplinary consortium to develop a scale for comprehensive evaluation of BPSD, specifically adapted to the DS population. This novel scale, entitled Behavioral and Psychological Symptoms of Dementia in Down Syndrome (BPSD-DS) scale, focuses exclusively on behavior, disentangling characteristic behavior that has always been present from changes in behavior possibly related to AD. A wide range of behavioral symptoms was included, but no cognitive or functional measures. Such a modular approach is similar to behavioral assessments of AD patients in the general population where, among others, BEHAVE-AD [17] and NPI [18, 19] are commonly used alongside cognitive/functional measures.
Here, we report the development and first validation data of the initial version of the BPSD-DS scale in a large multicenter cross-sectional DS cohort. Administered as a single structured informant interview to caregivers of 281 individuals with DS, behavioral items were identified that differed significantly between DS without dementia (DS), with questionable dementia (DS+Q) and with dementia (DS+AD), and thus appear to be relevant items for future use. Alternatively, a lack of clinical relevance was revealed for 23 items in the scale.
MATERIALS AND METHODS
Multidisciplinary consortium
A representative European multidisciplinary study group was established, including (behavioral) neurologists, geriatricians, BPSD-researchers, ID (neuro)psychologists and ID physicians. These experts had ample experience in daily clinical practice for individuals with DS, AD patients in the general population, development and validation of (behavioral) dementia scales and their use in clinical settings and trials [30–38]. The University Medical Center Groningen (UMCG) took care of overall study coordination, instruction of raters, quality control, data processing and analyses.
Scale development
Scale development comprised of consecutive rounds. First, behavioral changes in DS were identified in existing literature [15]. Although various BPSD appear to be altered in DS, reports have not been consistent and item relevance remained to be elucidated, i.e., which symptoms change (most) in relation to dementia. Consequently, an inclusive approach was adopted, i.e., not omitting BPSD items in advance. Secondly, we identified symptoms frequently observed in daily practice. Thirdly, we studied items in existing scales for DS [15], as well as behavioral scales used in the general population, including, among others, BEHAVE-AD [17], NPI [18, 19], Cohen-Mansfield Agitation Inventory [39, 40], Middelheim Frontality Scale [30], Apathy Evaluation Scale [41], Cornell Scale for Depression in Dementia [42], and Rating Scale for Aggressive Behavior in the Elderly [43]. Gaps were identified and these were—together with items derived from literature and clinical practice—incorporated in the first version. The scale was optimized in successive expert feedback rounds. In the optimization phase, informants were interviewed to evaluate adequacy and clarity of items, as well as feasibility of the interview and scoring system. Based on the comments received and practical issues identified, items were changed, rephrased or combined and the protocol/manual was optimized. The English version was translated into Dutch, French, Italian and Spanish.
Scoring
For each behavioral item in the scale, frequency, severity and caregiver burden were scored. Frequency was scored on a five-point scale: 0 = never (never or once only), 1 = seldom (less than monthly), 2 = sometimes (monthly, not weekly), 3 = often (weekly, not daily), or 4 = very often (daily or continuously). Severity for the person with DS, defined by suffering and disruption of daily life, was scored on a four-point scale: 0 = none, 1 = mild, 2 = moderate, or 3 = severe. To identify behavioral changes over time, frequency and severity were scored for two periods of time: (a) the last six months and (b) the characteristic past, i.e., whether that particular symptom had always been present. Accordingly, frequency change and severity change were calculated by taking the score for (a) and subtracting the score for (b) from it. Positive outcomes indicate increased frequencies or severities, whereas negative outcomes indicate decreases. Frequency change scores range from –4 to +4 and severity change scores from –3 to +3 per item. Unaltered items have a change score of 0. Finally, caregiver burden, defined by the manageability of symptoms, additional time/attention required and emotional impact, was scored on a four-point scale: 0 = none, 1 = mild, 2 = moderate, or 3 = severe. Caregiver burden was scored over the last six months only.
Administration
Since people with ID often have difficulty to describe their feelings and emotions, we adopted a structured informant interview. Following a detailed manual, interviews were conducted by experienced raters (used to assessment scales) with at least one informant who knows the person with DS ideally for a minimum period of two years. Informant(s) had to be able to describe behavior in the last six months and in the past before dementia-related changes occurred (characteristic behavior). The presence of an additional informant was appreciated, especially for expected cases wherein a single informant could not provide a full overview of behavioral items because the person with DS is living/working at different places. A professional caregiver working at a day-care center, for instance, would most likely not be able to score sleep disturbances, illustrating the added value of a second informant (e.g., a family member) in this regard. For each participating individual with DS, the BPSD-DS scale was administered to their informant(s) once-only (apart from a few individuals for whom a second informant interview was conducted for test-retest reliability testing). If more than one informant attended the interview, informants were interviewed collectively in a single session (not separately). In case informants provided different scores, they had to discuss and reach consensus about the score during the interview. Before the interview, informants were introduced to the scale and procedure, received a copy of the scoring definitions accompanied by an oral explanation, and were asked to give brief and concise responses. Interviews were conducted in the absence of the person with DS to facilitate honest answering.
Study population
To be eligible to participate, individuals had to meet the following criteria: phenotypical diagnosis of DS, aged ≥30 years, ID in the mild-severe range, and stable dosage of psychoactive medication. Exclusion criteria: profound ID, hospitalization/terminal care, presence of a known cerebrovascular accident or another significant co-morbidity, and absence of a key informant. We also excluded individuals who had faced a severe life event in the last six months that strongly affected behavior (clinical judgement), such as the decease of a parent, as well as individuals with behavioral problems evidently related to untreated hypothyroidism, untreated vitamin B12 deficiency, or severe hearing and/or visual impairments. Co-morbidities, ID severity (baseline) and medication use were obtained from records.
Dementia diagnosis
Dementia was diagnosed based on ICD-10 criteria and routine clinical (multidisciplinary) diagnostic work-up by experienced clinicians at the participating centers. Other causes of dementia-like symptoms were excluded (differential diagnosis). Accordingly, three diagnostic groups were distinguished: 1) no signs of dementia (DS), 2) questionable dementia (DS+Q), i.e., presenting decline, but not (yet) meeting dementia criteria, and 3) clinical diagnosis of AD dementia (DS+AD).
Ethics
The Medical Ethics Review Board of the UMCG evaluated the study protocol (METC 2015/443) and concluded that the Dutch Medical Research (Human Subjects) Act did not apply. The study was registered in the UMCG Research Register (no. 201500891) and compliant with the Dutch Personal Data Protection Act and the Declaration of Helsinki. Local ethics committees gave their approval whenever applicable. In France, the clinical study protocol and all other appropriate study related-documents were reviewed and approved by the Comité de Protection des Personnes (CPP), the Comité Consultatif sur le Traitement de l’Information en matière de Recherche dans le domaine de la Santé (CCTIRS), and authorized by the Commission Nationale de l’Informatique et des Libertés (CNIL). In the UK, ethical approval was given to the LonDowns Consortium to collect information using dementia rating scales.
Recruitment and consent
In a multicenter approach, individuals with DS involved with the participating centers were recruited by contacting their legal representatives (information letter). This may involve persons living with family or in group homes/assisted living accommodations. Moreover, the study was announced through various (online) platforms, and people could sign up for participation. Written informed consent was obtained from the person with DS (if able to consent) or from the legal representative (by proxy). For those individuals with DS able to give consent, an adapted informed consent form with pictograms was used in a few cases. Participants or their representatives consented to anonymized data being shared for the purposes of this study.
Validity
Face and content validity were ensured by deducing behavioral items from literature and multidisciplinary clinical experience. Experts reviewed the scale, establishing the final version in a series of consecutive rounds. In case of conflicting opinions, an item was included (benefit of the doubt). Current dementia scales for DS lack a thorough focus on behavior, while behavioral scales used in the general population are not adapted to DS [15]. Due to this lack of a (gold) standard instrument to compare the BPSD-DS scale with, concurrent validity could not be established.
Reliability
Interrater and test-retest reliability were evaluated in a subset of informant interviews. Like in Cummings et al. [18], interrater reliability was established by two trained raters: both scored the responses, but the interview was only conducted by one of them. The second rater was present as fly-on-the-wall blinded to the first rater’s scoring. Raters were not the same for each interview. Test-retest reliability was assessed by conducting a second interview with the same informant(s) and rater within 1–4 weeks after the first interview.
Item (ir)relevance
Previous literature, reviewed in [15], did not unequivocally point at behavioral symptoms that discriminate individuals with DS based on clinical dementia status. Therefore, an inclusive approach was undertaken, incorporating a broad range of potentially relevant behavioral items deduced from literature and clinical experiences. Subsequently, the central aim of this cross-sectional study was to identify which behavioral items change in relation to dementia (i.e., establish item relevance) by comparing frequency change and severity change scores across the three diagnostic groups. Significant group differences would point at a promising discriminative ability of such items, highlighting their relevance for future use. Alternatively, we also aimed to identify evidently irrelevant items. A lack of clinically relevant change was defined as ≥85% of DS+Q and DS+AD individuals showing unaltered scores (change = 0) for both frequency change and severity change.
Statistics
‘Unknown’ answers for individual items were treated as ‘missing values’. In a limited number of items, informants could indicate ‘not applicable’ if the person with DS could impossibly perform this specific behavior, for instance ‘aimlessly pacing’ (item 5.2) when someone fully relies on a wheelchair. Consequently, change over time could not occur either: ‘not applicable’ was therefore recoded as ‘no change’ for analysis. In the context of item relevance, analysis focused on the individual item level. Additionally, frequency change and severity change scores per section and for the total scale were computed as the sum of individual item change scores for frequency and severity, respectively. Caregiver burden scores per section and for the total scale were computed as the sum of individual item caregiver burden scores. Continuous variables are reported as median with the interquartile range (25–75%) between brackets (for age the entire range is provided), and categorical variables as percentage. Comparisons across the three groups were conducted using Pearson’s Chi-squared tests and Kruskal-Wallis tests. To keep a false-discovery rate of 0.05, the level of significance was adjusted according to Benjamini & Hochberg [44]. Following this procedure, original P-values below 0.0275 are considered significant. For graphical representation of the changes in individual items, the original frequency and severity changes were simplified to ‘decrease’, ‘unaltered’ and ‘increase’. A linear regression analysis was performed to evaluate the effect of age on total scale scores in the non-demented group. Reliability measures of frequency and severity change scores were calculated as percent agreement for interrater- as well as for test-retest data. McHugh (2012) argues that percent agreement is a safe measure of reliability in situations like these where raters are trained and randomly guessing the answer is unlikely [45]. Internal consistency among all items, as well as for each individual item, was determined by calculating Cronbach’s alphas for frequency and severity change. Statistics and graphs were computed with Stata/SE version 14.2 (StataCorp LP, College Station, Texas, USA).
RESULTS
Scale development
In a recent extensive literature review on BPSD in DS, we concluded that BPSD appear to be altered in DS, but that study results have not been consistent [15]. Therefore, an inclusive approach was adopted, not omitting BPSD items in advance. The administered version of the scale finally consisted of 83 behavioral items categorized in 12 clinically defined sections: 1) anxiety & nervousness, 2) sleep disturbances, 3) irritability, 4) obstinacy, 5) agitation & stereotypical behavior, 6) aggression, 7) apathy & aspontaneity, 8) depressive symptoms, 9) delusions, 10) hallucinations, 11) disinhibition & sexual behavior, and 12) eating/drinking behavior.
Population demographics
In total, 299 informant interviews were conducted, among which 18 interviews had to be excluded for various reasons (Fig. 1). 281 valid assessments were included for analysis. ID severity ranged from mild (4.6%), mild-moderate (25.6%), moderate (55.2%), moderate-severe (8.5%) to severe (6.0%). Table 1 depicts the demographic data for each of the three gender-matched groups: DS (n = 149, 53.0%), DS+Q (n = 65, 23.1%) and DS+AD (n = 67, 23.8%). One half of the cohort did not have signs of dementia, while the other half was suspected of, or diagnosed with dementia. The DS+AD group was logically the oldest.
Fig.1
Schematic overview of included and excluded BPSD-DS informant interviews, subdivided in the three diagnostic groups. BPSD-DS, Behavioral and Psychological Symptoms of Dementia in Down Syndrome scale; CVA, cerebrovascular accident.
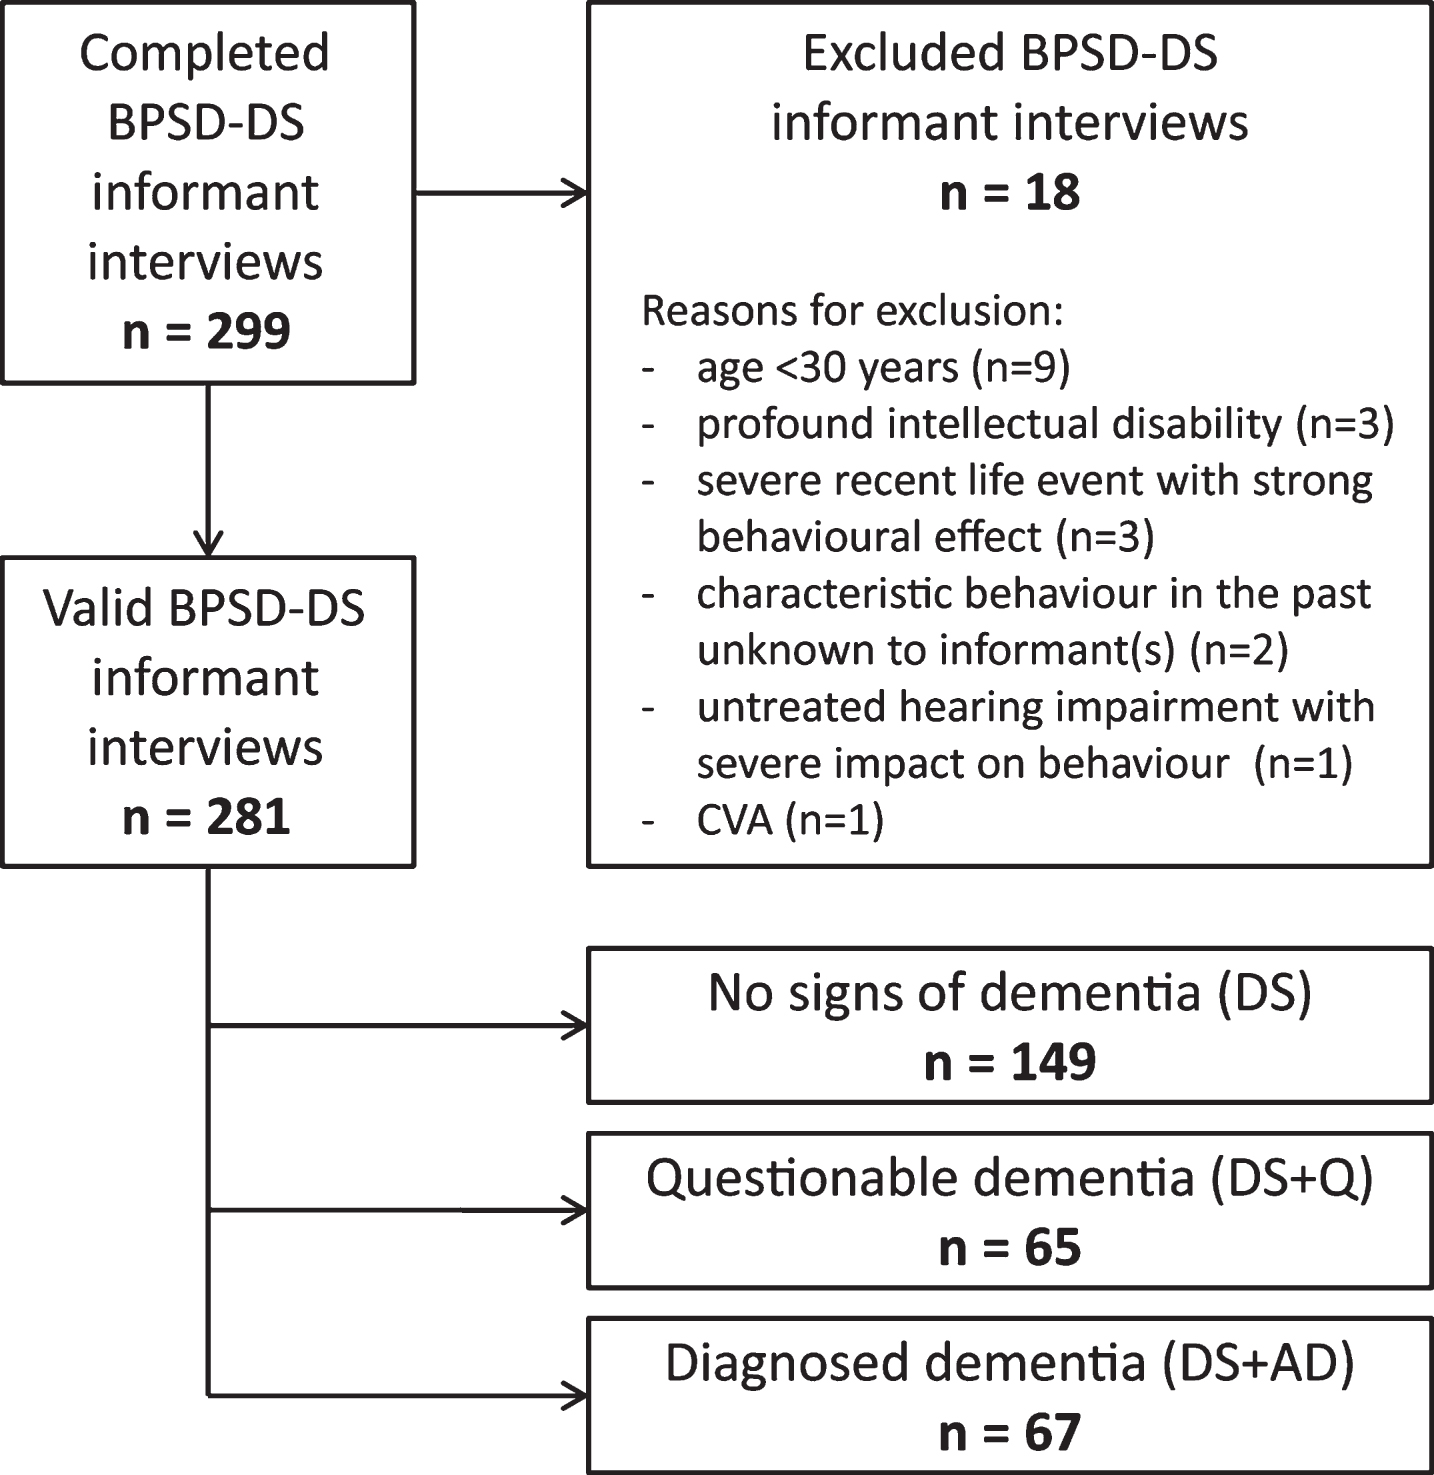
Table 1
Characteristics of the three diagnostic study groups
| No signs of dementia (DS; n = 149) | Questionable dementia (DS+Q; n = 65) | Diagnosed dementia (DS+AD; n = 67) | p-value | |
| Gender (N males; %) | 73♂ (49.0%) | 34♂ (52.3%) | 33♂ (49.3%) | 0.90 |
| Age (median + range) | 47.42 (31.08–64.17) | 53.25 (36.58–74.25) | 57.92 (40.67–72.75) | <0.001 |
| Living independently; with family; assisted | 2.0%; 28.2%; 69.8% | 3.1%; 29.2%; 67.7% | 0.0%; 17.9%; 82.1% | 0.26 |
| Attending day-care | 82.6% | 81.5% | 82.1% | 0.98 |
| Type of DS: full trisomy 21; translocation; | 47.0%; 1.3%; | 40.0%; 1.5%; | 44.8%; 1.5%; | 0.67 |
| mosaicism; no chromosomal analysis | 0.0%; 51.7% | 1.5%; 56.9% | 0.0%; 53.7% | |
| Depression | 12.8% | 9.2% | 16.4% | 0.47 |
| Epilepsy | 4.0% | 6.2% | 23.9% | <0.001 |
| Hypothyroidism | 48.3% | 50.8% | 38.8% | 0.32 |
| Sleep problems | 17.4% | 31.3% | 25.4% | 0.07 |
| Vitamin B12 deficiency | 2.7% | 4.6% | 7.5% | 0.27 |
| Impaired mobility | 4.0% | 4.6% | 26.9% | <0.001 |
| Dental/physical eating problems | 6.7% | 13.8% | 23.9% | 0.002 |
| Hearing impairment | 32.2% | 40.0% | 52.2% | 0.020 |
| Vision impairment | 67.1% | 72.3% | 83.6% | 0.04 |
| Any psychoactive medication | 25.5% | 26.2% | 59.7% | <0.001 |
| - antidepressants | 12.8% | 10.8% | 22.7% | 0.10 |
| - anti-epileptics | 4.7% | 9.2% | 30.3% | <0.001 |
| - antipsychotics | 10.8% | 9.2% | 12.1% | 0.87 |
| - anxiolytics | 2.0% | 3.1% | 12.1% | 0.004 |
| - anti-dementia | 0.0% | 0.0% | 13.4% | <0.001 |
Apart from the comparison of age (Kruskal-Wallis test), Pearson’s chi-squared tests were applied to compare (categorical) demographic data between groups. p-values below 0.0275 are considered significant and reported with three decimals; non-significant p-values with two decimals. All individuals diagnosed with epilepsy and vitamin B12 deficiency received treatment. Among those diagnosed with depression (DS, n = 2; DS+Q, n = 1), hypothyroidism (DS, n = 2), sleep problems (DS, n = 8; DS+Q, n = 11; DS+AD, n = 4), hearing impairment (DS, n = 21; DS+Q, n = 13; DS+AD, n = 10) and vision impairment (DS, n = 13; DS+Q, n = 15; DS+AD, n = 9), a number of individuals were not specifically treated at the moment of assessment. However, these individuals showed a normal level of functioning and showed no evident behavioral effect caused by this impairment (clinical judgement). DS, Down syndrome without signs of dementia; DS+Q, Down syndrome with questionable dementia; DS+AD, Down syndrome with diagnosed AD.
A total of 491 informants (22% male; 78% female) participated in the 281 valid assessments: 71 interviews were conducted with one key informant, 166 interviews with two informants, and 22 with three informants. Among all informants, 48.7% were professional caregivers and 51.3% familial caregivers. The time the informants knew the person with DS had a median of 30 years (IQR: 6–49 years). More specifically, this concerned a median of 6 years (IQR: 3.5–13 years) for professional caregivers, and a median of 48.5 years (IQR: 41–53 years) for familial caregivers.
Reliability
Frequency and severity were scored per item for two periods of time, resulting in change scores for frequency and severity, respectively. Table 2 shows the first interrater and test-retest reliability data (percent agreement) for frequency change and severity change. Interrater reliability, assessed in a subset of 64 individuals (22.8%): DS (n = 36), DS+Q (n = 13) and DS+AD (n = 15), was high, indicating that the structured interview set-up and defined scoring definitions were not subject to evident interpretation differences between raters. These interrater reliability data do not give cause for removal of items. Next, test-retest reliability was assessed for a subset of 29 individuals (10.3%): DS (n = 13), DS+Q (n = 10) and DS+AD (n = 6). One individual with DS who showed strong (behavioral) decline in the period between both interviews (clinical judgement) was excluded from analysis. Shown in Table 2, test-retest reliability was good, although somewhat lower than for interrater reliability. These exploratory data give an indication of the test-retest reliability of the items. Due to practical constraints, we were not able to perform more retest interviews, unfortunately. Given the fact that these results were obtained in a rather small number of test-retest interviews, potential item removal is insufficiently substantiated at this stage if solely based on test-retest reliability data, and thus needs further study. Finally, among all items, a high level of internal consistency was shown for both frequency change (Cronbach’s alpha = 0.898) and severity change (0.882). Individual items had Cronbach’s alphas above 0.89 (frequency change) and 0.87 (severity change), thus not requiring removal of items. Taken together, the first exploratory reliability and consistency data do not suggest the necessity for items to be removed, keeping all items at this stage.
Table 2
Interrater and test-retest reliability
| Section | Number of items | Interrater reliability (% agreement) | Test-retest reliability (% agreement) | ||
| Frequency change | Severity change | Frequency change | Severity change | ||
| 1) Anxiety & nervousness | 7 | 96.8–100 | 96.8–100 | 75.9–96.6 | 79.3–96.6 |
| 2) Sleep disturbances | 7 | 95.2–100 | 96.8–100 | 69.0–100 | 79.3–100 |
| 3) Irritability | 4 | 95.2–100 | 98.4–100 | 62.1–93.1 | 65.5–93.1 |
| 4) Obstinacy | 5 | 92.1–100 | 96.8–100 | 79.3–86.2 | 82.8–93.1 |
| 5) Agitation & stereotypical behavior | 7 | 96.9–100 | 100–100 | 72.4–96.6 | 82.8–100 |
| 6) Aggression | 4 | 98.4–100 | 96.8–100 | 69.0–100 | 82.8–100 |
| 7) Apathy & aspontaneity | 10 | 95.3–100 | 98.4–100 | 75.9–89.7 | 82.8–100 |
| 8) Depressive symptoms | 10 | 95.3–100 | 95.3–100 | 79.3–100 | 79.3–100 |
| 9) Delusions | 6 | 96.9–100 | 100–100 | 89.7–100 | 86.2–100 |
| 10) Hallucinations | 6 | 100–100 | 98.4–100 | 89.7–100 | 96.6–100 |
| 11) Disinhibition & sexual behavior | 8 | 98.4–100 | 100–100 | 79.3–100 | 93.1–100 |
| 12) Eating and drinking | 9 | 96.9–100 | 96.8–100 | 82.8–100 | 89.7–100 |
Interrater reliability and test-retest reliability are provided as percent agreement. For each behavioral section, the range of agreement for individual items is given, i.e., the lowest and the highest percent agreement for items in that particular section. DS, Down syndrome without signs of dementia; DS+Q, Down syndrome with questionable dementia; DS+AD, Down syndrome with diagnosed AD.
Item relevance
Central aim in this study concerned the identification of relevant behavioral items. To establish the true relevance of the 83 items, frequency change and severity change scores were compared across the three study groups to identify whether or not these symptoms changed with the presence of (questionable) dementia and could thus possibly differentiate between groups. Hereafter the content and results of the individual items are described per behavioral section. p-values are provided for frequency (pfq) or severity (psv) change scores: p-values below 0.0275 are considered significant and reported (below) with three decimals; non-significant p-values with two decimals. Figures 2–8 visualize the significant frequency and severity changes in stacked bar charts, providing a simplified depiction of the results, i.e., the total proportion of individuals in each group showing decreased, unaltered or increased scores. Frequency change and severity change sum scores per section and for the total scale were calculated and compared between the groups as well (Table 3).
Fig.2
Significant frequency changes and severity changes for items in section 1 (anxiety & nervousness). The proportion of individuals (%) showing decreased, unaltered or increased scores is depicted per study group. Specifically, the black sections and corresponding percentage (top), the pale grey sections and corresponding percentage (middle) and the grey sections and corresponding percentage (bottom) respectively indicate the proportion of each study group showing a decreased, unaltered or increased frequency/severity. Statistics (Kruskal-Wallis group comparisons) and further item descriptions, including items that did not significantly differ between groups, are provided in the text. DS, Down syndrome without signs of dementia; DS+Q, Down syndrome with questionable dementia; DS+AD, Down syndrome with diagnosed AD.
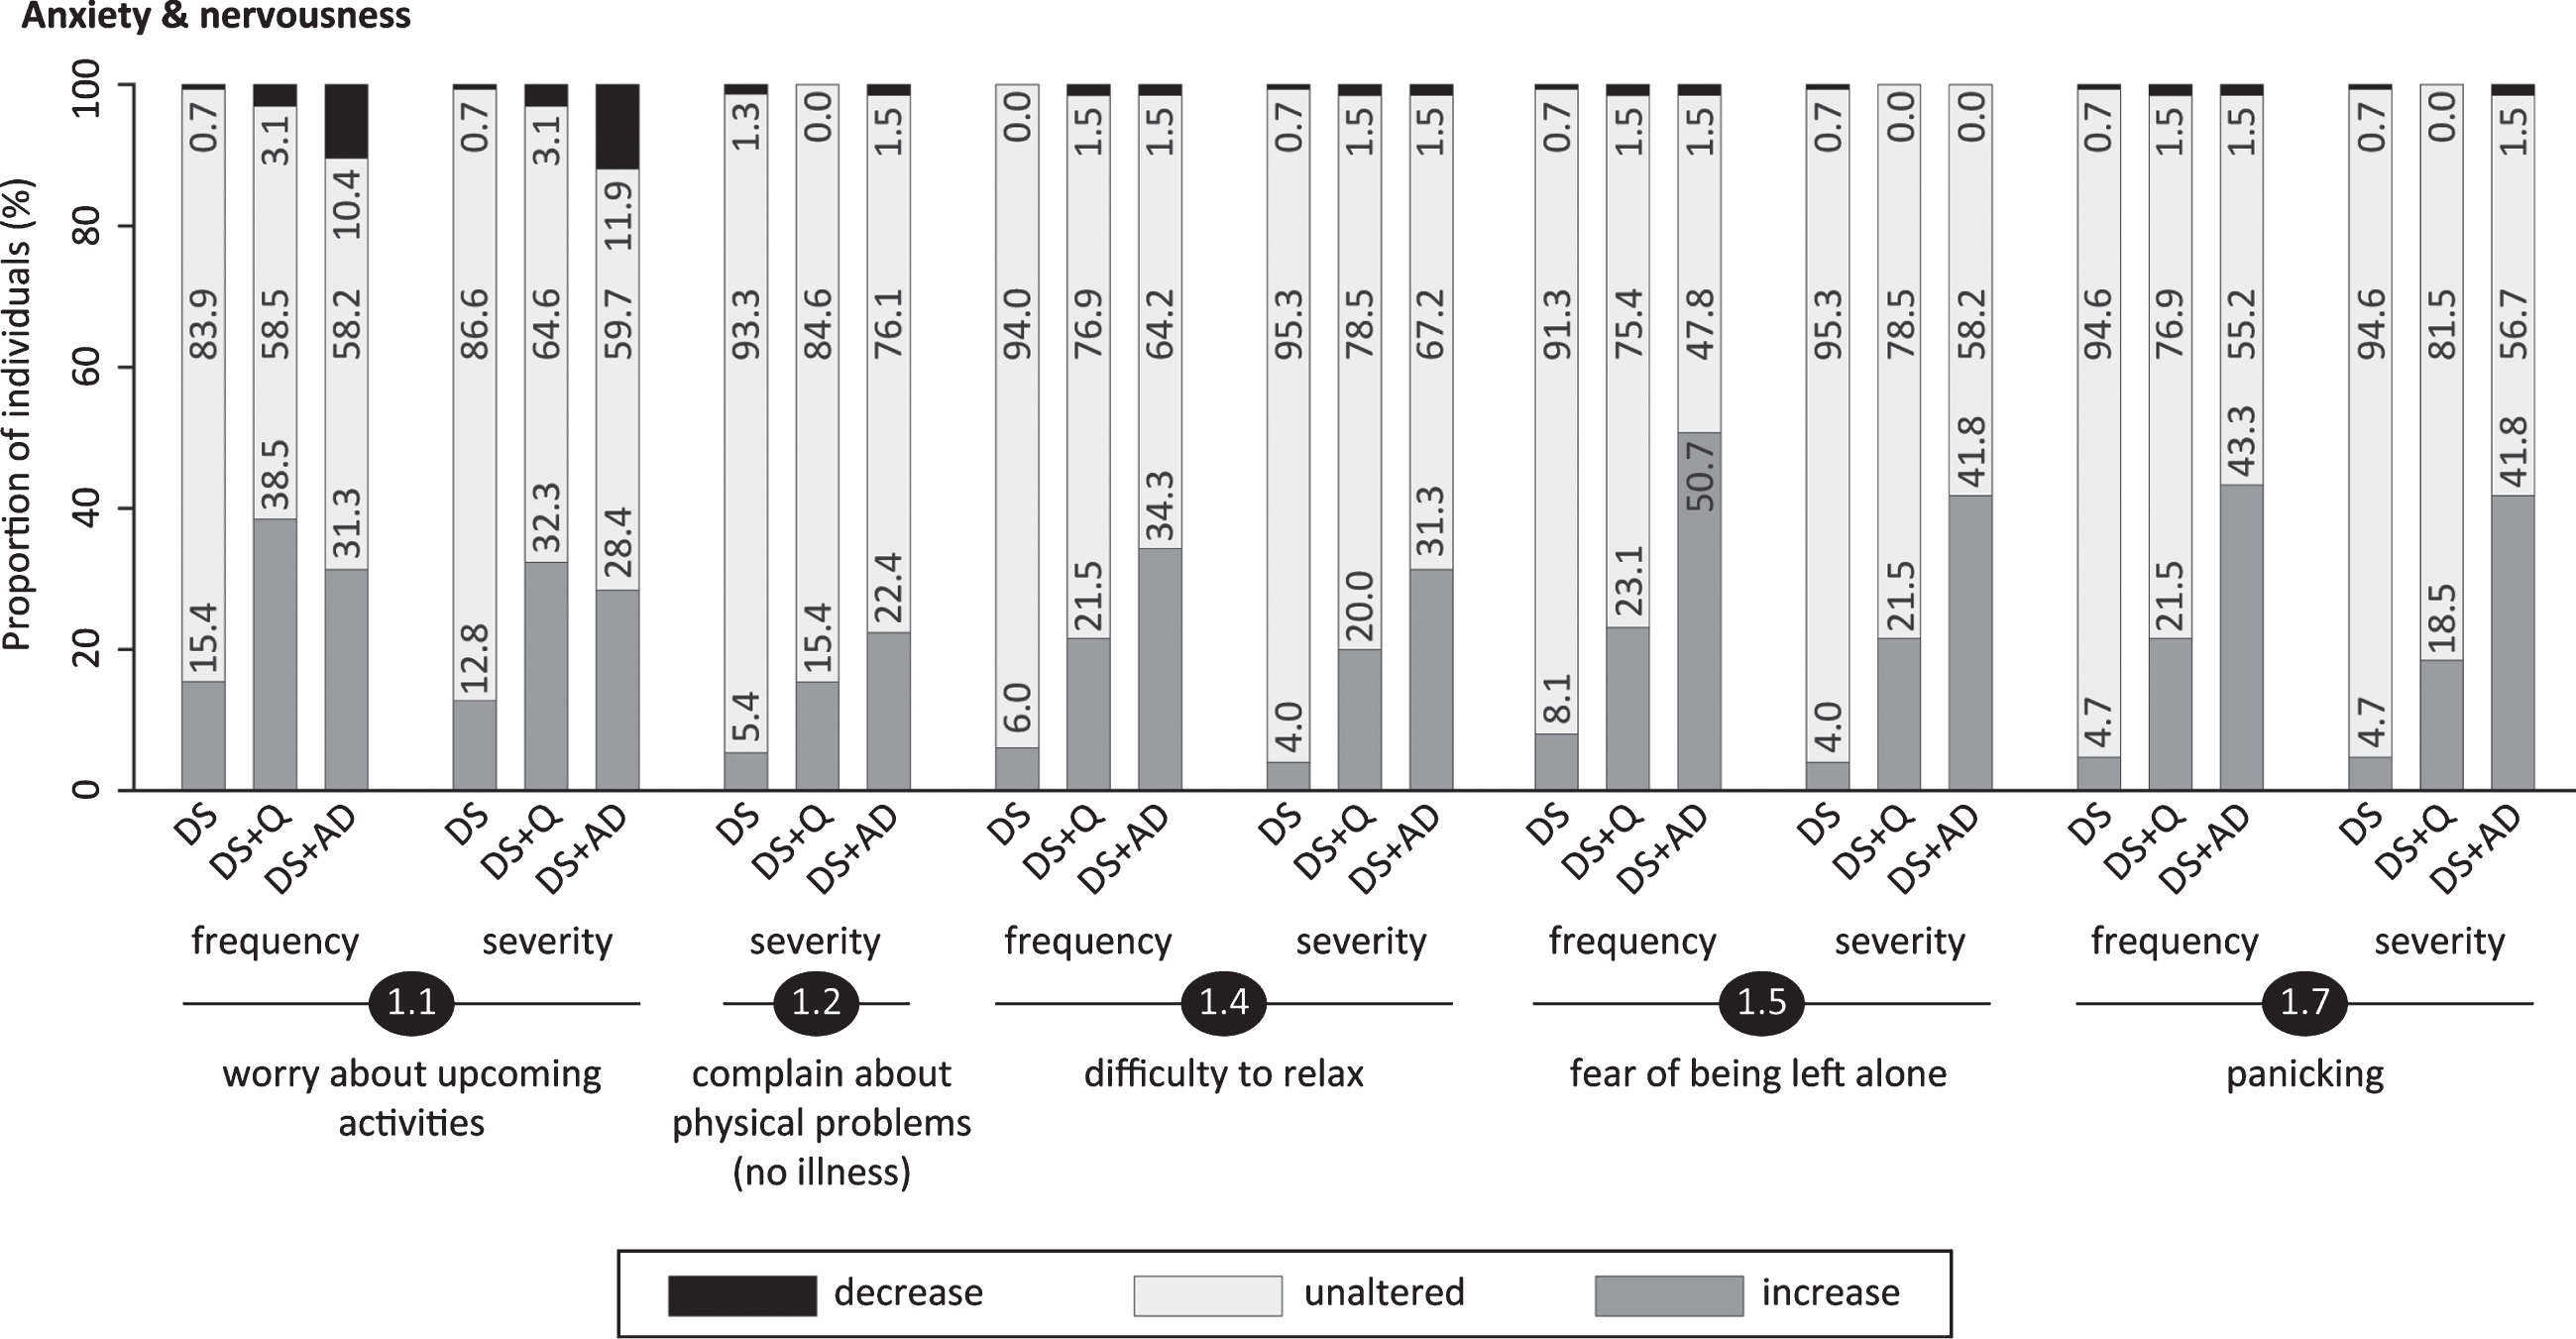
Section 1: Anxiety & nervousness
Items addressed worrying about upcoming activities (item 1.1; pfq = 0.009, psv = 0.017), visiting the toilet unnecessarily frequently or complaining about physical problems not explained by the presence of an illness (1.2; pfq = 0.06, psv = 0.001), hyperventilation (1.3; pfq = 0.17, psv = 0.32), difficulty to relax (1.4; pfq < 0.001, psv < 0.001), fear of being left alone (1.5; pfq < 0.001, psv < 0.001), avoidance behavior (1.6; pfq = 0.05, psv = 0.27) and panicking (1.7; pfq < 0.001, psv < 0.001). Figure 2 shows that the proportion of individuals presenting an increase was consistently lowest in DS, intermediate in DS+Q and highest in DS+AD. In item 1.1, however, the proportion was highest in DS+Q, closely followed by DS+AD. Changes in anxiety were further emphasized by section scores, again being lowest in DS and highest in DS+AD (Table 3).
Section 2: Sleep disturbances
Items evaluated difficulty falling asleep (2.1; pfq = 0.001, psv < 0.001), repetitive sleep awakenings (2.2; pfq = 0.007, psv = 0.007), night-time wandering (2.3; pfq = 0.015, psv < 0.001), waking up early (2.4; pfq = 0.15, psv = 0.21), difficulty getting out of bed (2.5; pfq = 0.007, psv = 0.17), tiredness/fatigue (2.6; pfq < 0.001, psv = 0.002) and daytime sleeping (2.7; pfq < 0.001, psv = 0.003). Interestingly, frequency and severity changes were pronounced in both DS+Q and DS+AD (Fig. 3). Supported by section scores (Table 3), DS+Q and DS+AD displayed relatively similar patterns of change, suggesting that sleep disturbances may already occur in an early stage of the disease, and continue to be present with progression of AD.
Fig.3
Significant frequency changes and severity changes for items in sections 2 (sleep disturbances) and 3 (irritability). The proportion of individuals showing decreased, unaltered or increased scores is depicted per study group. Specifically, the black sections and corresponding percentage (top), the pale grey sections and corresponding percentage (middle) and the grey sections and corresponding percentage (bottom) respectively indicate the proportion of each study group showing a decreased, unaltered or increased frequency/severity. Statistics (Kruskal-Wallis group comparisons) and further item descriptions, including items that did not significantly differ between groups, are provided in the text. DS, Down syndrome without signs of dementia; DS+Q, Down syndrome with questionable dementia; DS+AD, Down syndrome with diagnosed AD.
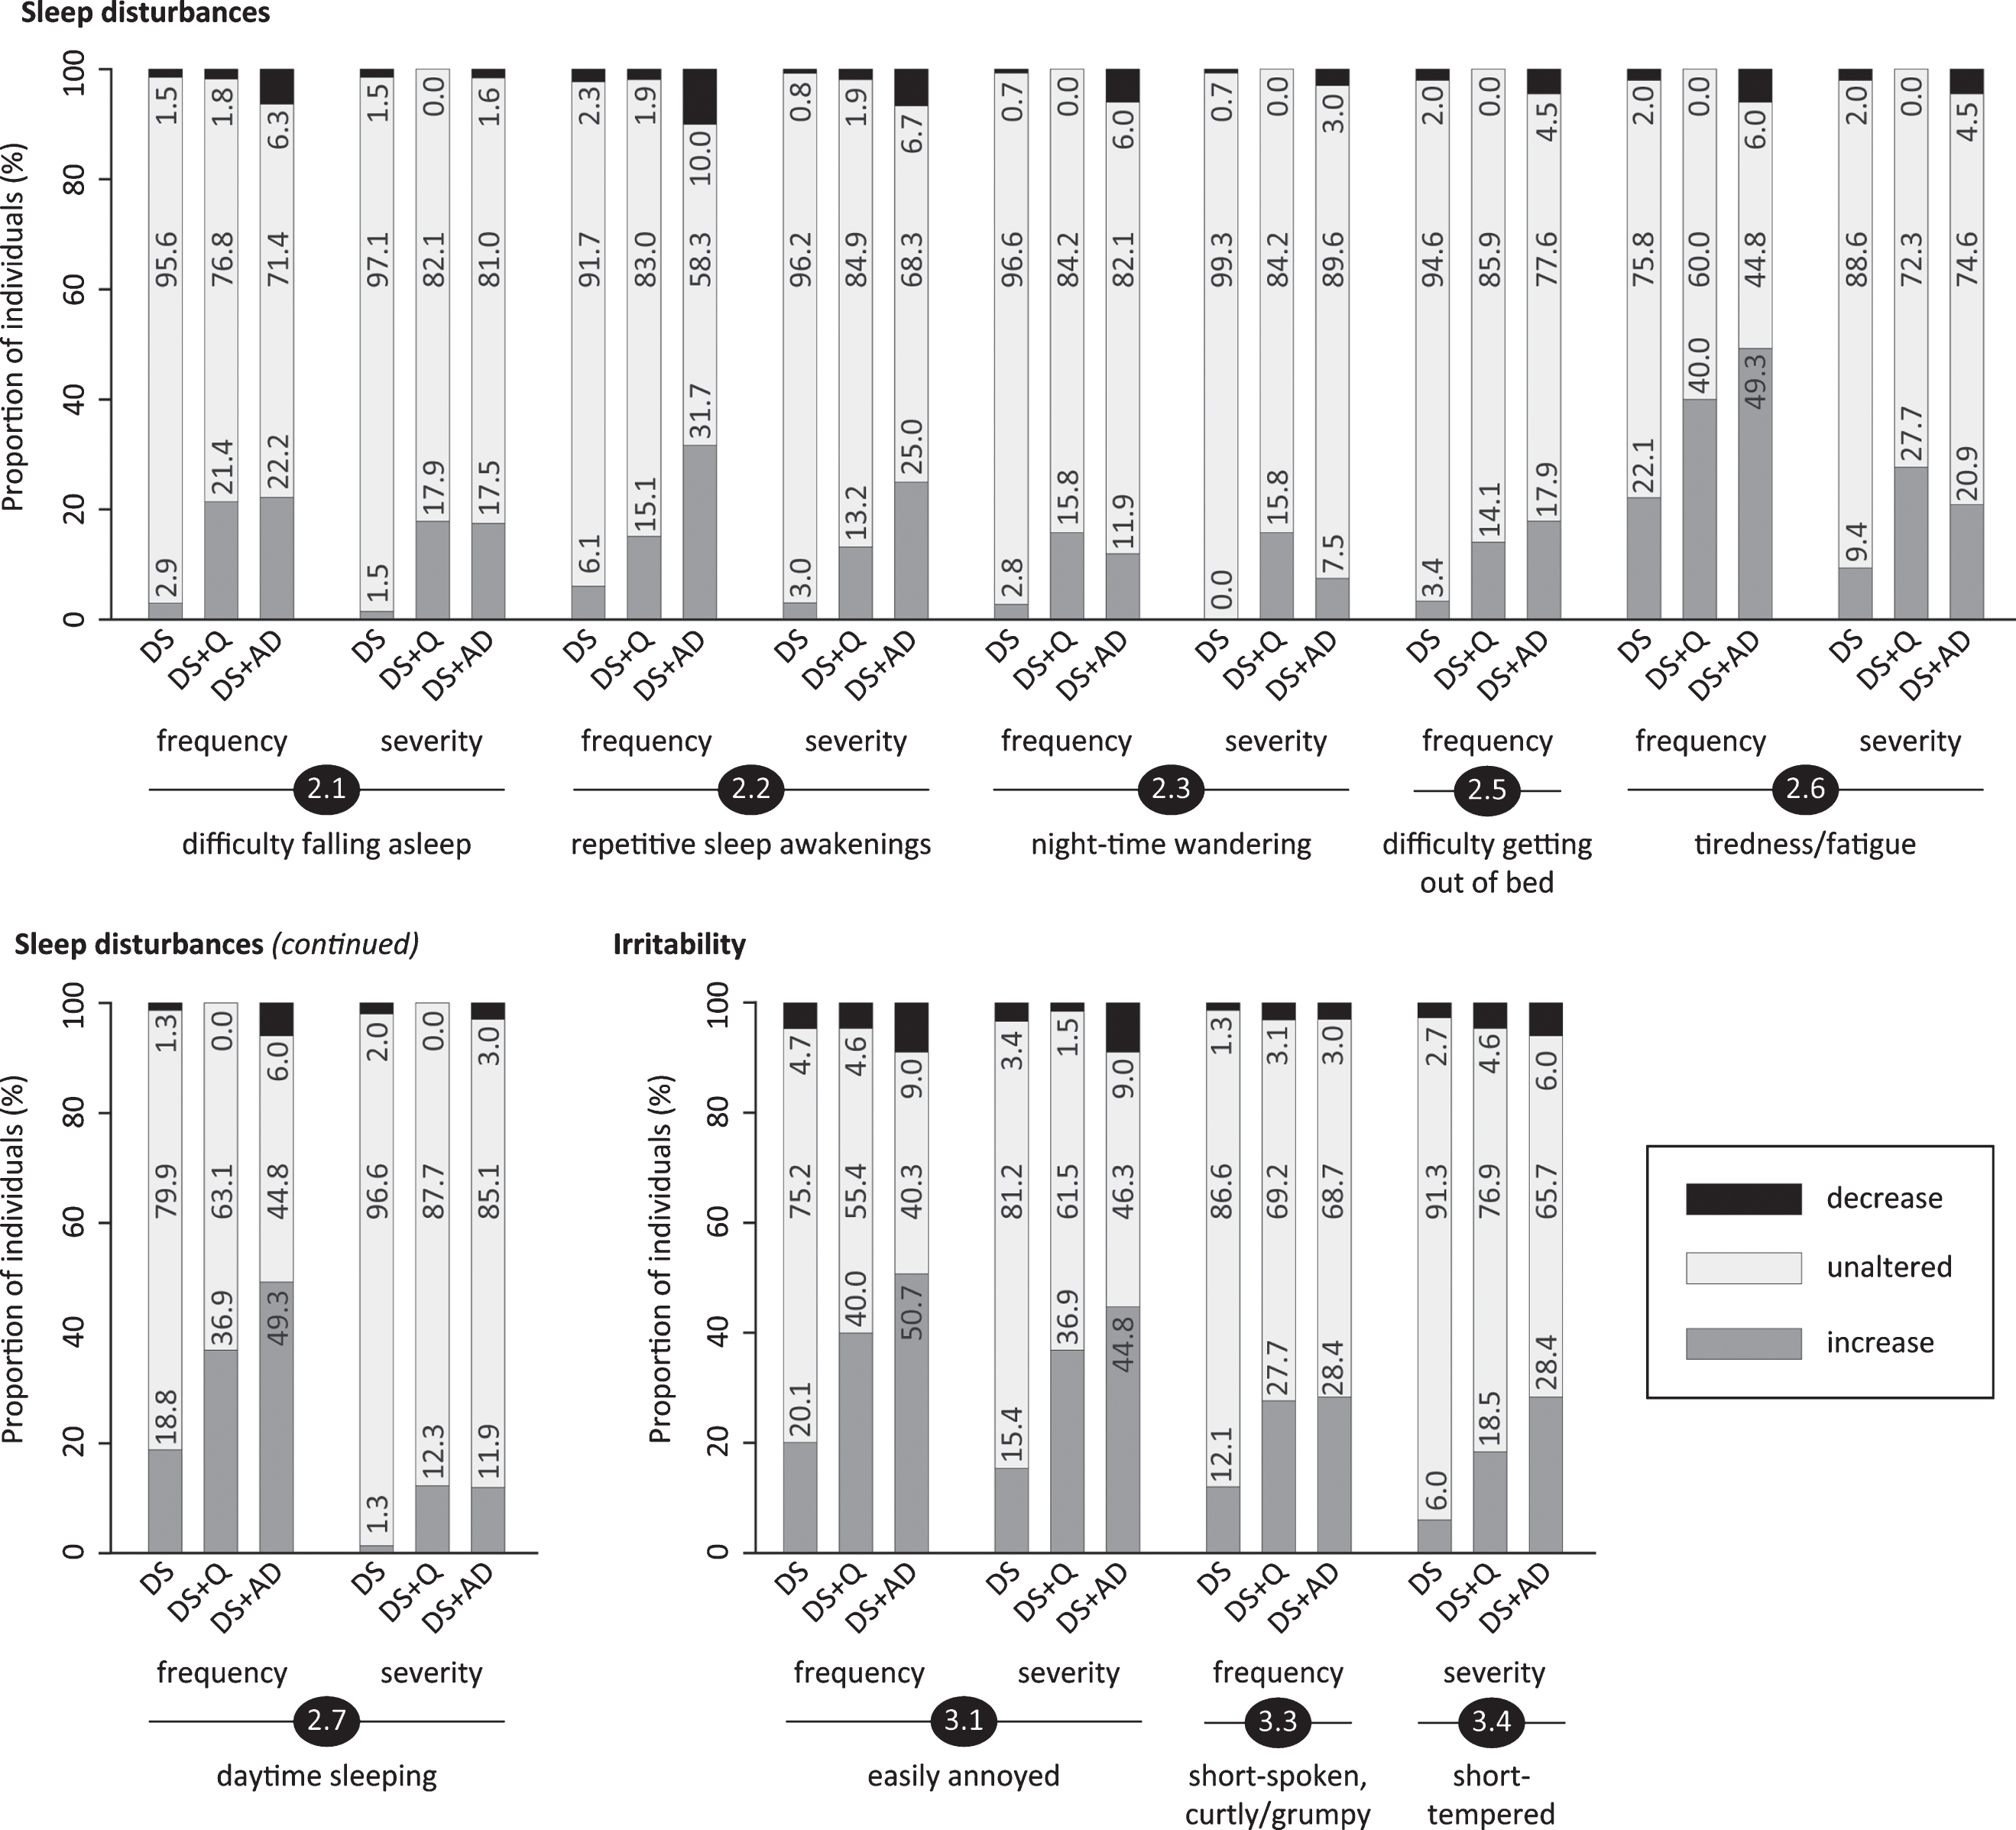
Section 3: Irritability
Being easily annoyed (3.1; pfq < 0.001, psv < 0.001), being impatient (3.2; pfq = 0.25, psv = 0.03), being short-spoken, curtly/grumpy (3.3; pfq = 0.018, psv = 0.05) and being short-tempered (3.4; pfq = 0.05, psv = 0.003) were evaluated in this section. Figure 3 shows that a vast proportion of both DS+Q and DS+AD individuals presented increased irritability, which is further emphasized by section scores (Table 3). Although the proportion was consistently lowest in DS, a substantial proportion of non-demented individuals displayed increased irritability as well.
Section 4: Obstinacy
This section included items on being self-willed (4.1; pfq = 0.18, psv = 0.60), being uncooperative (4.2; pfq = 0.24, psv = 0.022), being deliberately frustrating during activities (4.3; pfq = 0.024, psv = 0.10), resistance against necessary help from caregivers (4.4; pfq = 0.05, psv = 0.004), and groaning/moaning (4.5; pfq = 0.007, psv < 0.001). In item 4.3 an evident bi-directional frequency change was observed in DS+AD: 14.9% displayed an increase, whilst 19.4% demonstrated a decrease (Fig. 4). For the other items, increased scores were primarily observed, the proportion of individuals demonstrating such an increase being highest in DS+AD and lowest in DS.
Section 5: Agitation & stereotypical behavior
Fig.4
Significant frequency changes and severity changes for items in sections 4 (obstinacy), 5 (agitation & stereotypical behavior) and 6 (aggression). The proportion of individuals showing decreased, unaltered or increased scores is depicted per study group. Specifically, the black sections and corresponding percentage (top), the pale grey sections and corresponding percentage (middle) and the grey sections and corresponding percentage (bottom) respectively indicate the proportion of each study group showing a decreased, unaltered or increased frequency/severity. Statistics (Kruskal-Wallis group comparisons) and further item descriptions, including items that did not significantly differ between groups, are provided in the text. DS, Down syndrome without signs of dementia; DS+Q, Down syndrome with questionable dementia; DS+AD, Down syndrome with diagnosed AD.
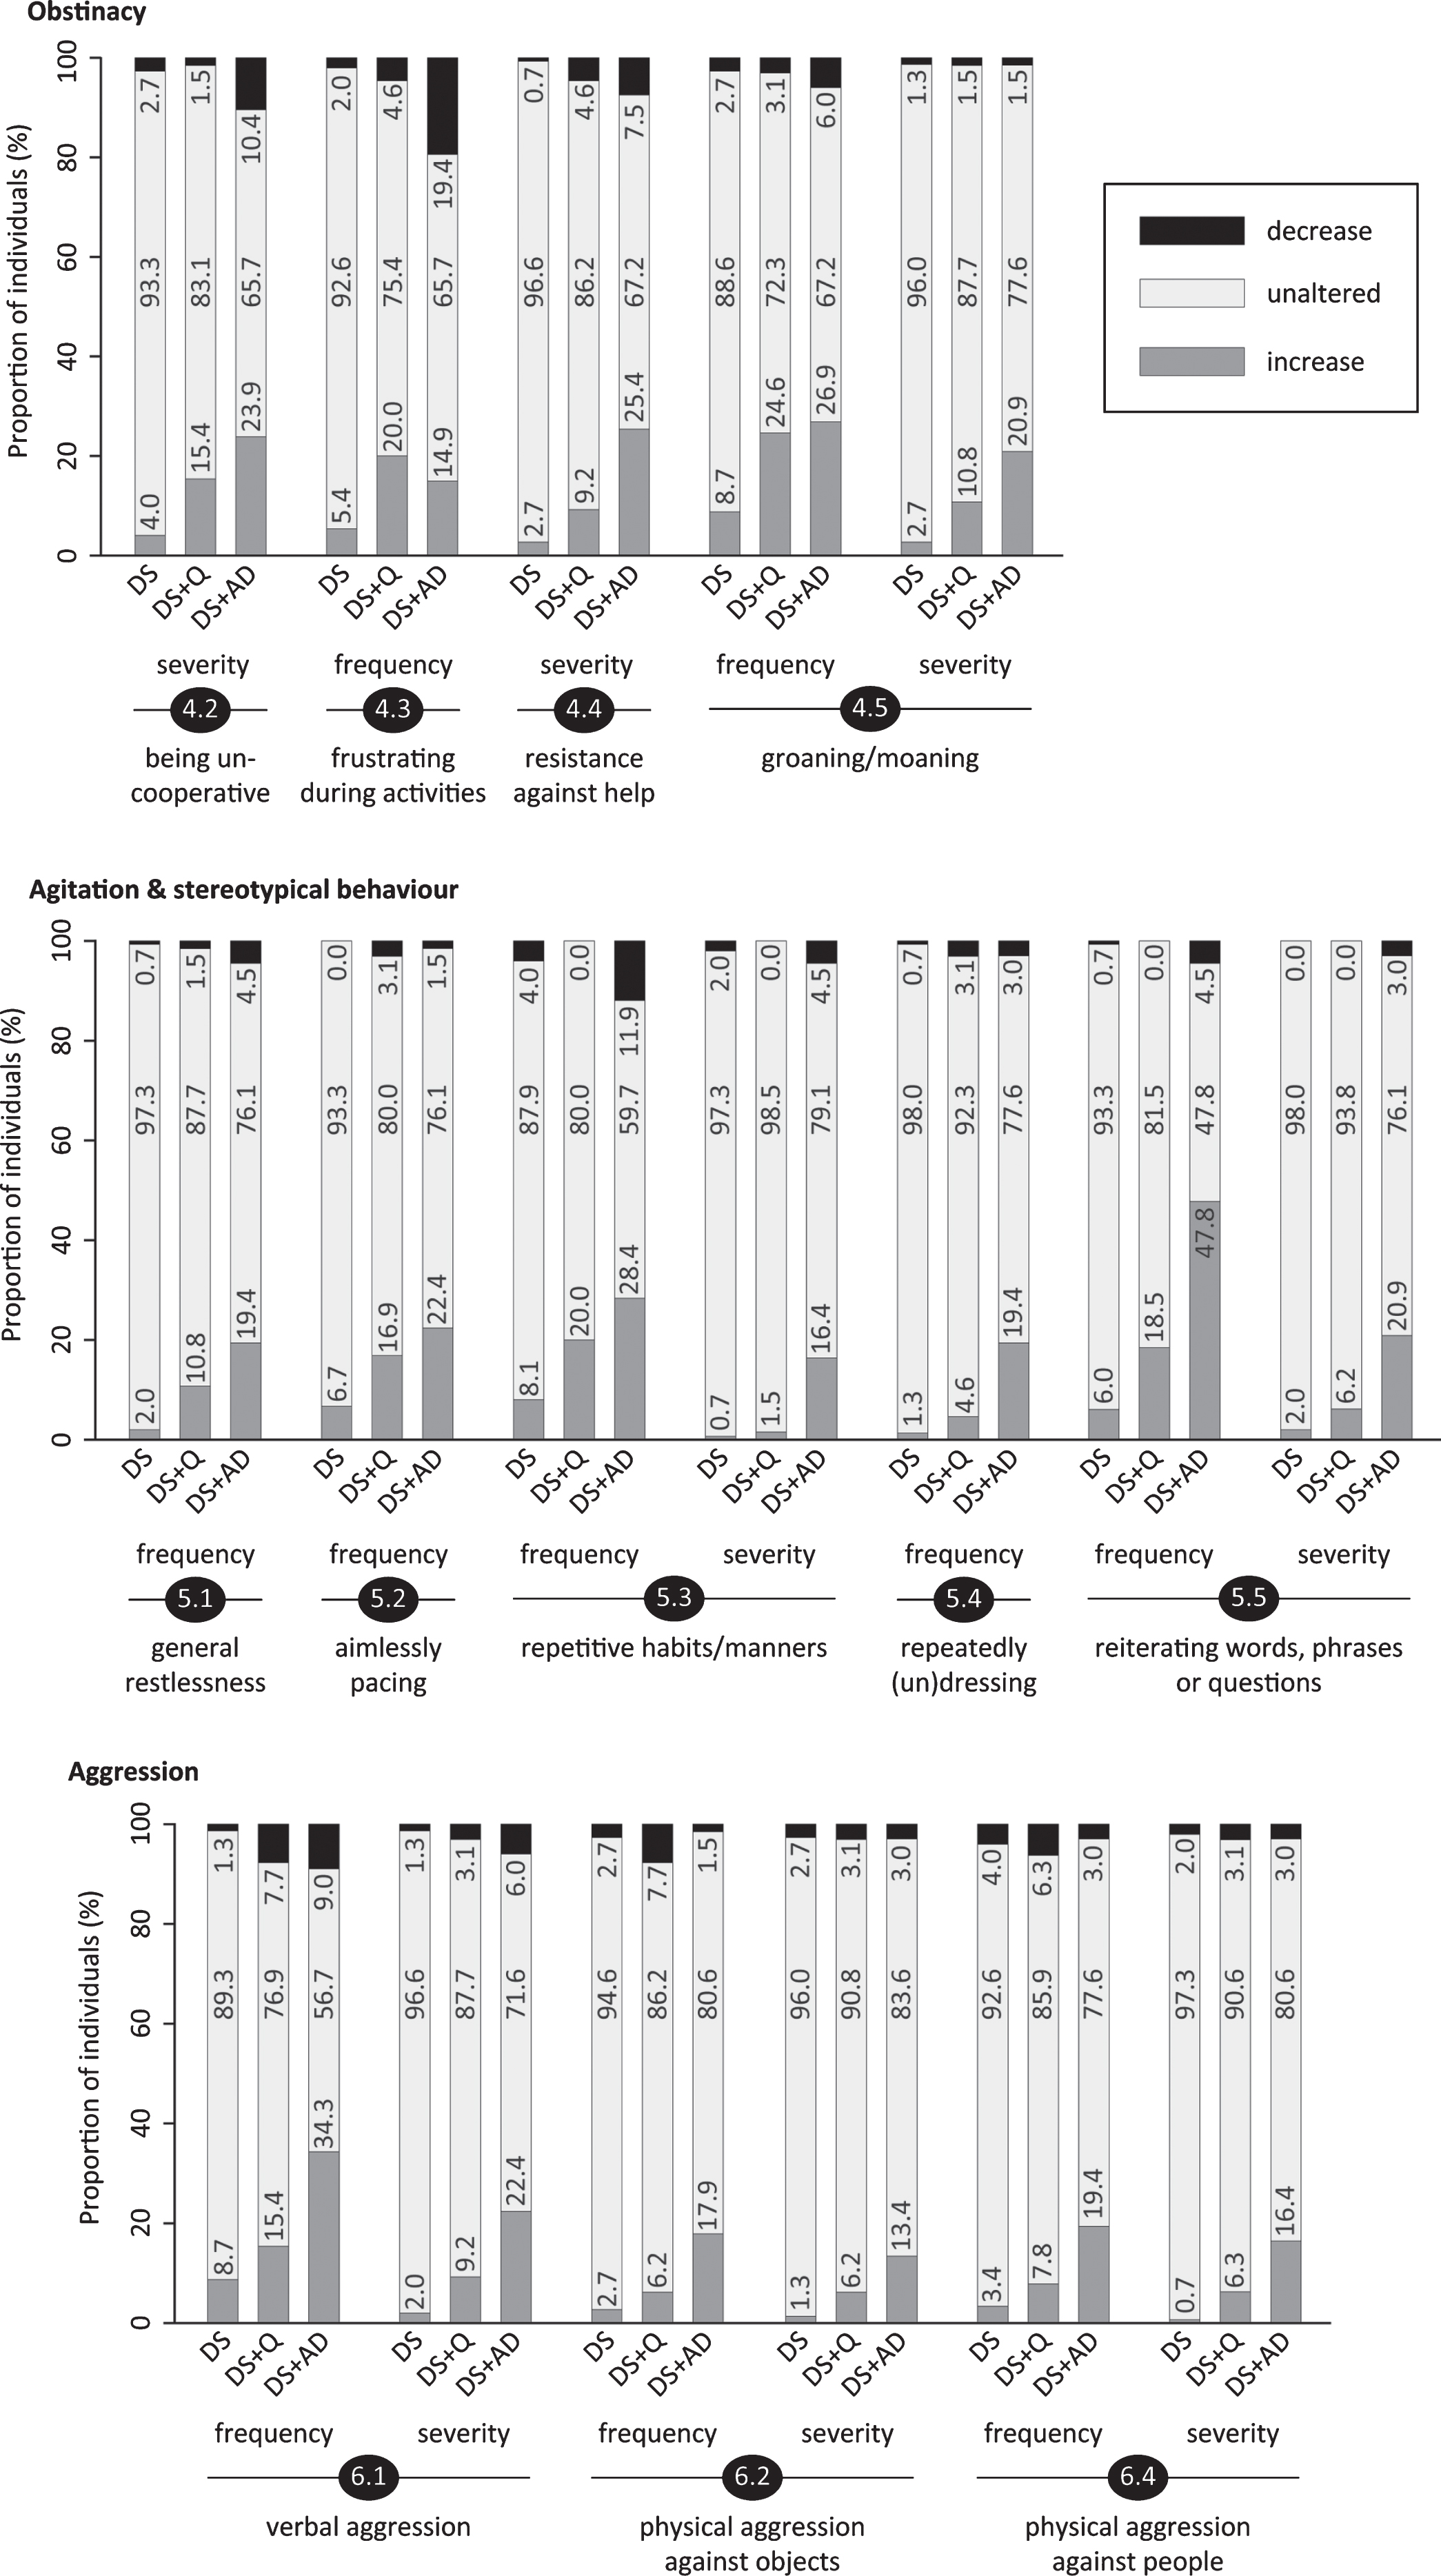
General restlessness (5.1; pfq = 0.006, psv = 0.09), aimlessly pacing (5.2; pfq = 0.011, psv = 0.03), repetitive habits or manners (5.3; pfq = 0.014, psv = 0.002), repeatedly dressing/undressing (5.4; pfq < 0.001, psv = 0.07), reiterating words, phrases or questions, i.e., verbal stereotype; not echolalia (5.5; pfq < 0.001, psv < 0.001), excessively drawing attention (5.6; pfq = 0.24, psv = 0.11) and compulsive behavior (5.7; pfq = 0.68, psv = 0.33) were evaluated. Figure 4 shows that the proportion of individuals displaying an increase was consistently highest in DS+AD and lowest in DS. The frequency change sum score for this section (Table 3) further underscored this aggravation in the demented group.
Fig.5
Significant frequency changes and severity changes for items in section 7 (apathy & aspontaneity). The proportion of individuals showing decreased, unaltered or increased scores is depicted per study group. Specifically, the black sections and corresponding percentage (top), the pale grey sections and corresponding percentage (middle) and the grey sections and corresponding percentage (bottom) respectively indicate the proportion of each study group showing a decreased, unaltered or increased frequency/severity. Statistics (Kruskal-Wallis group comparisons) and further item descriptions, including items that did not significantly differ between groups, are provided in the text. DS, Down syndrome without signs of dementia; DS+Q, Down syndrome with questionable dementia; DS+AD, Down syndrome with diagnosed AD.
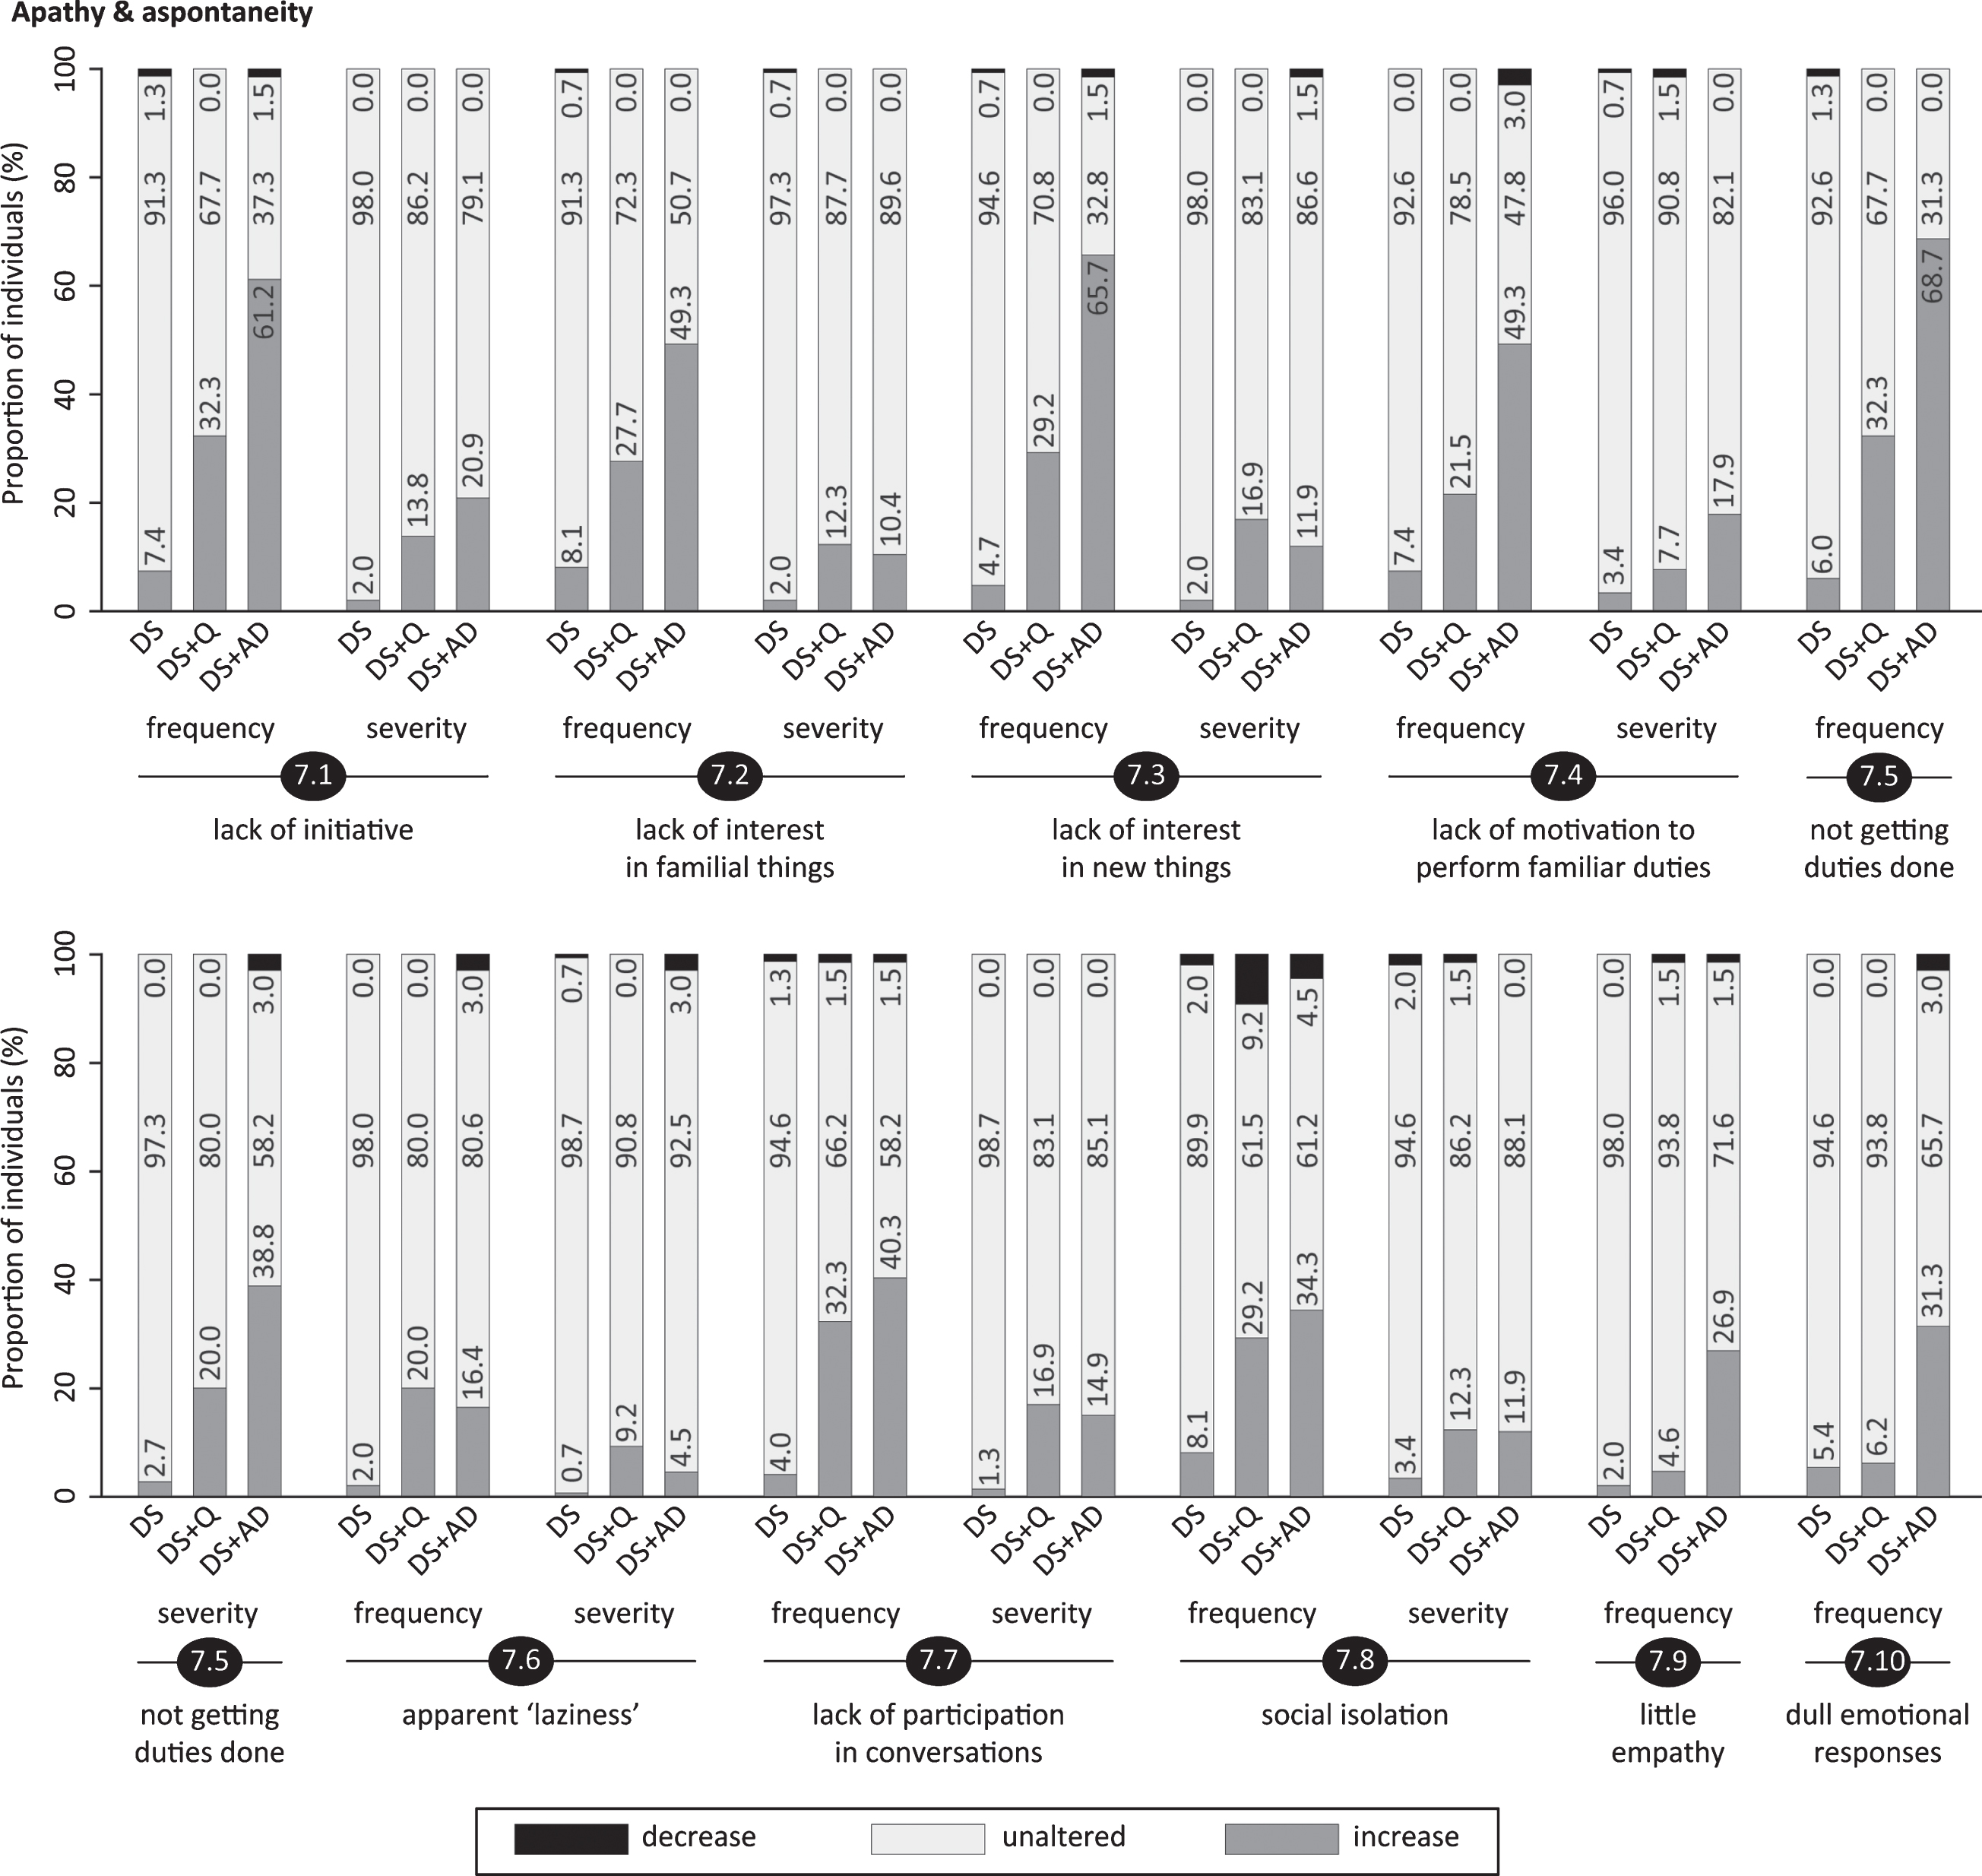
Fig.6
Significant frequency changes and severity changes for items in section 8 (depressive symptoms). The proportion of individuals showing decreased, unaltered or increased scores is depicted per study group. Specifically, the black sections and corresponding percentage (top), the pale grey sections and corresponding percentage (middle) and the grey sections and corresponding percentage (bottom) respectively indicate the proportion of each study group showing a decreased, unaltered or increased frequency/severity. Statistics (Kruskal-Wallis group comparisons) and further item descriptions, including items that did not significantly differ between groups, are provided in the text. DS, Down syndrome without signs of dementia; DS+Q, Down syndrome with questionable dementia; DS+AD, Down syndrome with diagnosed AD.
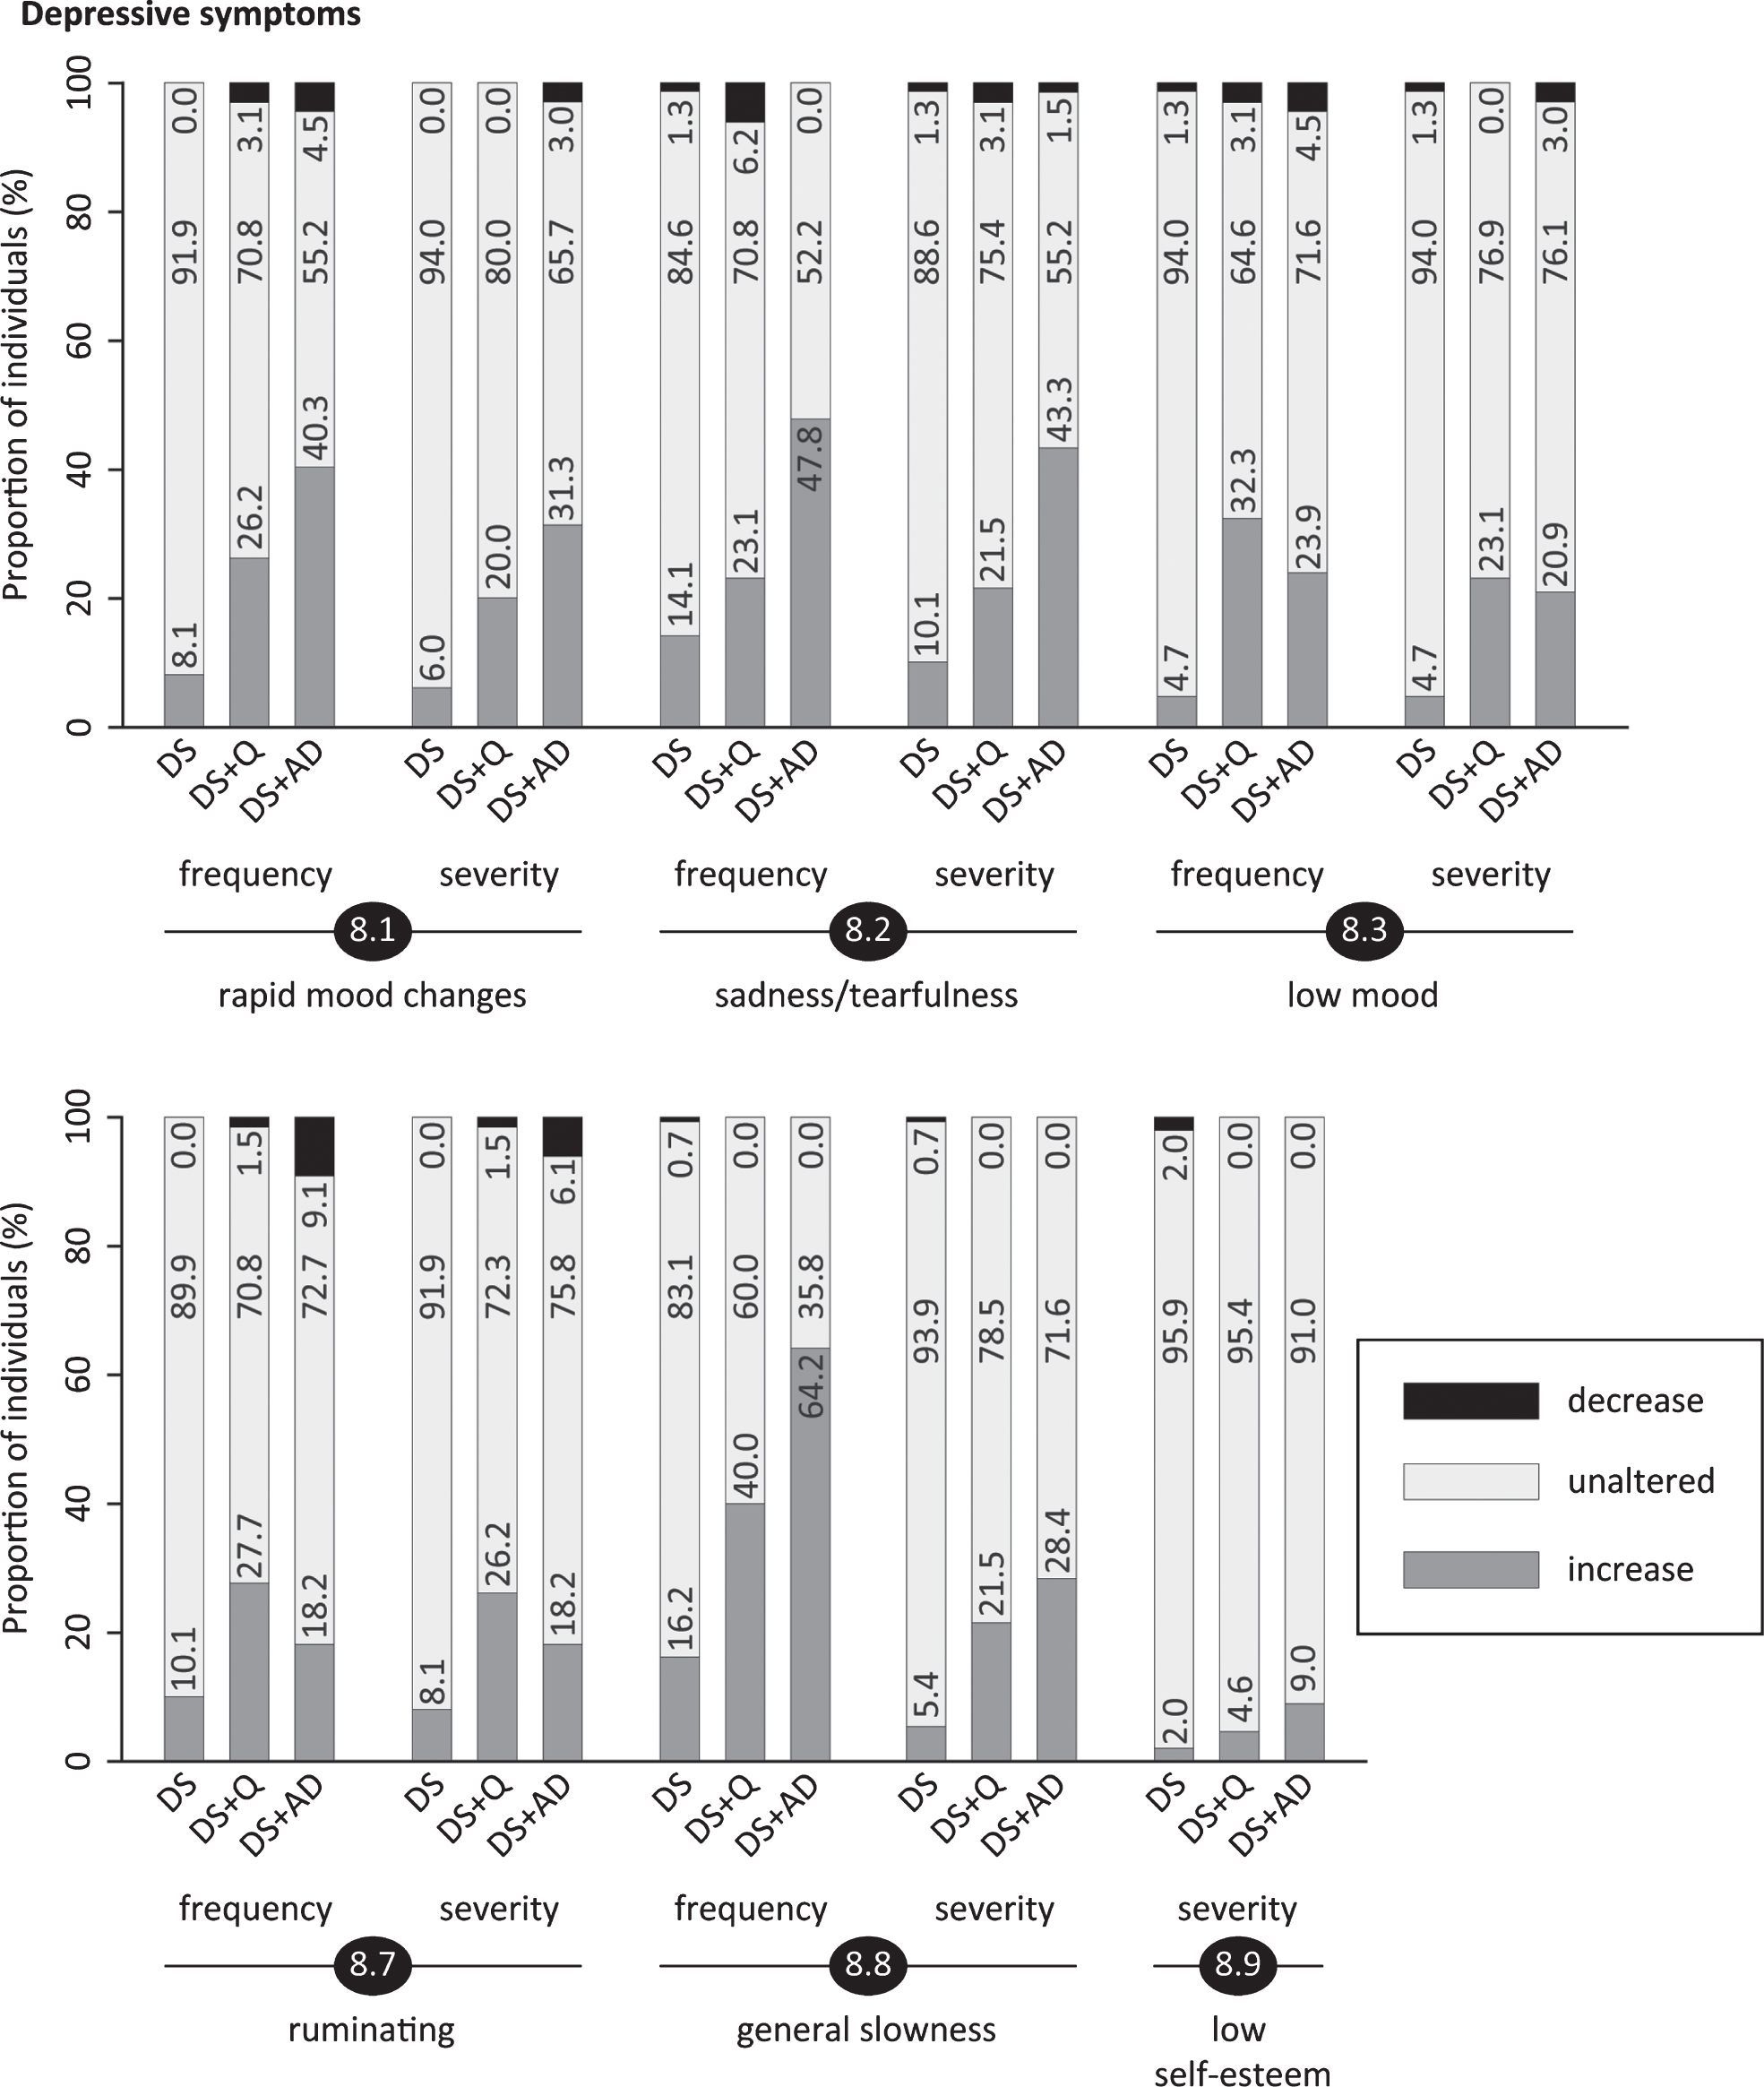
Fig.7
Significant frequency changes and severity changes for items in sections 9 (delusions), 10 (hallucinations) and 11 (disinhibition & sexual behavior). The proportion of individuals showing decreased, unaltered or increased scores is depicted per study group. Specifically, the black sections and corresponding percentage (top), the pale grey sections and corresponding percentage (middle) and the grey sections and corresponding percentage (bottom) respectively indicate the proportion of each study group showing a decreased, unaltered or increased frequency/severity. Statistics (Kruskal-Wallis group comparisons) and further item descriptions, including items that did not significantly differ between groups, are provided in the text. DS, Down syndrome without signs of dementia; DS+Q, Down syndrome with questionable dementia; DS+AD, Down syndrome with diagnosed AD.
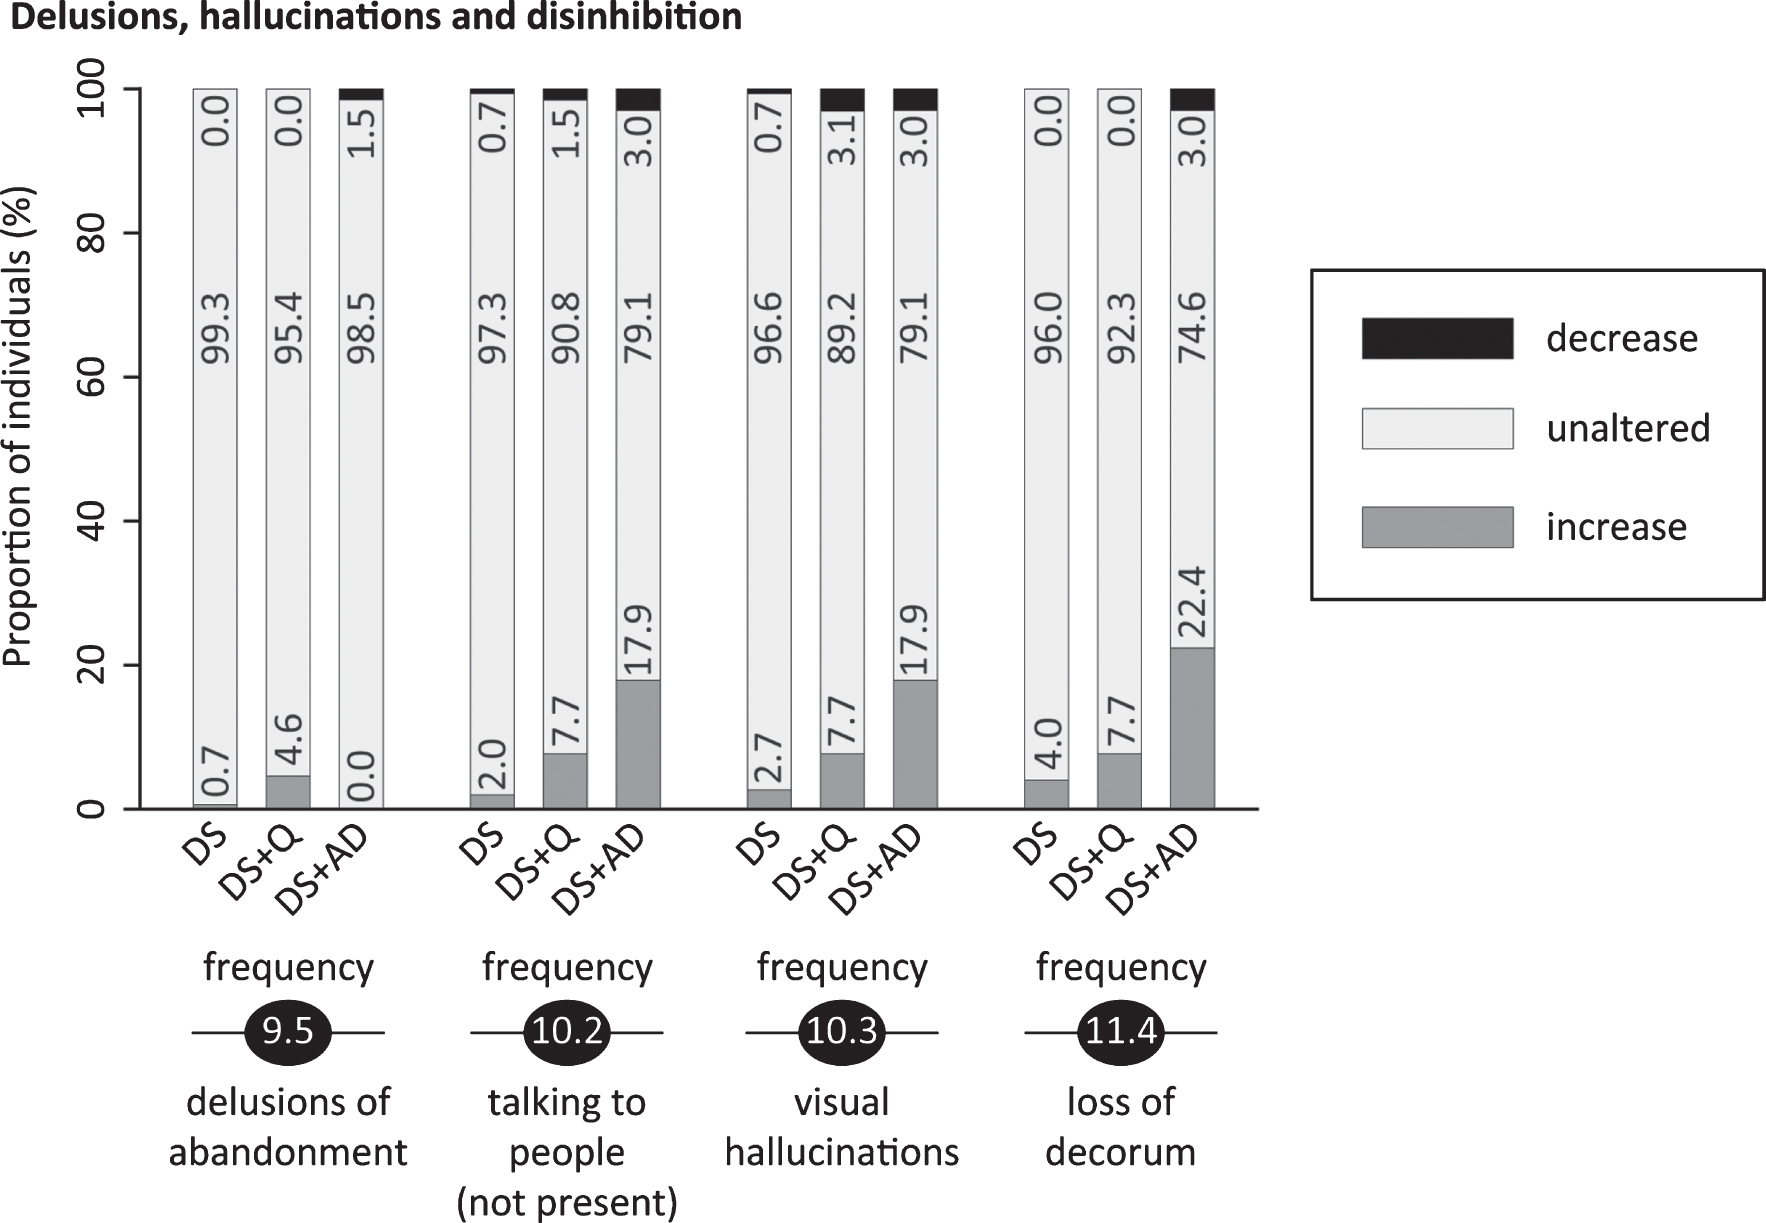
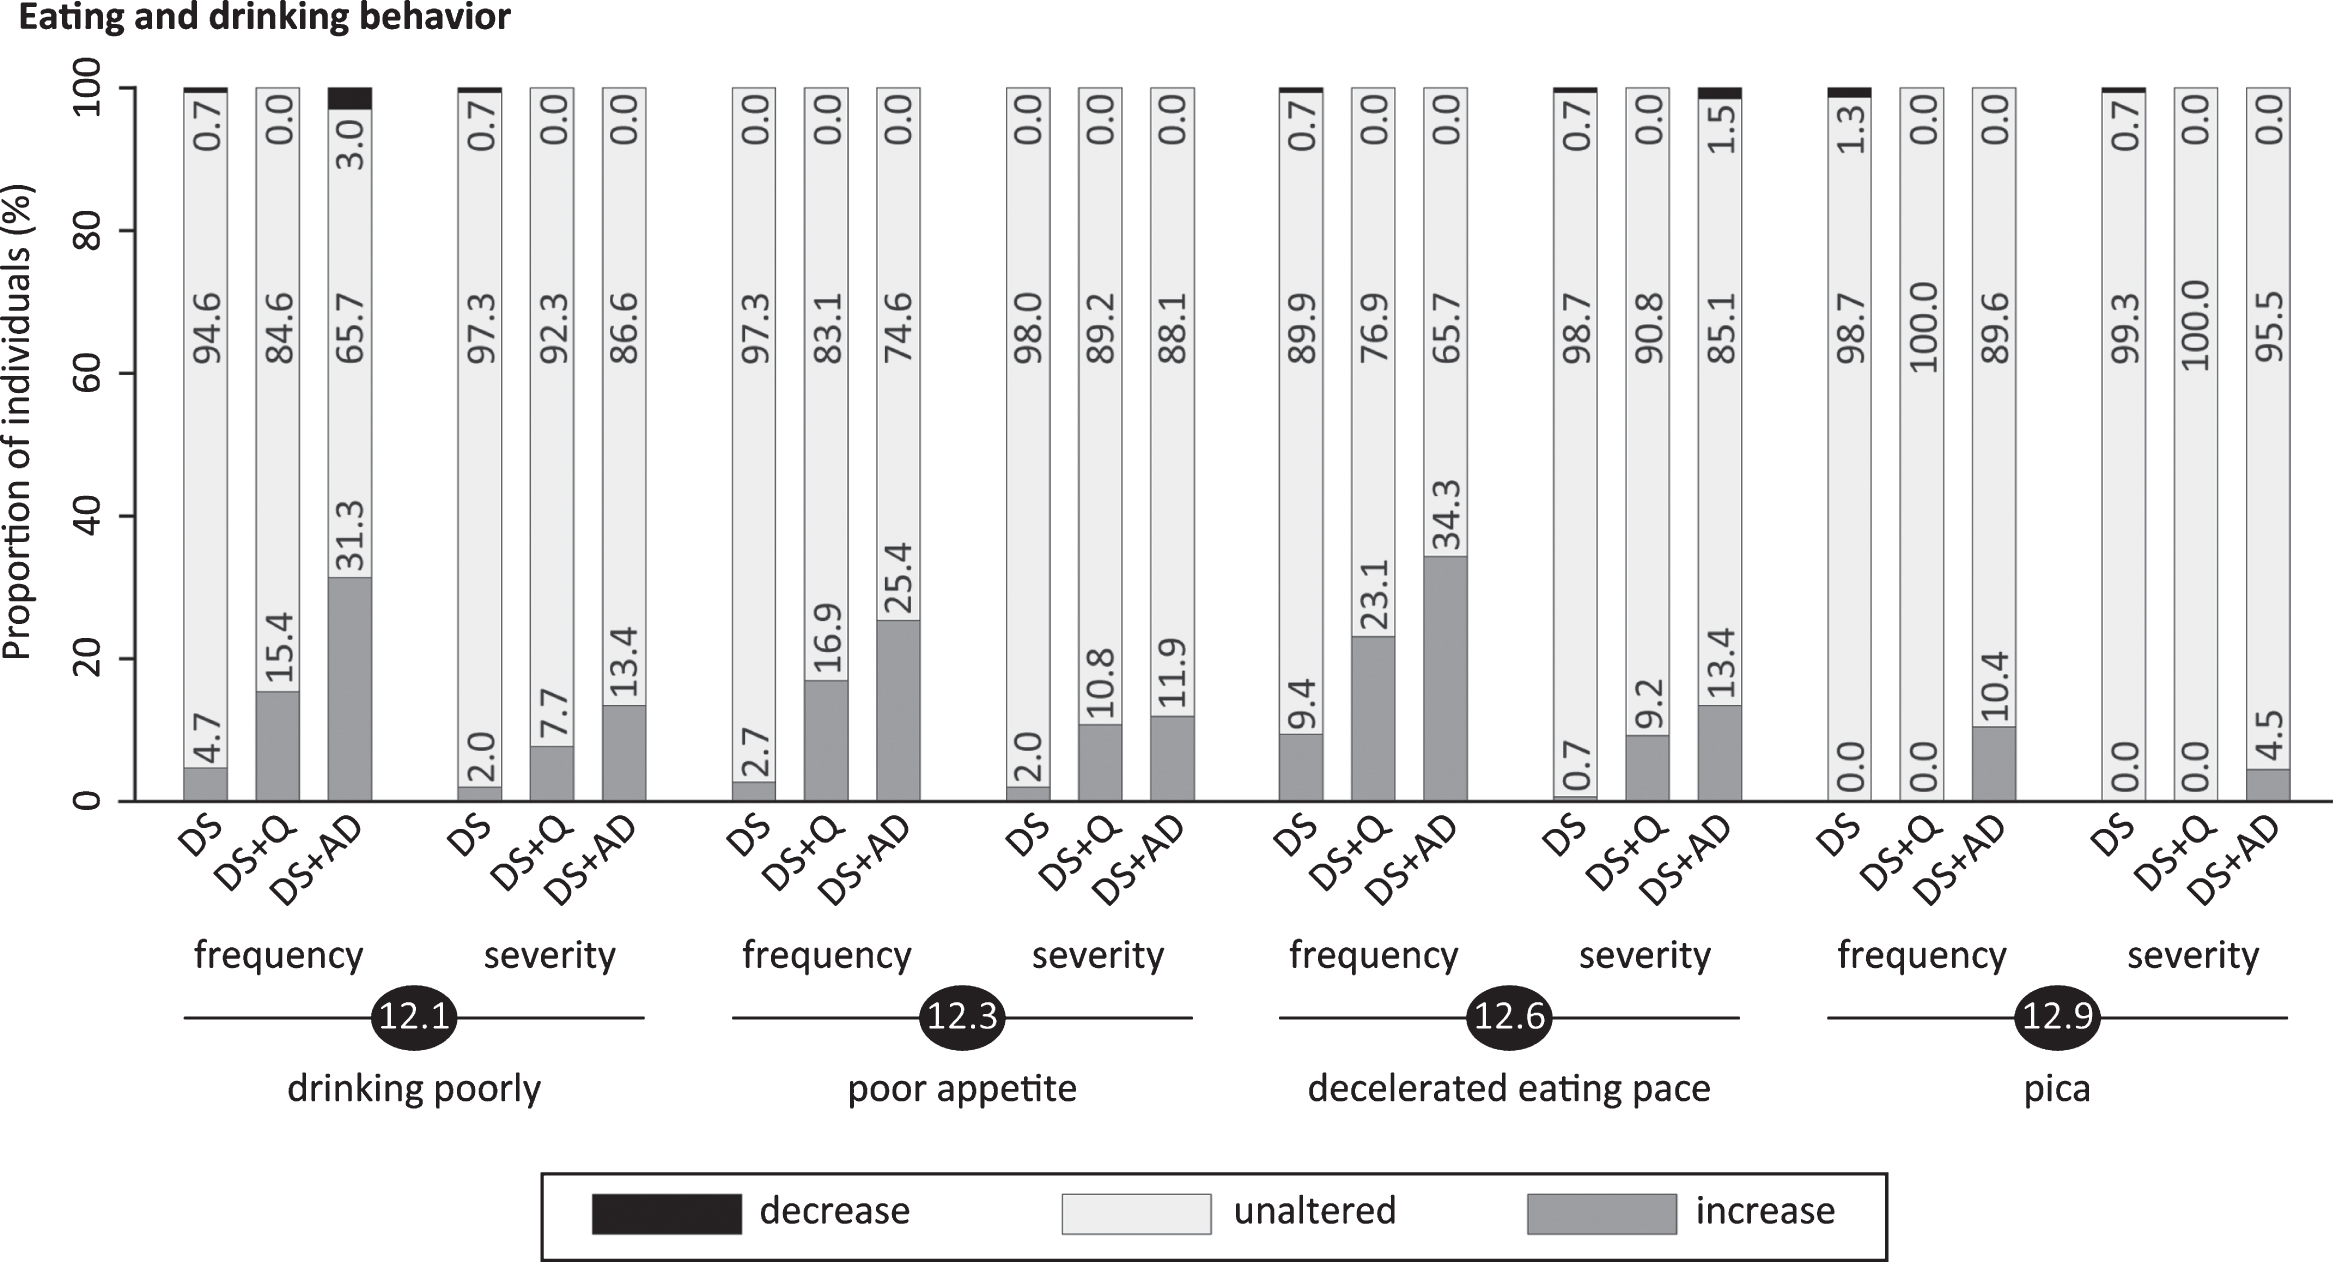
Fig.8
Significant frequency changes and severity changes for items in section 12 (eating/drinking behavior). The proportion of individuals showing decreased, unaltered or increased scores is depicted per study group. Specifically, the black sections and corresponding percentage (top), the pale grey sections and corresponding percentage (middle) and the grey sections and corresponding percentage (bottom) respectively indicate the proportion of each study group showing a decreased, unaltered or increased frequency/severity. Statistics (Kruskal-Wallis group comparisons) and further item descriptions, including items that did not significantly differ between groups, are provided in the text. DS, Down syndrome without signs of dementia; DS+Q, Down syndrome with questionable dementia; DS+AD, Down syndrome with diagnosed AD.
Section 6: Aggression
Items considered verbal aggression (6.1; pfq = 0.004, psv = 0.003), physical aggression directed against objects/destructive behavior (6.2; pfq < 0.001, psv = 0.015), physical aggression directed against self (6.3; pfq = 0.76, psv = 1.00) and physical aggression directed against other people (6.4; pfq = 0.002, psv = 0.001). Apart from self-aggression, aggressive symptoms were altered with the proportion of individuals showing an increase being highest in DS+AD, intermediate in DS+Q and lowest in DS (Fig. 4).
Section 7: Apathy & aspontaneity
Different aspects of apathy were evaluated, including lack of initiative (7.1; pfq < 0.001, psv < 0.001), lack of interest in familiar things or the direct living environment (7.2; pfq < 0.001, psv = 0.004), lack of interest in (learning) new things (7.3; pfq < 0.001, psv < 0.001) and lack of motivation to perform familiar duties (7.4; pfq < 0.001, psv = 0.001). Furthermore, not getting duties done independently (7.5; pfq < 0.001, psv < 0.001), apparent ‘laziness’ (7.6; pfq < 0.001, psv = 0.013), lack of participation in conversations (7.7; pfq < 0.001, psv < 0.001), social isolation/withdrawal (7.8; pfq < 0.001, psv = 0.014), little empathy (7.9; pfq < 0.001, psv = 0.75) and dull emotional responses (7.10; pfq < 0.001, psv = 0.69) were evaluated. Alterations in apathetic symptoms appear to be strongly related to dementia (Fig. 5): the proportion of individuals with an increased frequency was consistently highest in DS+AD, intermediate in DS+Q and lowest in DS for each item, with the exception of apparent ‘laziness’ (item 7.6). Section scores, especially for frequency change, emphasized these results (Table 3). For 5 out of 8 items with significant severity changes, the proportion of individuals displaying an increase was highest in DS+Q, closely followed by DS+AD, thus suggesting that apathy already changes in an early phase of the disease.
Section 8: Depressive symptoms
This section evaluated rapid mood changes (8.1; pfq < 0.001, psv < 0.001), sadness/tearfulness (8.2; pfq < 0.001, psv < 0.001), being discouraged/low mood (8.3; pfq < 0.001, psv < 0.001), negative attitude (8.4; pfq = 0.06, psv = 0.15), physical complaints without evident cause (8.5; pfq = 0.35, psv = 0.75), pessimism/doom-mongering (8.6; pfq = 0.70, psv = 0.87), ruminating (8.7; pfq = 0.017, psv = 0.009), general slowness of movements/reactions (8.8; pfq < 0.001, psv < 0.001), low self-esteem (8.9; pfq = 0.21, psv = 0.027) and being tired of life (8.10; pfq = 0.15, psv = 0.35). Figure 6 clearly depicts that the proportion of individuals presenting an increased frequency/severity was consistently lowest in DS for all significant items. The highest proportion was observed in DS+AD for items 8.1, 8.2 and 8.8, and for DS+Q in items 8.3 and 8.7 (Fig. 6). In the evaluation of depressive symptoms, items 2.1 (difficulty falling asleep), 2.5 (difficulty getting out of bed) and 12.3 (poor appetite) were also considered in the total section scores. Section scores, especially for frequency change, were lowest in DS, intermediate in DS+Q and highest in DS+AD (Table 3), thus further underlining the link between depressive symptomatology and dementia in DS.
Section 9: Delusions
Items addressed delusions of possessions being hidden or stolen (9.1; pfq = 0.95, psv = 0.79), someone being his/her spouse (9.2; pfq = 0.07, psv = 0.84), the partner having an affair (9.3; pfq = 0.20, psv = 0.20), an acquaintance being an imposter (9.4; pfq = 1.00, psv = 0.20), a caregiver intending to abandon him/her (9.5; pfq = 0.027, psv = 0.03) and the living accommodation not being home (9.6; pfq = 0.13, psv = 0.04), whilst this is evidently not true. Apart from item 9.5 (at the border of significance, Fig. 7), neither individual delusion items, nor section scores differed significantly between groups.
Section 10: Hallucinations
Auditory hallucinations (10.1; pfq = 0.06, psv = 0.06), talking to people that are not physically present (10.2; pfq = 0.004, psv = 0.25), as well as visual (10.3; pfq = 0.009, psv = 0.30), olfactory (10.4; pfq = 1.00, psv = 1.00), tactile (10.5; pfq = 0.04, psv = 0.19) and gustatory (10.6; pfq = 1.00, psv = 1.00) hallucinations were addressed. Self-talk or grumbling out loud (soliloquies) was not scored in item 10.2. The proportion of individuals demonstrating an increased frequency in 10.2 and 10.3 was highest in DS+AD, intermediate in DS+Q and lowest in DS (Fig. 7). Olfactory, gustatory and tactile hallucinations were (virtually) absent.
Section 11: Disinhibition & sexual behavior
Impulsivity (11.1; pfq = 0.38, psv = 0.45), making tactless/insulting comments (11.2; pfq = 0.12, psv = 0.58), inappropriate sexual remarks (11.3; pfq = 0.43, psv = 0.35), loss of decorum (11.4; pfq = 0.001, psv = 0.15), approaching strangers as acquaintances (11.5; pfq = 0.28, psv = 0.08), exhibitionism (11.6; pfq = 0.67, psv = 0.21), undesired physical contact without sexual intentions (11.7; pfq = 0.41, psv = 0.04) and inappropriate physical sexual advances (11.8; pfq = 0.10, psv = 0.47) were evaluated. For loss of decorum, i.e., displaying ill-mannered behavior such as burping, farting or smacking, the proportion of individuals presenting an increase was highest in DS+AD and lowest in DS (Fig. 7).
Table 3
Comparison of frequency change and severity change sum scores per section and for the total scale between groups
| Section | Change | DS (n = 149) | DS+Q (n = 65) | DS+AD (n = 67) | p-value |
| 1) Anxiety & nervousness | Frequency | 0 (0–1) | 2 (0–4) | 4 (1–8) | <0.001 |
| Severity | 0 (0–0) | 1 (0–3) | 3 (0–5) | <0.001 | |
| 2) Sleep disturbances | Frequency | 0 (0–2) | 2 (0–5) | 4 (0–10) | <0.001 |
| Severity | 0 (0–0) | 0 (0–3) | 0 (0–3) | <0.001 | |
| 3) Irritability | Frequency | 0 (0–1) | 1 (0–3) | 1 (0–6) | <0.001 |
| Severity | 0 (0–0) | 0 (0–2) | 1 (0–3) | <0.001 | |
| 4) Obstinacy | Frequency | 0 (0–0) | 0 (0–2) | 1 (–1–4) | 0.016 |
| Severity | 0 (0–0) | 0 (0–1) | 0 (0–3) | 0.014 | |
| 5) Agitation & stereotypical behavior | Frequency | 0 (0–0) | 0 (0–4) | 2 (0–6) | <0.001 |
| Severity | 0 (0–0) | 0 (0–1) | 0 (0–3) | <0.001 | |
| 6) Aggression | Frequency | 0 (0–0) | 0 (0–0) | 0 (0–2) | <0.001 |
| Severity | 0 (0–0) | 0 (0–0) | 0 (0–2) | <0.001 | |
| 7) Apathy & aspontaneity | Frequency | 0 (0–1) | 4 (0–7) | 12 (5–21) | <0.001 |
| Severity | 0 (0–0) | 1 (0–2) | 1 (0–3) | <0.001 | |
| 8) Depressive symptoms | Frequency | 0 (0–2) | 4 (2–6) | 8 (3–11) | <0.001 |
| Severity | 0 (0–1) | 2 (0–4) | 2 (0–6) | <0.001 | |
| 9) Delusions | Frequency | 0 (0–0) | 0 (0–0) | 0 (0–0) | 0.29 |
| Severity | 0 (0–0) | 0 (0–0) | 0 (0–0) | 0.39 | |
| 10) Hallucinations | Frequency | 0 (0–0) | 0 (0–0) | 0 (0–2) | 0.002 |
| Severity | 0 (0–0) | 0 (0–0) | 0 (0–0) | 0.023 | |
| 11) Disinhibition & sexual behavior | Frequency | 0 (0–0) | 0 (0–0) | 0 (0–1) | 0.46 |
| Severity | 0 (0–0) | 0 (0–0) | 0 (0–0) | 0.16 | |
| 12) Eating/drinking behavior | Frequency | 0 (0–0) | 0 (0–3) | 4 (0–8) | <0.001 |
| Severity | 0 (0–0) | 0 (0–0) | 0 (0–2) | <0.001 | |
| Total scale score (all sections) | Frequency | 4 (0–13) | 20 (9–36) | 41 (21–60) | <0.001 |
| Severity | 1 (0–4) | 7 (1–19) | 15 (3–30) | <0.001 |
Frequency change scores range from –4 to +4 and severity change scores from –3 to +3 per individual item. Table 3 provides the section scores (i.e., sum of individual change scores per section) and the total scale score (i.e., sum of all individual change scores in the entire scale) for both frequency change and severity change. Per diagnostic group, scores are provided as median with the interquartile range (25% –75%) between brackets. In the context of discriminative ability, Kruskal-Wallis tests were used to compare section scores and the total score between groups. p-values below 0.0275 are considered significant and reported with three decimals; non-significant p-values with two decimals. DS, Down syndrome without signs of dementia; DS+Q, Down syndrome with questionable dementia; DS+AD, Down syndrome with diagnosed AD.
Section 12: Eating/drinking behavior
The last section consisted of items about drinking poorly (12.1; pfq < 0.001, psv = 0.003), drinking excessively (12.2; pfq = 1.00, psv = 0.39), poor appetite (12.3; pfq < 0.001, psv = 0.006), excessive appetite (12.4; pfq = 0.17, psv = 0.58), putting too much food in the mouth at once (12.5; pfq = 0.08, psv = 0.03), decelerated eating pace (12.6; pfq < 0.001, psv = 0.001), accelerated eating pace (12.7; pfq = 0.94, psv = 0.40), being selective with food and drinks (12.8; pfq = 0.04, psv = 0.12) and eating/drinking not-consumable things (or trying to), also known as pica (12.9; pfq < 0.001, psv = 0.012). Specifically, the proportion of individuals with an increased frequency/severity in drinking poorly (a reduced total fluid intake or increased need to stimulate someone to drink), poor appetite, decelerated eating pace and pica was highest in DS+AD (Fig. 8). Likewise, section scores, especially for frequency change, were highest in DS+AD (Table 3).
Total scale scores
Adding up all individual item scores yielded a total scale score for frequency change and severity change, respectively (Table 3). Frequency and severity changes were limited in DS, while DS+AD displayed an overall increase in BPSD symptoms. Resembling many individual items, DS+Q reached intermediate scores. Since the dementia group was expectedly older, we evaluated the effect of age. The reported behavioral changes appear to be (most likely) attributed to dementia: a linear regression analysis revealed that age did not significantly predict total scale scores for frequency change (B = 0.19; p = 0.06) and severity change (B = 0.046; p = 0.34) in the non-demented group, resembling other studies reporting no evident effect of age on behavioral or psychiatric item scores in non-demented DS groups [46, 47].
Table 4
Comparison of caregiver burden sum scores per section and for the total scale between groups
| Section | DS (n = 149) | DS+Q (n = 65) | DS+AD (n = 67) | p-value |
| 1) Anxiety & nervousness | 2 (0–4) | 3 (2–6) | 5 (2–8) | <0.001 |
| 2) Sleep disturbances | 0 (0–1) | 1 (0–4) | 1 (0–3) | <0.001 |
| 3) Irritability | 1 (0–4) | 2 (0–5) | 3 (2–6) | <0.001 |
| 4) Obstinacy | 2 (0–4) | 3 (0–6) | 3 (2–6) | 0.002 |
| 5) Agitation & stereotypical behavior | 1 (0–3) | 1 (0–4) | 2 (0–5) | 0.001 |
| 6) Aggression | 0 (0–2) | 0 (0–2) | 1 (0–3) | 0.04 |
| 7) Apathy & aspontaneity | 1 (0–3) | 3 (1–8) | 5 (2–9) | <0.001 |
| 8) Depressive symptoms | 2 (0–4) | 5 (2–8) | 7 (3–9) | <0.001 |
| 9) Delusions | 0 (0–0) | 0 (0–0) | 0 (0–0) | 0.34 |
| 10) Hallucinations | 0 (0–0) | 0 (0–0) | 0 (0–0) | 0.16 |
| 11) Disinhibition & sexual behavior | 0 (0–1) | 0 (0–2) | 1 (0–2) | 0.03 |
| 12) Eating/drinking behavior | 1 (0–3) | 2 (0–4) | 3 (1–5) | <0.001 |
| Total scale score (all sections) | 14 (6–29) | 28 (16–43) | 33 (22–52) | <0.001 |
Caregiver burden was scored over the last six months only. Caregiver burden section scores (i.e., sum of caregiver burden scores per section) and the total caregiver burden scale score (i.e., sum of all caregiver burden scores in the entire scale) are provided, per diagnostic group, as median with the interquartile range (25% –75%) between brackets. Kruskal-Wallis tests were used to compare section scores and the total score between groups. p-values below 0.0275 are considered significant and reported with three decimals; non-significant p-values with two decimals. DS, Down syndrome without signs of dementia; DS+Q, Down syndrome with questionable dementia; DS+AD, Down syndrome with diagnosed AD.
Identification of irrelevant items
Items that hardly showed frequency and severity changes in the DS+Q and DS+AD group are of limited discriminative value for future use. Item irrelevance, i.e., a lack of clinically relevant change, was defined as ≥85% of DS+Q and DS+AD individuals showing unaltered scores (change = 0) for both frequency and severity change. Subsequently, 23 items were identified: 1.3 (hyperventilation), 6.3 (self-aggression), 8.4 (negative attitude), 8.6 (pessimism), 8.9 (low self-esteem), 8.10 (tired of life), 9.2–9.6 (delusions), 10.1 and 10.4–10.6 (hallucinations), 11.3 (inappropriate sexual remarks), 11.6 (exhibitionism), 11.7 (undesired physical contact), 11.8 (sexual advances), 12.2 (drinking excessively), 12.5 (putting too much food in the mouth), 12.7 (accelerated eating pace), and 12.9 (pica). With the exception of item 8.9 (severity), 9.5 (frequency) and 12.9 (both frequency and severity), these items did not differ significantly between groups, further suggesting that these might be of limited relevance for future use.
Caregiver burden
Caregiver burden was scored over the last six months only, thus not focusing on change over time. Table 4 provides caregiver burden sum scores per section and for the entire scale. Between groups, the most pronounced differences were observed for the sections on anxiety, apathy & aspontaneity, and depressive symptoms. BPSD-related caregiver burden was overall highest for DS+AD, intermediate for DS+Q and lowest for DS. The caregiver burden for sleep disturbances and obstinacy was highest in both DS+Q and DS+AD.
DISCUSSION
In 281 elderly individuals with DS fulfilling all inclusion criteria, we evaluated behavioral changes in relation to the clinical status of dementia using the newly developed BPSD-DS scale. The exploratory results presented here demonstrate that the initial version of the scale appears to be valid and reliable, but future studies should optimize and further validate (an adapted version of) the scale. In the context of item relevance, comparing BPSD-DS scores between the three diagnostic groups (DS, DS+Q and DS+AD) revealed prominent changes for items of anxiety, sleep disturbances, agitation & stereotypical behavior, aggression, apathy & aspontaneity, depressive symptoms and eating/drinking behavior. For most items, the proportion of individuals demonstrating an increased frequency or severity was highest in DS+AD, intermediate in DS+Q and lowest in DS. For anxiety, sleep disturbances, apathy and depressive symptoms, the proportion was already substantial in DS+Q, and in certain items virtually similar to or even higher than in DS+AD. Changes in anxiety, sleep disturbances, apathy and depressive symptoms possibly serve as ‘alarm signals’ of the onset of AD in DS. In contrast to the identification of relevant behavioral items, 23 items were found to be of limited discriminative value for future use, presenting unaltered frequency and severity change scores for ≥85% of DS+Q and DS+AD individuals.
Evidently, a series of behavioral changes was related to dementia in DS. Indeed, BPSD are an integral part of dementia and are extensively studied in the general population [20–25]. In contrast, studies that comprehensively evaluate BPSD in DS are scarce. Currently used scales for dementia in DS do not assess behavior as comprehensively as behavioral scales used in the general population, such as the NPI. The BPSD-DS scale has been developed to meet this demand, and to use alongside cognitive/functional scales. The multidisciplinary development process resulted in a scale with 12 clinically defined sections. Comparison of frequency and severity change scores between DS, DS+Q and DS+AD groups identified items with a promising differentiating capacity that thus appear relevant for future use. Each section is briefly discussed hereafter, contextualized with findings from the (limited number of) earlier studies.
The first section addressed anxiety: up to 51% of DS+AD individuals presented an increased frequency/severity in at least one anxious symptom, compared to up to 15% of those without AD. In a substantial proportion of the DS+Q group, we already observed an increased frequency/severity, suggesting that anxiety might already be altered in an early stage of dementia. Surprisingly, anxiety in DS+AD has been barely investigated before. Two studies comparing DS+AD to demented patients in the general population reported the presence of anxiety in 57% and 66% of DS+AD [48, 49]. Urv et al. reported that fearfulness was more prevalent in DS+AD versus DS [50].
Frequency/severity of sleep disturbances (section 2) were pronouncedly increased in DS+Q and DS+AD, but not in DS. In accordance, sleep disturbances were previously described in up to 66% of DS+AD individuals [49–53]. Importantly, obstructive sleep apnea (OSA) and sleep fragmentation are common in people with DS regardless of dementia [54, 55]. Sleep problems and other co-morbidities were reported at the start of the interview (Table 1), but OSA was most likely underdiagnosed, because its evaluation is not (yet) standard clinical practice in the dementia diagnostic work-up. Nevertheless, the BPSD-DS identifies changes by comparing behavior over the last six months to the characteristic past, thus largely accounting for the chronic presence of certain co-morbidities.
Resembling a previous study reporting higher frequency and severity scores for irritability (close to significance) in demented than in non-demented persons with DS [56], we noted that a large proportion of both DS+Q and DS+AD groups displayed an increased frequency/severity in being annoyed, short-spoken or short-tempered (section 3). However, also a substantial proportion of non-demented individuals presented an increase. Consequently, changes in irritability items may not be very useful in differentiating between groups.
Stubbornness and disobedience are regarded characteristic for DS and remain fairly constant in childhood, prevalent in approximately three-quarter of children with DS [57]. Obstinacy in adulthood has been little investigated, but remains omnipresent in our experience. Whereas previous studies have not been conclusive in the context of dementia [52, 58], we found frequency and severity changes for various items of obstinacy (section 4).
In section 5, general restlessness and aimlessly pacing were found to be more frequent in DS+AD, resembling earlier reports on a higher prevalence of agitation/restlessness [53] and hyperactivity [56] in DS+AD versus DS. Likewise, DS+AD presented a higher occurrence of stereotypical behavior, including repetitive habits/manners, repeatedly dressing/undressing and reiteration of words, phrases or questions. Huxley et al. also noted that frequency and severity of stereotyped behavior was higher (close to significance) in DS+AD than in DS [56]. In this respect, the presence of autism spectrum disorder (ASD) may influence the results. Stereotyped behavior, repetitive use of language/phrases and overactivity were more frequent in (young) individuals with DS and ASD than in those without ASD [59]. It would, therefore, be valuable to consider ASD in future studies. Moreover, routinized/repetitive behavior has been associated with worries/fears [60, 61], and, as such, could relate to the increased frequency/severity of anxious symptoms (Section 1).
Concerning aggressive behavior (section 6), the DS+AD group displayed the highest proportion of individuals with increased verbal aggression, destructive behavior or physical aggression against other people. Earlier studies have not been consistent: few showed a dementia-related increase in aggressive symptoms [50, 53], while others reported no difference in relation to dementia [52, 62].
Sometimes misinterpreted as laziness [63, 64], apathy is common in DS+AD and appears to present early, even prodromally [50, 58, 65, 66]. Temple & Konstantareas reported apathy in 87% of DS+AD individuals [49]. Concordantly, we demonstrate that increased apathetic symptoms were omnipresent in DS+AD, but also in DS+Q (section 7). The majority of DS+Q individuals is expected to convert to AD over time, which may thus suggest that apathy is an early symptom of AD, confirming earlier findings of, for instance, Holland et al. in which caregivers reported apathy as one of the first changes [58].
Although apathy and depression have many symptoms in common, they are considered two different neuropsychiatric entities. Differentiating between apathy and depression in the context of dementia is rather complex. Depression and dementia can occur independently, but can also coincide with each other [67, 68]. Here, we showed that depressive symptoms (section 8) were markedly increased in both DS+Q and DS+AD, suggesting that these, like apathetic symptoms, present early. Not all depressive items appeared relevant for future use, such as those on pessimism/doom-mongering or being tired of life. Such relatively complex concepts require a developmental level that most individuals with DS do not reach [69]. Previous reports on depression in DS+AD were not consistent. McCarron et al. concluded that the prevalence of depression did not differ in DS+AD versus DS [70], while others reported associations of depressive symptoms with age [71], and dementia [50, 52, 53, 72, 73].
Little difference was seen in delusions (section 9) and hallucinations (section 10) between groups. Psychotic symptoms, however, seem less prevalent in DS+AD versus AD patients in the general population [49]. Indeed, the proportion of individuals demonstrating change was low as compared to other sections. This likely relates to the difficulty in diagnosing psychotic symptoms in people with DS, as their language ability often does not allow them to describe internal experiences [49]. Moreover, self-talk and experiencing imaginary persons/friends or a fantasy world [74–76] needs to be distinguished from true hallucinations. Whether the few changes in psychotic symptoms in DS can be explained by an actual infrequent occurrence or underdiagnosis requires further study.
Section 11 assessed symptoms of disinhibition & sexual behavior. Apart from the more frequent occurrence of a loss of decorum in DS+AD, items did not significantly differ between groups, casting doubt on their relevance for future use in the scale. Whereas Urv et al. [50] found that impulsivity was more prevalent in DS+AD versus DS, impulsivity (item 11.1) was not significantly altered here. The results for verbal disinhibition (items 11.2 and 11.3) were also comparable between groups, affirming the previously reported lack of difference for inappropriate speech between DS and DS+AD [56].
Finally, alterations in eating/drinking behavior (section 12): one third of the DS+AD group had a decreased fluid intake, decreased appetite and decelerated eating pace, resulting in an increased severity. One in ten DS+AD individuals started to display pica, which was virtually absent in DS and DS+Q. The reduced intake and decelerated pace may, in part, relate to physical eating problems which were proportionally more common in DS+AD (Table 1). Moreover, people with DS are at risk for dysphagia (problems with swallowing) and this risk increases even further with aging and AD [77].
Study strengths
To the best of our knowledge, this is the largest study so far evaluating BPSD in people with DS. Previously, behavioral studies in DS excluded items in advance with respect to time constraints or (personal) experiences. Here, the multidisciplinary consortium ensured that as many potentially relevant behavioral items as possible were included in the initial version of the BPSD-DS scale. The true relevance of these items was subsequently determined by comparing scores across the three groups. Another major strength of the study is the representative nature of our elderly study population, which reflects the situation in contemporary care. We have included (informants of) a diverse group of individuals with DS with/without dementia in a range of ID severities, across different ages, living in different settings and areas and attending day-care programs (or not). As such, behavior related to specific (living) circumstances was ruled out as much as possible. Furthermore, Esbensen et al. argued that co-morbidities should be considered in the development of behavioral outcome measures [6]. In this context, individuals, who, according to clinical judgement, presented aberrations due to (untreated) conditions, were excluded to reduce the risk of erroneously attributing changes to dementia.
Study limitations
Since an objective biomarker profile for AD in DS is not (yet) available [8], and the clinical utility of PET scans for AD in DS remains to be elucidated [4, 9], the clinical, multidisciplinary diagnosis of dementia remains the gold standard [10]. Here, the dementia diagnosis had to be established before the BPSD-DS assessment took place. Consequently, scores obtained in the BPSD-DS interview did most likely not affect the clinical diagnosis, and therewith the study group categorization. It must be acknowledged, however, that a slight overlap may exist between items in the BPSD-DS scale and clinical information used in the diagnostic procedure. Moreover, for practical reasons members of the multidisciplinary diagnostic team were not, per se, excluded as raters in this study, which could have potentially introduced a slight bias. However, the large majority of raters was not part of the multidisciplinary team. In addition, the diagnosis of dementia was a team effort, while the BPSD-DS interview was conducted by a single rater and scores were provided by informants.
Another study limitation relates to the fact that individuals with profound ID or significant sensory co-morbidities were not included, and it thus needs further investigation whether (an adapted form of) the BPSD-DS could serve useful in this subpopulation. Another drawback concerns the test-retest reliability: we aimed for a larger number of tests, but on various occasions it was practically impossible to get the same informant(s) and rater together within 4 weeks, often related to the contemporary time-pressured workload within care organizations. Furthermore, informant answers contain a degree of subjectivity, especially in the context of (variable) behavior, but the current results, nevertheless, suggest promising reliability measures for most items in the initial version of the scale. Moreover, the twelve sections were clinically/symptomatically defined in advance rather than through cluster/factor analyses afterwards. Although our goal at this stage was to identify relevant items with discriminative ability rather than to cluster items into new data-driven subscales, the absence of such cluster/factor analyses could be considered a potential limitation.
Future implications
Based on the results reported here and clinical experiences, the BPSD-DS scale requires further optimization. Studies in other cohorts are needed to further confirm the overall (clinical) applicability and reliability of an optimized version. The current study had a cross-sectional set-up, retrospectively evaluating behavioral changes. Longitudinal studies are required to assess the intra-individual evolution of BPSD over time relative to the stage of dementia, thus confirming whether specific behavioral changes may, indeed, serve as early ‘alarm signals’ of conversion to dementia. Application of (an optimized version of) the BPSD-DS scale in daily care will likely contribute to increasing acceptance and understanding among caregivers. Identification of frequency and severity changes is essential information in the context of assessing someone’s needs, aiding, among others, the decision-making process about (timely) adaptation of daily care. Moreover, outcomes of the BPSD-DS scale may provide a starting point for further examination and multidisciplinary consultation about (non-pharmacological) therapeutic interventions aimed at reducing suffering and increasing the quality of life [15]. Surprisingly, despite the high risk for AD, the DS population has been largely ignored in clinical trials with novel disease-modifying agents to prevent or delay AD. This is, among others, due to a lack of appropriate and validated outcome measures [6, 78]. Indeed, “relatively little is known about the reliability and validity of measures of AD-related changes in psychiatric symptoms and behavior problems” [6]. In the general population, the NPI, for instance, is commonly used in AD clinical trials [79–81], including novel anti-dementia drugs [82, 83]. Similarly, the BPSD-DS may contribute to behavioral assessment in future clinical trials for AD in DS alongside cognitive/functional measures.
Conclusion
BPSD are core features of dementia, but have not been comprehensively studied in DS. We developed a novel, structured informant interview, the BPSD-DS scale, to systematically identify frequency and severity changes by comparing behavior in the last six months to characteristic behavior in the past. To establish the relevance of behavioral items, the scale was administered to informants of DS, DS+Q, and DS+AD individuals. The first exploratory reliability data demonstrated promising interrater, test-retest and internal consistency measures. In the context of item relevance, comparing DS, DS+Q, and DS+AD groups revealed pronounced changes in symptoms of anxiety, sleep disturbances, agitation & stereotypical behavior, aggression, apathy, depressive symptoms, and eating/drinking behavior. Change primarily constituted an increased frequency/severity. Overall, the proportion of individuals presenting such an increase was highest in the DS+AD group, intermediate in DS+Q and lowest in those without dementia. Importantly, already a substantial proportion of the DS+Q group presented increases in anxiety, sleep disturbances, apathy and depressive symptoms, suggesting that these changes may serve as early indicators or ‘alarm signals’ for those at risk to develop dementia. Longitudinal studies are needed to confirm this. In contrast, delusions, hallucinations and disinhibited behavior, as well as specific symptoms within the other sections, were barely altered between groups. Therefore, these items appear to have a limited discriminative ability, and thus seem less relevant for future use. Taken together, based on current results, the novel BPSD-DS scale seems to be a useful and reliable tool to identify behavioral changes related to dementia. Clinical experiences and item (ir)relevance illustrate the need to optimize the scale. Further assessment of its reliability and validity is required. Future application of the BPSD-DS scale in daily care may allow for the systematic identification of BPSD, possibly contributing to understanding among caregivers, adaptive caregiving and therapy.
ACKNOWLEDGMENTS
The authors wish to thank all persons with DS and their informants for participation and recognizing the importance of studying behavioral alterations. The authors express their gratitude to all staff members who passionately contributed to the project: Helena Gerritsen, Elles Harink-Volker, Marjo Oosterik and Karin van Swigchem (Aveleijn), Josephine Druif (Dichterbij), Nardine Lukassen (Elver), Esther Grootendorst and José Nicolaas (Ipse de Bruggen), Marie-José van Dreumel (Cosis), Nienke Stap, Ruud Tap, Manon Veling, Ina van der Wal and Tineke van Wieren-Talsma (Talant), Catherine Baud, Aurélie Julien and Aude Pichot (Institut Lejeune), Eleonora Meloni (Policlinico Gemelli), Laura Videla (Catalan Down Syndrome Foundation) and Tamara Al-Janabi (UCL). This study was financially supported by the UMCG Alzheimer Research Center, the Research School for Behavioral and Cognitive Neurosciences of the University of Groningen (RUG), the Gratama-Stichting/Stichting Groninger Universiteitsfonds (2015-04) and contributions in kind from the participating centers. The Institute Born-Bunge/University of Antwerp was granted a subsidy from the Research Foundation Flanders (FWO, G053218N). Moreover, this work was partially supported by research grants from the Carlos III National Institute of Health of Spain (PI13/01532 to Rafael Blesa and PI14/01126 to Juan Fortea) jointly funded by the European Regional Development Fund, the European Union Integrated Operational Programme, the Fundació Marató TV3 (project 20141210 to Juan Fortea), a grant from the La Caixa Banking Foundation and a grant from Griffols Foundation. Support was also received from the Catalan Government (2014SGR-0235) and the Catalan Down Syndrome Foundation. These public sponsors had no further role in designing the study, collecting and interpreting data, and writing the manuscript.
Authors’ disclosures available online (https://www.j-alz.com/manuscript-disclosures/17-0920r2).
REFERENCES
[1] | Ballard C , Mobley WC , Hardy J , Williams G , Corbett A ((2016) ) Dementia in Down’s syndrome. Lancet Neurol 15: , 622–636. |
[2] | Alzheimer’s Assocation ((2016) ) 2016 Alzheimer’s disease facts and figures. Alzheimers Dement 12: , 459–509. |
[3] | Wiseman FK , Al-Janabi T , Hardy J , Karmiloff-Smith A , Nizetic D , Tybulewicz VLJ , Fisher EMC , Strydom A ((2015) ) A genetic cause of Alzheimer disease: Mechanistic insights from Down syndrome. Nat Rev Neurosci 16: , 564–574. |
[4] | Mann DMA ((1988) ) Alzheimer’s disease and Down’s syndrome. Histopathology 13: , 125–137. |
[5] | Zigman WB , Lott IT ((2007) ) Alzheimer’s disease in Down syndrome: Neurobiology and risk. Ment Retard Dev Disabil Res Rev 13: , 237–246. |
[6] | Esbensen AJ , Hooper SR , Fidler D , Hartley SL , Edgin J , Liogier d’Ardhuy X , Capone G , Conners FA , Mervis CB , Abbeduto L , Rafii M , Krinsky-McHale SJ , Urv T , Group OMW ((2017) ) Outcome measures for clinical trials in Down syndrome. Am J Intellect Dev Disabil 122: , 247–281. |
[7] | Oliver C , Crayton L , Holland AJ , Hall S , Bradbury J ((1998) ) A four year prospective study of age-related cognitive change in adults with Down’s syndrome. Psychol Med 28: , 1365–77. |
[8] | Dekker AD , Fortea J , Blesa R , De Deyn PP ((2017) ) Cerebrospinal fluid biomarkers for Alzheimer’s disease in Down syndrome. Alzheimers Dement (Amst) 8: , 1–10. |
[9] | Annus T , Wilson LR , Hong YT , Acosta-Cabronero J , Fryer TD , Cardenas-Blanco A , Smith R , Boros I , Coles JP , Aigbirhio FI , Menon DK , Zaman SH , Nestor PJ , Holland AJ ((2016) ) The pattern of amyloid accumulation in the brains of adults with Down syndrome. Alzheimers Dement 12: , 538–545. |
[10] | Sheehan R , Sinai A , Bass N , Blatchford P , Bohnen I , Bonell S , Courtenay K , Hassiotis A , Markar T , McCarthy J , Mukherji K , Naeem A , Paschos D , Perez-Achiaga N , Sharma V , Thomas D , Walker Z , Strydom A ((2015) ) Dementia diagnostic criteria in Down syndrome. Int J Geriatr Psychiatry 30: , 857–863. |
[11] | Finkel SI ((2001) ) Behavioral and psychological symptoms of dementia: A current focus for clinicians, researchers, and caregivers. J Clin Psychiatry 62: (Suppl 2), 3–6. |
[12] | Jost BC , Grossberg GT ((1996) ) The evolution of psychiatric symptoms in Alzheimer’s disease: A natural history study. J Am Geriatr Soc 44: , 1078–1081. |
[13] | Adams D , Oliver C , Kalsy S , Peters S , Broquard M , Basra T , Konstandinidi E , McQuillan S ((2008) ) Behavioural characteristics associated with dementia assessment referrals in adults with Down syndrome. J Intellect Disabil Res 52: , 358–368. |
[14] | Iacono T , Bigby C , Carling-Jenkins R , Torr J ((2014) ) Taking each day as it comes: Staff experiences of supporting people with Down syndrome and Alzheimer’s disease in group homes. J Intellect Disabil Res 58: , 521–533. |
[15] | Dekker AD , Strydom A , Coppus AMW , Nizetic D , Vermeiren Y , Naudé PJW , Van Dam D , Potier M-CC , Fortea J , De Deyn PP ((2015) ) Behavioural and psychological symptoms of dementia in Down syndrome: Early indicators of clinical Alzheimer’s disease?. Cortex 73: , 36–61. |
[16] | Gauthier S , Cummings JL , Ballard C , Brodaty H , Grossberg G , Robert P , Lyketsos CG ((2010) ) Management of behavioral problems in Alzheimer’s disease. Int Psychogeriatr 22: , 346–372. |
[17] | Reisberg B , Borenstein J , Salob SP , Ferris SH , Franssen E , Georgotas A ((1987) ) Behavioral symptoms in Alzheimer’s disease: Phenomenology and treatment. J Clin Psychiatry 48: (Suppl), 9–15. |
[18] | Cummings JL , Mega MS , Gray K , Rosenberg-Thompson S , Carusi DA , Gornbein J ((1994) ) The Neuropsychiatric Inventory: Comprehensive assessment of psychopathology in dementia. Neurology 44: , 2308–2314. |
[19] | Cummings JL ((1997) ) The Neuropsychiatric Inventory: Assessing psychopathology in dementia patients.S. Neurology 48: , 10–16. |
[20] | Cheng T-W , Chen T-F , Yip P-K , Hua M-S , Yang C-C , Chiu M-J ((2009) ) Comparison of behavioral and psychological symptoms of Alzheimer’s disease among institution residents and memory clinic outpatients. Int Psychogeriatrics 21: , 1134–1141. |
[21] | Eustace A , Coen R , Walsh C , Cunningham CJ , Walsh JB , Coakley D , Lawlor BA ((2002) ) A longitudinal evaluation of behavioural and psychological symptoms of probable Alzheimer’s disease. Int J Geriatr Psychiatry 17: , 968–973. |
[22] | Mega MS , Cummings JL , Fiorello T , Gornbein J ((1996) ) The spectrum of behavioral changes in Alzheimer’s disease. Neurology 46: , 130–135. |
[23] | Van der Mussele S , Mariën P , Saerens J , Somers N , Goeman J , De Deyn PP , Engelborghs S ((2014) ) Behavioral syndromes in mild cognitive impairment and Alzheimer’s disease. J Alzheimers Dis 38: , 319–329. |
[24] | Robert PH , Verhey FR , Byrne EJ , Hurt C , De Deyn PP , Nobili F , Riello R , Rodriguez G , Frisoni GB , Tsolaki M , Kyriazopoulou N , Bullock R , Burns A , Vellas B ((2005) ) Grouping for behavioral and psychological symptoms in dementia: Clinical and biological aspects. Consensus paper of the European Alzheimer disease consortium. Eur Psychiatry 20: , 490–496. |
[25] | Aalten P , Verhey FR , Boziki M , Bullock R , Byrne EJ , Camus V , Caputo M , Collins D , De Deyn PP , Elina K , Frisoni G , Girtler N , Holmes C , Hurt C , Marriott A , Mecocci P , Nobili F , Ousset PJ , Reynish E , Salmon E , Tsolaki M , Vellas B , Robert PH ((2007) ) Neuropsychiatric syndromes in dementia. Dement Geriatr Cogn Disord 24: , 457–463. |
[26] | Evenhuis HM , Kengen MMF , Eurlings HAL ((1998) ) Dementie Vragenlijst voor Verstandelijk Gehandicapten (DVZ), Harcourt Test Publishers, Amsterdam. |
[27] | Gedye A ((1995) ) Dementia Scale for Down Syndrome, Gedye Research and Consulting, Vancouver. |
[28] | Maaskant MA , Hoekman J ((2011) ) Dementieschaal voor mensen met een verstandelijke handicap (DSVH), Bohn Stafleu van Loghum, Houten, The Netherlands. |
[29] | Ball SL , Holland AJ , Huppert FA , Treppner P , Watson PC , Hon J ((2004) ) The modified CAMDEX informant interview is a valid and reliable tool for use in the diagnosis of dementia in adults with Down’s syndrome. J Intellect Disabil Res 48: , 611–620. |
[30] | De Deyn PP , Engelborghs S , Saerens J , Goeman J , Mariën P , Maertens K , Nagels G , Martin J-J , Pickut BA ((2005) ) The Middelheim Frontality Score: A behavioural assessment scale that discriminates frontotemporal dementia from Alzheimer’s disease. Int J Geriatr Psychiatry 20: , 70–79. |
[31] | Startin CM , Rodger E , Fodor-Wynne L , Hamburg S , Strydom A ((2016) ) Developing an informant questionnaire for cognitive abilities in Down syndrome: The Cognitive Scale for Down Syndrome (CS-DS). PLoS One 11: , e0154596. |
[32] | De Deyn PP , Rabheru K , Rasmussen A , Bocksberger JP , Dautzenberg PL , Eriksson S , Lawlor BA ((1999) ) A randomized trial of risperidone, placebo, and haloperidol for behavioral symptoms of dementia. Neurology 53: , 946–955. |
[33] | Van der Mussele S , Bekelaar K , Le Bastard N , Vermeiren Y , Saerens J , Somers N , Mariën P , Goeman J , De Deyn PP , Engelborghs S ((2013) ) Prevalence and associated behavioral symptoms of depression in mild cognitive impairment and dementia due to Alzheimer’s disease. Int J Geriatr Psychiatry 28: , 947–958. |
[34] | Van der Mussele S , Le Bastard N , Saerens J , Somers N , Mariën P , Goeman J , De Deyn PP , Engelborghs S ((2015) ) Agitation-associated behavioral symptoms in mild cognitive impairment and Alzheimer’s dementia. Aging Ment Health 19: , 247–257. |
[35] | Van der Mussele S , Mariën P , Saerens J , Somers N , Goeman J , De Deyn PP , Engelborghs S ((2015) ) Psychosis associated behavioral and psychological signs and symptoms in mild cognitive impairment and Alzheimer’s dementia. Aging Ment Health 19: , 818–828. |
[36] | De Deyn PP , Wirshing WC ((2001) ) Scales to assess efficacy and safety of pharmacologic agents in the treatment of behavioral and psychological symptoms of dementia. J Clin Psychiatry 62: (Suppl 2), 19–22. |
[37] | Vermeiren Y , Le Bastard N , Van Hemelrijck A , Drinkenburg WH , Engelborghs S , De Deyn PP ((2013) ) Behavioral correlates of cerebrospinal fluid amino acid and biogenic amine neurotransmitter alterations in dementia. Alzheimers Dement 9: , 488–498. |
[38] | Benejam B , Fortea J , Molina-Lopez R , Videla S ((2015) ) Patterns of performance on the modified Cued Recall Test in Spanish adults with down syndrome with and without dementia. Am J Intellect Dev Disabil 120: , 481–489. |
[39] | Cohen-Mansfield J ((1986) ) Agitated behaviors in the elderly. II. Preliminary results in the cognitively deteriorated. J Am Geriatr Soc 34: , 722–727. |
[40] | Cohen-Mansfield J ((1996) ) Conceptualization of agitation: Results based on the Cohen-Mansfield Agitation Inventory and the Agitation Behavior Mapping Instrument. Int Psychogeriatrics 8: (Suppl 3), 309–315. |
[41] | Marin RS , Biedrzycki RC , Firinciogullari S ((1991) ) Reliability and validity of the Apathy Evaluation Scale. Psychiatry Res 38: , 143–162. |
[42] | Alexopoulos GS , Abrams RC , Young RC , Shamoian CA ((1988) ) Cornell Scale for Depression in Dementia. Biol Psychiatry 23: , 271–284. |
[43] | Patel V , Hope RA ((1992) ) A rating scale for aggressive behaviour in the elderly–the RAGE. Psychol Med 22: , 211–221. |
[44] | Benjamini Y , Hochberg Y ((1995) ) Controlling the false discovery rate: A practical and powerful approach to multiple testing. J R Stat Soc Ser B 57: , 289–300. |
[45] | McHugh ML ((2012) ) Interrater reliability: The kappa statistic. Biochem Med (Zagreb) 22: , 276–282. |
[46] | Makary AT , Testa R , Einfeld SL , Tonge BJ , Mohr C , Gray KM ((2014) ) The association between behavioural and emotional problems and age in adults with Down syndrome without dementia: Examining a wide spectrum of behoural and emotional problems. Res Dev Disabil 35: , 1868–1877. |
[47] | Tsao R , Kindelberger C , Fréminville B , Touraine R , Bussy G ((2015) ) Variability of the aging process in dementia-free adults with Down syndrome. Am J Intellect Dev Disabil 120: , 3–15. |
[48] | Jozsvai E ((2006) ) Behavioural and psychological symptoms of dementia in individuals with Down syndrome. J Dev Disabil 12: , 31–40. |
[49] | Temple V , Konstantareas MM ((2005) ) A comparison of the behavioural and emotional characteristics of Alzheimer’s dementia in individuals with and without Down syndrome. Can J Aging 24: , 179–189. |
[50] | Urv TK , Zigman WB , Silverman WP ((2008) ) Maladaptive behaviors related to dementia status in adults with Down syndrome. Am J Ment Retard 113: , 73–86. |
[51] | Cooper S-A , Prasher VP ((1998) ) Maladaptive behaviours and symptoms of dementia in adults with Down’s syndrome compared with adults with intellectual disability of other aetiologies. J Intellect Disabil Res 42: (Pt 4), 293–300. |
[52] | Prasher VP , Filer A ((1995) ) Behavioural disturbance in people with Down’s syndrome and dementia. J Intellect Disabil Res 39: (Pt 5), 432–436. |
[53] | Urv TK , Zigman WB , Silverman WP ((2010) ) Psychiatric symptoms in adults with Down syndrome and Alzheimer’s disease. Am J Intellect Dev Disabil 115: , 265–276. |
[54] | Trois MS , Capone GT , Lutz JA , Melendres MC , Schwartz AR , Collop NA , Marcus CL ((2009) ) Obstructive sleep apnea in adults with Down syndrome. J Clin Sleep Med 5: , 317–323. |
[55] | Fernandez F , Edgin JO ((2013) ) Poor sleep as a precursor to cognitive decline in Down syndrome: A hypothesis. J Alzheimers Dis Park 3: , 124. |
[56] | Huxley A , Van-Schaik P , Witts P ((2005) ) A comparison of challenging behaviour in an adult group with Down’s syndrome and dementia compared with an adult Down’s syndrome group without dementia. Br J Learn Disabil 33: , 188–193. |
[57] | Dykens EM , Shah B , Sagun J , Beck T , King BH ((2002) ) Maladaptive behaviour in children and adolescents with Down’s syndrome. J Intellect Disabil Res 46: , 484–492. |
[58] | Holland AJ , Hon J , Huppert FA , Stevens F ((2000) ) Incidence and course of dementia in people with Down’s syndrome: Findings from a population-based study. J Intellect Disabil Res 44: (Pt 2), 138–146. |
[59] | Moss J , Richards C , Nelson L , Oliver C ((2013) ) Prevalence of autism spectrum disorder symptomatology and related behavioural characteristics in individuals with Down syndrome. Autism 17: , 390–404. |
[60] | Glenn S , Cunningham CJ , Nananidou A , Prasher VP , Glenholmes P ((2015) ) Routinised and compulsive-like behaviours in individuals with Down syndrome. J Intellect Disabil Res 59: , 1061–1070. |
[61] | Coppus AMW ((2017) ) Comparing generational differences in persons with Down syndrome. J Policy Pract Intellect Disabil 14: , 118–123. |
[62] | Cosgrave MP , Tyrrell J , McCarron M , Gill M , Lawlor BA ((1999) ) Determinants of aggression, and adaptive and maladaptive behaviour in older people with Down’s syndrome with and without dementia. J Intellect Disabil Res 43: (Pt 5), 393–399. |
[63] | Landes AM , Sperry SD , Strauss ME ((2005) ) Prevalence of apathy, dysphoria, and depression in relation to dementia severity in Alzheimer’s disease. J Neuropsychiatry Clin Neurosci 17: , 342–349. |
[64] | Deb S , Hare M , Prior L ((2007) ) Symptoms of dementia among adults with Down’s syndrome: A qualitative study. J Intellect Disabil Res 51: , 726–739. |
[65] | Evenhuis HM ((1990) ) The natural history of dementia in Down’s syndrome. Arch Neurol 47: , 263–267. |
[66] | Visser FE , Aldenkamp AP , van Huffelen AC , Kuilman M , Overweg J , van Wijk J ((1997) ) Prospective study of the prevalence of Alzheimer-type dementia in institutionalized individuals with Down syndrome. Am J Ment Retard 101: , 400–412. |
[67] | Tagariello P , Girardi P , Amore M ((2009) ) Depression and apathy in dementia: Same syndrome or different constructs? A critical review. Arch Gerontol Geriatr 49: , 246–249. |
[68] | Mortby ME , Maercker A , Forstmeier S ((2012) ) Apathy: A separate syndrome from depression in dementia? A critical review. Aging Clin Exp Res 24: , 305–316. |
[69] | Smiley E , Cooper S-A ((2003) ) Intellectual disabilities, depressive episode, diagnostic criteria and Diagnostic Criteria for Psychiatric Disorders for Use with Adults with Learning Disabilities/Mental Retardation (DC-LD). J Intellect Disabil Res 47: , 62–71. |
[70] | McCarron M , McCallion P , Reilly E , Mulryan N ((2014) ) A prospective 14-year longitudinal follow-up of dementia in persons with Down syndrome. J Intellect Disabil Res 58: , 61–70. |
[71] | Meins W ((1995) ) Are depressive mood disturbances in adults with Down’s syndrome an early sign of dementia?. J Nerv Ment Dis 183: , 663–664. |
[72] | Prasher VP ((1995) ) Age-specific prevalence, thyroid dysfunction and depressive symptomatology in adults with Down syndrome and dementia. Int J Geriatr Psychiatry 10: , 25–31. |
[73] | Burt DB , Loveland KA , Lewis KR ((1992) ) Depression and the onset of dementia in adults with mental retardation. Am J Ment Retard 96: , 502–511. |
[74] | Deb S , Hare M , Prior L , Bhaumik S ((2007) ) Dementia screening questionnaire for individuals with intellectual disabilities. Br J Psychiatry 190: , 440–444. |
[75] | Fotheringham JB , Thompson F ((1994) ) Case report of a person with Down’s syndrome and multiple personality disorder. Can J Psychiatry 39: , 116–119. |
[76] | Millichap D , Oliver C , McQuillan S , Kalsy S , Lloyd V , Hall S ((2003) ) Descriptive functional analysis of behavioral excesses shown by adults with Down syndrome and dementia. Int J Geriatr Psychiatry 18: , 844–854. |
[77] | Lazenby T ((2008) ) The impact of aging on eating, drinking, and swallowing function in people with Down’s syndrome. Dysphagia 23: , 88–97. |
[78] | Liogier d’Ardhuy X , Edgin JO , Bouis C , de Sola S , Goeldner C , Kishnani P , Nöldeke J , Rice S , Sacco S , Squassante L , Spiridigliozzi GA , Visootsak J , Heller J , Khwaja O ((2015) ) Assessment of cognitive scales to examine memory, executive function and language in individuals with Down syndrome: Implications of a 6-month observational study. Front Behav Neurosci 9: , 300. |
[79] | Cumbo E , Ligori LD ((2014) ) Differential effects of current specific treatments on behavioral and psychological symptoms in patients with Alzheimer’s disease: A 12-month, randomized, open-label trial. J Alzheimers Dis 39: , 477–85. |
[80] | Porsteinsson AP , Drye LT , Pollock BG , Devanand DP , Frangakis C , Ismail Z , Marano C , Meinert CL , Mintzer JE , Munro CA , Pelton G , Rabins P V , Rosenberg PB , Schneider LS , Shade DM , Weintraub D , Yesavage J , Lyketsos CG ((2014) ) Effect of citalopram on agitation in Alzheimer disease: The CitAD randomized clinical trial. JAMA 311: , 682–691. |
[81] | Sultzer DL , Davis SM , Tariot PN , Dagerman KS , Lebowitz BD , Lyketsos CG , Rosenheck RA , Hsiao JK , Lieberman JA , Schneider LS ((2008) ) Clinical symptom responses to atypical antipsychotic medications in Alzheimer’s disease: Phase 1 outcomes from the CATIE-AD effectiveness trial. Am J Psychiatry 165: , 844–854. |
[82] | Doody RS , Thomas RG , Farlow M , Iwatsubo T , Vellas B , Joffe S , Kieburtz K , Raman R , Sun X , Aisen PS , Siemers E , Liu-Seifert H , Mohs R , Alzheimer’s Disease Cooperative Study Steering Committee, Solanezumab Study Group ((2014) ) Phase 3 trials of solanezumab for mild-to-moderate Alzheimer’s disease. N Engl J Med 370: , 311–321. |
[83] | Sevigny J , Chiao P , Bussière T , Weinreb PH , Williams L , Maier M , Dunstan R , Salloway S , Chen T , Ling Y , O’Gorman J , Qian F , Arastu M , Li M , Chollate S , Brennan MS , Quintero-Monzon O , Scannevin RH , Arnold HM , Engber T , Rhodes K , Ferrero J , Hang Y , Mikulskis A , Grimm J , Hock C , Nitsch RM , Sandrock A ((2016) ) The antibody aducanumab reduces Aβ plaques in Alzheimer’s disease. Nature 537: , 50–56. |

