

Abstract
Classical image statistics, such as contrast, entropy, and the correlation between central and nearby pixel intensities, are thought to guide ocular fixation targeting. However, these statistics are not necessarily task relevant and therefore do not provide a complete picture of the relationship between informativeness and ocular targeting. Moreover, it is not known whether either informativeness or classical image statistics affect microsaccade production; thus, the role of microsaccades in information acquisition is also unknown. The objective quantification of the informativeness of a scene region is a major challenge, because it can vary with both image features and the task of the viewer. Thus, previous definitions of informativeness suffered from subjectivity and inconsistency across studies. Here we developed an objective measure of informativeness based on fixation consistency across human observers, which accounts for both bottom-up and top-down influences in ocular targeting. We then analyzed fixations in more versus less informative image regions in relation to classical statistics. Observers generated more microsaccades on more informative than less informative image regions, and such regions also exhibited low redundancy in their classical statistics. Increased microsaccade production was not explained by increased fixation duration, suggesting that the visual system specifically uses microsaccades to heighten information acquisition from informative regions.
Introduction
The visual system is constrained by limitations that challenge the efficient and unambiguous encoding of commonly encountered signals. First, the brain is too small to contain the anatomical machinery necessary to process information at all retinal eccentricities with as high resolution as in the fovea (McCamy et al., 2014). Instead, saccades—interleaved with fixation periods—orient the fovea to sequential visual regions for high acuity processing. Second, natural images are highly structured and redundant (Field, 1994; Ruderman, 1994); thus, uniform sampling of a scene is not an efficient strategy for information acquisition. Indeed, visual sampling is not uniform (Mackworth and Morandi, 1967; Reinagel and Zador, 1999). Finally, the viewer's task greatly influences the sampling strategy (Yarbus, 1967a). To understand how the human visual system overcomes these hurdles, we must consider its sampling method (top-down and bottom-up guided saccades and fixations), as well as the statistics of the visual environment.
Previous studies have shown that image statistics can influence fixation locations (Reinagel and Zador, 1999; Parkhurst, 2003; Unema et al., 2005; Henderson and Smith, 2009; Rayner et al., 2009; Henderson et al., 2013), but their effects on the production of microsaccades (i.e., microscopic saccades) during fixation are unknown. Indeed, no research has shown a role of microsaccades in information acquisition during visual scanning.
Microsaccade production and information acquisition could be linked in a variety of ways. (1) Microsaccades may sample image regions in which information content is high. If so, more informative regions should trigger higher microsaccade rates than less informative regions. (2) Microsaccades may instead extract information from image regions in which information content is low. If so, less informative regions should trigger higher microsaccade rates. (3) Microsaccades may not be related to information acquisition, in which case microsaccade rates should be equivalent in more and less informative regions.
To determine which possibility is correct, we must first specify more versus less informative image regions. Classical image statistics, such as contrast, entropy, and correlation between central and nearby pixel intensities, account only for specific types of image content, which may not be relevant to the task (Mackay et al., 2012). Thus, we defined more versus less informative image regions in terms of fixation consistency across observers (Mackworth and Morandi, 1967). This measure of informativeness is not only objective, but it also accounts for both bottom-up and top-down influences on image exploration. We then compared the characteristics of fixations in more versus less informative image regions. Image informativeness and classical statistics are not necessarily related, as when subjects are tasked with finding the blank areas of an image. Therefore, we also analyzed the classical statistics of image patches around fixations as a function of informativeness and microsaccade production.
Viewers generated more microsaccades and fixated for longer periods on more informative image regions. Such regions were less redundant in terms of their contrast, entropy, and correlation. Furthermore, microsaccade production was not fully explained by fixation duration, suggesting that the visual system specifically uses microsaccades to heighten information acquisition from highly informative image regions.
Materials and Methods
Ethics statement
Experiments were approved by the Barrow Neurological Institute Institutional Review Board (protocol number 04BN039) and conformed with the Declaration of Helsinki. Written informed consent was obtained from each participant.
Subjects
Eight subjects (six females, two males) with normal or corrected-to-normal vision participated in three experimental sessions of 60 min each. Seven of the subjects were naive and were paid $15/session.
Experimental design
Subjects rested their head on a chinrest, 57 cm from a linearized video monitor (75 Hz refresh rate; Barco Reference Calibrator V). Eye position was acquired noninvasively at 500 Hz (EyeLink II; SR Research).
We tested eight experimental conditions: 2 types of viewing conditions (free-viewing vs fixation) × 4 types of scene conditions (blank scene, natural scene, picture puzzle, and Where's Waldo; see below). In the free-viewing conditions, subjects were free to move their eyes over the scene. No fixation target was presented, and an auditory alert (a short beep) sounded if the subject's gaze left the area of the image for >500 ms (gaze excursions <500 ms were permitted to allow blinks). In the fixation conditions, subjects fixated a red cross (0.75°; where the degree symbol means degrees of visual angle) on the center of the screen and received an auditory alert if their gaze left a 2 × 2° fixation window for >500 ms. We presented 15 different images per scene condition (except for the blank scene condition, which was presented 15 times). This resulted in a total of 8 × 15 = 120 trials, presented in pseudorandom order, and run over three sessions of 40 trials each. Each trial was 45 s long.
The images were as described in the study by Otero-Millan et al. (2008). All images were centered on the monitor, were equalized for average luminance and RMS contrast (except for the blank scene, which was 50% gray), and had the same size (36 × 25.2°). The images presented in the fixation and free-viewing conditions were identical, except for the presence/absence of the fixation cross.
In the free-viewing conditions, the subject's task depended on the visual scene presented (Fig. 1). In the blank scene and natural scene conditions, subjects were instructed to explore the image at will. The picture puzzle and Where's Waldo conditions involved visual searches. In the picture puzzle condition, subjects had to find all the differences between two side-by-side near-identical scenes. In the Where's Waldo condition, subjects conducted the classic search task (i.e., they searched for Waldo and other relevant characters/objects from the Where's Waldo books). Each trial was preceded by an instructions screen that indicated the type of task to be performed. Before the Where's Waldo trials, the instructions screen illustrated the various cartoon characters and objects to be identified. When the subjects pressed the spacebar, the instructions screen disappeared and the trial started. At the end of the picture puzzle and Where's Waldo trials, the subjects indicated, using the mouse, the image locations corresponding to the detected objects/differences (the image remained on the screen). In the picture puzzle condition, subjects were required to indicate the differences on the left image only.

Experimental conditions. Cyclopean eye-position traces for 45 s of free-viewing during a blank (50% gray) (A), natural (B), picture puzzle (C), and Where's Waldo (D) scene. Images shown with low contrast for clarity in the eye-position traces.
In the fixation conditions, the visual stimulus varied from trial-to-trial, but the subject's task (i.e., attempted fixation) did not.
Here we are concerned with information acquisition during free-viewing; thus, we include no analyses of the fixation conditions (previously reported by Otero-Millan et al., 2008). The present free-viewing analyses do not overlap with previous analyses unless otherwise noted. Previous analyses did not include the investigation of image statistics conducted here.
Eye movement analyses
Microsaccade and blink detection
Eye position was acquired binocularly with a fast video-based eye tracker at 500 Hz (EyeLink II; SR Research). We identified and removed blink periods as portions of the raw data in which pupil information was missing. We also removed portions of data in which very fast decreases and increases in pupil area occurred (>50 units per sample), because such periods are probably semi-blinks in which the pupil is never fully occluded (Troncoso et al., 2008). We added 200 ms before and after each blink/semi-blink to eliminate the initial and final parts in which the pupil was still partially occluded (Troncoso et al., 2008). Epoch removal to exclude potential influences from pupil-area fluctuations attributable to blinks or semi-blinks amounted to 9 ± 2% (SEM) of the total recording time, placing an acceptable upper bound on data loss from this procedure. After removal of blinks, saccades were identified with a modified version of the algorithm developed by Engbert and Kliegl (2003) and Engbert and Mergenthaler (2006) with λ = 6 (used to obtain the velocity threshold) and a minimum saccadic duration of 6 ms. Saccade rates near blinks (within 1 s of the beginning or end of a blink: 1.67 ± 0.10 saccades/s) were not significantly different from those away from blinks (>1 s away from the beginning and end of a blink: 1.97 ± 0.11 saccades/s; Wilcoxon's signed-rank test, p = 0.06).
To reduce the amount of potential noise, we considered only binocular saccades, that is, saccades with a minimum overlap of one data sample in both eyes (Engbert and Mergenthaler, 2006).
Some saccades are followed by a fast and small saccadic eye movement in the opposite direction, called dynamic overshoot, which is often more prominent in the eye that moves in the abducting direction (Kapoula et al., 1986). Unlike the return saccade in a square-wave jerk (Otero-Millan et al., 2011b), a dynamic overshoot follows a saccade with very short latency between the two movements. We identified dynamic overshoots as saccades that occurred <20 ms after a preceding saccade (Møller et al., 2002), and we did not regard them as new saccades. Instead, we added the duration of the overshoot into the duration of the saccade, thus considering it part of the saccade (Di Stasi et al., 2013). Microsaccades were defined as saccades with magnitude <1° in each eye (Martinez-Conde et al., 2009, 2013). For the microsaccadic main sequence (peak velocity–magnitude relationship), see Figure 2. These and other descriptive microsaccade statistics were consistent with those reported in past studies (for review, see Martinez-Conde et al., 2009).

Microsaccade main sequence. Peak velocity–magnitude relationship for all saccades with magnitude <1° in each eye (i.e., microsaccades), for all subjects combined (n = 8) in the natural scene, picture puzzle, and Where's Waldo free-viewing conditions. Each dot represents a microsaccade.
Fixation periods and locations
We defined fixation periods as those time periods during which subjects were not blinking or making saccades larger than 1°. The fixation location for each eye for a given fixation period was defined as its average location during that period. We averaged across the two eyes to obtain a unique fixation location for any given fixation period.
We note that, although previous studies have similarly declared breaks in fixation whenever saccades occur, many have ignored microsaccade production by setting high-velocity thresholds (i.e., approximately >35°/s; Parkhurst, 2003; Tatler et al., 2005; Henderson and Smith, 2009), whereas 32% of microsaccades in the current study had peak velocities <35°/s) and/or using recording systems that were not amenable to reliable microsaccade detection. In such cases, microsaccade occurrence would not break fixation as defined, and so fixation periods may include considerable numbers of microsaccades.
Fixation heat map
To construct a fixation heat map as in the study by Wooding, (2002a), for an individual subject and image, first let (i1, ij), (i2, j2), …, (in, jn) represent the fixation locations for the subject in the image [the (ik, jk) are not necessarily unique; Fig. 3A]. Let U(i, j) = ∑k = 1n δ((i, j) − (ik, jk)), where δ(0, 0) = 1 and δ(i, j) = 0 for (i, j) ≠ (0, 0), be the fixation map. Next, let G(i, j) = 1/(2πσ2)exp[−(i2 + j2)/(2σ2)] be a Gaussian kernel, with σ = 0.64°, for a half-width height of 1.5° (35 pixels for ∼1°) to simulate foveal range (Wooding, 2002a,b). We defined the fixation heat map for that subject and image as f(i, j) = U(i, j) * G(i, j), where * is convolution. This essentially drops a Gaussian kernel around each fixation location to simulate where the fovea landed in the image for each given fixation. We defined the normalized fixation map as
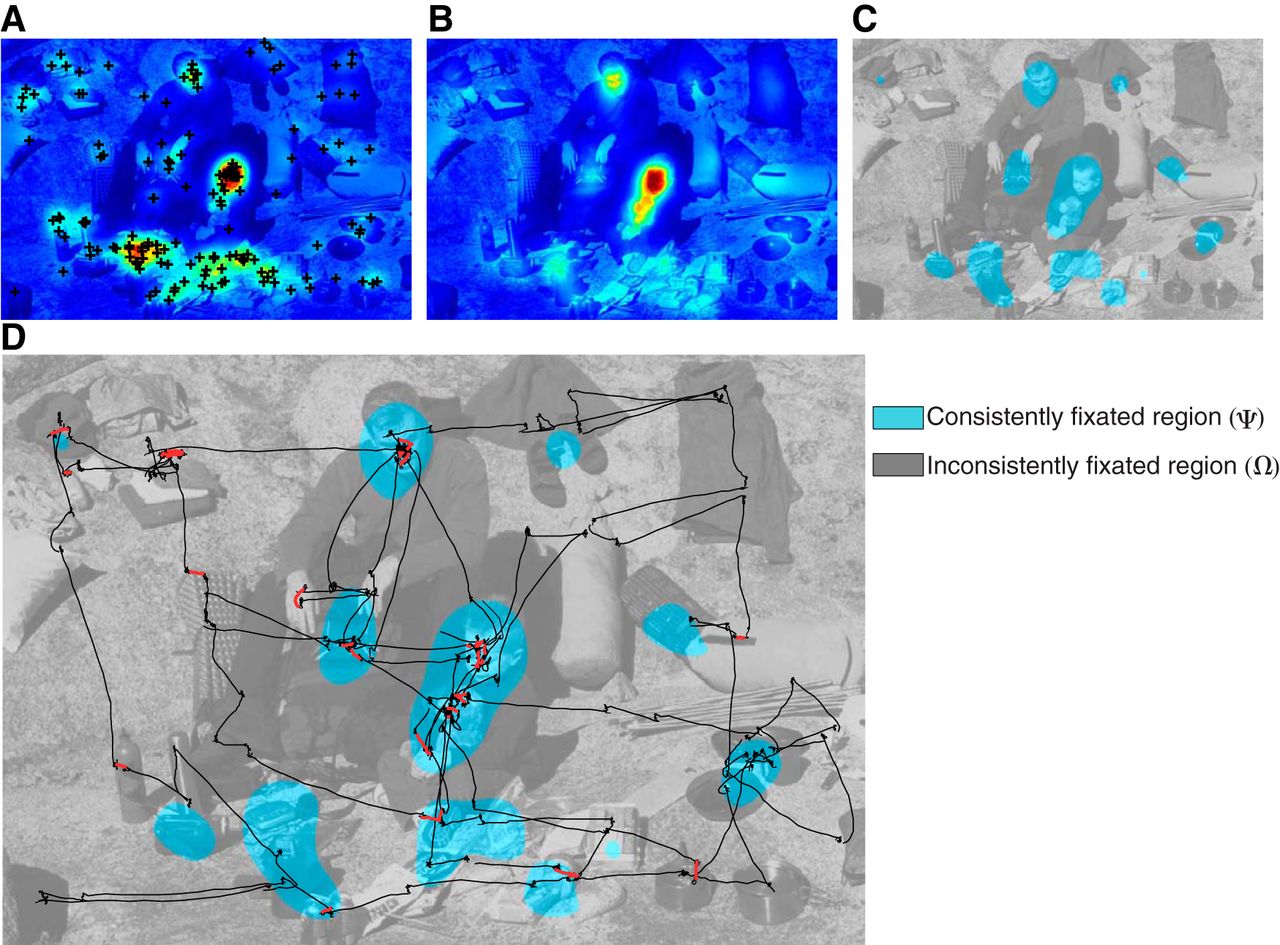
Consistently and inconsistently fixated regions of an image from the natural scene condition. A, The normalized fixation heat map of one subject. Each black cross is a fixation location. A Gaussian kernel was convolved with the fixation map (see Materials and Methods) to create the heat map. B, Average of the normalized fixation heat maps from seven of the eight subjects [F̄(i, j)]. C, The consistently (Ψ) and inconsistently (Ω) fixated regions were found by applying a threshold to F̄(i, j) from B using Otsu's method (see Materials and Methods). D, Cyclopean eye position trace (45 s) during free-viewing for the one subject that was not used to create the map in C. Fixation durations and microsaccade rates were compared between the consistently (Ψ) and inconsistently (Ω) fixated regions. Black lines are eye positions as a function of time, and red lines denote microsaccades.
Consistently and inconsistently fixated regions
For a given subject and image, we constructed two separate regions and compared fixations between them: a “consistently fixated region” (Ψ) and an “inconsistently fixated region” (Ω). To create these regions, for a given subject, we averaged all the normalized fixation heat maps of the other subjects [i.e., F(i, j)] in the study. We called their average F̄(i, j). This made it so a given subject's fixations had no influence on the creation of the two regions used to analyze his/her fixations, thus avoiding circularity. To create the two regions for a given subject, we thresholded F̄(i, j) using Otsu's method (Otsu, 1975). Otsu's method assumes that the image to be thresholded, in this case F̄(i, j), contains two classes of pixels and then calculates the optimum threshold used to separate the two classes, by exhaustive search, so that their combined spread (sum of within-class variances) is minimal. The consistently fixated region (Ψ) was defined as the region of pixels above threshold, and the inconsistently fixation region (Ω) was the region of pixels below threshold (Fig. 3C). We determined the fixation and microsaccade statistics of the given subject from these regions (Fig. 3D).
We tested whether the average normalized fixation heat maps may generalize to different sets of subjects, as follows: for each image, in each image category (i.e., natural scene, picture puzzle, Where's Waldo), we randomly selected half of the subjects to create one average normalized fixation heat map F̄1 and the other half of the subjects to create another average normalized fixation heat map F̄2. Then, we calculated the Spearman's correlation coefficient between the two maps ρ(F̄1, F̄2). We did this process 10 times and averaged across these 10 correlations for each image. We obtained highly significant values for every correlation calculated (all p values <10−10), with the following average ± SEM correlation coefficients for each image category: natural scene images, ̄ρ = 0.63 ± 0.02; picture puzzle images, ̄ρ = 0.63 ± 0.04; and Where's Waldo images, ̄ρ = 0.44 ± 0.03. Such large and highly significant correlations for these small datasets (i.e., each average normalized fixation heat map was generated with four independent subjects) are consistent with previous research (Yanulevskaya et al., 2011) showing that the average normalized fixation heat map stabilizes at approximately seven subjects (albeit with σ = 1°) and suggest that the present average normalized fixation heat maps should generalize to other independent sets of subjects.
Image statistics
Image patch ensembles
Patch ensembles from various types of fixations.
To analyze image statistics around fixation locations, we extracted square image patches of side length 2° centered at fixation locations and constructed three different ensembles for each image: one with fixations without microsaccades E∅, one with fixations with microsaccades EM, and an image shuffled ensemble EIS with patches selected based on the fixation locations of that subject on other images from the same task [this accounts for free-viewing tendencies not dependent on the particular image, such as central fixation biases (Reinagel and Zador, 1999; Parkhurst, 2003; Tatler, 2007)]. To diminish the effects of outliers, non-normal data, and random positioning, we used nonparametric bootstrapping to estimate the mean of any given statistic for any ensemble from a given subject and image (Baddeley, 1996; Parkhurst, 2003; Tatler et al., 2005). That is, we sampled 1000 times, with replacement, from any given ensemble and used the mean of the statistic found from those 1000 bootstrap samples. Here, all statistics were found for an ensemble for a given image and subsequently averaged across images for a subject and finally across subjects (see Fig. 9). Any statistical comparisons between the ensembles in this case were done across subjects (see Fig. 9).
Patch ensembles from Ψ and Ω.
To analyze the statistics of image areas around fixations within Ψ and Ω, we extracted square image patches of side length 2° centered at fixation locations and separated them into two different ensembles for each image: one with fixations contained in Ψ (EΨ) and one with fixations contained in Ω (EΩ). Again, to diminish the effects of outliers and non-normal data, we used nonparametric bootstrapping as above. Here, all statistics were found for an ensemble for a given image and subsequently averaged across subjects. This result was then averaged across images for any given visual scene condition (see Fig. 8). Any comparisons between the ensembles in this case were done across images as opposed to across subjects (Fig. 8). We used this approach because the average normalized fixation heat maps were highly correlated and are known to stabilize around seven subjects (Yanulevskaya et al., 2011); comparisons between ensembles across subjects could thus lead to trivial significant differences.
We required five patches of any given ensemble to calculate statistics from the ensemble. If one of the ensembles for a given image and subject did not have five patches, then all ensembles from that image and subject were excluded from the analyses. For all ensembles, a patch must have fit entirely inside the image to be used in the analyses. We compared the contrast, correlation, and entropy across the different ensembles, and we describe how we calculate these variables next.
Contrast
Following Reinagel and Zador (1999) and Parkhurst (2003), we defined the contrast for an ensemble of N patches for a given subject and image, as follows:
 Here Ī is the mean intensity of the entire image, Iij is the intensity of the pixel at position (i, j), Īk is the mean intensity of patch k, and Πk are the indices of patch k. We defined the pixel intensity as the average of the red, green, and blue components of the RGB images (each component ranging from 0 to 255). This measure refers to the local SD of pixel intensities of image patches.
Correlation
Similar to Reinagel and Zador (1999) and Parkhurst (2003), we defined the correlation between two pixel locations, (i, j),(i′, j′), across an ensemble of N patches as r(i, j, i′, j′) = N−1∑k=1N (Iijk − Ĩij)(Ii′j′k − Ĩi′j′), where Ĩij = N−1∑k=1NIijk, and Iijk is the intensity of patch k at pixel (i, j). The normalized correlation function was defined as ρ(i, j, i′, j′) = r(i, j, i′, j′)/r(0, 0, 0, 0) [here (0, 0) represents the central pixel of the patch (Reinagel and Zador, 1999; Parkhurst, 2003)]. Let Δ represent the distance between the central pixel of the patch and another pixel (i, j). Then to simplify the analyses, we found ρ(i, j, 0, 0) at all possible points (i, j) and averaged points that were the same distance from the central pixel. Thus, let ρ(Δ) = | DΔ |−1∑(i,j) ∈DΔ ρ(i, j, 0, 0), where DΔ = {(i, j):||(i, j) − (0, 0)|| = Δ}. Then, ρ(Δ) represents the average ρ across all pixels the same distance Δ from the central pixel of a patch. Note that, when considering the average ρ across pixels, to avoid biases in correlation measures [i.e., analyzing correlations in only the horizontal or vertical dimension leads to an underestimate of the correlation level (Parkhurst, 2003)], we required the entire circle of pixels to be included in the average; thus, we only analyzed ρ(Δ) for Δ∈[0,1]°. ρ(Δ) measures the degree of correlation between pixels at the center of patches (i.e., at the gaze position) and all the pixels at a distance of Δ° from the center.
Entropy
If pi for i = 1, …, n are the unique pixel intensities occurring on a given patch, then we defined the entropy of an image patch as H = −ΣiP(pi)log2(P(pi)), where P(pi) is the probability of the pixel intensity pi occurring in the patch (Gonzalez et al., 2009).
Face regions
All faces, human and nonhuman, were tagged manually by author M.B.M. (8 of 15 natural scene images contained faces, as did 9 of 15 picture puzzle images and all Where's Waldo images).
Results
Microsaccade rates and fixation durations in Ψ versus Ω
If the visual system uses microsaccades to extract readily available information from image regions with high informativeness, then microsaccade rates should increase when viewers foveate highly informative image regions. Alternatively, the brain may use microsaccades to enhance information acquisition where it is scarce; if so, the less informative image regions should trigger the highest microsaccade rates, or the brain might not use microsaccades to sample visual information, in which case there should be no relationship between microsaccade rates and the informativeness of specific image regions. To determine which possibility is correct, we divided each image into two regions that were consistently versus nonconsistently fixated across subjects. Consistently fixated regions are thought to be more informative than inconsistently fixated regions (Mackworth and Morandi, 1967) (at least in the presence of visual information: the blank scene condition is not included in the following analyses unless otherwise specified).
Fixation consistency across subjects, as an objective method of measuring informativeness, has the advantage that it accounts for both bottom-up and top-down influences in image exploration, whereas classical image statistics (i.e., entropy, contrast, correlation) are limited in that they solely address image content, which may or may not be task relevant. Indeed, consistency in fixation and classical measures of information may be mutually exclusive, as in the hypothetical case of searching for blank areas in the scene. Thus, we regard consistency in fixation as more important to understanding the role of eye movements in acquiring relevant scene information. We will heretofore use “informativeness” to refer to fixation consistency across observers.
To determine more versus less informative image regions, we first created normalized fixation heat maps for each subject and image (Wooding et al., 2002). Then, for each given subject and image, we averaged all other subjects' normalized fixation heat maps and used the result to analyze the fixation behavior of that subject. We then used Otsu's method (an objective clustering method) to divide each average normalized heat map into two distinct regions within the image: the consistently fixated region (Ψ) and the inconsistently fixated region (Ω; see Materials and Methods). Although Ψ encompassed only 29% of the total area of the image on average (natural scenes 20%, picture puzzles 32%, Where's Waldo 34%), it included 54% of all fixations (natural scenes 51%, picture puzzles 61%, Where's Waldo 52%; Fig. 4), consistent with the notion that observers viewed Ψ as more informative than Ω (Mackworth and Morandi, 1967).

Fixation duration and microsaccade rates on the consistently fixated region (Ψ) versus the inconsistently fixated region (Ω). Average fixation duration (first column), number of fixations per fixation duration (second column), microsaccade rate (third column), and microsaccade rate as a function of fixation duration (fourth column) for fixations on Ψ (blue) and Ω (gray) during the natural scene (A), picture puzzle (B), and Where's Waldo (C) conditions. For the second and fourth columns, fixation durations were binned into terciles (i.e., 3 quantiles) for each subject (tick marks are the average location of the terciles across subjects). In all panels, first we averaged across images within a subject and then across subjects. Error bars represent the SEM across subjects (n = 8). *p < 0.05; **p < 0.01 (Wilcoxon's signed-rank test).
In every condition, microsaccade rates were significantly higher in Ψ than in Ω (Fig. 4), consistent with the hypothesis that the brain uses microsaccades to scan information-rich image regions in a task-relevant manner (i.e., rather than to enhance content retrieval in information-poor image regions). Lending additional support to this idea, microsaccade rates were significantly higher in face than in non-face regions (Fig. 5; Guo et al., 2006; Otero-Millan et al., 2008). To exclude the possibility that face fixations were solely responsible for the differences in microsaccade production between Ψ and Ω, we redid the above analyses after removing all face fixations: microsaccade rates remained significantly higher in Ψ than in Ω (data not shown).

Fixations on face versus non-face regions. Average fixation duration (first column), number of fixations per fixation duration (second column), microsaccade rate (third column), and microsaccade rate as a function of fixation duration (fourth column) for face (yellow) and non-face regions (gray) during the natural scene (A), picture puzzle (B), and Where's Waldo (C) conditions. For the second and fourth columns, fixation durations were binned into terciles (i.e., 3 quantiles) for each subject (the tick marks are the average location of the terciles across subjects). In all panels, first we averaged across images within a subject and then across subjects. Error bars represent the SEM across subjects (n = 8). *p < 0.05; **p < 0.01 (Wilcoxon's signed-rank test).
Despite the known variability in microsaccade rates across subjects (Rolfs, 2009), we found that individual subject data exhibited the same trends (i.e., higher microsaccade rates in Ψ than in Ω) for each image category as the subject average (Fig. 6).

Microsaccade rates on the consistently fixated region (Ψ) versus the inconsistently fixated region (Ω) for each subject and image category. Each color represents one subject.
Fixation durations were likewise significantly longer in Ψ than in Ω and in face than in non-face regions (Figs. 4, 5). Because the likelihood of a microsaccade increases with fixation duration (Otero-Millan et al., 2008), we wondered whether increased fixation durations alone could explain the observed differences in microsaccade rates across image regions. We also wondered whether different numbers of fixations in the two regions could have driven this result. Note that, by analyzing microsaccade rates—the number of microsaccades divided by fixation duration—rather than microsaccade probabilities, our analyses accounted for variability in fixation duration. To definitively exclude the possibility that we conflated fixation duration, numbers of fixations, and microsaccade production, we did an additional analysis in which we established a 1-to-1 correspondence between fixations in Ψ and fixations in Ω. That is, single fixations in Ψ were randomly matched to single fixations in Ω with durations within 10 ms of each other. This resulted in equivalent fixation duration distributions and numbers of fixations for Ψ and Ω, eliminating the need to normalize by fixation duration, and removing the potential conflation between fixation duration, numbers of fixations, and microsaccade rates. Then, we analyzed the prevalence of fixations with a given number of microsaccades in Ψ versus Ω and did an equivalent analysis for face versus non-face regions.
We found that fixations in Ψ (respectively, face regions) were more likely to contain a single microsaccade than fixations in Ω (respectively, non-face regions; see Fig. 7), indicating that increased microsaccade production in Ψ (respectively, face regions) versus Ω (respectively, non-face regions) was not driven by a small number of fixations containing many microsaccades.

Probability of microsaccade occurrence in equivalent-duration fixations on the consistently fixated region (Ψ) versus the inconsistently fixated region (Ω) and on face versus non-face regions. Percentage of fixations of a given duration that contain one or two or more microsaccades in Ψ versus Ω (A) and in face versus non-face regions (B). In both A and B, each subject's fixations were randomly paired for analyses as a function of duration, so that each fixation in a given region corresponded to exactly one fixation in the other region with durations within 10 ms of each other. Fixation durations were then binned into deciles (i.e., 10 quantiles) for each subject (the tick marks are the average location of the deciles across subjects). Each bin thus contains the same number of fixations with the same fixation duration distribution. Solid lines indicate fixations with one microsaccade, and dashed lines indicate fixations with two or more microsaccades. Insets are the averages of the two lines pointed to by the arrows. Data collapsed across the natural scene, picture puzzle, and Where's Waldo experimental conditions. In both panels, first we averaged across images within a subject, then across image category within a subject, and finally across subjects. Error bars represent the SEM across subjects (n = 8). **p < 0.01 (Wilcoxon's signed-rank test).
The above results show that neither longer fixation durations nor more numerous fixations fully explain the higher microsaccade rates in Ψ than in Ω or in face than in non-face regions (Figs. 4, 5). Also, blank scene fixation durations (484 ms on average) were on the order of 1.5–2 times as long as fixation durations in the other three visual scene conditions, and microsaccade rates (0.2 microsaccades/s on average) were on the order of one-half to one-third of those in the other visual scene conditions, further indicating that increased fixation duration alone is not sufficient to account for microsaccade production (Otero-Millan et al., 2008).
Differences in microsaccade rate and fixation duration between Ψ versus Ω and between face versus non-face regions were largest for the natural scene and picture puzzle conditions (Figs. 4, 5), whose image properties are very different from those of Where's Waldo images; Where's Waldo images contain a higher density of faces (lessening their informativeness) and overall smaller spatial correlations than the natural scene and picture puzzle images (Figs. 1, 8, 9). Thus, the statistical properties of the Where's Waldo images may make it harder on the visual system to pick out the more informative regions for detailed scanning via microsaccades.

Image statistics of ensembles from the image patches centered on fixations on the consistently fixated region (EΨ), fixations on the inconsistently fixated region (EΩ), and image-shuffled fixation locations (EIS). Average entropy (left), contrast (middle), and correlation (right) of the ensembles for the natural scene (A), picture puzzle (B), and Where's Waldo (C) conditions. The insets in the correlation panels are the AUCs. The shadows and error bars represent the SEM across images (n = 15 in each visual scene condition). A line above the middles of any two bars indicates statistically significant differences with a p value < 0.05 (Wilcoxon's signed-rank test).

Image statistics of ensembles from image patches centered on fixations with microsaccades (EM), fixations without microsaccades (E∅), and image-shuffled fixation locations (EIS). Average entropy (left), contrast (middle), and correlation (right) of the ensembles for the natural scene (A), picture puzzle (B), and Where's Waldo (C) conditions. The insets in the correlation panels are the AUCs. The shadows and errors bars represent the SEM across subjects (n = 8). A line above the middles of any two bars indicates statistically significant differences with p < 0.05 (Wilcoxon's signed-rank test).
Next, we set out to determine whether classical measures of information (such as entropy, contrast, and correlation) may differ for image areas around fixations in Ψ and those around fixations in Ω. Such differences, if any, could provide additional evidence of a functional role of microsaccades in information acquisition.
Image statistics
We investigated image entropy, contrast, and spatial correlation [pixel intensity correlations between central and nearby pixels of square image patches (Reinagel and Zador, 1999; Parkhurst, 2003), defined locally at the scale of the fovea; for precise definitions, see Materials and Methods] in relationship to informativeness (as indicated by fixation consistency across viewers; Fig. 8) and microsaccade production (Fig. 9).
Image statistics at more informative versus less informative fixations
We compared the statistics of image areas around more informative fixations (i.e., fixations inside Ψ) with those around less informative fixations (i.e., fixations inside Ω) and with those around image-shuffled fixation locations [the latter accounts for free-viewing tendencies not dependent on the particular image, such as central fixation biases (Reinagel and Zador, 1999; Parkhurst, 2003; Tatler, 2007)]. To do this, we constructed ensembles of image patches by extracting square image patches centered around fixations located within Ψ (EΨ) and Ω (EΩ) and centered at fixation locations on other images selected randomly from the same visual scene condition (EIS). The area under the correlation curve (AUC) was significantly lower for EΨ than for EΩ and EIS in all conditions (EΩ and EIS had equivalent AUCs), the entropy was significantly higher for EΨ than for EΩ and EIS in all conditions (EΩ and EIS had equivalent AUCs), and the contrast was higher inside EΨ than EΩ for the natural scene and picture puzzle conditions (Fig. 8). These combined findings indicate that more informative fixations are centered on image patches with higher information content (i.e., as measured according to standard image statistics: lower correlation, higher entropy, and higher contrast) than less informative fixations.
Image statistics at fixations with and without microsaccades
More informative fixations had more microsaccades and were centered on image patches with less correlation, higher entropy, and higher contrast (Figs. 4, 8) than less informative fixations. This suggested that image patches around fixations with microsaccades may have less correlation and have higher entropy and contrast than image patches around fixations without microsaccades. If so, it would support the notion that the brain uses microsaccades to acquire information from image areas in which informational content is high (as opposed to extract information from areas in which information is scarce). To address this issue, we extracted square image patches of side length 2° around each fixation location and separated them into two ensembles of image patches: fixations with microsaccades (EM) and fixations without microsaccades (E∅). We compared the statistics of these ensembles with each other and with those of the image-shuffled fixation ensembles (EIS). The AUC was significantly lower and entropy was significantly higher for EM than for E∅ and EIS (Fig. 9) in all conditions, indicating that fixations with microsaccades are used to scan image areas in which information content is higher than fixations without microsaccades and that fixations in general are used to scan image areas that are richer in information content than image-shuffled fixation locations. The only dependable finding for contrast across tasks was that actual fixation locations (with or without microsaccades) generally had higher contrasts than image-shuffled fixation locations (Fig. 9).
Microsaccades and fixation durations as a function of viewing time
To determine whether microsaccade rates and fixation durations changed with viewing time, we analyzed microsaccade rates and fixation durations during 3 s bins over the course of image viewing (here we analyzed the blank scene condition as well). Microsaccade rates increased significantly with viewing time for the Where's Waldo condition (Fig. 10); here, microsaccades may have gained importance with time because of the low spatial correlation levels in the images (Figs. 8C, 9C). Microsaccade rates did not change significantly over time for the natural scene, picture puzzle, or blank scene conditions (Fig. 10). Fixation durations increased with viewing time for the natural scene, picture puzzle, and Where's Waldo conditions but not for the blank scene condition (Fig. 10). These data suggest that microsaccade rates and fixation durations adjust to image statistics and task demands so as to acquire task-relevant information during natural vision. Moreover, our results support the idea that fixation duration alone is not a sufficient indicator of microsaccade probability: fixation durations increased with viewing time in every condition that included visual content, but microsaccade rates only did in the Where's Waldo condition, presumably because of the nature of the search task and the low correlation of the images. Finally, initial fixation durations (i.e., in the first 3 s time bin) were always shorter than in all other time bins, in all conditions (Wilcoxon's signed-rank test, all p values < 0.05). Studies have shown that observers obtain the gist of a scene during the first 40–200 ms of the first fixation (Biederman et al., 1974; Potter et al., 2002; Fei-Fei et al., 2007; Rayner, 2009) and that visual information processing proceeds in a global to local manner (Navon, 1977; Hegdé, 2008), with the gist obtained in the first glance guiding subsequent eye movements for more detailed/local analysis (Castelhano and Henderson, 2007). Our results are consistent with this framework in that initial fixations were short and fixation durations increased with viewing time (in agreement with Loftus and Mackworth, 1978; Unema et al., 2005; Pannasch et al., 2008; Fischer et al., 2013).

Microsaccade rates and fixation duration as a function of viewing time. Microsaccade rates and fixation duration (bottom) across viewing time in the natural scene (A), picture puzzle (B), Where's Waldo (C), and blank scene (D) conditions. We averaged across images for each subject and subsequently across subjects. Shadows represent the SEM across subjects (n = 8). *p < 0.05, statistically significant difference among the temporal bins (Friedman's test).
Discussion
No research to date has shown a positive relation between information acquisition and microsaccade production. Here we found that consistently fixated image regions generated higher microsaccade rates and longer fixation durations than inconsistently fixated image regions, in a variety of visual exploration and search tasks. These results suggest that the brain produces more microsaccades and longer fixations to acquire information from image regions in which task-relevant information is richest. However, longer fixation durations did not by themselves explain increased microsaccade rates, suggesting that microsaccade production, per se, is a favored strategy for information gathering in information-rich regions. The contrast, entropy, and correlation of image areas indicated increased low-level information and reduced redundancy around more informative fixations than less informative fixations. Such elevated information content may have contributed to the generation of longer fixations and higher microsaccade rates in more informative image regions. Finally, fixations with microsaccades tended to occur on image areas with lower correlation and higher entropy than fixations without microsaccades, further suggesting that the visual system actively uses microsaccades to acquire information.
Gaze fixation and natural scene statistics
Whereas previous studies have related the statistical properties of images (i.e., spatial contrast/correlation, or the presence of two-dimensional image features such as curved lines and edges, occlusions) to fixation locations (Reinagel and Zador, 1999; Krieger et al., 2000; Parkhurst, 2003), no previous study has investigated microsaccade production in relation to informativeness or other statistical properties of fixation locations within an image. Here we found that image patches around more informative fixations have lower correlation and higher entropy and contrast than those around less informative fixations (consistent with Reinagel and Zador, 1999; Parkhurst, 2003) and that the visual system uses more microsaccades and longer fixations to analyze the former.
Previous research found that image patches around fixated locations (or gaze position) contain less spatial correlation and higher contrast than those around random locations (Reinagel and Zador, 1999; Parkhurst, 2003). Our current findings support and critically extend these pioneering results by showing the following: (1) not all fixations are equal but vary according to informativeness; (2) more informative fixations contain more microsaccades than less informative fixations; and (3) image patches around more informative fixations are less correlated and have higher contrast than image patches around less informative fixations. These results applied to a variety of images and viewing tasks, indicating a robust finding. Finally, because image patches around less informative fixations and around image-shuffled fixations had equivalent correlation measures, our results suggest that the statistics of image patches around more informative fixations may have contributed significantly to previous observations that image patches around fixated locations (or gaze position) have less spatial correlation and higher entropy and contrast than image patches around random locations (Reinagel and Zador, 1999; Parkhurst, 2003).
Fixation durations
The precise factors that account for variability in fixation duration across scenes, tasks, and observers are understudied (Henderson and Hollingworth, 1998; Henderson and Smith, 2009). Previous investigations have reported a relationship between fixation duration and “informativeness” (Antes, 1974; Loftus and Mackworth, 1978; De Graef et al., 1990; Henderson et al., 1999; Unema et al., 2005) but defined informativeness subjectively and inconsistently across studies. Here we provide an objective measure of informativeness that accounts for both top-down and bottom-up influences, and we show that informativeness is a significant factor in fixation duration variability.
Microsaccades
Saccadic eye movements play multiple roles in vision: they foveate targets, correct gaze errors, and search and integrate information about the environment to stitch together the perception of a scene (Yarbus, 1967b; Leigh and Zee, 2006). Likewise, many microsaccade functions have been proposed, such as keeping the currently fixated region centered on the optimal locus (Cornsweet, 1956; Nachmias, 1961; Boyce, 1967; St.St Cyr and Fender, 1969; Engbert and Kliegl, 2004; Putnam et al., 2005; McCamy et al., 2013b), counteracting perceptual fading (Martinez-Conde et al., 2006; Troncoso et al., 2008; McCamy et al., 2012, 2013a), enhancing fine spatial detail/improving performance in high acuity visual tasks (Donner and Hemilä, 2007; Rucci et al., 2007; Ko et al., 2010), decorrelating natural scenes and the associated neural responses to help establish efficient representations of natural stimuli (Rucci and Casile, 2005; Casile and Rucci, 2006; Kuang et al., 2012), and scanning small visual regions (Haddad and Steinman, 1973; Otero-Millan et al., 2013). These various roles need not be mutually exclusive but may overlap considerably. For instance, counteracting fading and enhancing fine spatial detail could help microsaccade-driven information acquisition.
No research to date has linked microsaccade production to information acquisition. Past studies investigating scanning behavior during free exploration of natural scenes may have disregarded small saccades (i.e., microsaccades) as serving a corrective rather than a sampling role (Tatler and Vincent, 2008) or perhaps ignored them altogether by setting velocity thresholds that were too high for microsaccade detection (Parkhurst, 2003; Tatler et al., 2005; Henderson and Smith, 2009), thus overlooking their role in visual information processing. Our present findings indicate that the brain uses microsaccades to acquire task-relevant information during fixation of small image regions. These results may help develop and constrain theoretical models of microsaccade triggering (Rolfs et al., 2008; Engbert et al., 2011; Otero-Millan et al., 2011a; Hafed and Ignashchenkova, 2013).
Footnotes
This study was supported by the Barrow Neurological Foundation (S.L.M. and S.M.-C.) and National Science Foundation Awards 0852636 and 1153786 (S.M.-C.). J.O.-M. was a Fellow of the Pedro Barrié de la Maza Foundation. L.L.D.S. was supported by the MEC-Fulbright Postdoctoral Fellowship program (Grant PS-2010-0667). We thank B. Kousari for technical assistance.
The authors declare no competing financial interests.
- Correspondence should be addressed to Susana Martinez-Conde, Department of Neurobiology, Barrow Neurological Institute, 350 West Thomas Road, Phoenix, AZ 85013. smart{at}neuralcorrelate.com


