


Yung et al (Reference Yung, Phillips and McGorry1998) have developed operational criteria which predict the onset of a psychotic disorder and identify four subgroups at ultra-high risk of incipient psychosis (termed the at-risk mental states). In their work at the Personal Assessment and Crisis Evaluation (PACE) clinic, Yung and colleagues classify at-risk mental states as consisting of state and trait-plus-state risk factors. State risk factors are defined by the presence of either transient psychotic experiences (brief limited intermittent psychotic experiences) or attenuated (subclinical psychotic) symptoms, both of which use duration and severity criteria. Trait-plus-state risk factors are operationally defined by the presence of a recent deterioration in functioning plus either a first-degree relative with a history of psychosis or preexisting schizotypal personality disorder. Using these criteria Yung et al (Reference Yung, Phillips and McGorry1998) identified a high-risk cohort and reported that 40% of their sample made the transition to psychosis over a 9-month period.
An intervention based upon cognitive therapy has been shown to reduce transition to psychosis at 12-month follow-up in a randomised controlled trial of 58 people who met criteria for at-risk mental state (Reference Morrison, French and WalfordMorrison et al, 2004), where transition to psychosis was the primary outcome. Although this study provides evidence supporting cognitive therapy for people at high risk, there has been little empirical work substantiating the theoretical underpinnings of how cognitive therapy influences the progression of symptoms in this population.
There is a general recognition that stress and anxiety have important roles to play in the development of psychosis (Reference Zubin and SpringZubin & Spring, 1977), and it is clear that psychosis itself can be an anxiety-provoking experience. This view is consistent with the description of the psychosis prodrome as an interaction between positive symptoms and ‘neurotic’ symptoms (Reference Yung and McGorryYung & McGorry, 1996). Neurotic symptoms occur earlier in the prodrome (Reference Hafner, Maurer, Löffler, Hafner and GattazHäfner et al, 1995) and are hypothesised to promote the emergence of positive symptoms. These neurotic and positive symptoms are, therefore, expected to be related by positive feedback, underlying the development of full-blown psychosis over time (Reference Freeman and GaretyFreeman & Garety, 2003).
We are unaware of any studies describing the joint longitudinal development of positive symptoms alongside emotional dysfunction in the psychosis prodromes. One study examined the time course of symptom emergence in the prodrome, but this was based on retrospectively recalled symptoms (Reference Hafner, Maurer, Löffler, Hafner and GattazHäfner et al, 1995). In the present study we aim to model the development of positive symptoms of psychosis with emotional dysfunction over time in a high-risk sample. We also hypothesise that cognitive therapy will reduce levels of positive symptoms and emotional dysfunction in the high-risk participants over time.
METHOD
Participants
Participants were 57 help-seeking individuals who were considered by the referral agencies to meet criteria for the study. Referral agencies were primary care teams (including general practitioners, practice nurses and psychological therapists), student counselling services, accident and emergency departments, specialist services (e.g. community drug and alcohol teams, child and adolescent psychiatry and adult psychiatry services) and voluntary sector agencies (such as carers' organisations).
Specific state risk factors were operationally defined by the presence of either transient psychotic symptoms (termed brief limited intermittent psychotic symptoms) or attenuated (subclinical) psychotic symptoms, both of which were defined using an adaptation of the PACE duration and severity criteria (Reference Yung, McGorry and McFarlaneYung et al, 1996) based on the Positive and Negative Syndrome Scale (PANSS; Reference Kay and OplerKay & Opler, 1987) cut-off scores described in the original trial (Reference Morrison, French and WalfordMorrison et al, 2004). Trait-plus-state risk factors are operationally defined by the presence of an at-risk mental state (defined for the purposes of this study as scoring for caseness on the General Health Questionnaire (Reference Goldberg and HillierGoldberg & Hillier, 1979) and/or a recent deterioration in function of 30 points or more on the Global Assessment of Functioning (American Psychiatric Association, 1994) plus either a first-degree relative with a history of any psychotic disorder or a diagnosis of schizotypal personality disorder in the participant. Potential participants of less than 16 or more than 36 years were considered to be outside the maximum risk period for psychosis and were excluded. Current or past receipt of antipsychotic medication was an exclusion criterion. The mean age of the high-risk sample was 22.1 years (s.d.=4.4) and the male to female ratio was 40:18.
Measures
The measure used to assess suitability for inclusion and to monitor symptoms and experiences over time was the PANSS (Reference Kay and OplerKay & Opler, 1987), a clinician-administered 30-item semi-structured interview. The PANSS has three sub-scales to measure positive, general and negative symptoms. However, for this analysis we utilised the five-factor solution of negative, disorganised, positive, excited, and anxiety and depression (Reference Emsley, Rabinowitz and ToiremanEmsley et al, 2003). Positive symptoms and emotional dysfunction (anxiety–depression) scores were then computed based upon this five-factor PANSS solution. The five-factor solution computes positive symptoms to consist of delusions P1, unusual thought content G9, hallucinatory behaviour P3, suspiciousness P6, grandiosity P5, and lack of judgement and insight G12. Anxiety–depression is made up of the following items: anxiety G2, tension G4, depression G6, guilt feelings G3 and somatic concern G1.
Procedure
The study was a randomised controlled trial of cognitive therapy for people considered at high risk of psychosis. People were referred to the trial if they were help-seeking and met entry criteria. Individuals were then assessed by members of the research team using the PANSS to assess suitability. Those found suitable were randomly allocated to monitoring or monitoring plus cognitive therapy. For both arms the monitoring consisted of being seen by a member of the research team at monthly intervals for PANSS assessment over the course of 1 year. Full details regarding the study design and intervention are provided elsewhere (Reference French and MorrisonFrench & Morrison, 2004; Reference Morrison, French and WalfordMorrison et al, 2004).
Statistical analysis
Significance level (α) was set at 0.05. Analyses were conducted in SPSS for Windows version 11.5 using the linear ‘mixed models’ procedure. We used multivariate, multilevel, latent growth curve models (Reference Singer and WillettSinger & Willett, 2003) to characterise the joint development of positive symptoms and emotional dysfunction over time and to study the effects of explanatory variables (cognitive therapy and individual differences) on this longitudinal development.
Latent growth curve models separate the analysis of change over time into two components or levels. Level 1 represents within-person change, i.e. ‘growth’, whereas level 2 represents the variance in growth patterns across individuals. Level 1 effects are based upon the measured or ‘fixed’ values of observed variables and are therefore referred to as fixed effects. Change is represented at level 2 using random variables (i.e. random effects) based upon the variation in the observed scores not accounted for by the fixed effects. The distributional form of the random effects is assumed rather than measured; here the random effects were specified as normally distributed with a mean of zero and with variances and covariances to be estimated.
Mixed models are more general than multivariate analysis of covariance (MANCOVA) because MANCOVA does not account for the multilevel structure of longitudinal data, whereby measurement occasions (level 1) are clustered within individuals (level 2; Reference GoldsteinGoldstein, 1995). In addition the SPSS mixed-models procedure allows much greater flexibility than MANCOVA in modelling residual covariance structures, i.e. the non-independence of residuals owing to correlation of scores over time and correlation between dependent variables. Ignoring or mis-specifying such effects gives biased estimates of standard errors, leading to incorrect inference owing to inflated type I error (Reference Singer and WillettSinger & Willett, 2003).
The SPSS mixed-models procedure allows model estimation using full-information maximum likelihood. Maximum likelihood-derived parameter estimates are unbiased in the presence of missing data if the omitted occasions can be considered to be missing at random (MAR; Reference Little and RubinLittle & Rubin, 1987), i.e. related to covariates or previous values of the dependent variables but not the present (unobserved) values of the dependent variables. This is a less stringent condition than model estimation using pairwise or listwise deletion of missing values, which both assume data missing completely at random (MCAR), i.e. uncorrelated with any of the measured or unmeasured data.
Models
Three models were fitted to the data. All of the models had the same explanatory variables, i.e. fixed effects. Four variables described the participant characteristics at baseline: male gender (dummy coded), age at initial assessment (mean-centred at 22.15 years), the presence of family history of psychosis (dummy coded) and whether the participant had been randomised into the cognitive therapy condition (dummy coded). Longitudinal effects were modelled by assessment month (coded 0 at baseline to 12 for the final monthly assessment) and the interactions of month with the other explanatory variables.
The first model fitted included the explanatory effects above, but did not include random effects (i.e. no level 2 components) and so was not a latent growth curve model. This model was included as a comparison to provide a test of the usefulness of the linear growth curve framework. In this model the longitudinal dependence among scores was dealt with by specifying a compound-symmetric covariance structure for the residuals. Compound symmetry is commonly used as the covariance structure in fixed-effects repeated-measures analysis of covariance (ANCOVA) models, such as the one implemented in SPSS. It assumes constant variance across measurement occasions but allows the residuals to be related over time by estimating a correlation parameter for the off-diagonal elements of the covariance matrix. The residuals for positive symptoms and emotional dysfunction were also allowed to correlate at each time point, as is done in MANOVA models. This model was called Model 0.
The next model, Model 1, was a latent growth curve. In addition to fixed effects there was also a random-effects (i.e. level 2) specification consisting of separate random intercept and slope (i.e. change over time) parameters for positive symptoms and emotional dysfunction. The random intercepts allowed for between-person heterogeneity at initial assessment not captured by the fixed effects. Random slope parameters for month were used to account for dependency over assessment occasions and also to allow for variation in slopes across individuals, again conditional on the fixed effects. The random intercepts and slopes were allowed to correlate freely (i.e. an unstructured covariance matrix), allowing for non-independence among the random parameters. As was done for Model 0, an unstructured residual covariance matrix was specified across dependent variables within measurement occasions to allow for the correlation between positive symptoms and emotional dysfunction scores at each time point.
Models 0 and 1 treated change over time as linear. With many types of human growth and development this is not a realistic assumption. For example, cognitive therapy is a learning-based intervention and learning curves tend to be steeper at earlier than later time points (i.e. initial improvement is rapid but rate of change flattens off over time). Model 2 was therefore specified as identical to Model 1 but with a non-linear growth trajectory. This was achieved by using a natural log transformation of month (equal to ln[month+1] to avoid taking the log of zero at initial assessment). This transformation describes change as steeper over initial time points and flattening to asymptote over time.
The relative adequacy of model fit was assessed using the deviance statistic and the Akaike information criterion (AIC; Reference AkaikeAkaike, 1974). Both measures provide a relative index of lack of model fit, so smaller values imply better fit. The AIC can be defined as the deviance plus twice the number of estimated parameters in the model, which therefore penalises models for lack of parsimony.
RESULTS
All models were based on 432 measurements of positive symptoms and 421 of emotional dysfunction contributed by the 57 participants across the 13 measurement occasions. The mean number of assessments attended was therefore fewer than eight. This level of missing data will not bias maximum likelihood model estimates if the data are missing at random, so this assumption was first evaluated.
The most obvious cause of missing data in out-patient longitudinal research is when participants miss assessment appointments because of current symptom levels; if they are particularly poorly (i.e. they don't feel well enough to attend) or particularly well (i.e. they feel that attendance is unnecessary). This would amount to a violation of MAR unless symptom levels were significantly related with previous measurement occasions or covariates. Observed positive symptoms and emotional dysfunction scores were highly correlated across adjacent assessments (mean r=0.80), suggesting that current symptom levels at a given time were strongly related to levels at the previous time; therefore the MAR assumption was retained. Figure 1 shows the raw data means and standard errors for positive symptoms and emotional dysfunction over time according to treatment group.
Positive symptoms and emotional dysfunction showed a moderate reduction over time in both treatment groups. The standard errors for the emotional dysfunction scores were much larger than those for the positive symptom scores at virtually each time point. The standard errors were also much larger in the control group than in the treatment group. The three models were estimated and the comparative fit statistics are shown in Table 1.
Table 1 Comparative model fit statistics for the three models

| Model | Total parameters | Deviance | AIC |
|---|---|---|---|
| Model 0 — Compound symmetry1 | 22 | 4120.01 | 4164.01 |
| Model 1 — Linear growth curve2 | 33 | 3896.63 | 3962.63 |
| Model 2 — Model 1 with log time3 | 33 | 3887.19 | 3953.19 |
Table 1 shows that Model 0, a standard multivariate repeated-measures model without random effects, had the highest deviance and AIC statistics, and was clearly the worst fitting of all the models. Model 2, with the non-linear effect of time, had noticeably lower fit statistics than Model 1. Model 2 was therefore selected as the best-fitting model.
Model-predicted positive symptoms and emotional dysfunction scores from Model 2 are shown in Fig. 2 for the treatment and control groups separately. There is a noticeable ‘smoothing’ of the profile of the scores when compared with the observed scores in Fig. 1. This is most evident in the emotional dysfunction scores of the control group, where the initial dip over the first three study months and subsequent rebound are flattened by the model somewhat. However, overall, the summed profiles seem well reproduced by the model.
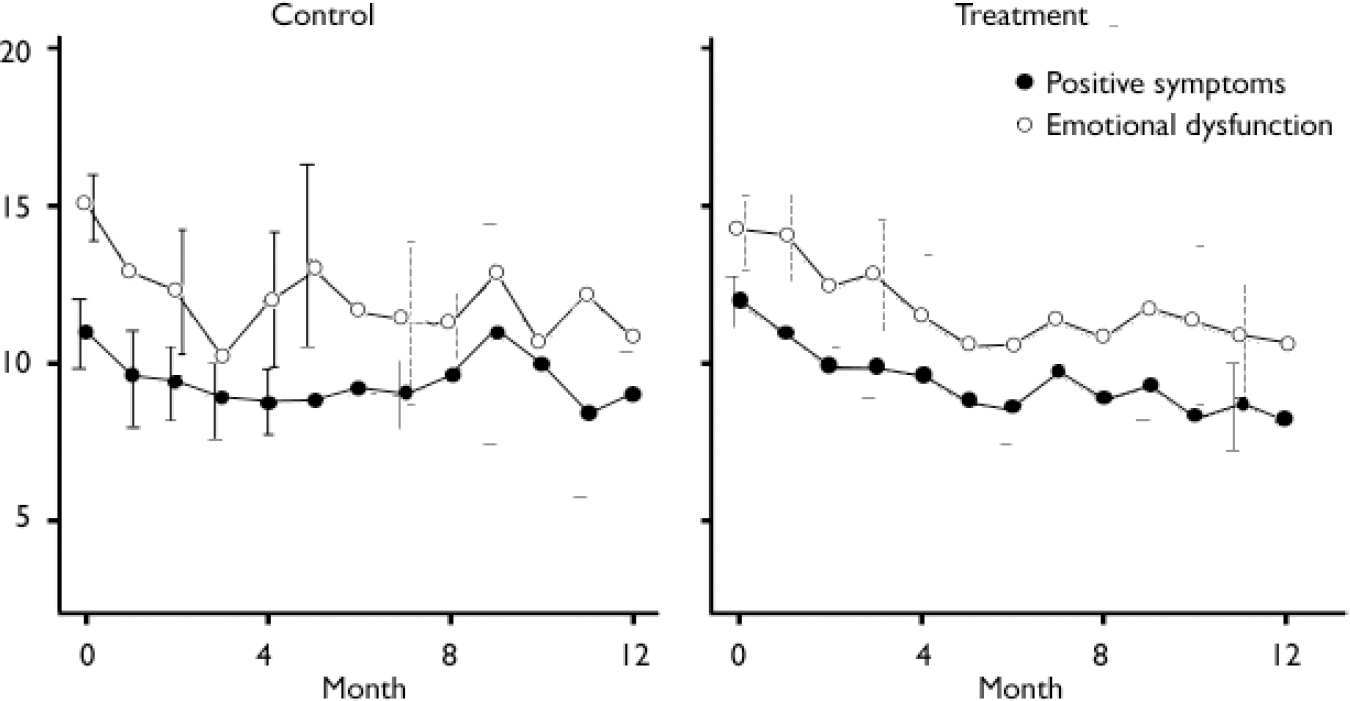
Fig. 1 Observed mean scores for positive symptoms and emotional dysfunction (bars represent 95% CI).
The estimated model parameters for Model 2 are shown in Tables 2, 3, 4.
Table 2 Estimated parameters for Model 2 — log transformation of month1

| Fixed effects | Positive symptoms | Emotional dysfunction | ||
|---|---|---|---|---|
| B | s.e. | B | s.e. | |
| At baseline | ||||
| Intercept | 11.06 | 1.15 | 15.28 | 1.62 |
| Male gender | 1.12 | 0.73 | -0.54 | 1.04 |
| Age | -0.11 | 0.07 | 0.11 | 0.10 |
| History | -0.03 | 1.04 | -0.88 | 1.47 |
| Treatment | 1.31 | 0.68 | -0.14 | 0.96 |
| Over time | ||||
| Logmonth | -1.47 | 0.56 | -2.21 | 0.79 |
| Logmonth*male | -0.60 | 0.36 | 0.19 | 0.50 |
| Logmonth*age | 0.07 | 0.03 | 0.04 | 0.05 |
| Logmonth*history | 0.40 | 0.51 | 0.51 | 0.72 |
| Logmonth*treatment | -1.00 | 0.33 | -0.33 | 0.47 |
Table 3 Level 2 random effects covariance matrix1,2

| Intercept | Slope | |||
|---|---|---|---|---|
| Positive symptoms Estimate (s.e.) | Emotional dysfunction Estimate (s.e.) | Positive symptoms Estimate (s.e.) | Emotional dysfunction Estimate (s.e.) | |
| Intercept | ||||
| Positive symptoms | 3.69 (1.09) | |||
| Emotional dysfunction | 0.65 (1.10) | 7.22 (2.11) | ||
| Slope | ||||
| Positive symptoms | -0.51 (0.41) | 0.45 (0.51) | 0.59 (0.24) | |
| Emotional dysfunction | 0.12 (0.50) | -1.31 (0.82) | 0.32 (0.25) | 1.12 (0.46) |
Table 4 Level 1 residual covariance of positive symptoms and emotional dysfunction12

| Positive symptoms | Emotional dysfunction | |
|---|---|---|
| Positive symptoms | 3.08 (0.24) | |
| Emotional dysfunction | 1.31 (0.27) | 6.42 (0.51) |
Table 2 shows the effects of the fixed effects. The intercepts represent the predicted value of the dependent variables when the explanatory variables are zero. Here, this equated to the score at initial assessment (i.e. month=0) for a female participant (male=0) of 22.15 years (i.e. mean-centred age=0) with no family history of psychosis and who had been assigned to the control condition (i.e. Treatment=0). None of the main effects of male gender, age, history or treatment were significant for either positive symptoms or emotional dysfunction (i.e. there were no significant differences at initial assessment).
Looking at the change in positive symptoms over time, there were significant effects of logmonth and logmonth*treatment. The effect of logmonth represents the slope of positive symptoms for the control group (i.e. when the treatment dummy variable is zero) and the effect of logmonth*treatment represents the difference in slopes when comparing the treatment and control groups. Both of these effects were significant and negative, indicating a reduction in positive symptoms over time. These slopes represent the change in positive symptom scores per unit change in the natural logarithm of the study month. The antilog of 1 is approximately 2.72, so approaching the end of the third study month the positive symptom scores in the control group had reduced on average by 1.47 points. By this time the positive symptom scores in the treatment group had reduced significantly more, on average by 2.47 (i.e. [–1.47]+[–1.00]).

Fig. 2 Predicted mean scores for positive symptoms and emotional dysfunction (bars represent 95% CI).
These effects were for the log-transformed month variable and were therefore non-linear over time, with improvement greater in the early months than in the later ones. The antilog of 2 is 7.39, so to double the reductions in positive symptom scores given above took well into the eighth study month. By the study end (month 12, logmonth 2.48) the mean of control participants' positive symptoms scores was 3.65 points lower than at the study beginning, whereas the average in the treatment group had reduced by 6.13.
There was an additional significant effect on the slope of the positive symptom scores, the effect of age. The slope of the positive symptom scores was significant and positive for older participants compared with younger ones, meaning that the reduction in positive symptoms was slower the older the participant. There was approximately 20 years difference between the youngest and oldest participants, which corresponded to a 20 × 0.07=1.4 point difference in the rate of reduction in positive symptom scores.
The rate of improvement for emotional dysfunction scores was even greater than for positive symptoms; by study end the control group mean had reduced by 5.48 points and the treatment group by 6.30. However, there was no significant difference between the slopes for the treatment and control groups.
Table 3 shows the variance/covariance matrix for the random effects. Although the fixed effects detailed above represent the scores for groups defined by the explanatory variables, the random effects represent the variation across individuals in scores around these means (i.e. unobserved heterogeneity at the person level). The variances of the intercept and slope parameters are shown on the main diagonal of Table 3. Both positive symptoms and emotional dysfunction random intercepts were significant, confirming the existence of substantial between-person variance at initial assessment not accounted for by the fixed effects. This unobserved heterogeneity was approximately twice as large for emotional dysfunction scores as for positive symptom scores (7.22 v. 3.69). There was also significant unobserved heterogeneity in the slope parameters, showing significant variability among individuals in the rate of improvement that was not accounted for by the fixed effects.
Looking at positive symptom scores in more detail, the square root of the random slope variance of 0.59 gives a standard deviation of 0.77, so there was a difference in slope of 1.54 scale points between individuals 1 s.d. above and 1 s.d. below the mean improvement rate of positive symptoms. To put this into perspective, the difference in slopes between average individuals in the control v. treatment groups was 1.00 points. So although there was a significant effect of cognitive therapy on the change in positive symptom scores, the magnitude of this effect was modest compared with the otherwise unexplained variation between individuals in improvement rate.
The off-diagonal elements of Table 3 show the covariances among the random effects, which represent the correlation in scores not accounted for by the fixed effects. Some of these covariances were quite large, for example the covariance of 0.32 between the positive symptoms and emotional dysfunction slope parameters represents a correlation of 0.40. However, the standard errors for these parameters were similarly large resulting in no significant correlations among the level 2 random effects.
In Table 4 the variance and covariance of the positive symptoms and emotional dysfunction level 1 residuals are shown. The variances on the diagonal are merely the errors in model prediction after accounting for all other fixed and random effects. As seen for the level 2 random effects, the emotional dysfunction level 1 residuals were twice as variable as the positive symptom residuals. As expected there was significant covariance between the measures (equating to a correlation of r=0.18), i.e. measurement occasions resulting in scores higher than expected on one measure tended to be associated with scores higher on the other measure also.
DISCUSSION
Main findings
The main finding was that positive symptoms of psychosis and emotional dysfunction (anxiety–depression) were correlated and both decreased significantly over the course of the study, with the rate of improvement more rapid in the early months than in the latter months. The reduction in positive symptoms, but not emotional dysfunction, was augmented by allocation to cognitive therapy. There was, however, significant between-person variation in improvement rate.
The general reduction in both positive symptoms and emotional dysfunction in both treated and untreated groups might have reflected the influence of regular contact afforded by the monthly assessment sessions, which was common to both groups. The PANSS assessment takes the form of a reasonably freely structured interview with the assessor and presented participants with the opportunity to talk about their feelings and experiences over the previous month. A more prosaic interpretation of the general improvement is that it reflected the operation of a ‘regression to the mean’ effect because of elevated symptom levels at the beginning of the study. After all, this was a help-seeking group who were considered to be at an elevated risk of psychosis. Many of the individuals in the study were experiencing frequent stressful incidents and the possibility of emerging psychosis is in itself likely to lead to high levels of emotional dysfunction.
Although there was general improvement for both groups, there was a significant beneficial effect of cognitive therapy on positive symptoms. The aim of cognitive therapy is to enable an individual to recognise how to identify potential trigger factors for symptoms and then recognise that the appraisal of these events shapes emotional and behavioural responses. The reduction in positive symptoms suggested that cognitive therapy was successful in enhancing recognition and appraisal factors (i.e. metacognitive skills), and is consistent with the view that cognitive therapy teaches a process to patients, analogous to helping them to become their own therapist.
The lack of an effect of cognitive therapy on emotional dysfunction might indicate that cognitive therapy was less successful in shaping emotional and behavioural responses, but might merely reflect the fact that positive symptoms were not the only anxiety-causing factors in the lives of the study participants. Many of the young people seen for the study were living in difficult circumstances, having problems with accommodation or relationships, and in many cases were experimenting with street drugs. In view of this it is perhaps not surprising that emotional dysfunction scores were higher overall, more volatile and less reliably responsive to therapy.
Core principles of the cognitive therapy approach are that therapy is problem-focused and time limited, and that over time the therapist becomes less active with the aim that the client is able to formulate their own problems and devise their own interventions. This approach is broadly supported by the better fit of the model with log-transformed time over the straightforward linear model, suggesting that generally speaking there are diminishing returns in terms of symptom reduction rate as therapy progresses. The general form of a diminishing exponential curve is that which would be expected from a learning-based process such as cognitive therapy.
The detrimental effect of increasing age on improvement of positive symptoms was unexpected. It is possible it might reflect effects related to duration of untreated illness, with prognosis being worse for those with longer untreated prodromes. Older participants were more likely, all other factors being equal, to have spent longer in this subclinical phase, suggesting that a longer prodromal phase might account for this finding.
Implications
The expected correlation between positive symptoms and emotional dysfunction was observed, consistent with models of psychosis that view these symptoms as interacting elements in a positive feedback loop (Reference Garety, Kuipers and FowlerGarety et al, 2001; Reference MorrisonMorrison, 2001). It has been suggested (Reference BirchwoodBirchwood, 2003) that distress from psychotic experiences and emotional disorders in first-episode psychosis might arise from three overlapping processes (those that are intrinsic to psychosis, those that are a psychological reaction to psychosis and patienthood, and those arising from problems in childhood and adolescence); our findings are consistent with this but more research is required to determine which of these processes are involved in the relationship between psychotic experiences and emotional dysfunction in a high-risk sample.
It was interesting to observe that the correlation between psychotic experiences and emotional dysfunction was seen at the occasion level (level 1) rather than the person level (level 2). This might have been an artefact of measurement volatility and the lower power of the model to detect level 2 effects (based on 57 individuals) compared with level 1 effects (based on 432 occasions). However, it also supports the importance of state rather than trait factors in symptom generation and, by implication, the development and maintenance of an at-risk mental state. This suggests that future longitudinal studies of the development of psychosis should measure relevant psychological state factors and also broader occasion-specific factors such as current concerns, life-events, etc.
Future studies
Further investigations into the longitudinal development of psychotic experiences should endeavour to use study designs and analysis methods that address the relative effects of person v. occasion factors and the causal interplay among symptoms and other time-varying factors. The former could be achieved using latent state-trait models (Reference Steyer, Ferring and SchmittSteyer et al, 1992) which decompose the latent trajectory into a stable individual component and a variable situational component. The latter can be addressed using models with lagged and cross-lagged responses, which would allow inferences to be drawn regarding the causal relationship between symptoms. Unfortunately, the abundance of missing data in this study precluded the reliable estimation of such models, but exploring these factors in future studies remains vital to extending theoretical insight and clinical practice.
Acknowledgements
We thank all of the EDIE (Early Detection and Intervention) study staff for their assistance with data collection and data entry.
This study was supported by research grants from the North West NHS R&D Executive and the Stanley Foundation.


eLetters
No eLetters have been published for this article.