Article Text

Abstract
Background The EQ-5D, a generic health status questionnaire that is widely used in health economic evaluation, was recently expanded to the EQ-5D-5L to address criticisms of unresponsiveness and ceiling effect.
Aims To describe the validity, responsiveness and minimum important difference of the EQ-5D-5L in COPD.
Methods Study 1: The validity of the EQ-5D-5L utility index and visual analogue scale (EQ-VAS) was compared with four established disease-specific health status questionnaires and other measures of disease severity in 616 stable outpatients with COPD. Study 2: The EQ-5D-5L utility index and EQ-VAS were measured in 324 patients with COPD before and after 8 weeks of pulmonary rehabilitation. Distribution and anchor-based approaches were used to estimate the minimum important difference.
Results There were moderate-to-strong correlations between utility index and EQ-VAS with disease-specific questionnaires (Pearson's r=0.47–0.72). A ceiling effect was seen in 7% and 2.6% of utility index and EQ-VAS. Utility index decreased (worsening health status) with indices of worsening disease severity. With rehabilitation, mean (95% CI) changes in utility index and EQ-VAS were 0.065 (0.047 to 0.083) and 8.6 (6.5 to 10.7), respectively, with standardised response means of 0.39 and 0.44. The mean (range) anchor estimates of the minimum important difference for utility index and EQ-VAS were 0.051 (0.037 to 0.063) and 6.9 (6.5 to 8.0), respectively.
Conclusions The EQ-5D-5L is a valid and responsive measure of health status in COPD and may provide useful additional cost-effectiveness data in clinical trials.
- Pulmonary Rehabilitation
- Health Economist
- COPD epidemiology
This is an Open Access article distributed in accordance with the Creative Commons Attribution Non Commercial (CC BY-NC 4.0) license, which permits others to distribute, remix, adapt, build upon this work non-commercially, and license their derivative works on different terms, provided the original work is properly cited and the use is non-commercial. See: http://creativecommons.org/licenses/by-nc/4.0/
Statistics from Altmetric.com
Key messages
What is the key question?
What is the validity, responsiveness and minimum important difference of the EQ-5D-5L, a generic health status questionnaire that is widely used in health economic evaluation, in patients with COPD?
What is the bottom line?
This is the first study to demonstrate that the EQ-5D-5L utility index and visual analogue score are valid and responsive in stable COPD and provides estimates of the minimum clinically important difference.
Why read on?
This data will help in the design of clinical intervention trials, particularly with regard to assessment of cost-effectiveness.
Introduction
The EQ-5D is a simple, generic health-related quality of life (HRQoL) instrument that is self-administered and is widely used as a patient-reported outcome measure. It comprises five health dimensions (mobility, self-care, usual activities, pain/discomfort and anxiety/depression): the most commonly used version of the questionnaire, the EQ-5D-3L, has three levels of severity for each dimension.1 The EQ-5D is widely used in health economic evaluation—a utility index (UI) can be calculated by applying ‘social tariffs’, which are used to estimate health benefits in terms of quality-adjusted life-years (QALYs). It is one of only a few measures recommended for use in cost-effectiveness analyses by the Washington Panel on Cost Effectiveness in Health & Medicine, while the United Kingdom National Institute for Health and Care Excellence has recommended the EQ-5D to be the preferred HRQoL instrument to generate QALYs.2
Other advantages for using generic instruments include the comparison of HRQoL across different diseases, and the potential for capturing aspects of HRQoL that may not be addressed by disease-specific questionnaires. For example, in patients with COPD, the EQ-5D may better reflect side effects of extrapulmonary manifestations such as cardiac comorbidity3 or sarcopenia.4
The EQ-5D-3L is simple and quick to use with high patient completion rates in general and COPD-specific populations,5 ,6 and has been reported in some trials of patients with COPD.7–9 However, investigators have questioned the ability of the EQ-5D-3L to differentiate small changes in health status, and therefore, it may be less responsive than disease-specific HRQoL questionnaires in COPD.6 ,10 Furthermore, the EQ-5D is well recognised to have a significant ceiling effect (ie, scores recording perfect health) in both general and disease-specific populations,6 ,11 leaving less room for improvement in response to an intervention.
To address these issues, the EQ-5D-5L was developed in 201112 with the levels of severity for each dimension increased to a choice of five, thus allowing the description of 3125 different health states, in comparison to the 243 health states possible in the EQ-5D-3L. However, studies examining the psychometric properties of the EQ-5D-5L are limited. Furthermore, previous studies have only estimated the UI of the EQ-5D-5L as a ‘crosswalk’ value by mapping to the EQ-5D-3L.13 Recently, the EQ-5D-5L value set for England, derived from 1000 individuals selected at random from the adult general population of England, was published, thus allowing the UI to be directly calculated.14 In addition to the UI, the EQ-5D-5L (like the 3L) includes a visual analogue scale (EQ-VAS).
The aim of the current study was to assess the validity of the EQ-5D-5L UI and EQ-VAS in a COPD-specific outpatient population by comparing with well-established disease-specific HRQoL questionnaires and other indices of disease severity. The responsiveness of the UI and EQ-VAS was also tested in a separate COPD cohort undergoing pulmonary rehabilitation. Finally, the minimum important difference (MID)—the smallest change in score that patients perceive as beneficial or detrimental—of the UI and EQ-VAS were estimated using a range of anchor-based and distribution-based methods.
We hypothesised that (1) the EQ-5D-5L would correlate significantly with COPD-specific HRQoL questionnaires and be able to distinguish different levels of disease severity; (2) the EQ-5D-5L would improve with pulmonary rehabilitation; and (3) that change in EQ-5D-5L would correlate significantly with change in COPD-specific HRQoL questionnaires with pulmonary rehabilitation.
Methods
Participants
All participants had a diagnosis of COPD according to the global initiative for chronic obstructive lung disease (GOLD) criteria.15 This study was a secondary analysis of data from two cohorts of patients with COPD recruited in order to determine whether the presence of sarcopenia and frailty impacts upon prognosis in COPD.4
Study 1: validity of the EQ-5D-5L in outpatients with COPD
This was a cross-sectional cohort study that took place between April 2012 and October 2014. The EQ-5D-5L,12 COPD assessment test (CAT),16 St George's respiratory questionnaire (SGRQ),17 the self-report chronic respiratory questionnaire (CRQ)18 and the clinical COPD questionnaire (CCQ)19 were measured in 616 outpatients attending respiratory clinics at Harefield Hospital. Spirometry20 and the Medical Research Council Dyspnoea Scale (MRC)21 were also recorded. The age dyspnoea obstruction (ADO) index, a validated composite prognostic score in COPD22 and surrogate marker of disease severity, was calculated.22
Study 2: response of the EQ-5D-5L to pulmonary rehabilitation
Between August 2013 and October 2014, 400 participants were recruited from pulmonary rehabilitation clinics at Harefield Hospital to this prospective cohort study. Additional inclusion criteria were an ability to walk 5 m without assistance and no contraindication to aerobic exercise.
The EQ-5D-5L, CAT, SGRQ and CRQ were prospectively measured at baseline, and following an 8-week outpatient PR programme, comprising twice-weekly supervised exercise and education sessions.4 In addition to questionnaires, the incremental shuttle walk, the five-repetition sit-to-stand and the 4 m gait speed were measured to assess change in physical performance.23–25 Participants, blinded to the results of their postpulmonary rehabilitation assessments, rated their overall change in health status following rehabilitation using an adapted five-point global rating of change questionnaire26 ‘1: much better’; ‘2: a little better’; ‘3: no change’; ‘4: a little worse’ and ‘5: much worse’.
The EQ-5D-5L and disease-specific HRQoL questionnaires
The scoring of the EQ-5D-5L (UI and EQ-VAS) and the disease-specific questionnaires (CAT, SGRQ, CCQ and CRQ) are detailed in the online supplementary material. To summarise, the EQ-5D-5L comprises two components: the UI and the EQ-VAS. The UI is calculated from patient scoring of five dimensions (mobility, self-care, usual activities, pain/discomfort, anxiety/depression). For each dimension, participants are asked to mark between 1: ‘no problems’ to 5: ‘unable to/extreme problems’. The responses are combined to produce a five-digit number describing the participant's health status (ranging from 11111 to 55555). This is converted to a UI based on the EQ-5D-5L value set for England14 (see online supplementary figure S1). The UI ranges from −0.208 (worst possible health) to 1.000 (best possible health). For the EQ-VAS, participants are asked to record their self-rated health on a vertical VAS with the end points ‘The worst health you can imagine’ and ‘The best health you can imagine’ at the bottom (‘0’) and top of the scale (‘100’), respectively. Hence, an improvement in HRQoL is associated with an increase in UI and EQ-VAS.
Supplemental material
The CAT was reported as a single score (0–40), the SGRQ was reported as individual domain (symptoms, activity, impact) and total scores (0–100),17 and the CCQ was reported as individual domain (symptoms, function and mental) and total scores (0–6).19 For these three questionnaires, a higher score equates to worse HRQoL. The CRQ was expressed as individual domain (dyspnoea (5–35), fatigue (4–28), emotion (7–49), mastery (4–28)) and total summed scores (20–140), with higher scores equating to better HRQoL.18
Data analysis
Data analyses and graphs were produced using SPSS V.21 (IBM, USA) and Prism 5 (GraphPad, USA). Baseline characteristics were presented as mean (SD). Pearson's r correlation coefficients (where the null hypothesis=no correlation) were used to report associations between EQ-5D-5L and other questionnaires. UI and EQ-VAS were reported in groups stratified according to GOLD spirometric stage, MRC dyspnoea scale and the ADO index to assess the association with disease severity. One-way analysis of variance (ANOVA) was used for multiple group comparisons. As there were few patients in GOLD spirometric stage 1 or with MRC 1, GOLD spirometric stages 1 and 2, and MRC 1 and 2 were grouped together for the purposes of analysis. Changes in outcomes before and after PR were compared using paired t tests. Responsiveness was expressed as standardised response means (mean change/SD of change).
MID was estimated using distribution-based (half SD) and anchor-based methods (linear regression and receiver operating characteristic (ROC) plots).16 We calculated the mean (95% CI) change in UI and EQ-VAS in those reporting feeling ‘a little better’ with rehabilitation on the global rating of change questionnaire. Further details of the linear regression and ROC analysis are described in the online supplementary material.
Results
Study 1: validity of the EQ-5D-5L in outpatients with COPD
Complete EQ-5D-5L data were obtained in 616 of 625 patients approached. The study flow chart is shown in the online supplementary material. Baseline characteristics of the cohort are presented in table 1. Figure 1 shows the distribution of responses to the EQ-5D-5L descriptive system. The mobility and usual activities dimensions showed the greatest self-reported impairment with 58% and 53% of the cohort reporting at least moderate problems, respectively.
Baseline characteristics and Pearson's correlation coefficients with EQ-5D-5L utility index and EQ-VAS (n=616)
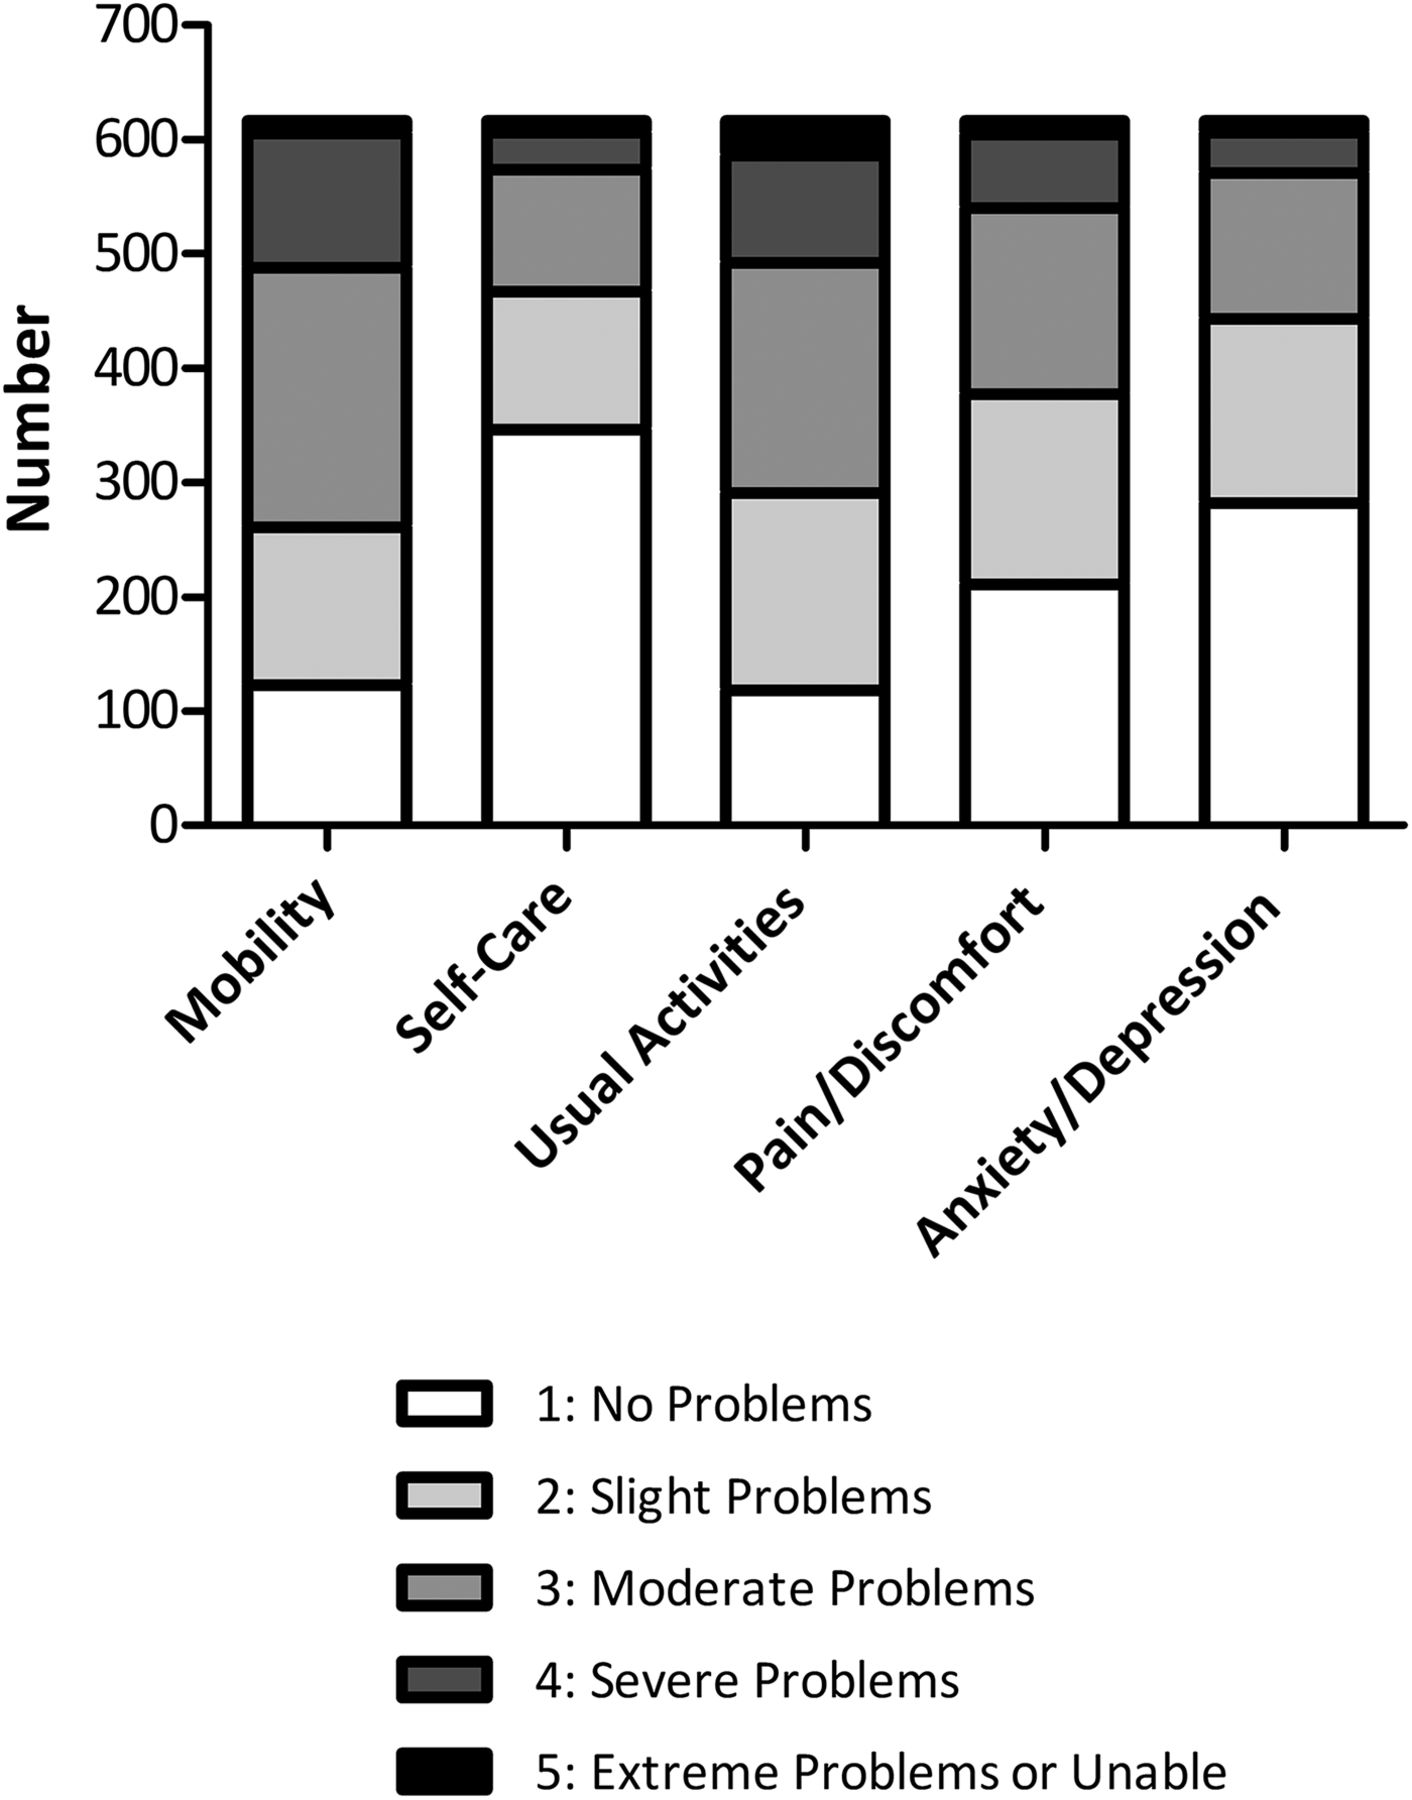
Distribution of responses to the descriptive system of the EQ-5D-5L, from which the utility index is derived.
Mean (SD) UI was 0.681 (0.236) and ranged from −0.160 to 1.000, with 43 patients (7%) describing perfect health and five patients with a negative UI (health state worse than death). Mean (SD) EQ-VAS was 60.95 (20.62). Sixteen patients (2.6%) reported an EQ-VAS of 100 (best possible health) and two patients reported an EQ-VAS of 0 (worst possible health).
Table 1 describes the relationships between UI and EQ-VAS with baseline characteristics and disease-specific HRQoL questionnaires. There were significant but weak correlations (r<0.2) between EQ-5D-5L variables and age, body mass index, FEV1 and smoking pack years. There were moderate-to-strong correlations between EQ-5D-5L variables and disease-specific HRQoL questionnaire total scores, with Pearson's r ranging from 0.47 to 0.72. In general, the correlations between disease-specific HRQoL questionnaires were stronger with the UI than with EQ-VAS (table 1). Figure 2 demonstrates the relationship between UI and EQ-VAS with CRQ total score.

Association between baseline EQ-5D-5L utility index (UI) and visual analogue scale (VAS) with chronic respiratory disease questionnaire (CRQ) total score. p Values all <0.001.
UI decreased (worsening HRQoL) with increasing GOLD stage (worsening FEV1) (ANOVA: p=0.004), increasing MRC (p<0.001) and increasing ADO index (p<0.001). EQ-VAS decreased (worsening HRQoL) with increasing GOLD stage (p=0.014), increasing MRC and ADO index (p both <0.001) (figure 3). On two group comparison, neither UI nor EQ-VAS was able to clearly differentiate between GOLD 1/2 from GOLD 3.
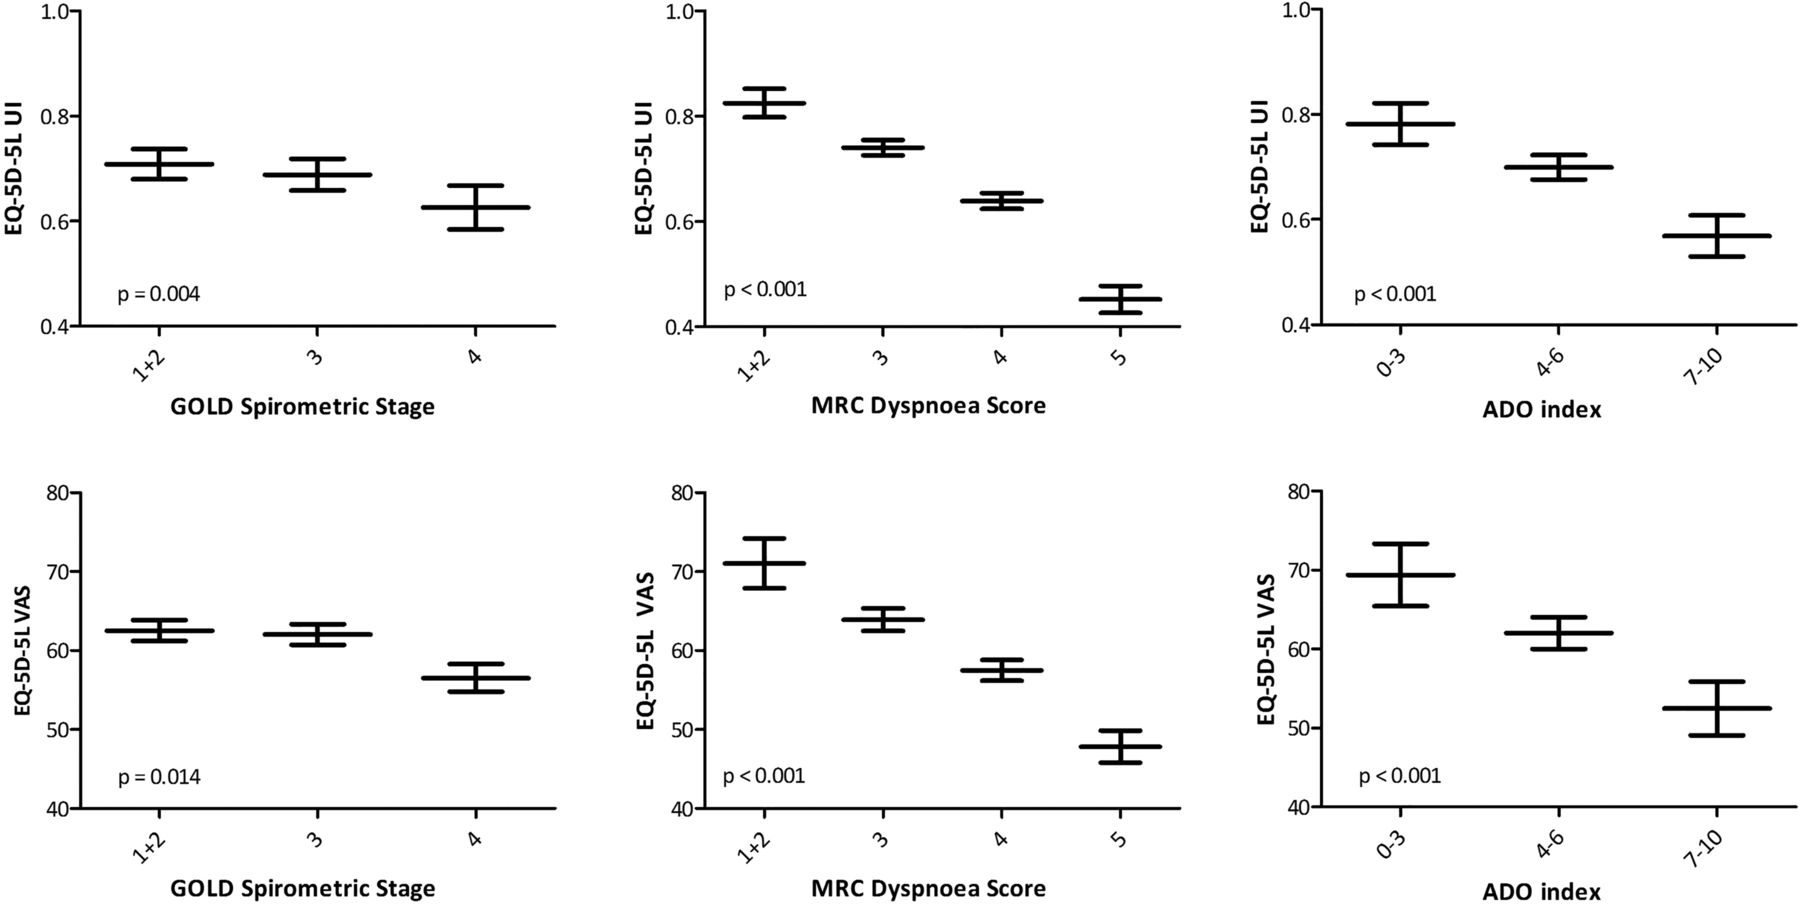
Mean (95% CIs) EQ-5D-5L utility index (UI) and visual analogue scale (VAS) stratified according to global initiative for chronic obstructive lung disease (GOLD) spirometric stages, Medical Research Council (MRC) dyspnoea score and age dyspnoea obstruction (ADO) Index. p Values derived from one-way analysis of variance.
Study 2
Response to pulmonary rehabilitation
Complete pre-EQ-5D-5L and post-EQ-5D-5L data were recorded in 324 of 400 patients (81% completion rate; see study flow chart in online supplementary material). As expected, all measures of physical performance and HRQoL improved with pulmonary rehabilitation (table 2). With regard to ceiling effect, 19 (6%) and 36 patients (11%) reported a UI of 1.00 before and after rehabilitation, while 10 (3%) and 14 (4%) patients reported an EQ-VAS score of 100 before and after rehabilitation. The distribution of responses to the descriptive system of the EQ-5D-5L are shown in figure 4. Standardised response means were 0.39 and 0.44 for UI and EQ-VAS, respectively. Standardised response means were 0.51, 0.52 and 0.76 for the CAT, SGRQ total score and CRQ total score, respectively, and 0.85, 0.73 and 0.62 for shuttle walk, gait speed and sit-to-stand, respectively.
Baseline characteristics and response to pulmonary rehabilitation (PR): n=324

Distribution of responses to the descriptive system of the EQ-5D-5L pre-pulmonary and post-pulmonary rehabilitation.
Estimation of the minimum important difference
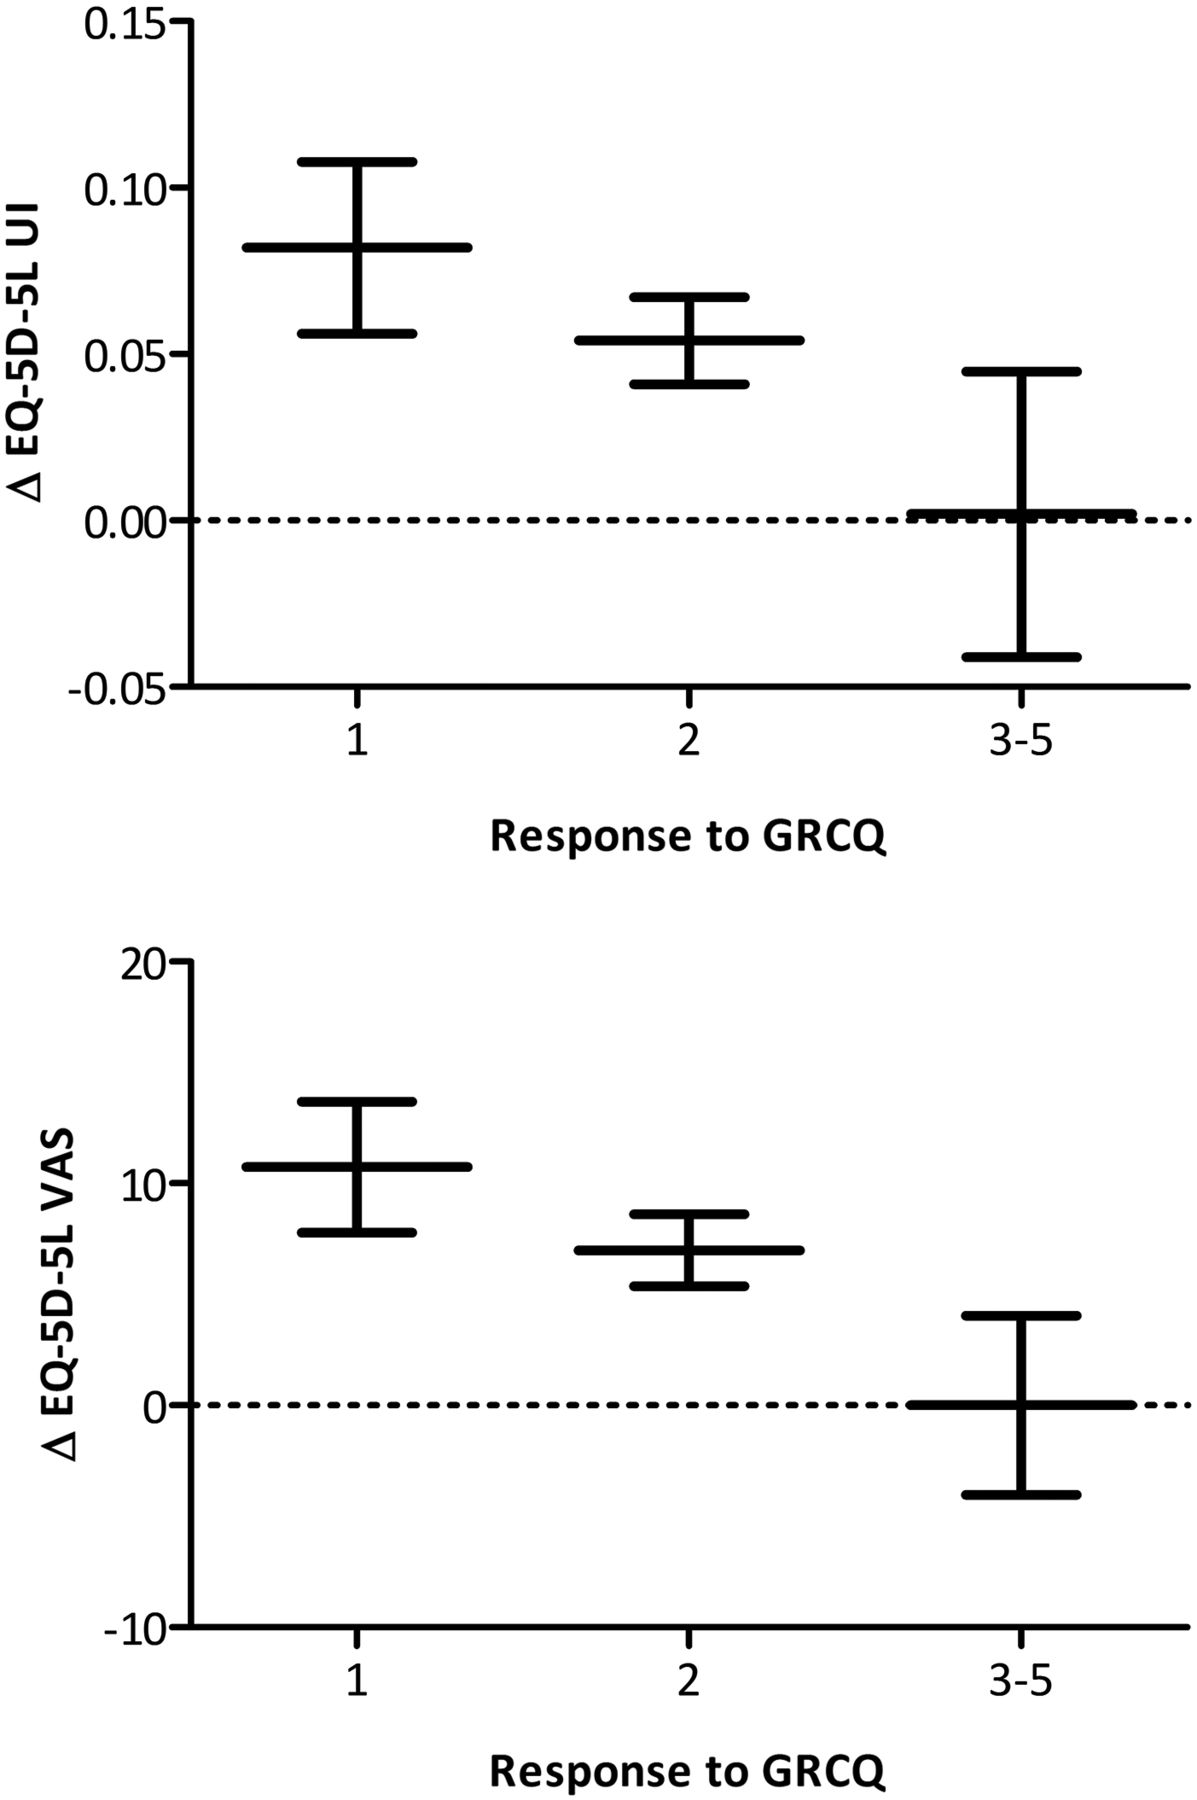
Using 0.5 SD, the distribution-based estimates for the MID of the UI and EQ-VAS were 0.109 and 10.1, respectively. Figure 5 demonstrates the mean (95% CI) changes in UI and EQ-VAS according to global rating of change questionnaire response. In total, 173 (53%) patients reported feeling much better, 124 (38%) patients reported feeling a little better, 20 (6%) patients reported no change and 7 (2%) reported feeling a little worse. No patient reported feeling ‘much worse’ following pulmonary rehabilitation. The mean (95% CI) changes in UI and EQ-VAS in those reporting feeling ‘a little better’ following rehabilitation were 0.054 (0.028 to 0.080) and 6.99 (3.78 to 10.20), respectively.

Mean (95% CIs) change (Δ) in EQ-5D-5L utility index (UI) and visual analogue scale (VAS) according to response to global rating of change questionnaire (GRCQ). 1=‘much better’; 2=‘a little better’; 3=‘the same’; 4=‘a little worse’; 5=‘much worse’. Responses 3–5 were combined due to small numbers—>90% reported feeling ‘much better’ or ‘a little better’ following pulmonary rehabilitation.
There were significant but weak-to-moderate correlations between change in UI and EQ-VAS with change in disease-specific HRQoL questionnaires (table 3). The slope, y-intercept and correlation coefficient between change in UI or EQ-VAS with change in other outcome measures are shown in the online supplementary material. The UI and VAS were not correlated with the CAT or SGRQ with a correlation coefficient >0.3.
Correlation coefficients of change in EQ-5D-5L utility index and EQ-VAS with pulmonary rehabilitation against external anchors
For change in UI, changes in CRQ-emotion, CRQ-mastery and CRQ total were associated with a correlation coefficient >0.3—these were subsequently used as anchors to estimate the MID for the UI. Using linear regression and the established MID for each anchor, estimates of the MID for UI ranged from 0.059 and 0.062. Using the same anchors, ROC plots identified estimates for the UI between 0.037 to 0.046 with C-statistic ranging from 0.66 to 0.72 (see tables 4 and 5).
Receiver operating characteristic curves to identify estimates of EQ-5D-5L that best identified achievement of the minimum important difference of the anchor, giving equal weighting to sensitivity and specificity
Anchor-based and distribution-based estimates of the minimum important difference (MID) of the EQ-5D-5L utility index and EQ-VAS
For change in EQ-VAS, changes in all CRQ domain and total scores were associated with a correlation coefficient >0.3 and were subsequently used as anchors. For EQ-VAS, linear regression estimates of the MID ranged from 6.5 to 8.0 and ROC consistently identified a cut-off of 6.5 with area under curve (AUC) ranging from 0.65 and 0.69 (tables 4 and 5).
All estimates of the MID for UI and EQ-VAS are outlined in table 5. Giving equal weighting to the anchor-derived estimates, the mean (range) estimates for the MID for UI and EQ-VAS were 0.051 (0.037–0.063) and 6.9 (6.5–8.0), respectively. If prioritising the global rating of change questionnaire, which measures patient assessment of improvement or decline directly, similar mean estimates for the UI and EQ-VAS were observed (0.054 and 6.99, respectively).
Discussion
This study is the first to demonstrate the validity of the EQ-5D-5L UI and EQ-VAS in patients with COPD by showing significant correlations with established disease-specific HRQoL questionnaires and an ability to differentiate between groups defined according to disease severity. Furthermore, we demonstrate that the EQ-5D-5L is responsive to change following pulmonary rehabilitation, and that change in EQ-5D-5L correlates significantly with change in disease-specific HRQoL measures. Furthermore, to our knowledge, this is the first study to prospectively and purposely estimate the MID for both the EQ-5D-5L directly calculated UI and EQ-VAS. Using anchors measuring similar construct, we estimated the minimum important improvement in UI and VAS to be approximately 0.05 and 7.0, respectively.
The generic format of the EQ-5D enables comparisons of health change to be made with other conditions. It has been used in national surveys to measure population-level health status, including the Health Survey for England, and is routinely used as a measure of organisational performance in delivering some common treatments in the UK.27 The breadth of dimensions included in the instrument enables comorbidities and adverse effects of treatment to be captured in a single measure. Furthermore, the availability of a utility value set enables its use in the cost-effectiveness analyses of treatments, which is accepted or recommended by several health technology assessment agencies.2 ,28 ,29
To our knowledge, this is the first study to directly calculate values for the UI, following the recent publication of the EQ-5D-5L Value Set for England.14 Previous studies have only estimated the UI by using a Crosswalk Index Value Calculator that maps scores from the 5L to the 3L.11 An example in the COPD literature is the study from Lin and colleagues.30 Convergent validation was against the PROMIS-43 short-form questionnaire, which itself has not been well validated in COPD.30
Our analysis of the psychometric properties of the UI, derived from the Value Set for England, is likely to be of interest to investigators using the EQ-5D-5L in both patients with COPD and other populations. Our results were based on large sample sizes (616 patients for the assessment of validity, 324 patients for the assessment of responsiveness and MID). High response rates were achieved, with a 99% questionnaire completion rate in study 1 and 81% completion rate in the longitudinal study 2 (completion at both time points). We also used multiple well-established, validated disease-specific HRQoL measures, including the SGRQ, CRQ, CCQ and CAT. The findings for EQ-5D-5L were robust to the choice of comparator measure, providing some internal corroboration of our findings.
Previous studies relating to the psychometric properties of the three-level version of the EQ-5D in COPD have had mixed conclusions. Pickard et al31 identified 12 relevant studies and concluded that EQ-5D-3L was a reliable (test–retest) and valid measure of health status in people with COPD; however, they noted limited ability of EQ-5D-3L to differentiate between milder stages of disease defined using the GOLD criteria—a similar finding for the EQ-5D-5L was observed in our study. Although this may be construed as a weakness of the questionnaire, it is well recognised that the relationship between FEV1 and HRQoL is poor in COPD.32 Furthermore, in our study, both UI and EQ-VAS were able to differentiate categories of other validated measures of disease severity, including the MRC Dyspnoea Scale and the composite ADO index (figure 3). Petrillo et al33 demonstrated ceiling effects with 13% of all patients reporting no problems in all dimensions at discharge from hospital despite patients having severe or very severe COPD. In a previous study of severe or very severe patients with COPD undergoing pulmonary rehabilitation, Ringbaek et al observed that 12.7% reported ‘perfect’ health at baseline, increasing to 17.9% after rehabilitation. In contrast, despite our study cohort having milder spirometric abnormality, we observed a lower prevalence of ceiling effect. Also, 7% of study 1 and 6% (pre-rehabilitation) and 11% (post-rehabilitation) reported perfect health following. This provides evidence that the 5-level EQ-5D has a smaller ceiling effect than the three-level questionnaire in patients with COPD.
The responsiveness of the EQ-5D-3L has been reported previously.6 ,34 ,35 Ringbaek et al6 demonstrated that the 3L UI improved significantly with rehabilitation, but was less responsive than SGRQ or endurance shuttle walk time. The EQ-VAS showed no significant improvement with rehabilitation. In contrast, our study showed larger changes in 5L UI and EQ-VAS both in absolute terms and in terms of standardised response means. This could be accounted for by differences in the intervention or population, but could also reflect increased responsiveness of the EQ-5D-5L questionnaire. However, we still found the responsiveness of the EQ-5D-5L to be lower than the disease-specific HRQoL questionnaires or physical performance measures.
Our study is the first to report the MID of the EQ-5D-5L UI. Walters and Brazier have previously reported estimates for the three-level version of the EQ-5D from eight longitudinal studies in 11 patient groups, including COPD.35 Based on a 0.5 SD approach, they report estimates of MID of 0.12 and 0.15, which are similar but slightly higher than our results for EQ-5D-5L of 0.11. However, our anchor-based estimates of MID differed substantially from those previously reported. Mean changes in 3L UI for patients with COPD reporting their health to be ‘somewhat better’ were widely divergent at 0.013 and −0.128 in the study by Walters and Brazier,35 although this was based on a very small sample size (n=9), explaining the wide CIs (including negative values) and lack of precision.35 In comparison, the mean change in EQ-5D-5L UI in our study was a more congruent 0.054 for patients reporting feeling ‘a little better’ in our study.
Although the determination of the MID remains controversial with no firm consensus on methodology,16 our study used both distribution-based and anchor-based methods and provided 8 and 12 estimates of the MID for the UI and EQ-VAS, respectively (table 3). The anchor-based estimates were broadly consistent, although it was noted that the relationship between change in EQ-5D-5L and change in anchor questionnaires was only modest. The MID of the 5L EQ-VAS has only previously been estimated in a retrospective study that evaluated the response of the EQ-VAS to a 3-week inpatient rehabilitation programme. In contrast to our study, the authors only used a single anchor (a breathlessness score, rather than a HRQoL questionnaire).36 Using an ROC plot, the cut-off identified was 8, which is higher than the estimates generated in our study. This may reflect differences in the cohort populations, intervention and choice of anchor.
There were some limitations to this study. We did not explore test–retest reliability of the EQ-5D-5L, although this has been confirmed in non-COPD populations.37–39 The patients were recruited from secondary care or pulmonary rehabilitation clinics populated with symptomatic outpatients and so whether similar findings would be obtained in patients with milder (eg, in those managed exclusively in primary care setting) or more severe disease (eg, acutely hospitalised inpatients) is open to further study. In addition, participants completed the questionnaires in the clinic setting where health professionals were on hand to answer questions. It is possible that the extremely high response rates obtained here may not be replicated in studies using other modes of administration, for example, by post or online. Another limitation of the study is the lack of a gold standard measure of HRQoL with which to compare. However, we employed a range of measures of HRQoL and clinical indices in this study, all of which have been previously validated in patients with COPD. The overall results were robust to the choice of measure used, although the strongest relationships were observed for the ‘total’ scores of the COPD-specific measures that capture a variety of impacts on functioning and symptoms. Furthermore, although the EQ-5D-5L was validated against a variety of measures, the predictive ability of this questionnaire was not explored. Future longitudinal studies would be of interest as there is a paucity of information on this topic.
In summary, our findings demonstrate that the EQ-5D-5L is a valid and responsive measure of HRQoL in people with COPD. Although some ceiling effects and lack of responsiveness persist with the EQ-5D-5L, these appear to be reduced compared with results previously reported for the EQ-5D-3L.10 Given the importance of the EQ-5D-5L in health economic analyses, inclusion in clinical studies of COPD would provide useful additional cost-effectiveness data of interest to health technology agencies.
References
Footnotes
Contributors Concept and design of study: WDCM. Acquisition of data: CMN, JLC, SEJ and SSCK. Analysis of data: CMN, LL, JL, WDCM. Drafting of manuscript: CMN, LL, JL and WDCM. Revision of manuscript critically for important intellectual content and approval of final manuscript: all authors.
Funding This work was funded through a National Institute for Health Research (NIHR) Clinical Scientist award (CS/7/007), NIHR Clinical Trials Fellowship (NIHR-CTF-01-12-04) and Medical Research Council (MRC) New Investigator Grant (G1002113) awarded to WD-CM.
Disclaimer The views expressed in this publication are those of the authors and not necessarily those of the NHS, the NIHR nor the Department of Health.
Competing interests CMN is funded by a NIHR Doctoral Research Fellowship (DRF-2014-07-089). JLC and SEJ are funded by the NIHR Respiratory Biomedical Research Unit, Royal Brompton & Harefield NHS Foundation Trust and Imperial College. SSCK was funded by the MRC. WD-CM is part funded by the NIHR Collaboration for Leadership in Applied Health Research and Care (CLAHRC) for NW London.
Patient consent Obtained. Those with significant cognitive impairment or unable to read English were excluded.
Ethics approval London-Camberwell St. Giles Research Ethics Committee.
Provenance and peer review Not commissioned; externally peer reviewed.