Article Text

Abstract
Objectives 67 runners participated in the Trans Europe FootRace 2009 (TEFR09), a 4487 km (2789 mi) multistage ultra-marathon covering the south of Europe (Bari, Italy) to the North Cape. Reports on ultra-marathons are lacking, but the literature reports overuse injuries in athletes, especially to the Achilles tendon (AT), ankle or hind foot. Bone oedema may be related to exposure and is present in fatigue fractures. Therefore, the aim of this study was to determine prospectively if sustained maximal load during an ultra-marathon leads to damage to the foot.
Design and participants In a cohort study, repeated scanning of the 22 athletes participating in the study was performed before and during (approximately every 1000 km) the race. Using the obtained fat saturated inversion recovery sequence, two experienced readers blinded to the clinical data rated the images regarding foot lesions. Statistical analysis included regression analysis and computation of the inter-rater reliability.
Setting The TEFR09 course. MRI scanning was performed according to prearranged schedules for every participant, using a mobile 1.5 Tesla MRI unit on a trailer following the race.
Primary outcome measures MRI data such as AT diameter, bone or tendon lesions, subcutaneous, plantar fascia or intraosseous oedema.
Results The 22 study participants did not differ significantly from the total of the 67 TEFR09 runners regarding height, weight and age. The AT diameter increased significantly from 6.8 to 7.8 mm as did intraosseous signal, bone lesions and subcutaneous oedema. However, finishers differed only regarding plantar aponeurosis and subcutaneous oedema from participants aborting the TEFR09. Inter-rater reliability was 0.88–0.98.
Conclusion Under the extreme stress of the TEFR09, an increase of the AT diameter as well as bone signal are thought to be adaptive since only subcutaneous oedema and plantar fascia oedema were related to abortion of the race.
Trial registration number University of Ulm, Germany Ethics Committee Number 78/08-UBB/se.
This is an open-access article distributed under the terms of the Creative Commons Attribution Non-commercial License, which permits use, distribution, and reproduction in any medium, provided the original work is properly cited, the use is non commercial and is otherwise in compliance with the license. See: http://creativecommons.org/licenses/by-nc/2.0/ and http://creativecommons.org/licenses/by-nc/2.0/legalcode.
Statistics from Altmetric.com
Article summary
Article focus
A study on effects of ultra-marathon running, in this case, the multistage Trans Europe FootRace covering a distance of 4487 km from Bari (Italy) to the North Cape.
Observational cohort study using MRI to look for possible lesions to the foot.
Key messages
During sustained maximal load, AT diameter and bone MRI short τ inversion recovery signal (hinting at subtle oedema) increases. This is thought to be adaptive.
Subcutaneous oedema and plantar fascia signal were related to abortion of the race. These measurements seem to be related to relevant changes leading to discontinuation of the run.
No relevant new foot joint or tendon lesions were detected during the race over 4487 km.
Strengths and limitations of this study
Repeated measurement prospectively during the run was possible only because of the mobile MRI unit used for this research project.
The number of included runners (22) is high compared with other MRI-based studies but may have been too small to detect less frequent lesions.
Introduction
In 2009 (19 April–21 June), the Trans Europe FootRace 2009 (TEFR09) took place. It was the second European transcontinental multistage ultra-marathon race and covered the distance of 4487 km from the south of Italy (Bari) to the North Cape. A collective of 67 endurance runners with a mean age of 50.5 years (range 26–74 years) and consisting of 11 women and 56 men from 12 nations met the challenge. Their goal was to run the 4487 km in 64 days without any day rest. Thus, they expected to complete an average distance of 70.1 km respectively 1.7 marathon distances (min 44 km, max 95.1 km) on every stage for 64 consecutive days.1
The permanent overuse during such an ultra-marathon especially endangers ankle and foot. While reliable reports on ultra-marathon effects are lacking, the present literature describes overuse injuries2 3 in endurance sport and shows the Achilles tendon (AT) to be a structure of high risk because it is regularly injured in sports.4 5 Also, ankle and hind foot injuries are frequent among athletes,6 7 with visible bone oedema even in asymptomatic individuals increasing their exposure.8 Other reports show high rates of fatigue fractures in army recruits after exerting marches.9 10
To diagnose these sport-related injuries, MRI is the diagnostic procedure of choice.11–13 In most reports, MRI was performed with sagitally oriented fat saturated T2-weighted sequences.14
The present study with serial MRI before and during the run was performed under the hypothesis that long distance endurance runners are able to endure the race-associated injuries and the accompanying pain but will nevertheless show changes in AT and bones of the foot. We expected the changes to accumulate during the run. Also we expected that bone marrow oedema will increase during the run but decrease during pauses. Furthermore, we expected that participants aborting the race will have more severe lesions on MRI. Finally, we were looking for predictive parameters (risk factors) indicating failure to complete the run.
Participants and methods
Study participants
After approval of the local ethics committee and in accordance to the Declaration of Helsinki, the participants of the TEFR09 ultra-marathon were recruited for the MRI-based cohort study. The inclusion criterion for the ultra-marathon group obviously was participation in the event, and the exclusion criteria were contraindications against MRI. Since MRI scanning time and the athletes' time was limited, only a part of the examinations concerned the foot region. Of the 44 athletes consenting to participate in the MRI project, 22 were randomised into the foot study. Their data will be presented here.
MRI acquisition
For each measurement, both feet were scanned consecutively with a dedicated foot coil that was table fixed with a boot-like design and 8-channel coils. MRI data were acquired with a mobile 1.5 Tesla MR scanner (Magnetom Avanto mobile MRI 02.05, software version: Syngo MR B15; Siemens Ltd, Erlangen, Germany) on a MRI-trailer travelling with the runners on the TEFR09 from stage to stage, day by day.
The MRI measurements were planned in a schedule for each participant, assuring equal distribution of measurements at all time points.
Every participant was scanned at a baseline time point 1 prior to the run and roughly every 1000 km or directly after abortion of the run. Schedules were made for time point 2 (day 17–22 at km 1131–1487), time point 3 (day 29–35 at km 1985–2362), time point 4 (day 43–46 at km 2964–3161) and time point 5 (day 50–58 at km 3430–4037).
MRI sequences
The imaging sequence used in the reported study was a fat saturated short τ inversion recovery (STIR) sagittal sequence, resulting in a T2-weighted fat suppressed image with oedema or effusion showing as increased signal. Sequence parameters were: slice thickness of 2 mm, repetition time was 8490 ms, echo time 60 ms, inversion time 120 ms, flip angle 140°, echo train length 13, bandwidth 130 Hz/voxel, the matrix was 512×512 (interpolated from 358×358), field of view 300×300 mm and time of acquisition was 3 min 50 s for each side.
MRI data measurements
Two researchers (experienced radiologists WF and UHS) without access to clinical data independently assessed the data sets at picture archiving and communication system (PACS) workstations. All signal intensities (SIs) were measured in a region of interest covering a volume of 25 mm2.
The measurements closely resemble the technique published earlier.15
The following measurements (see also table 1) were made on the sagittal MRI images:
The greatest anteroposterior diameter of the AT and AT's SI at insertion. Also, SI at mid-tendon or at site of lesion, if a lesion is visible, and lesion distance from AT insertion were taken. The number of new lesions in comparison to the preceding examination was counted.
The SI in the calcaneus at AT insertion and at a normally innocuous area in the middle between most cranial point of the posterior talocalcaneal articular surface and the most caudal point of the lateral process of the calcaneus (see figure 1) was measured.
The highest intraosseous SI in any bone of the foot was taken.
The number of bone bruises/subchondral or osseous lesions was noted.
The SI of fascia plantaris was rated, taking note if there was oedema or effusion (yes/no).
Also a possible bursa retrocalcanearis >2 mm sagitally was noted (yes/no).
Any soft tissue SI indicative of fasciitis, peritendinitis, subcutaneous oedema (see figure 2) was noted (yes/no).
Measurements of MRI parameters and correlation with distance run

Measurements of MRI parameters on a sagittal short τ inversion recovery weighted MRI scan. (A) PF, the measurement in the plantar fascia; BE, bone oedema (in the medial cuneiform bone). Short and long arrows pointing to measurements in the Achilles tendon (AT). The short arrow points to an intratendinous lesion near the insertion, and the long arrow points to an innocuous area situated cranially. (B) The measurement of the normally innocuous region of the calcaneus is placed between the most cranial portion of the posterior talocalcaneal facet and the most caudal point of the lateral process of the calcaneus (see arrows and round measurement site).
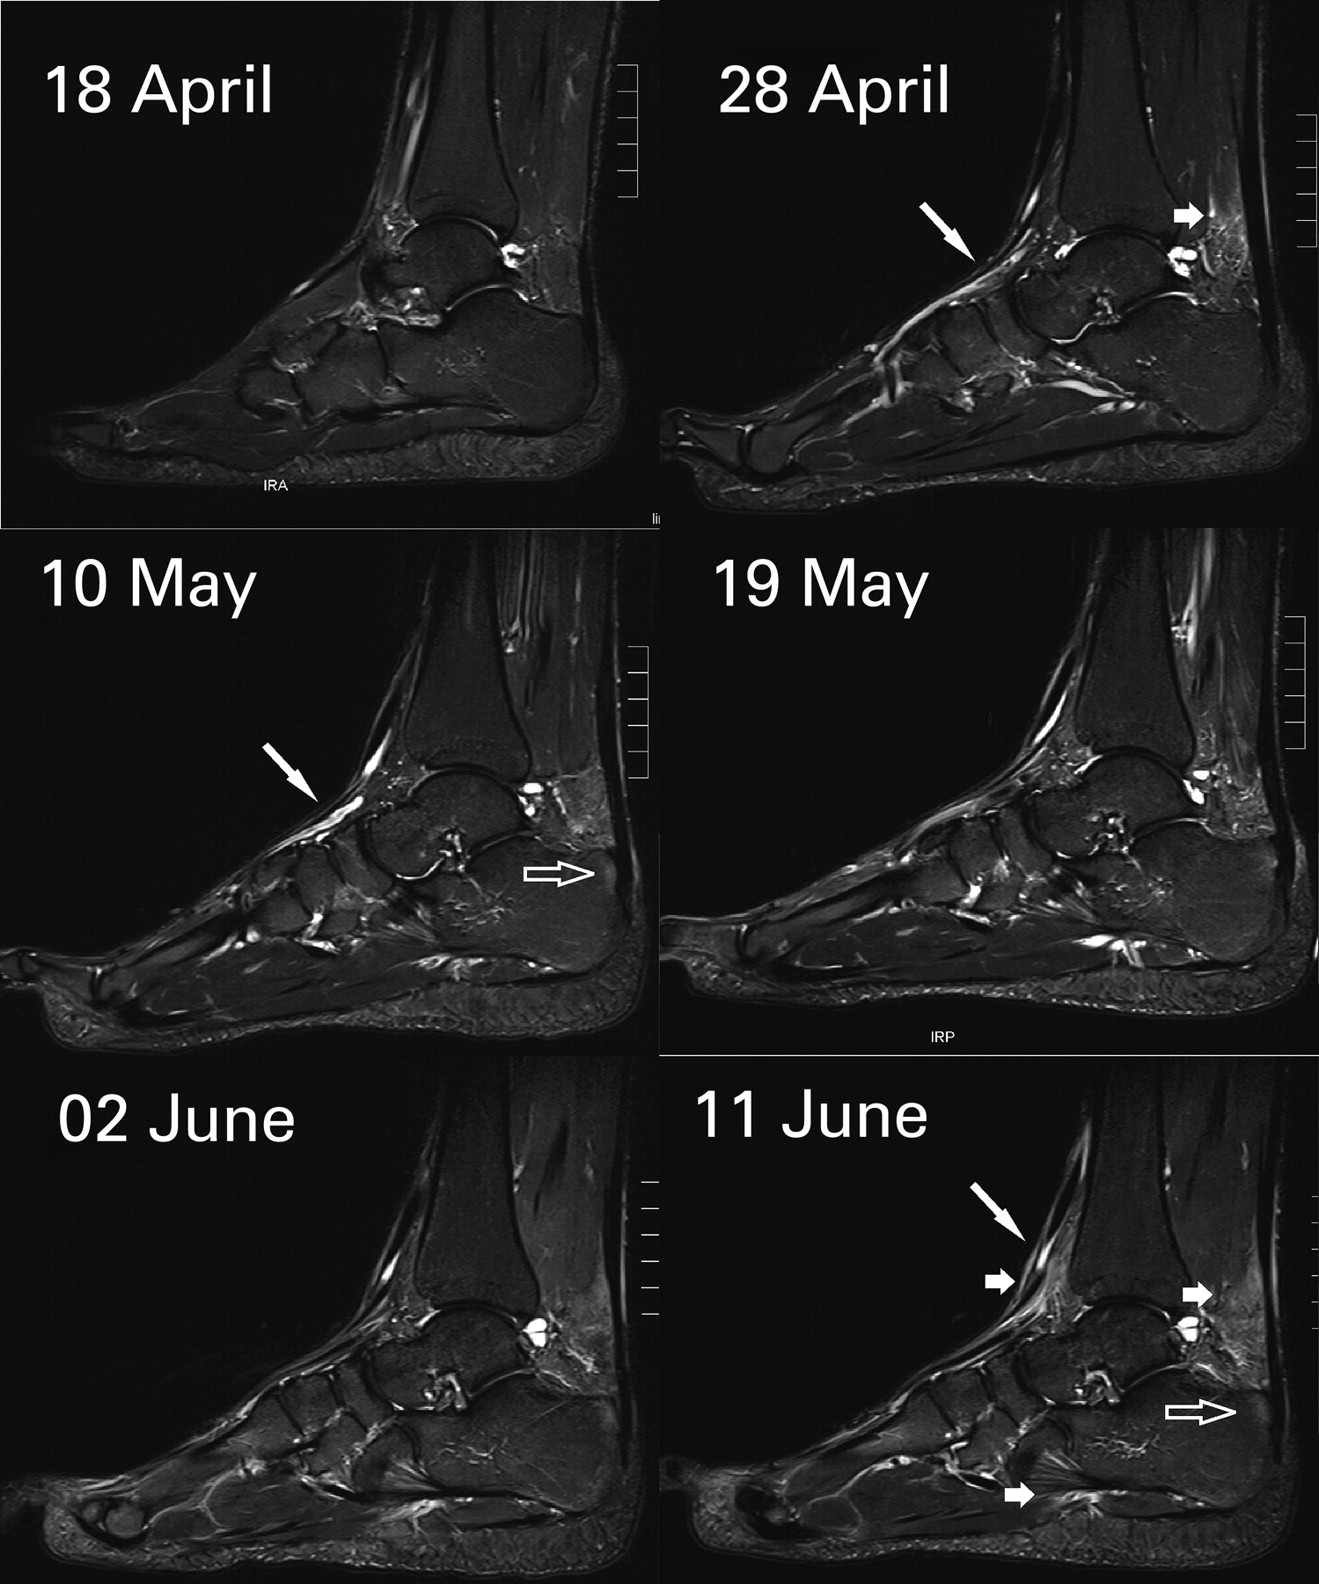
Subcutaneous oedema on a sagittal short τ inversion recovery weighted MRI scan. The six dates represent different MRI measurements of the same foot of one TEFR09 participant, each with identical window settings. The long diagonal arrow points to tubular high-intensity structures, probably corresponding to peritendinous fluid. The short arrow points to subcutaneous oedema and oedema in Kager's fat pad of the Achilles tendon (AT). The translucent arrow points to intraosseous signal near the AT insertion evolving later than the subcutaneous oedema.
Finisher status
To allow discrimination between runners finishing the race and others aborting, their status F (finisher) or NF (non-finisher) was recorded, also the stated cause (table 2).
Stated causes for abortion of the run in participating athletes
Time from finish stage to MRI
Since it was hypothesised that bone marrow oedema will increase during the run and decrease during rest (presumably lying down), the time from finish of the daily run to MRI scanning was recorded. For non-finishers, the time point has not been recorded because they stayed at some checkpoint until transportation. Therefore, their last resting period was guessed to start at noon.
Inter-rater reliability
Inter-rater reliability was calculated on two measurements where previous data15 had demonstrated good reliability: AT diameter and intraosseous SI of the calcaneus (this time at the clearly defined ‘innocuous’ location described above).
Statistical analysis
Data were analysed using R. V.2.11.1 (R Foundation for Statistical Computing, 2010).16 Given the longitudinal nature of the test data, specialised regression models (linear mixed-effect models) were applied. The package ‘nlme’ 17 was used.
Univariate and multivariate regression analyses were performed. Results were significant when p was <0.05.
Taking into account the critique of Bland and Altman18 concerning the correlation coefficient to calculate the inter-rater reliability, we decided to use λ as proposed by Jepsen et al.19 Lambda can be calculated as follows:
VAR denotes the variance of the measurements, and X and D the difference of the measurements of the two raters. The inter-rater reliability is rated as low for λ<0.25. Values up to 0.5 are rated as fair, 0.5–0.75 as moderate to good and λ>0.75 as good to excellent reliability.20
Results
Study participants
The TEFR09 runners comprised 56 men and 11 women, aged 26–74 years, with a mean age of 50.5 years and a SD of 10.5 years. They had a body height of 1.75 m (SD 0.08) and weight of 70.6 kg (SD 9.5).
Of the total, 22 participated in this experiment. Two were women and 20 were men, with a mean age of 49.1 years (SD 11.5) at the time of the first MRI scan. They were 1.74 m (0.09) tall and weighed 70.9 kg (11.3). The differences of the biometric markers of our sample to the whole group were not significant (t test, p=0.6–0.9).
Exemplary measurements are shown in figure 1. The evolution of soft tissue and osseous oedema is depicted in figure 2, and foot swelling as well as resulting shoe modifications are shown in figure 3.

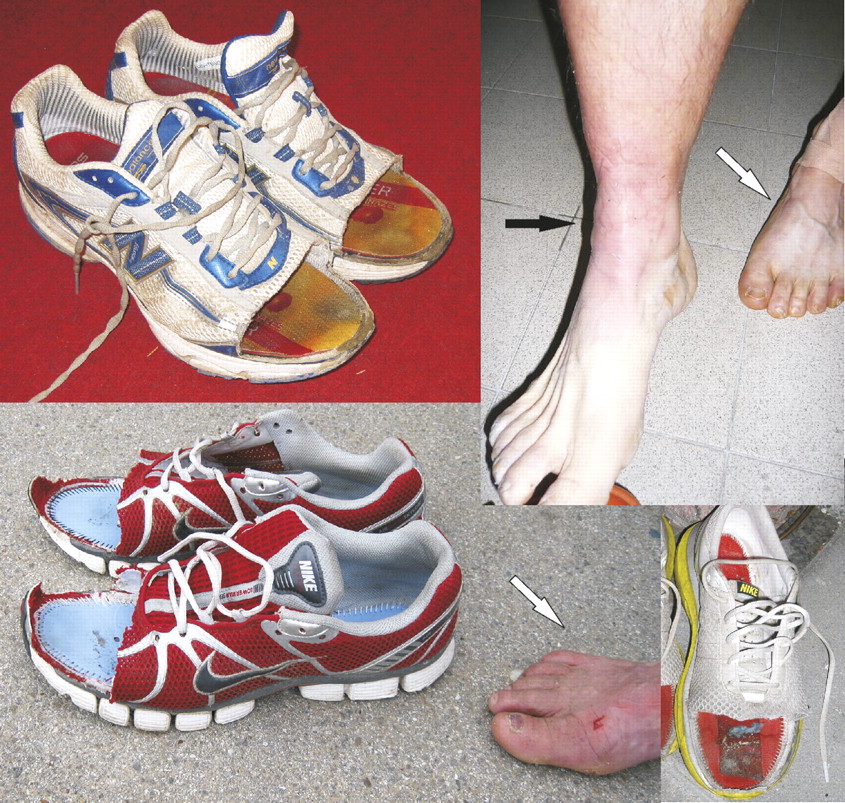
Makeshift sandals. Subcutaneous oedema resulting in ankle (black arrow) and foot swelling (white arrows) necessitated cutting away parts of the shoes, creating makeshift sandals to accommodate the athletes' feet.
MRI measurements
The predefined parameters were taken on the MRI examinations. The resulting measurements are detailed in table 1. The evolution of intraosseous SIs is depicted in figure 4.

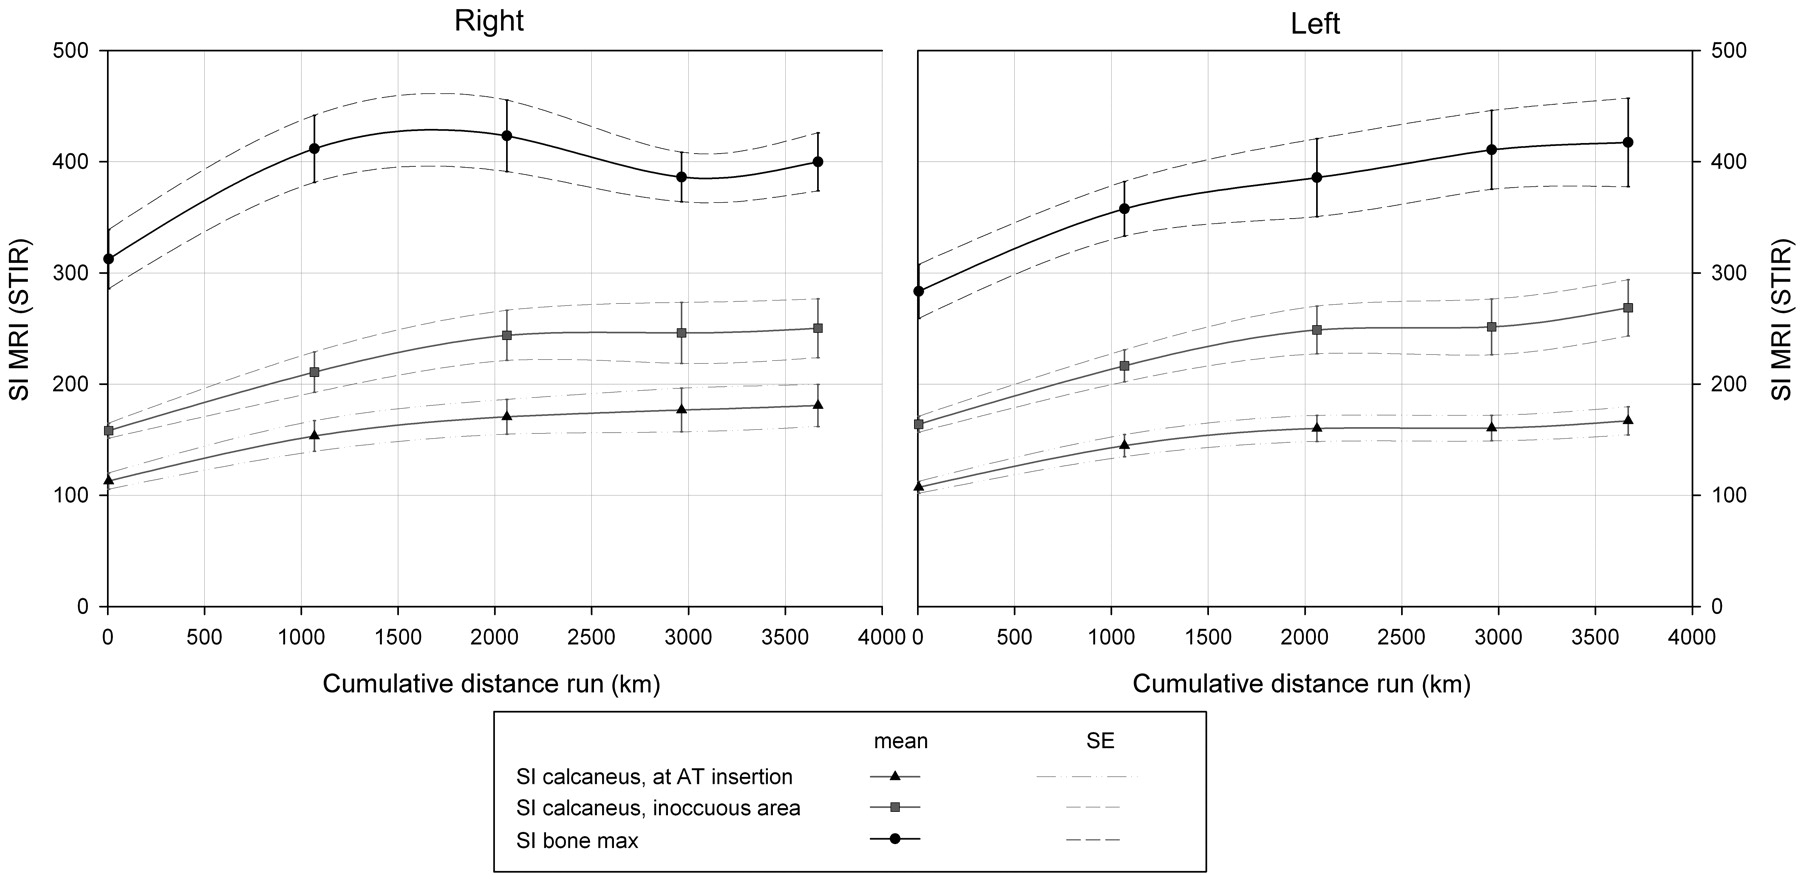
Intraosseous signal intensity (SI) in the time course of the TEFR09. SI measurements in the calcaneus at Achilles tendon (AT) insertion (black triangles), in a normally innocuous area of the calcaneus (grey squares) and at the individual's area of the highest intraosseous signal (black dots) are shown together with the SE values. The measurements were performed at several time points during the TEFR09. The cumulative distance run is shown below the graph. STIR, short τ inversion recovery.
Time from stage finish to MRI examination
There was no significant effect of the time elapsed between stage finish and scanning (ie, the length of the resting period before the scan, spent lying down and thus decreasing potential oedema) on the measured MRI parameters to be found in univariate and multivariate regression analyses.
Side differences
Looking for significant side differences in the observed measures, the following were found to be larger on the right side: SI of the AT at insertion (p=0.04), the number of bone lesions (0.002), the SI of the plantar aponeurosis (0.03). The distance to an AT lesion from the point of calcaneal insertion (p=0.04) was larger on the left side.
Differences between finishers and non-finishers
Of 67 runners, 21 athletes had to exit the race. Of the 22 participants in our study, 13 (59.1%) completed our study, while 12 finished the TEFR09 and 10 aborted the run. The athlete who finished our study (participation in the MRI at time point 5) but had to abort the race afterwards because of a hand phlegmonia has been counted as not aborting for our study since the cause for abortion was not related to a problem of the feet, and the measurements are thought to be independent of the later evolution of a hand phlegmonia.
The rate of abortion did not differ significantly between the total and our study participants. The stated causes are listed in table 2. Most of the problems occurred in the lower legs (shin splint and perimyositis).
F and NF showed significant differences at the beginning of the TEFR09 only in the SI of the plantar aponeurosis (p=0.03).
During the run, there were significant differences in the evolution of oedema of the right plantar aponeurosis (p=0.02) and subcutaneous oedema of the right (0.05) and left side (0.04), with NF showing higher rates of oedema.
Inter-rater reliability
The inter-rater reliability was calculated for the diameter of the AT as well as the SI of an innocuous region of the calcaneus. The λ values were for AT diameter of the right/left side 0.95/0.88 and for the SI of the normally innocuous region of the calcaneus on the right/left side 0.97/0.98, respectively.
Discussion
The TEFR09 participants had to endure an immense physical exposure, leading to stress fractures, swollen feet, sometimes necessitating cutting away part of the running shoe in order to continue running,1 but 46 out of 67 (68.7%) were able to finish. Our study participants showed changes during the run with an increase of the AT diameter and intraosseous SI as well as subcutaneous oedema. Non-finishers displayed higher rates of soft tissue oedema.
We had hypothesised that runners will show increasing pathology of hind foot and ankle as well as AT during the run even if they are able to finish the TEFR09.
The literature up to date had been inconclusive as to the consequences of marathon training, including our own data15 that had shown little changes in MRI appearance of the hind foot and AT during training and participation of a (half) marathon. However, the TEFR09 with extended running load over 64 stages without any day rest is not comparable to other sporting events or normal leisure activities.
The results show a gradual increase of the diameter of the AT from a mean of 6.8 to a mean of 7.8 mm over the course of the run. This stands in contrast to reports linking AT diameter to disease21 or showing decrease of AT diameter with training.22 However, the results match with previous data on runners23 and healthy marathoners15 or reports stressing the relevance of AT SI24 or calcaneus oedema at tendon insertion25 for pathology. No significant correlation could be shown to tendon SI or lesions or calcaneus bone oedema at tendon insertion, further strengthening the point that the observed AT changes seem to be adaptive.
Furthermore, gradual increases over the run in osseous signal of the calcaneus as well as the maximal intraosseous signal in any foot bone and the number of bone lesions could be shown (see figure 4).
The increased SI draws attention to reports on stress fractures,9 10 but the appearance of the recorded alterations in our study occurred early and did not coincide with stress fractures. Thus, the signal increase is thought to result from stress response12 as reported in asymptomatic runners.8 26–28 Sometimes diffuse bone oedema in nearly all end phalanges pointed to contusions because of tight shoes. However, bone oedema and lesions were not linked to abortion of the run (NF status).
Also, increases in subcutaneous oedema occurred over the course of the run (see figure 2). Here, subcutaneous oedema at the time of the start of TEFR09 was rare with around 5% (see table 1), while it rose sharply at time point 2 (after a mean of 1068 km) to approximately 65% and increased only moderately to approximately 70% at time point 5 (after a mean of 3669 km). This corresponds to the sometimes grotesque swelling of runners' feet, necessitating cutting of running shoes to resemble crude sandals (see figure 3).
Increase of leg volume and ankle oedema during prolonged exercise has been reported29 30 and has been attributed to endocrine dysregulation. However, recent studies postulate rather fluid overload as the source of the swellings,31 32 and total body water increase has been shown33 in long endurance athletes. Fluid intake had been shown to be positively correlated with the change of the volume of athletes' feet34; furthermore, it has been shown that the total body water has increased over the course of multistage runs.35 36 So it can be assumed that the subcutaneous oedema is caused at least partially by excessive water intake.
We had hypothesised that bone oedema and the corresponding SI would decrease during rest (lying down). However, our data showed no correlation of the resting time to the SI. So the observed bone oedema seems to reflect true load effects and not simple hydrostatic changes.
We had expected to see more severe lesions in NF than in F and had hoped to find risk factors or predictive parameters for NF. Here, significant differences could be shown only for soft tissue parameters: At the beginning of the TEFR09, only the SI of the left plantar aponeurosis was significantly higher in NF, pointing to possible overload even before the start. During the run, NF showed significantly more subcutaneous oedema and oedema of the (right) plantar aponeurosis. This may indicate that soft tissue oedema is more relevant to the possible abortion of the run than the intraosseous changes described above or tendon problems. Especially the signal alterations in the plantar aponeurosis point to plantar fasciitis, a problem thought to be the main cause of inferior heel pain in runners and is detected easily by MRI.37
Considering clinical data on abortion of the run (see table 2), the stated soft-tissue-related causes refer mainly to the legs (mostly shin splint and perimyositis). These regions were not included in the current investigation. However, it is probable that oedema related to shin splint or perimyositis had spread along the lower legs to the foot, so that the visible subcutaneous oedema was not directly related to a pathology in the foot.
With λ values between 0.88 and 0.98, the inter-rater reliability can be rated as excellent.20
Strengths, limitations and implications for future research
This is the first study in history to report results from close observation of multistage ultra-marathon athletes by mobile MRI. Therefore, it is the first study to report changes in the musculoskeletal system in multistage ultra-marathoners. The chance to observe an event like the TEFR09 with a mobile MRI scanner had been great, but the difficulties of tight schedules of the athletes prohibited greater numbers.
Poor infrastructure and difficult local situations at the stage destinations sometimes made a nearby commissioning of the mobile MRI impossible. However, the strongest influence forcing the staff to change and adapt their research work daily was the athlete himself, with his individual personality and more or less daily changing mental and physical condition and necessities: pain, injuries, fatigue, fears, doubts, illness, regeneration programme and nutrition plan.
The stated radiological findings like subcutaneous or intraosseous oedema are important. Lacking additional data, our study cannot prove the cause for it (workload, endocrine imbalance or fluid overload, as discussed above). Therefore, additional data like fluid intake, electrolyte content of plasma and urine as well as hormonal factors should be sampled in future studies.
The inclusion of 22 runners permitted detailed examinations, but the number may have been too small to detect factors distinguishing NF. However, the study sample of 22 athletes had been randomised out of all participants, their biometric data show that they are representative of the whole group of TEFR09 participants. So their results may be generalised.
Conclusions
During the TEFR09 and under extreme stress, adaptive changes like the increase of the AT diameter could be detected with MRI as well as signs of soft tissue overload with swelling and oedema. The meaning of the SI increase of the foot bones is thought to resemble a stress response but is not correlated with abortion of the race or development of stress fractures during the observed transcontinental multistage ultra-marathon.
References
Supplementary materials
Supplementary Data
This web only file has been produced by the BMJ Publishing Group from an electronic file supplied by the author(s) and has not been edited for content.
Files in this Data Supplement:
- Data supplement 1 - Online material
Footnotes
To cite: Freund W, Weber F, Billich C, et al. The foot in multistage ultra-marathon runners: experience in a cohort study of 22 participants of the Trans Europe Footrace Project with mobile MRI. BMJ Open 2012;2:e001118. doi:10.1136/bmjopen-2012-001118
Contributors WF designed the study, read the images and planned the statistical analysis. He wrote the manuscript and approved the final manuscript. UHS designed the study, acquired the MRI data, read the images and critically revised the manuscript and approved the final manuscript. FW designed and performed the statistical analysis. He wrote parts of the manuscript and approved the final manuscript. CB designed the study, acquired the MRI data and critically revised the manuscript and approved the final manuscript. Also, MRI scanning was performed by Heike Wiedelbach.
Funding This project was mainly supported by the German Research Association (DFG: ‘Deutsche Forschungsgemeinschaft’) under grants SCHU 2514/1-1 and SCHU 2514/1-2. Other non-public funds were received from Siemens Medical and the Medical Faculty of the University of Ulm. All funding was unrestricted. None of the funding bodies had any role in the study design, data collection, data analysis, data interpretation, manuscript preparation or decision to publish.
Competing interests None.
Ethics approval Ethics approval was provided by ethics committee of the University of Ulm, Germany.
Provenance and peer review Not commissioned; externally peer reviewed.
Data sharing statement No additional are data available.