Article Text

Abstract
Background Poor glycemic control early in the course of type 1 diabetes mellitus (T1DM) increases the risk for microvascular complications. However, predictors of deteriorating control after diagnosis have not been described, making it difficult to identify high-risk patients and proactively provide aggressive interventions.
Objective We examined whether diagnostic age, gender, and race were associated with deteriorating glycemic control during the first 5 years after diagnosis.
Participants 2218 pediatric patients with T1DM.
Methods We conducted a longitudinal cohort study of pediatric patients with T1DM from the Midwest USA, 1993–2009, evaluating within-patient glycated hemoglobin (HbA1c) trajectories constructed from all available HbA1c values within 5 years of diagnosis.
Results 52.6% of patients were male; 86.1% were non-Hispanic Caucasian. The mean diagnostic age was 9.0±4.1 years. The mean number of HbA1c values/year/participant was 2.4±0.9. HbA1c trajectories differed markedly across age groups, with older patients experiencing greater deterioration than their younger counterparts (p<0.001). HbA1c trajectories, stratified by age, varied markedly by race (p for race×diagnostic age <0.001). Non-Hispanic African-American patients experienced higher initial HbA1c (8.7% vs 7.6% (71.6 vs 59.6 mmol/mol); p<0.001), and greater deterioration in HbA1c than non-Hispanic Caucasian patients across diagnostic ages (rise of 2.04% vs 0.99% per year (22.3 vs 10.8 mmol/mol/year); p<0.0001).
Conclusions Older diagnostic age and black race are major risk factors for deterioration in glycemic control early in the course of T1DM. These findings can inform efforts to explore the reasons behind these differences and develop preventive interventions for high-risk patients.
- Type 1
- Adolescents / Children
- Age of Diabetes Onset
- Glycemic Control
This is an Open Access article distributed in accordance with the Creative Commons Attribution Non Commercial (CC BY-NC 4.0) license, which permits others to distribute, remix, adapt, build upon this work non-commercially, and license their derivative works on different terms, provided the original work is properly cited and the use is non-commercial. See: http://creativecommons.org/licenses/by-nc/4.0/
Statistics from Altmetric.com
Key messages
-
Among pediatric patients with type 1 diabetes, older age at diagnosis predicts deterioration in glycemic control during the first 5 years after diagnosis of type 1 diabetes. Trajectories of glycemic control have not changed across different treatment eras, despite the introduction of new treatment technologies.
-
Deterioration in glycemic control can be detected before age 11.
-
Non-Hispanic black children with type 1 diabetes experience significantly greater deterioration over time than non-Hispanic white children.
Introduction
Poor glycemic control in children and adolescents with type 1 diabetes mellitus (T1DM) is common1 ,2 and associated with increased risk for microvascular complications.3 ,4 While many children experience deteriorating glycemic control after the initial diagnosis, factors that influence trajectories of glycemic control among children and adolescents remain poorly understood. The few studies that have examined predictors of future glycemic control in pediatric patients with T1DM have been limited by the small sample size,5–10 a focus on trajectories of glycemic control in older children (>age 9) and adolescents,5–7 ,11–13 and inclusion of only a limited number of demographic variables.5–8 ,13 These limitations have made it difficult to identify a ‘risk signature’ that can predict future deterioration in glycemic control among youths.
Evidence suggests that poor control early in the course of disease exerts long-lasting effects on the risk for diabetes-related complications (ie, the metabolic memory hypothesis).14–16 Therefore, identifying patients at high risk for poor glycemic control is important in order to proactively tailor aggressive interventions, such as insulin pumps and disease management, and prevent deterioration in glycemic control. Unfortunately, healthcare providers currently lack the tools to identify patients at high risk for deteriorating glycemic control, making it difficult to provide preventative care and avert a decline in diabetes control.
To address this important gap in knowledge, we assembled a large longitudinal database of T1DM care from June 1, 1993 to June 1, 2009 at a single large US tertiary care hospital. We then sought to identify demographic characteristics (age at diagnosis, gender, and race) associated with worsening glycemic control during the first 5 years after diagnosis of T1DM.
Methods
Data source
Data were extracted from the Children's Mercy Hospital Type 1 diabetes in Pediatrics database (CMH T1P database), which contains demographic, clinical, and laboratory data extracted from the electronic health records of patients with T1DM seen at CMH (Kansas City, Missouri, USA) and nine rural outreach locations since June 1, 1993.
Inclusion/exclusion criteria for data source
The primary criterion for inclusion in the T1P database was a verifiable diagnosis of T1DM. First, individuals with presumed T1DM were identified by an informatics query of billing records (N=4095). Next, study personnel reviewed the most recent diabetes clinic documentation to confirm the clinical diagnosis of T1DM and to evaluate for additional medical conditions. Patients were considered to have T1DM based on the diagnosis noted by the provider in the record. Overall, 583 patients did not have a verifiable diagnosis of T1DM (N=3512 included).
Exclusion criteria for the CMH T1P database included (1) diagnosis of type 2 diabetes mellitus, confirmed monogenic diabetes, cystic fibrosis-related diabetes, or iatrogenic diabetes; (2) chronic medical conditions that might result in a major change in glycemia (eg, systemic steroid treatment) or measurement of glycated hemoglobin (HbA1c; eg, chronic anemia or hemoglobinopathy); and (3) the presence of chromosomal or other genetic disorders (other than Down syndrome or Turner syndrome). In total, 89 individuals were excluded by these criteria, leaving 3423 individuals in the T1P database.
Data collection for data source and study cohort
To create the T1P database, HbA1c data, race, and gender self-reported by the family were obtained by an informatics query of the electronic health record (EHR). Race was specified in the EHR as white, black or African American, Asian, American Indian or Alaska Native, Native Hawaiian or Pacific Islander, Multi-racial, or Other. Ethnicity was specified as Hispanic or non-Hispanic. Age at onset of T1DM was obtained by trained study personnel via chart review. When the date of diagnosis was not clearly documented, study personnel defined the diagnosis date as the date after which three criteria were met: (A) initiation of insulin therapy was documented, (B) HbA1c was screened and reported to be >6%, and (C) serum autoantibodies (anti-GAD, ICA512/IA2, and/or insulin autoantibodies) screened positive for T1DM. Patients not meeting the above criteria were considered to have an unknown date of diagnosis. After selection of the final cohort included for the T1P database, a random sample of 100 charts was reviewed to ensure accuracy of all extracted data, which revealed 100% accuracy. For the present study, patients were excluded if the date of T1DM onset was unknown (n=425), or if patients had either of the following: no HbA1c during the first 3 months (n=378) or no HbA1c during months 4–12 after diagnosis (n=402). In total, 2218 participants were evaluable by these criteria; 29 239 HbA1c assessments were available in total (figure 1). In order to ensure that only data representing near-complete HbA1c trajectory curves were included in this analysis, all HbA1c values recorded for a particular patient after a monitoring gap of >12 months were excluded from the present analysis (ie, the patients were included, but data after the monitoring gap were excluded). This criterion led to the exclusion of only 1135 HbA1c values (2%).

Flow diagram of patients meeting inclusion/exclusion criteria for the present analysis (CMH, Children's Mercy Hospital; DM, diabetes mellitus; T1D, type 1 diabetes; HbA1c, glycated hemoglobin).
Variable definitions
Independent variables included patient age at diagnosis, race, gender, and diagnostic era. Age at diagnosis was also treated as a categorical variable and stratified into the following groups: 0–4, 5–9, and ≥10 years. Diagnosis era was also defined as a categorical variable, using the following strata: pre-2000, 2000–2003, and 2004–2009, to coincide with the diabetes center's evolving policy to use split-regimen dosing, multiple daily injections, or continuous subcutaneous insulin infusion, respectively, as first-line therapy.
The dependent variable was the HbA1c trajectory over the 5-year period after diagnosis. The trajectory of intraparticipant HbA1c values for each age group was constructed using third order polynomials and utilizing all available HbA1c values obtained more than 1 month following initiation of insulin therapy. HbA1c during the study period was measured in the CMH endocrine laboratory using methodologies that evolved from 1993 to 2009. Initially, the Quik Sep manual ion exchange column was utilized, followed by the introduction of the BioRad diaStat (HPLC) in 1999, the BioRad Variant II (HPLC) in 2001, the Primus PDQ (Boronate Affinity) in 2004, and the Tosoh G8 (HPLC) in 2008. The point-of-care In2it (Boronate Affinity) was introduced in 2009 as an adjunct method of measurement (contemporary with the Tosh G8 HPLC) at certain CMH clinic locations geographically separated from the endocrinology laboratory at CMH. All instruments used from 1999 onward were certified by the National Glycohemoglobin Standardization Program (NGSP) as having documented traceability to the Diabetes Control and Complications Trial (DCCT) Reference Method.
Statistical analysis
Baseline characteristics were compared across the diagnostic age categories. Categorical variables were examined as frequencies and compared using χ2 or Fisher's exact test. Continuous variables were examined as means (±SDs) and compared using one-way analysis of variance. The p<0.05 was defined as the limit of statistical significance. Results are reported as means (±SDs) or mean (upper, lower 95% confidence limits) unless otherwise specified.
Within-patient HbA1c trajectories were modeled using hierarchical linear models, including a random intercept by patients and fixed linear and polynomial coefficients. Mean trajectories were estimated within prespecified patient subgroups. Trajectories were statistically compared using multiple-DF likelihood ratio tests, jointly testing all four cubic polynomial terms, and trajectory shapes were compared by jointly testing the linear, quadratic, and cubic terms. After examining HbA1c trajectories, we noted an inflection point at approximately 1.5 years postdiagnosis. Post hoc analysis was performed to characterize the HbA1c rate of rise over time (HbA1c slope) during the first 1.5 years after diagnosis. Intraparticipant HbA1c slope was determined using linear regression and utilizing all available HbA1c values during the first 1.5 years postdiagnosis, with the exception of HbA1c values obtained prior to initiation of insulin therapy (ie, at or preceding diagnosis).
We next performed a series of stratified analyses to determine whether HbA1c trajectories differed by gender, race, or diagnosis era after controlling for the age of diagnosis. In these analyses, intraparticipant HbA1c trajectories were calculated and compared across diagnostic age subgroups within each stratum for gender, race, and diagnosis era using the statistical methods described above. Formal interaction tests were conducted for each of these factors with age at diagnosis. Finally, the association between age at diagnosis and HbA1c trajectories was examined within strata based on the first HbA1c level after the initiation of insulin therapy (<7%, 7–9%, or >9% (<53, 53–75, or >75 mmol/mol), respectively), to account for differences in initial glycemic control. Analyses were performed using SAS, V.9.3 (SAS Institute, Cary, North Carolina, USA).
Results
Among the 2218 participants included in the present analysis, 52.6% were male, 86.1% were non-Hispanic Caucasian, 8.9% were non-Hispanic African-American, and 5.0% were either of other race or Hispanic ethnicity. At diagnosis, the mean age of the population was 9.0 years (±4.1), and the mean HbA1c was 11.9% (±2.6%; 106.6±28 mmol/mol). HbA1c was assessed 2.4 (±0.9) times per year in the study population. The first HbA1c after diagnosis was 7.7%±1.9% (60.7±20.8 mmol/mol). Baseline characteristics for the population are summarized in table 1.
Baseline characteristics
We observed that the shapes of the HbA1c trajectory curves over 5 years were significantly different among diagnostic age groups (figure 2A; p<0.001 overall and for shapes of the trajectory curves). In addition, we noted an inflection point in the trajectory curves at approximately 1.5 years postdiagnosis, with the greatest rise in HbA1c occurring prior to the inflection point (figure 2A). Patients diagnosed at age 0–4 years exhibited little change in HbA1c, while the rate of rise in HbA1c during the first 1.5 years after diagnosis increased progressively as diagnostic age increased, with the fastest rate of rise occurring in those 10 years old or greater at the time of diagnosis (table 2).
Rate of rise for HbA1c during the first 1.5 years postdiagnosis
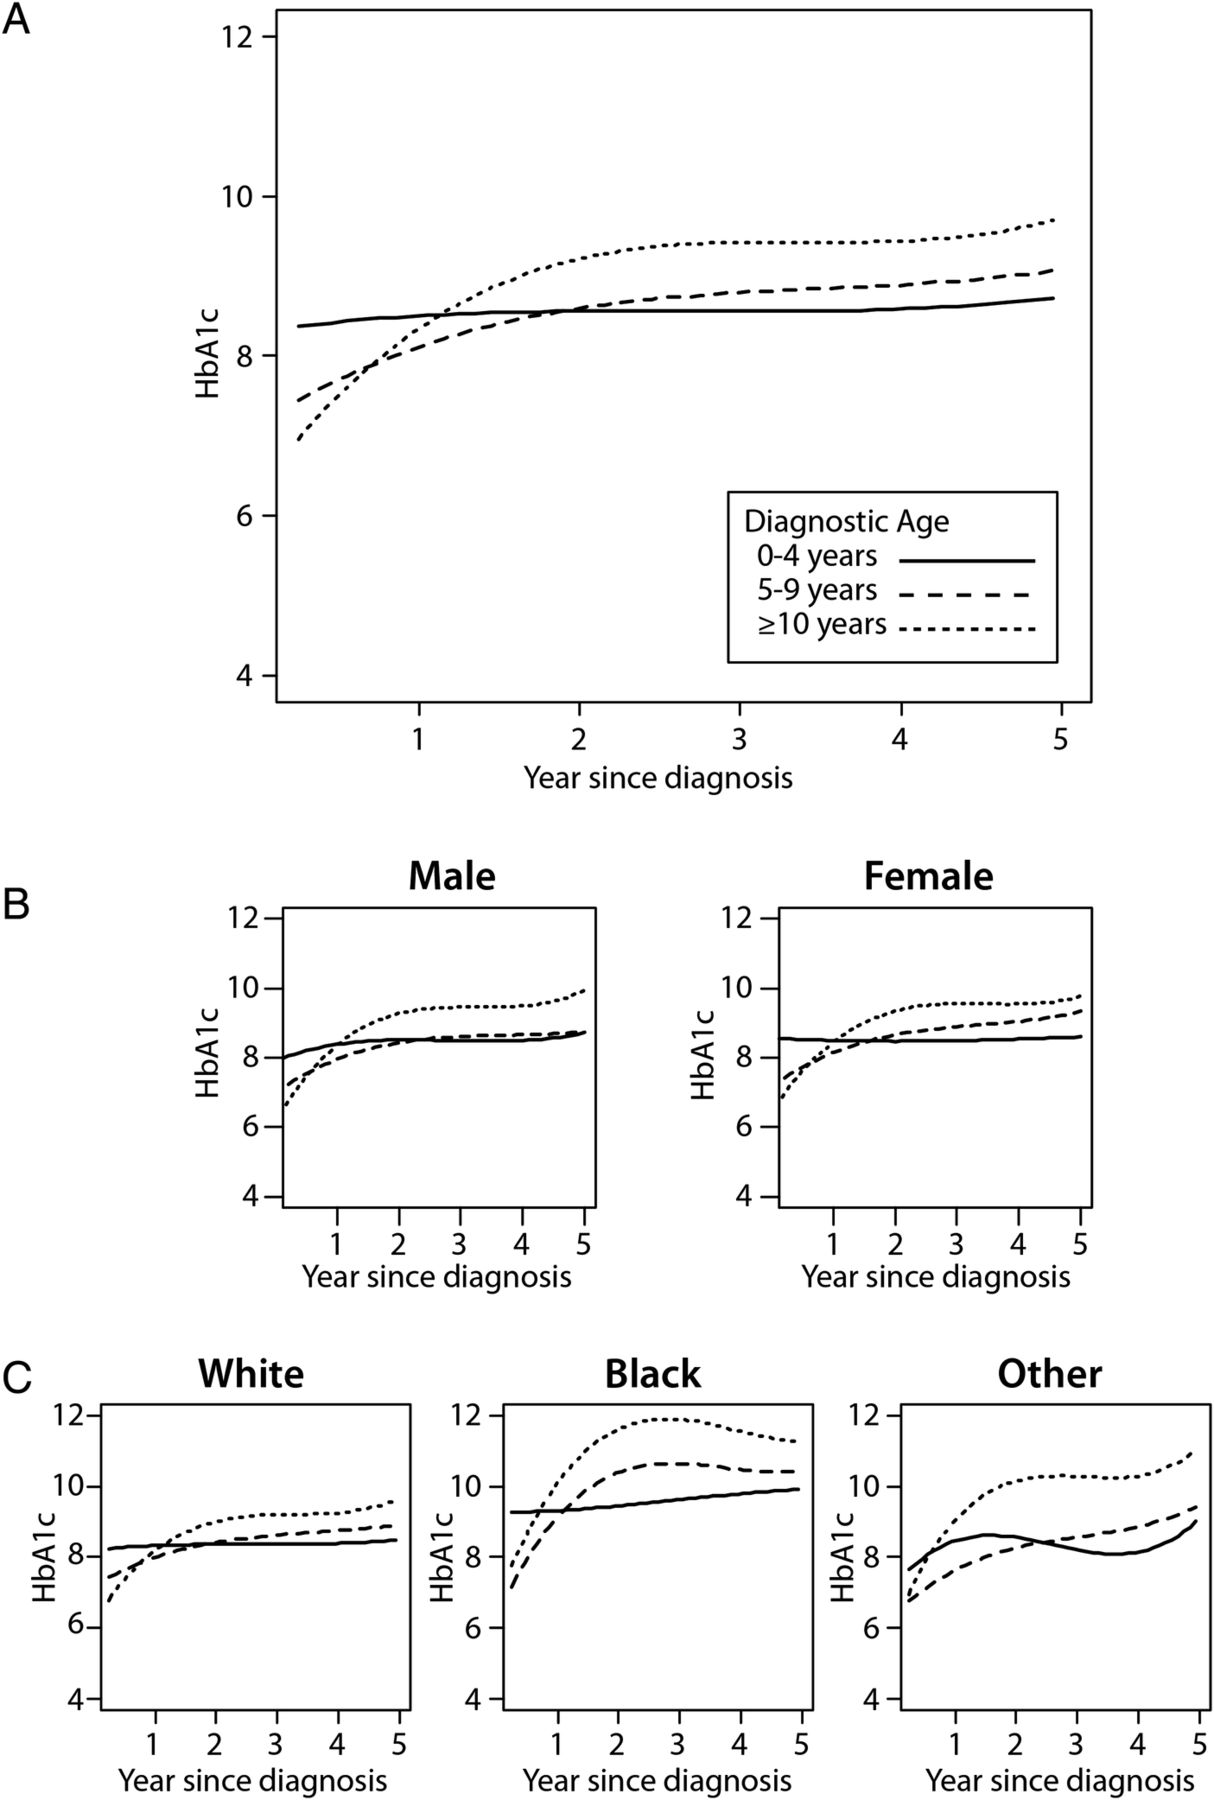
Glycated hemoglobin (HbA1c) trajectory among children after diagnosis of type 1 diabetes stratified by diagnostic age (A), by sex and diagnosis age (B), and by race and diagnostic age (C). (A) p<0.001 for trajectory comparison across diagnostic age subgroups. (B) HbA1c trajectory by diagnostic age for males (left) and females (right). p<0.0001 for sex×diagnostic age interaction. (C) HbA1c trajectory by diagnostic age for white patients (left), black patients (middle), and other minorities (right). p<0.001 for race/ethnicity×diagnostic age interaction. Solid line=age at diagnosis 0–4 years, dashed line=age at diagnosis 5–9 years, and dotted line=age at diagnosis ≥10 years.
In subgroup analyses, small yet statistically significant differences were observed within gender subgroups (figure 2B; p value for comparison of the HbA1c trajectory curve shape across diagnostic age groups <0.0001 for males and <0.0001 for females). When results were stratified by race, we found significant differences in the shape of the HbA1c curves between non-Hispanic black and non-Hispanic white youths (figure 2C; p value for race/ethnicity×age interaction <0.001). Specifically, the mean HbA1c during the 5 years after diagnosis was greater among non-Hispanic black patients than among non-Hispanic white patients overall (mean±SD=10.2%±2.5 and 8.4%±1.4 (88.0±27.3 and 68.3±15.3 mmol/mol), respectively; p<0.001), as well as within each diagnostic age subgroup (0–4-year-old group=9.6%±1.5 vs 8.3%±1.0 (81.4±16.4 vs 67.2±10.9 mmol/mol; p<0.001); 4–9-year-old group=9.8%±2.2 vs 8.2%±1.1 (83.6±24.0 vs 66.1±12.0 mmol/mol; p<0.001); 10-year-old or greater group=10.6%±2.9 vs 8.5%±1.7, respectively (92.4±31.7 vs 69.4±18.6 mmol/mol; p<0.001)). Similarly, the rate of rise for HbA1c during the first 1.5 years postdiagnosis was greater among non-Hispanic black patients than among non-Hispanic white patients within each subgroup of diagnostic age (table 2). Nevertheless, the differences among diagnostic age subgroups persisted in both non-Hispanic white and black patients, with older age at diagnosis being associated with a steeper rise in HbA1c during the first 1.5 years postdiagnosis compared with younger age at diagnosis (table 2).
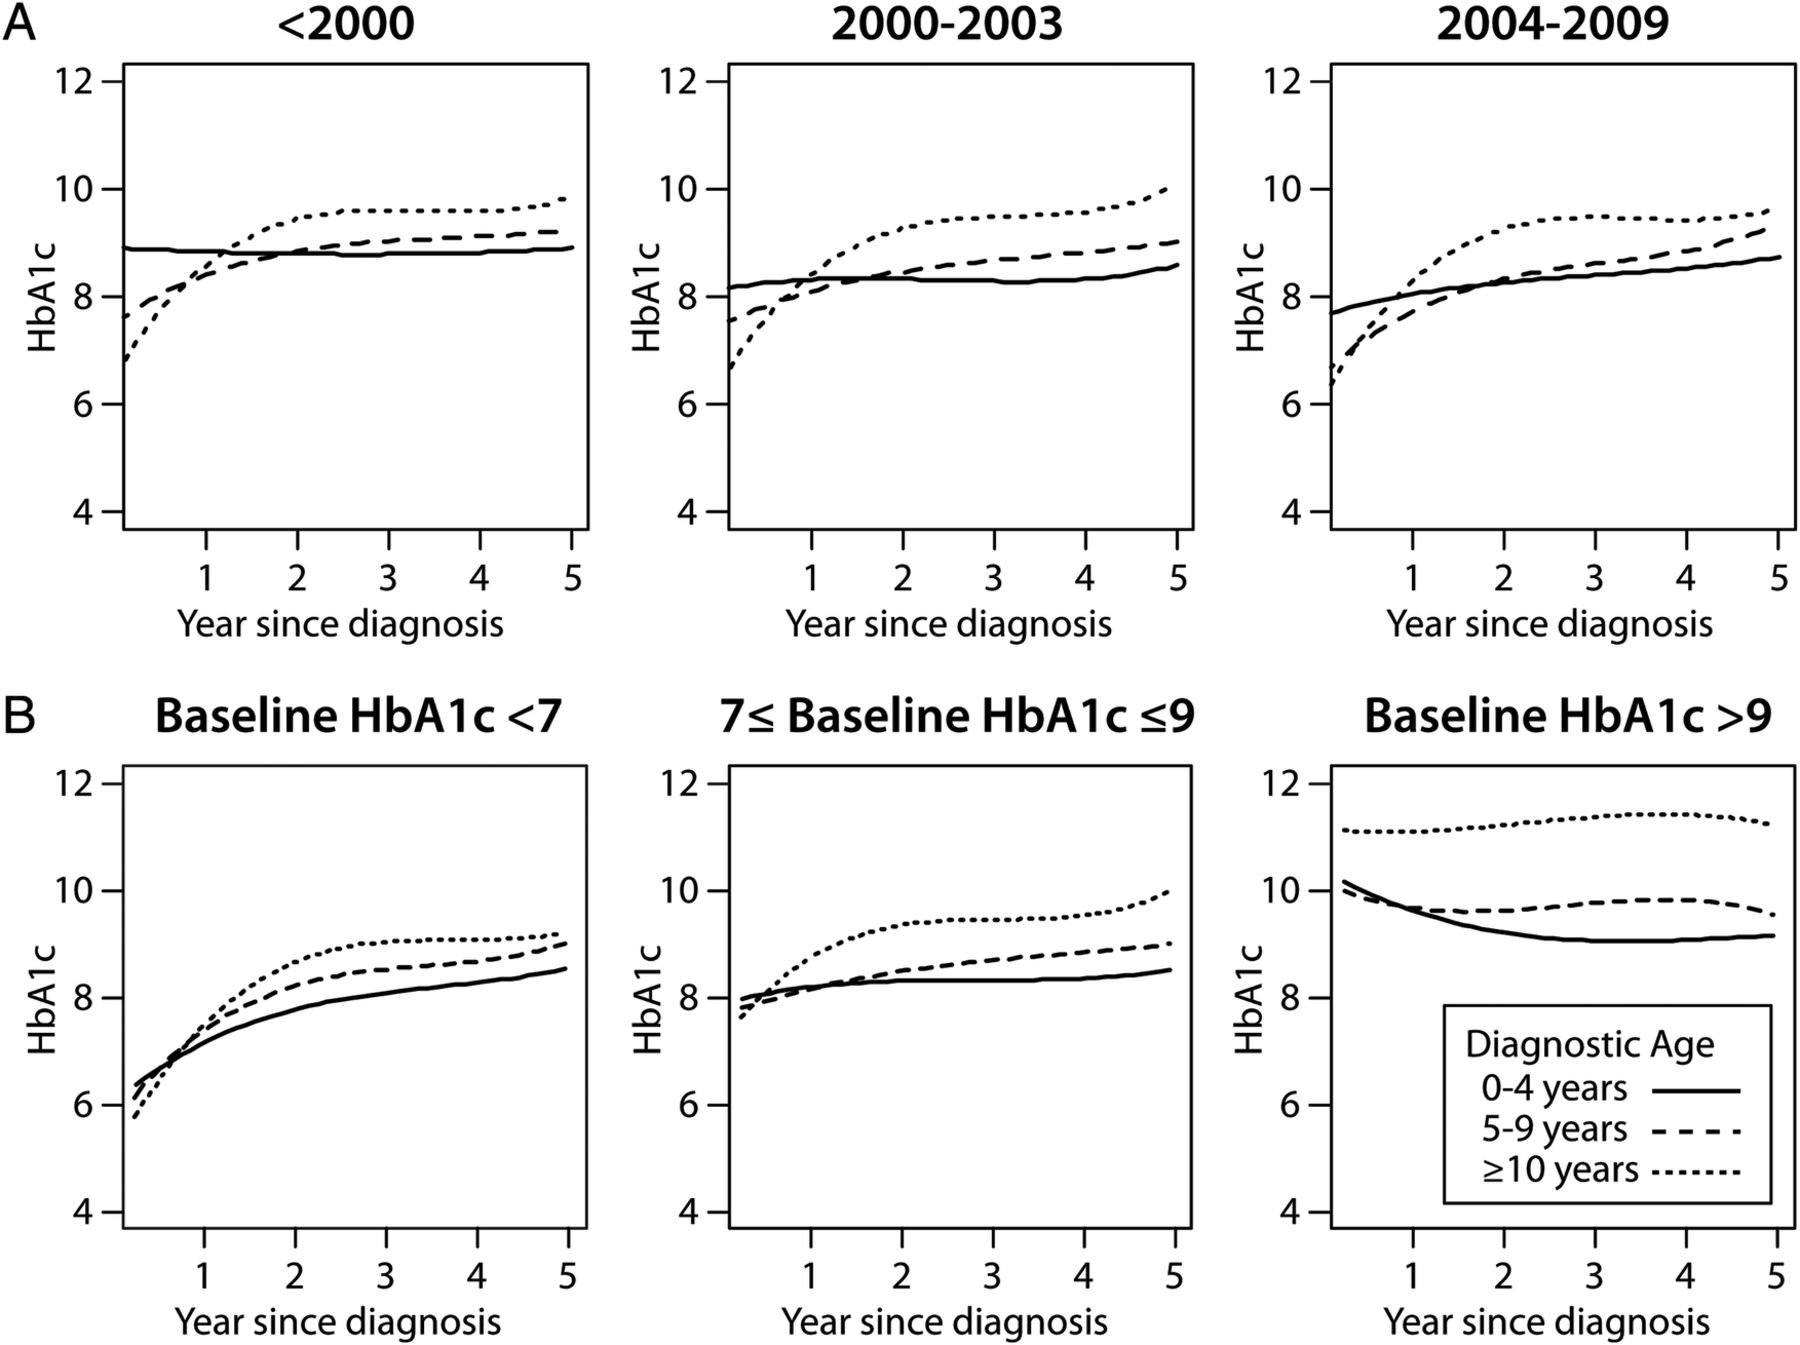
When results were stratified by era of diagnosis, we observed that the mean HbA1c within 5 years after diagnosis was lower in the most recent diagnostic era compared with the older ones (mean±SD=8.9%±1.5 (73.8±16.4 mmol/mol) for the pre-2000 era, 8.7%±1.6 (71.6±17.5 mmol/mol) for the 2000–2003 era, and 8.1%±1.7 (65.0±18.6 mmol/mol) for the 2004–2009 era; p<0.001). However, within each era, HbA1c trajectories over the 5 years after diagnosis continued to differ between diagnostic age subgroups to a similar extent compared with the main model, with patients in the 10-year-old or greater diagnostic age group experiencing greater deterioration in glycemic control compared with younger groups (figure 3A; p value for comparison of the HbA1c trajectory shape across diagnostic age subgroups <0.001 in the pre-2000 era, p<0.001 in the 2000–2003 era, p<0.001 in the 2004–2009 era). In addition, the rate of rise in HbA1c during the first 1.5 years after diagnosis continued to increase progressively with increasing age across diagnostic eras (table 2).
Glycated hemoglobin (HbA1c) trajectories among children during the first 5 years after diagnosis of type 1 diabetes, stratified by diagnostic era and diagnostic age (A), and by initial HbA1c after the initiation of insulin therapy (B). (A) HbA1c trajectories by diagnostic age for individuals diagnosed before 2000 (left), 2000–2003 (middle), and 2004–2009 (right). A p<0.0001 for diagnostic era×diagnostic age interaction. (B) HbA1c trajectories by diagnostic age for individuals with initial HbA1c after initiation of insulin therapy <7% (<53 mmol/mol; left), 7–9% (53–75 mmol/mol; middle), or >9% (>75 mmol/mol; right). A p<0.0001 for initial A1c×diagnostic age interaction (B). Solid line=age at diagnosis 0–4 years, dashed line=age at diagnosis 5–9 years, and dotted line=age at diagnosis ≥10 years.
Lastly, we observed a significant interaction between the HbA1c trajectory, age at diagnosis, and initial HbA1c after the initiation of insulin therapy (figure 3B; p<0.001). Patients with lower initial HbA1c (<7% (53 mmol/mol)) after the initiation of insulin therapy tended to have a significant rise in HbA1c during the first 1.5 years after diagnosis across all diagnostic age groups (overall yearly rise in HbA1c=1.83% (1.72 to 1.94) (20.0 mmol/mol (18.8 to 20.2)). The rate of HbA1c rise was still significant but less steep among patients with baseline HbA1c between 7% (53 mmol/mol) and 9% (75 mmol/mol) (0.81% (0.69 to 0.92) (8.9 mmol/mol (7.5 to 10.1))). Among patients with baseline HbA1c greater than 9% (75 mmol/mol), glycemic control was either stable or improved during the first 1.5 years after diagnosis (yearly decline overall=−0.68% (−0.87 to −0.49) per year (−7.4 mmol/mol (−9.5 to −5.3); table 2)). Nevertheless, the effect of age at diagnosis persisted in each baseline HbA1c subcategory, with younger patients having better glycemic control than older patients (for the HbA1c trajectory curve shape, p<0.001 across diagnostic ages within the <7% (<53 mmol/mol) subgroup, p<0.001 across age strata within the 7–9% (53–75 mmol/mol) subgroup, and p<0.001 across age strata within the >9% (>75 mmol/mol) subgroup).
Discussion
In this large cohort of patients with T1DM, we found that age at diagnosis was significantly associated with future deterioration in glycemic control. Specifically, our data show that patients diagnosed at older ages, despite achieving better initial glycemic control after the initiation of insulin therapy, experienced greater deterioration in glycemic control during the first 5 years after diagnosis than younger patients. Importantly, these patterns of greater deterioration in glycemic control among older patients were observed despite previous ADA guidelines recommending stricter glycemic control among older children during the study period,17 and persisted after adjusting for age-based differences in glycemic control shortly after the initiation of insulin treatment. Notably, current ADA guidelines were modified in 201418 and are now consistent with long-standing ISPAD guidelines in recommending the same target for glycemic control among all children.19 There were also marked differences in the HbA1c trajectory based on race, with non-Hispanic black patients exhibiting (1) a higher mean HbA1c overall, and (2) a steeper rise in HbA1c both overall and within each age-at-diagnosis subgroup. Despite the fact that both the initial and mean HbA1c values improved in the recent treatment eras, the relationship between age at diagnosis and the HbA1c trajectory remained unchanged. Finally, while the HbA1c trajectory differed based on initial HbA1c after the initiation of insulin therapy, age at diagnosis continued to be independently associated with glycemic control in each baseline HbA1c subcategory.
Our findings should be interpreted in the context of several limitations, including the fact that the patient population for this study was drawn from a single pediatric medical center. The results may therefore not be generalizable to the rest of the US T1DM patient population. In addition, the possibility of residual confounding in this observational study cannot be excluded. For example, we did not have detailed information on socioeconomic status or family structure, which may interact with diagnostic age or race. Similarly, we had no information on pubertal status and incidence of severe hypoglycemia, which could influence glycemic control.
In the existing literature, there have been few studies that have focused on identifying risk factors that predict deterioration in glycemic control among youths with T1DM. The studies that have included longitudinal data focused primarily on older children/adolescents with T1DM, with few children below age 9. In one study of German adolescents, researchers found that high family conflict and low self-esteem predicted poorer future glycemic control among adolescents.7 Similarly, other studies in the USA have revealed that problems related to adherence,5 ,6 ,20 parental support and problem-solving skills,5 ,21 family structure,9 peer or family conflict,5 ,22 depression,5 ,23 disturbed eating behavior,5 self-efficacy,24 and parental stress8 each either correlate with poor mean glycemic control or predict future deterioration in glycemic control among adolescents. In SEARCH and other studies, a number of demographic and socioeconomic variables including race, uninsured status, lower parental education, and single-parent household were found to be associated with the level of glycemic control measured among youth, which was supported by the present analysis.1 ,9 ,25 ,26 Our study substantially extends prior existing literature by recruiting a much larger sample of patients with T1DM from all ages, and by providing a more detailed analysis over a longer period of time and across multiple subgroups. First, our analysis expands beyond that performed in the SEARCH study, because we define glycemic trajectories over 5 years postdiagnosis, while SEARCH correlated their demographic variables with a single measure of HbA1c for patients.1 Second, although adolescence is commonly recognized as a time of significant physiological, cognitive, social, emotional, and psychological change,27 ,28 children of all ages can experience rapid changes in these domains, making it important to recruit a broad age range of youth in order to fully appreciate how glycemic control can change across childhood. In addition to observing deterioration in glycemic control among adolescents (age 10–20), as has been observed in previous studies, in our data we found a significant risk for postdiagnosis deterioration in glycemic control among preteenage youth (age 5–9) diagnosed with T1DM. Third, we also found a significantly increased risk for deterioration in glycemic control among non-Hispanic black youths. Since black patients with T1DM exhibit a higher risk for diabetes-related complications than Caucasians,29–31 our current findings are particularly significant and may guide preventative interventions with these patients. Finally, our data suggest that therapeutic advances in diabetes clinical management have not had a significant impact on the influence of age and race on the trajectory of glycemic control, despite the association between recent diagnosis and overall better glycemic control. There are multiple possible explanations for the associations that we observed between deterioration in glycemic control and both diagnostic age and race. We suspect that the specific influence that diagnostic age may have on youths’ glycemic control is mediated by other factors, including a dip in patients’ motivation and/or decreased parental supervision earlier after diagnosis, leading to a subsequent drop in their adherence to recommended glucose monitoring and insulin therapy. Like diagnostic age, we suspect that race may influence glycemic control via multiple pathways, some of which may be amenable to treatment such as adherence, adjustment to T1DM, and perceived support for T1DM. Although not addressed in the present study, it is recognized that the trajectory of glycemic control is also likely to be influenced by additional disease-specific factors, such as the loss of residual β-cell function with increasing disease duration,32 and/or the development of insulin resistance related to puberty.33 ,34 Notably, we do not think that residual β-cell function (ie, ‘the honeymoon phase’) can adequately explain all of the observed association between diagnostic age and subsequent deterioration in glycemic control. Younger children experience less deterioration in glycemic control after diagnosis, despite the fact that residual β-cell function is lower in younger children (at least down to age 7),35 and the ‘honeymoon phase’ is lost as fast or faster in younger children.35 ,36 We acknowledge that puberty likely explains some of the deterioration after diagnosis in youths 5–9 years old. However, in that age group, the majority of the deterioration in glycemic control occurred during the first 2 years postdiagnosis, such that even 8-year-olds and 9-year-olds newly diagnosed with T1DM experienced significant deterioration by ages 10 and 11, respectively. In contrast, previous data suggest that the mean age of true pubertal onset for boys and girls with T1DM may be later, at 12.2 and 11.5 years, respectively.37 Regardless, declining glycemic control occurs despite efforts by the patients’ healthcare providers to intensify insulin therapy during puberty. It seems plausible that factors impacting adherence to intensified diabetes treatment regimens strongly influence patients’ and providers’ success in mitigating the effects of puberty on insulin needs and glycemic control. Future studies should examine all potential mediators of glycemic control in youth as this additional information would help with developmentally targeted intervention development.
The present findings are clinically important because we have identified several groups of patients; including non-Hispanic black patients diagnosed with T1DM at any age, non-black patients diagnosed at ages ≥ 10, and even non-black patients diagnosed at ages 5–9, who exhibit higher risk for future deterioration in glycemic control. Each group may benefit from closer attention and follow-up following diagnosis. While one might assume that the introduction of new technology related to insulin delivery and glucose monitoring would improve glycemic control, our findings suggest that these innovations may not impact trajectories of control among young patients with T1DM. This suggests that the introduction of future therapeutic innovations in diabetes care to this population may not eliminate age-based and race-based disparities in glycemic control. Multidisciplinary care teams and tailored behavioral interventions may be effective, but these need to be evaluated in future prospective studies.35
In summary, older age at diagnosis and black race are significantly associated with greater deterioration in HbA1c control following diagnosis. These findings form the foundation for future studies to better define critical risk predictors for deterioration in glycemic control and eventually develop effective intervention strategies in high-risk patients with T1DM.
Acknowledgments
Eric Wiedmer, BS, Kaleb Wade, John Jarrell, Andrew Slaughter, and Malcolm McIntyre, BS (all Children's Mercy Hospital) provided assistance with data collection (informatics-based extraction of clinical data across multiple historic electronic health record platforms). Wayne Moore, MD, PhD, Children's Mercy Hospital, provided a critical review of the manuscript.
References
Footnotes
-
Contributors MAC and MK had full access to all data in the study and take responsibility for the integrity of the data and the accuracy of the data analysis. MAC, SR, YW, and AGF collected and validated data. PGJ and FT conducted and are responsible for the data analysis. MAC, MK, and PJ planned the analysis approach. MAC, ML, SR, SRP, KJL, AGF, FT, PGJ, YW, JAS, and MK wrote the manuscript. All participated in the manuscript planning discussions and critical review of the mansucript.
-
Funding A Physician Scientist Award (Children's Mercy Hospital). The Health & Medical Care Committee of the Regional Executive Board, Region Västra, Götaland, Sweden. The Anna Cederbergs Foundation. The Swedish state, under the agreement between the Swedish government and the county councils concerning economic support of research and education of doctors (ALF-agreement).
-
Competing interests MAC was supported by a Kansas City Area Life Sciences Award and a Physician Scientist Award (Children's Mercy Hospital). The participation of ML was financed by grants from the Swedish state, under the agreement between the Swedish government and the county councils concerning the economic support of research and education of doctors (ALF-agreement) and by the foundation of Anna Cederberg. KJL is supported by the Pepper Center Career Development Award (P30 AG21342), the Grants for Early Medical/Surgical Specialists’ Transition to Aging Research (R03 AG045086) from the National Institute on Aging, and the Yale Center for Clinical Investigation (YCCI) Scholar award; this publication was made possible by Clinical and Translational Science Awards (CTSA) grant No. UL1 TR000142 from the National Center for Advancing Translational Science (NCATS), components of the National Institutes of Health (NIH), and the NIH roadmap for Medical Research. ML has been a consultant or received honoraria from Medtronic and Novonordisk and participated in advisory boards for Novonordisk. He has received research grants from DexCom and Novonordisk.
-
Ethics approval The study was reviewed and approved by the Children's Mercy Hospital Institutional Review Board, and compliance with Health Insurance Portability and Accountability Act (HIPAA) regulations and the Declaration of Helsinki was ensured.
-
Provenance and peer review Not commissioned; externally peer reviewed.
-
Data sharing statement Additional unpublished data from the T1P Database at Children’s Mercy Hospital are not available in a public data repository at this time.