Statistics Notes: Measurement error and correlation coefficients
BMJ 1996; 313 doi: https://doi.org/10.1136/bmj.313.7048.41 (Published 06 July 1996) Cite this as: BMJ 1996;313:41
- a Department of Public Health Sciences, St George's Hospital Medical School, London SW17 0RE
- b ICRF Medical Statistics Group, Centre for Statistics in Medicine, Institute of Health Sciences, PO Box 777, Oxford OX3 7LF
- Correspondence to: Professor Bland
Measurement error is the variation between measurements of the same quantity on the same individual.1 To quantify measurement error we need repeated measurements on several subjects. We have discussed the within-subject standard deviation as an index of measurement error,1 which we like as it has a simple clinical interpretation. Here we consider the use of correlation coefficients to quantify measurement error.
A common design for the investigation of measurement error is to take pairs of measurements on a group of subjects, as in table 1. When we have pairs of observations it is natural to plot one measurement against the other. The resulting scatter diagram (see figure 1 may tempt us to calculate a correlation coefficient between the first and second measurement. There are difficulties in interpreting this correlation coefficient. In general, the correlation between repeated measurements will depend on the variability between subjects. Samples containing subjects who differ greatly will produce larger correlation coefficients than will samples containing similar subjects. For example, suppose we split this group in whom we have measured forced expiratory volume in one second (FEV1) into two subsamples, the first 10 subjects and the second 10 subjects. As table 1 is ordered by the first FEV1 measurement, both subsamples vary less than does the whole sample. The correlation for the first subsample is r = 0.63 and for the second it is r = 0.31, both less than r = 0.77 for the full sample. The correlation coefficient thus depends on the way the sample is chosen, and it has meaning only for the population from which the study subjects can be regarded as a random sample. If we select subjects to give a wide range of the measurement, the natural approach when investigating measurement error, this will inflate the correlation coefficient.
Pairs of measurements of FEV1 (litres) a few weeks apart from 20 Scottish schoolchildren, taken from a larger study (D Strachan,personal communication)
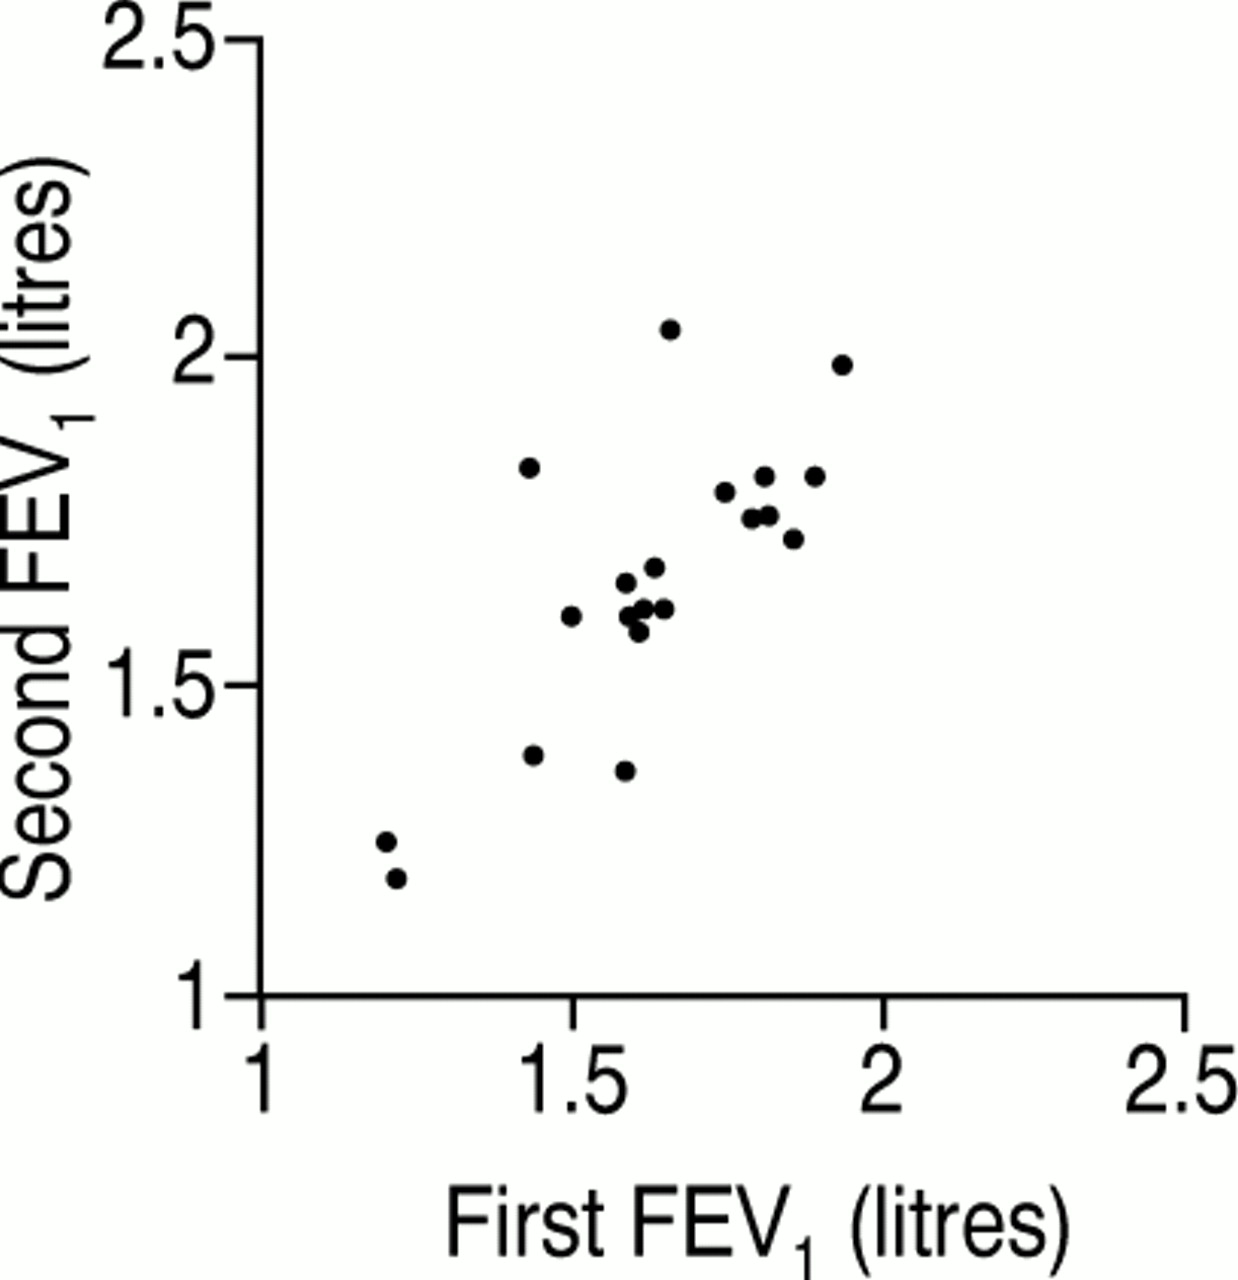
Measurements from pairs of observations plotted against each other
The correlation coefficient between repeated measurements is often called the reliability of the measurement method. It is widely used in the validation of psychological measures such as scales of anxiety and depression, where it is known as the test-retest reliability. In such studies it is quoted for different populations (university students, psychiatric outpatients, etc) because the correlation coefficient differs between them as a result of differing ranges of the quantity being measured. The user has to select the correlation from the study population most like the user's own.
Another problem with the use of the correlation coefficient between the first and second measurements is that there is no reason to suppose that their order is important. If the order were important the measurements would not be repeated observations of the same thing. We could reverse the order of any of the pairs and get a slightly different value of the correlation coefficient between repeated measurements. For example, reversing the order of the even numbered subjects in table 1 gives r = 0.80 instead of r = 0.77. The intra-class correlation coefficient avoids this problem. It estimates the average correlation among all possible orderings of pairs. It also extends easily to the case of more than two observations per subject, where it estimates the average correlation between all possible pairs of observations.
Few computer programs will calculate the intra-class correlation coefficient directly, but when the number of observations is the same for each subject it can be found from a one way analysis of variance table2 such as table 2. We need the total sum of squares, SST, and the sum of squares between subjects, SSB.
Then
rI = mSSB - SST/(m - 1) SST
where m is the number of observations per subject. For table II, m = 2 and
rI = 2 × 1.52981 - 1.74651/(2 - 1) × 1.74651 = 0.75
One way analysis of variance for the data in table 1
In practice, there will usually be little difference between r and rI for true repeated measurements. If, however, there is a systematic change from the first measurement to the second, as might be caused by a learning effect, rI will be much less than r. If there was such an effect the measurements would not be made under the same conditions and so we could not measure reliability.
The correlation coefficient can be used to compare measurements of different quantities, such as different scales for measuring anxiety. We could make repeated measurements of all the quantities on the same subjects and calculate intra-class correlations. The measures with the highest correlation between repeated measurements would discriminate best between individuals; in other words they would carry the most information. For most applications, however, we prefer the within-subjects standard deviation as an index of measurement error, as it has a more direct interpretation which can be applied to individual measurements.1