Article Text

Abstract
Objective: To measure the plantar pressure in four soccer-related movements in 15 male soccer players (mean (SD) age 20.9 (1.3) years, height 173 (4) cm, weight 61.7 (3.6) kg).
Design: : To record plantar pressure distribution, the players wore soccer boots with 12 circular studs and with an insole pressure recorder device equipped with 99 sensors. Plantar pressure was recorded in five successful trials in each of the four soccer-related movements: running, sideward cutting, 45° cutting and landing from a vertical jump. Each footprint was divided into 10 recorded areas for analysis.
Results: : Compared with running at 3.3 m/s, maximal speed sideward cutting and 45° cutting induced higher peak pressure (p<0.05) under the second toe, medial forefoot, medial arch and medial heel. The peak pressure of the maximal jump landing was lower under the medial forefoot and lateral forefoot as compared with running (p<0.05). The pressure–time integral showed that sideward cutting and 45° cutting induced higher pressures (p<0.05) than running for all recorded areas, except for the lateral forefoot and the lateral arch. In all the four soccer-related movements, a higher pressure was found on the medial side of the plantar surface as compared with the lateral side.
Conclusions: : These data suggest that the medial side of the plantar surface may be more prone to injuries, and that foot orthosis adoption, improved soccer boot design and specific muscle training could be considered to reduce pressure and the subsequent risk of injury.
- ANOVA, analysis of variance
- PTI, pressure–time integral
Statistics from Altmetric.com
Soccer is one of the most popular sports throughout the world, with more than 240 million players worldwide.1 However, previous studies have shown that soccer involves a higher injury rate and injury percentage as compared with other sports such as field hockey,2 handball, basketball,3 rugby, judo and boxing.4 Recently, in their review of soccer injuries located in the lower extremities, Wong and Hong5 concluded that injuries caused by non-body contact (∼60%) were more prevalent than those caused by body contact (∼40%), and that the foot is one of the most commonly injured parts of the body. In addition, various foot problems such as metatarsal stress fracture, interdigital neuroma (mechanical entrapment neuropathy of the interdigital nerve), sesamoid pathology and metatarsalagia (pain in the plantar aspects of the metatarsal heads) result from repetitive high loads on the foot.6,7 It has also been reported that stress fracture is common among soccer players, and that 38% (9/24) of players on the US team developed stress fractures during the 1994 FIFA World Cup.8 Furthermore, most soccer injuries result from running, turning, twisting, landing and jumping.3,9,10
One of the reasons for a high injury rate in soccer could be the poor design of soccer boots. Indeed, previous studies5,11 reported that about 17% of soccer injuries were caused by poor design of equipment. Specifically, 77% of these equipment-caused injuries were ascribed to boots. Therefore, improvement of the protective functions of soccer boots could reduce soccer injuries. Moreover, knowledge about the specific areas and the magnitude of plantar pressure during soccer movements is important for optimal training, injury prevention, rehabilitation and footwear design.
Plantar pressure refers to the pressure measured on the plantar surface of the foot. To date, many published studies have investigated the plantar pressure of running shoes.12–16 Surprisingly, to our knowledge, only one study on the plantar pressure of soccer boots has been published in which a pair of 12-stud soccer boots was used.17 Peak pressure and relative load (force–time integral) during normal running, cutting movements, sprinting and goal shots were discussed in an earlier study.17 The authors reported substantially higher pressures during cutting, sprinting and kicking movements compared with normal running. Specifically, compared with normal running, higher pressures were found in the medial part of the foot in cutting movements, in the medial and central forefoot during sprinting, and in the lateral part of the foot during kicking. To enhance the compatibility of results with those of the previous study, a pair of 12-stud soccer boots was also used in the present study.
To provide more relevant information about injury and comfort, a pressure–time integral (PTI), which measures both the pressure and duration, should be used. Theoretically, the longer the time pressure is applied or the more the steps a person takes (increased repetition) with a given magnitude of pressure experienced on each footstep, the higher the risk of injury on the plantar surface.18 In addition, as compared with peak pressure, the PTI is a more sensitive indicator in the aetiology of tissue damage19,20 and foot injury,21 and has been found to have a higher association with pain.22 Furthermore, a PTI also has greater differentiability than a force-time integral when comparing the perceived comfort derived from the use of different shoes during walking.12
Most soccer injuries occur during competition as compared with training.5 Previous studies analysing professional players in international,23 professional and amateur24 competitions found that passing, jumping/heading, turning, running and dribbling are the most frequently made movements. Furthermore, in the running movement, it has been reported by two previous studies that professional players covered 37–46% of the total distance by jogging (running at moderate speed), followed by walking (25–27%), sprinting (6–11%) and backing (∼7%).25,26 To increase the reproducibility, those movements involving a soccer ball (ie, passing and dribbling) were not selected in the present study. Furthermore, jump landing, which is one of the most frequent movements in soccer,23,24 had not been studied in the previous study.17 Hence, in the present study, moderate speed running (∼3.3 m/s), sideward cutting, 45° cutting and jump landing were considered.
The purposes of the present study were to compare the in-shoe plantar pressure of the four soccer-related movements and to identify the plantar areas where the highest pressure was exerted. We hypothesised that different movements would have significant influence on the amplitude and distribution of in-shoe plantar pressure. The present study fills the gaps in the literature in terms of the following: (a) the inclusion of plantar pressure in jump landing; (b) the simultaneous measurement of peak pressure and PTI ; and (c) the analysis of the plantar pressures on the players’ respective dominant foot, as the dominant foot is reported to have more injuries.27
METHODS
Subjects
Fifteen male soccer players (mean (standard deviation (SD)) age 20.9 (1.3) years, height 173 (4) cm; weight 61.7 (3.6) kg, self-reported experience of playing soccer 10.2 (3.) years, self-reported experience of wearing soccer boots 4.7 (2.2) years) with approximately the same foot size participated in the study. They were asked to identify their dominant leg according to their experience, and, as recorded, three of them shoot predominantly with their left leg. The players were current members of the university soccer team and were free from injuries during the time of the study. All of them were also informed about the experimental procedure, potential risks and rights to terminate the experiment at any time. They signed a written consent before participation. The protocol was approved by the clinical research ethics committee.
The experimental boot (Attiva R, Diadora, Treviso Italy; shoe size EUR 43) had 12 circular studs, which is one of the typical types of boot used by players. The players wore the same type of thin soccer socks without being taped at the ankles. The boot was examined manually by palpation to ensure that it fitted the player and that no discomfort was reported throughout the tests.
Equipment
Insole plantar pressure distribution was recorded using the Pedar Mobile System (Novel GmbH, Munich, Germany) containing 99 sensors in a matrix design. During data collection, the device was placed between the boot and the plantar surface of the foot. The data logger for data storage was secured by a belt on the players’ waist, which received the data by telemetry. Plantar pressures were recorded at 50 Hz from the players’ dominant foot.
A digital camera (DVL9800, JVC, Yokohama, Japan) set at 50 Hz was secured on the sagittal side of the running pathway to capture the whole experiment and facilitate the analysis of plantar pressure accompanying the movements. The visual flashlight on the data logger was triggered when the device started collecting data. The light functioned to synchronise the video with the pressure data.
Experimental design and procedure
Before experimental testing, the soccer players warmed-up on a 20 m×8 m FIFA-approved artificial turf (FieldTurf, New York, USA), which is a third generation synthetic turf. During the self-paced warm-up and familiarisation period, the players were required to perform the same movements as they would perform in the test: 210 m of running, five sideward cuttings on the left and right sides, five 45° cuttings on the left and right sides, five landings from countermovement vertical jump (maximum height) and 5–10 min of passive muscle stretching.
The test was performed on the same artificial turf. The four soccer-related movements performed were running at 3.3 m/s, sideward cutting at maximum speed, 45°cutting at maximum speed and landings from a countermovement vertical jump after an effort to reach maximal jump height each time. Data for five successful trials were collected for each movement and the average of the five was used in data handling. The players were allowed to rest for 1 min in between each of the movements’ repetitions.
Figure 1A illustrates the running path. Two pairs of infrared timing sensors (“R” in fig 1A; Speedtrap II Wireless Timing System, Brower Timing System, Draper, Utah, USA) were located in the middle (10 m) to determine whether the running speed was within ±5% of the desired range of 3.3 m/s.

The experimental set-up and running paths for players with right dominant legs for the following movements: (A) running, (B) sideward cutting and (C) 45° cutting to the right. For running (A), the players ran fom the starting point to the end point in each trial. For sideward cutting (B), the players started from the left cutting area (SL in the figure), performed three or four sidesteps to reach the right cutting area (SR) and then cut back to the left cutting area (SL); the movement was started from a standing still position. For 45° cutting (C), the players started from the starting point, ran to the right cutting area (CR) and then after cutting in the area, the players performed sidesteps to the left cutting area (CL).
The players performed the major cutting step (ie, the step in which the direction is changed) with their dominant leg during the sideward cutting and 45° cutting movements. Figures 1B,C show the paths of sideward cutting and 45° cutting for the players with a right dominant leg;,the paths for players with a left dominant leg are in the opposite direction.
For the countermovement vertical jump, the players performed the jump on the turf area near the starting point. They were required to land on both feet after trying to reach their maximal jump height.
Plantar pressure data
Each footprint was divided into 10 recorded areas using the Novel Multimask software (Novel GmbH Munich, Germany) (fig 2). For each footprint, peak pressure (kPa) and PTI (kPas) were extracted. Peak pressure represented the highest pressure recorded by each of the 10-recorded areas at any time during the data collection period. PTI was calculated as the product of the pressure and the time over which it was applied. PTI values reflect not only the pressure’s amplitude but also the time duration over which the pressure was exerted during each footprint.28
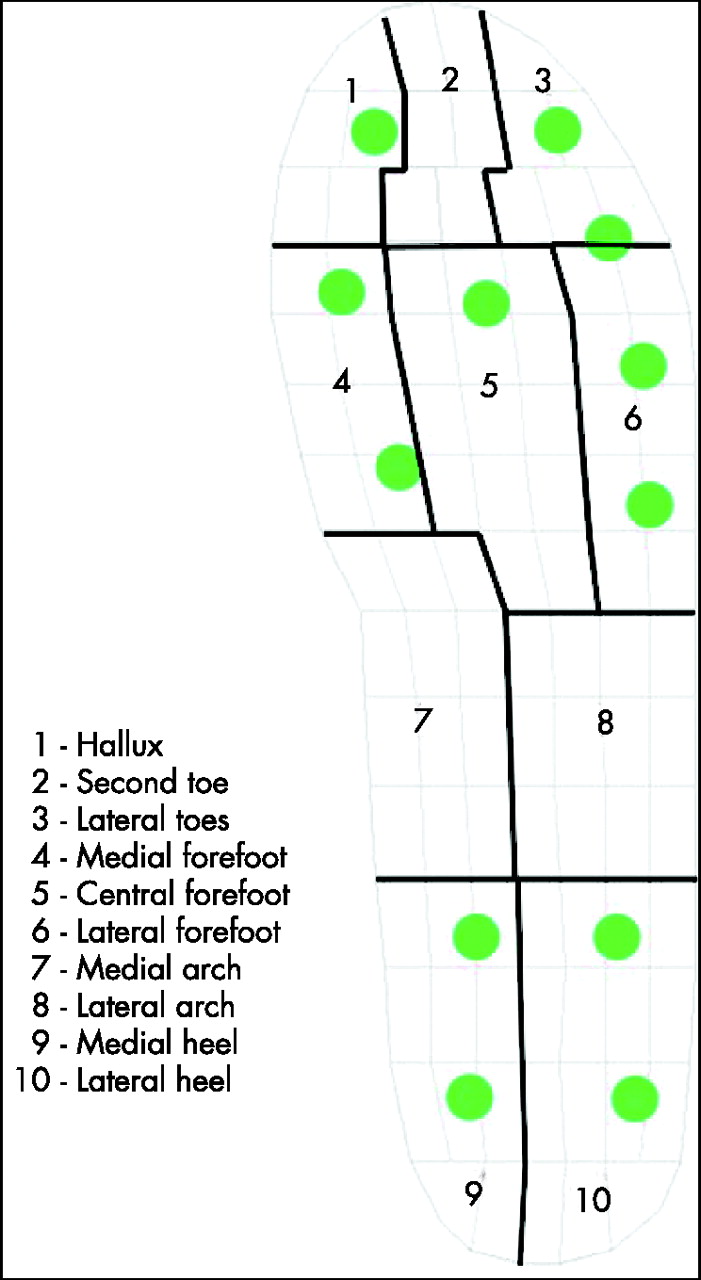
The division of 10 recorded areas in each footprint. The 12 circles represent the studs of the soccer shoe.
Statistical analysis
The software package SPSS V.12.0 was used in the data analysis. The level of significance was set at the alpha level of 0.05. Two-way repeated measures analysis of variance (ANOVA) was conducted to explore the plantar pressure distribution (peak pressure and PTI) across the four soccer-related movements. There were two within-player independent variables (type of movement and recorded area). One-way ANOVA with repeated measures was used to examine the differences of plantar pressure among the four movements in each recorded area. Pairwise comparison with Bonferroni adjustment was used when there was a demonstrated significant difference in one-way ANOVA, in order to keep the experiment-wise error rate at 0.05.29 Data are presented as mean (SD).
RESULTS
Table 1 shows the descriptive statistics of peak pressure and PTI under 10-recorded areas. It is broadly observed that the profile of plantar pressure was different among the four soccer-related movements. Table 2 presents the percentage of plantar pressure of each area with respect to the area with highest pressure.
Mean (SD) of plantar pressure in each recorded area across the four soccer-related movements (in peak pressure and PTI)
Percentage of the pressure in each area with respect to the area with the highest pressure in the same movement
Univariate results suggested significant interaction between types of movement and recorded areas (F27,378 = 12.14, p = 0.04). Post hoc tests indicated that the players’ peak pressure of performing 45° cutting was significantly greater than that of performing sideward cutting (d = 35.67, p<0.01), which was further significantly higher than that of running (d = 40.65, p<0.01). In addition, the peak pressure of running was marginally higher than that of jump landing (d = 30.49, p = 0.06; table 3).
Mean differences of plantar pressure among the four soccer-related movements
To further understand the interaction and its implication on the peak pressure distribution across various recorded areas in the four movements, we look into the detailed information of those estimated marginal means (table 1). For running, the highest peak pressure was found at the medial forefoot and hallux, followed by the lateral heel. For sideward cutting and 45° cutting, the highest peak pressure was found at the medial forefoot, closely followed by the hallux and medial heel. For jump landing, the highest peak pressure was located at the hallux followed by the medial heel. One-way repeated measure ANOVA was conducted to explore the mean differences of each pair of recorded areas among the four movements (table 4).
Mean differences of plantar pressure among recorded areas in the four soccer-related movements
Pressure–time integral
Univariate results suggested significant interactions between types of movement and recorded areas (F27,378 = 27.51, p = 0.01). Post hoc tests indicated a similar trend of mean differences of plantar pressure across the four movements (table 3). The PTI of jump landing was still the lowest. It was lower than the plantar pressure of running (d = 11.90, p<0.01), which was further lower than the plantar pressure of either sideward cutting or 45° cutting. Nevertheless, the PTI of sideward cutting and 45° cutting were not significantly different in this case.
The pressure distribution across the four movements showed that sideward cutting and 45° cutting were extremely similar (table 1). The highest plantar pressure was at the medial forefoot, closely followed by the hallux, whereas the lowest points were found at the lateral forefoot and lateral arch. For running and jump landing, although the highest PTI was also located at the medial forefoot and hallux, the lowest PTI was found at the medial arch and lateral arch. Moreover, the discrepancy between the highest and lowest PTI was smaller in running and jump landing than in the two types of cutting. One-way repeated measure ANOVA was also conducted to explore the mean differences of each pair of recorded area among the four movements (table 4).
DISCUSSION
Compared with running (fig 3), both sideward cutting and 45° cutting had significantly higher peak pressures under the second toe, medial forefoot, medial arch and medial heel. Under the hallux, lateral toes and lateral heel, 45° cutting even had a higher peak pressure than running. However, the two cutting movements had a significantly lower peak pressure under the lateral forefoot and lateral arch compared with running. Moreover, jump landing had a significantly lower peak pressure under the medial forefoot and lateral forefoot as compared with running.
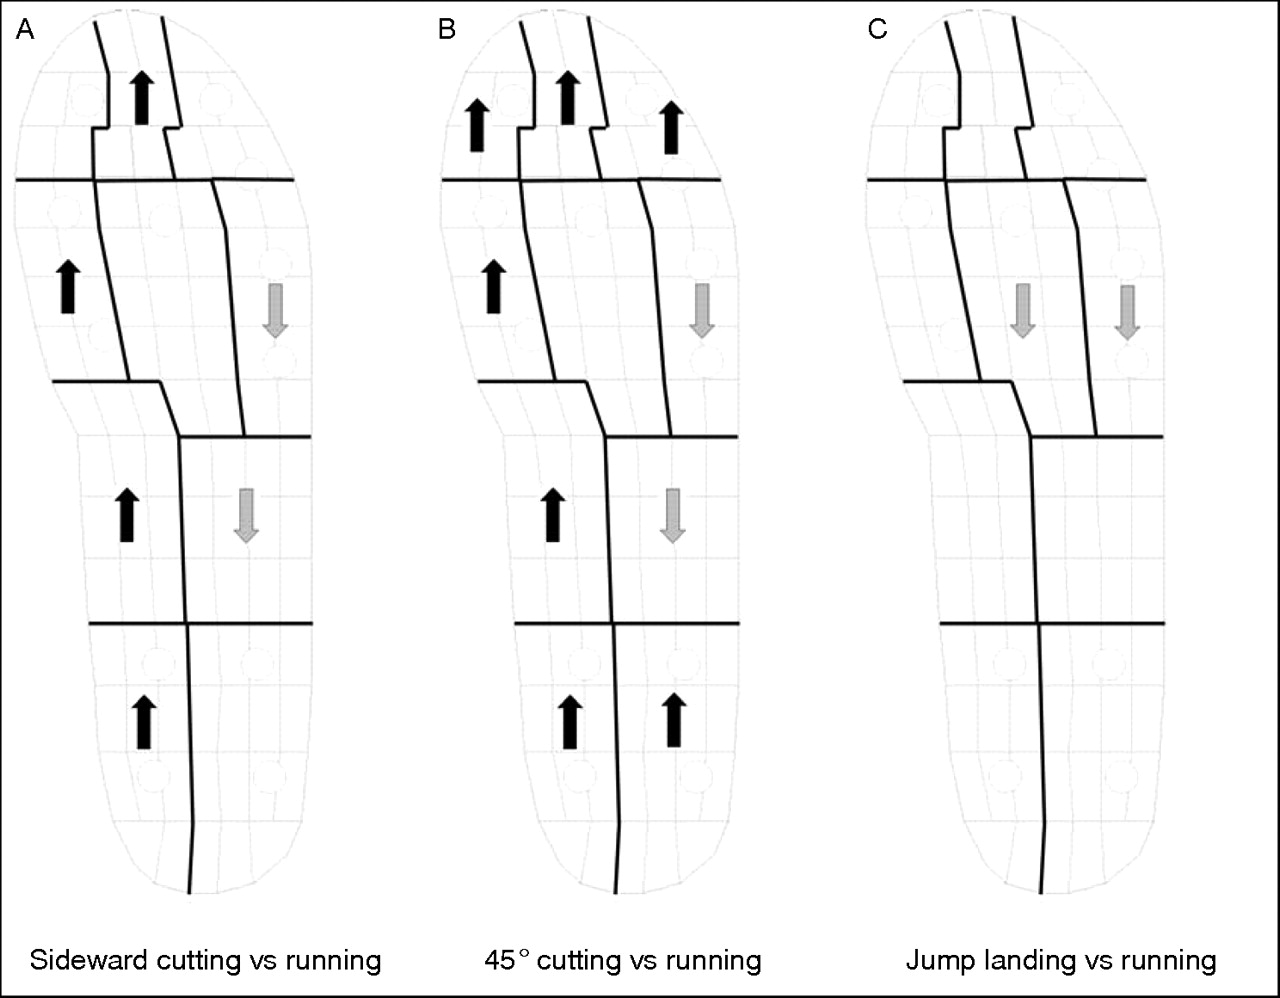
Overall peak pressure changes. Arrows indicate a significant increase (black) or decrease (grey) of peak pressure compared with running.
Compared with running (fig 4), both sideward cutting and 45° cutting had a significantly higher PTI under all recorded areas except for the lateral forefoot and the lateral arch. In addition, 45° cutting had a significantly lower PTI than that of running under the lateral forefoot and lateral arch. Vertical jump landing also had a significantly lower pressure-time integral under all recorded areas as compared with running.

Overall pressure-time integral changes. Arrows indicate a significant increase (black) or decrease (grey) of pressure-time integral compared with running.
The data obtained in the present study generally agree with the findings reported by Eils et al,17 in which higher peak pressures were measured in the medial side rather than in the lateral side of the plantar surface during running and cutting movements in soccer. Although the sequence in the present study was not the same as that in the study of Eils et al,17 the three areas with the highest peak pressures during running were found to be the same: the hallux, the medial forefoot and the central forefoot. In addition, in both studies, the cutting movement had a higher peak pressure than running under the hallux, second toe, medial forefoot, medial arch, medial heel and lateral heel, but had a lower peak pressure than running under the lateral forefoot and lateral arch. However, the peak pressures under the lateral toes and central forefoot in the cutting movements were higher than those of running in the present study, although the opposite was reported by Eils et al.17 Such differences between both studies could be due to different kinds of soccer boots and/or due to the difference in technical skills of the studied players. Moreover, in the present study, the mean body weight of the players was approximately 62 kg, and the shoe size was 43 (Eur), whereas in the study conducted by Eils et al,17 the mean body weight of the players was approximately 79 kg. This suggests that, compared with other stature players with body masses of around ∼75 –87 kg,30 the plantar pressures could be much greater than that reported in the present study.
A higher peak pressure was recorded under the hallux and the medial forefoot during running in both the present study and a previous study,17 and it is believed that a high peak pressure, together with a high number of repetitions, could lead to chronic injury6,7 and reduce perceived comfort.31 In addition, a higher peak pressure and PTI were found in sideward cutting and 45° cutting in the present study with respect to running, which implies that these two movements might have a higher risk of causing injury.5 Attention should thus be paid to these areas and movements when developing and implementing a training programme, an injury prevention programme, a rehabilitation programme and when designing footwear. Indeed, a higher pressure on the medial line of the foot might apply excessive pressure on the medial arch, which is not supported in soccer boots as in other sports boots. This has to be considered when strengthening the muscles of soccer players and/or manufacturing/choosing their soccer boots with the possible use of orthosis. It has been reported that orthosis would significantly reduce peak pressure (∼20%) and PTI (∼32%).22 This further suggests that inserting an orthosis in the soccer boots may help reduce the pressure and injury risk under the hallux, medial forefoot, central forefoot and medial heel. Furthermore, carefully textured orthosis in soccer boots can restore the movement discrimination score (the ability to distinguish small changes in the total inversion movement extent at the ankle) to barefoot levels, although the score when the players wore their soccer boots and socks was significantly worse than when they were barefoot.32 Hence, it seems possible to manufacture a soccer boot orthosis that reduces the plantar pressure and enhances the function of the ankle at the same time.
What is already known on this topic
-
Higher peak pressures occur during cutting, sprinting, and kicking movements compared with normal running.
-
Compared with normal running, higher pressures were found in the medial part of the foot in cutting movement, in the medial and central forefoot during sprinting, and in the lateral part of the foot during kicking.
What this study adds
-
Peak pressure and pressure-time integral were measured simultaneously.
-
Jump landing and sideward cutting were included.
-
Players’ respective dominant foot was analysed.
-
Sideward cutting and 45° cutting had higher pressure, whereas jump landing had lower pressure, compared with running.
-
Higher pressures were found on the medial side of the plantar surface.
Hodge et al22 reported that PTI is a more sensitive indicator than peak pressure in the aetiology of tissue damage19,20 and foot injury,21 as a greater increase was found in PTI than in peak pressure. PTI also has a higher association with pain than peak pressure,22 and has a greater differentiability than peak pressure when comparing the perceived comfort derived from different shoes during walking.12 In addition, PTI provides more information on plantar mechanical loading, as it includes both the amplitude of pressure and time during which the pressure is exerted.33 In line with this notion, we observed 11 more significant differences in PTI data than in the data from peak pressure (49 v.38, respectively). Thus, it is suggested that the analysis of PTI be included in further studies on soccer boots in order to provide information on both pressure and time duration.
In the present study, the dominant foot of the players was examined, taking into account the possibility of a different plantar pressure distribution between the feet of the soccer players. Indeed, most soccer players have a preferential dominant foot, with the other having different characteristics of force and use in the technical actions.34–37 However, there is no published evidence reporting the presence or absence of symmetrical pressure distribution between the dominant and the non-dominant foot in soccer. Therefore, this issue is also worth investigating in further studies, with the possibility of helping shoe manufacturers provide highly customised soccer boots, taking into account the specific characteristics of the dominant foot of the players.
In conclusion, the present study showed that the four soccer-related movements had a significant influence on the amplitude and distribution of pressure (fig 5). In general, sideward cutting and 45° cutting had a higher pressure, whereas jump landing had a lower pressure, compared with running. Among these movements, higher pressures were found on the medial side of the plantar surface. In particular, the hallux, medial forefoot, central forefoot and medial heel received higher pressures, suggesting that these areas may have higher risks of injury. This information may be useful in developing and implementing training, injury prevention and rehabilitation programmes, or in designing footwear. It is further suggested that foot orthosis may help reduce pressure and injury risk in soccer.

The peak pressure distributions of the four soccer-related movements.
Acknowledgments
The anthors thank Mr Henry YH Li for his assistance with statistics. The boots used in this study were sponsored by Diadora. This study was supported by the Innovation and Technology Fund, which is administered by the Innovation and Technology Commission, The Government of the Hong Kong Special Administrative Region.
REFERENCES
Footnotes
-
Published Online First 18 December 2006
-
Competing interests: None.