


Abstract
Objective. Patients with rheumatoid arthritis (RA) should start treatment early with the aim of suppressing the inflammatory process completely. It is not known if this strategy should, or can, be continued in later disease.
Methods. In a multicentre, randomized, observer-blinded, controlled trial, 466 patients with established RA (>5 yr), on stable therapy for at least 6 months, were randomized to adequate symptom control/shared care setting (SCSC) or aggressive treatment/hospital setting (ATH). All were reviewed annually by a rheumatologist. The primary outcome after 3 yr was the Health Assessment Questionnaire (HAQ). Others included the OMERACT core set and the Disease Activity Score (DAS) 28.
Results. Three hundred and ninety-nine patients completed the trial. There was a significant deterioration in HAQ in both arms. Only the physician global score differed between the arms.
Conclusions. The trial showed no additional benefit of intensified treatment with traditional disease modifying anti-rheumatic drugs (DMARDs) in patients with stable, established RA. It proved hard to suppress C-reactive protein levels. Patients in the SCSC arm were able to initiate treatment changes when their symptoms deteriorated without frequent hospital assessment. Pending further evidence, the model of shared care with annual hospital review is as good as 4-monthly hospital review for these patients.
Most rheumatoid arthritis (RA) clinical trials enrol patients with active or early disease, or both. Yet most patients attending rheumatology clinics with RA do not satisfy the entry criteria for such trials [1, 2]. There is, therefore, a poor evidence base when it comes to managing patients with long-standing, relatively inactive (but not quiescent) disease.
It is now well established that treatment in RA should be started early and, in the first few years, should be aggressive with the aim of suppressing all evidence of active inflammation. If achieved, this goal is likely to slow disease progression [3]. However, it is not clear whether this strategy can, or should, be carried on in patients with long-standing disease. It is well recognized that patients with long disease duration are less likely to respond to treatment [4, 5]. Even the biological agents do not completely suppress disease activity in the great majority of patients. Most patients completing the biological trials would still satisfy the entry criteria for those trials [6–8].
This trial enrolled patients with long-standing stable RA. None of them would have satisfied the British Society for Rheumatology (BSR)/National Institute for Health and Clinical Excellence (NICE) guidelines for treatment with biologic agents [9] at the time of enrolment, although the trial was started before the guidelines were published. Patients were randomly allocated either to ‘aggressive’ therapy (not based on particular drugs, since patients with long-standing disease have previously been exposed to a wide variety of medications) with the aim of suppressing all clinical evidence of joint inflammation or to ‘shared care’ with the aim of adequate symptom control. The aims of the trial were to establish firstly whether it is possible to suppress disease activity completely using traditional disease modifying anti-rheumatic drugs (DMARDs) in patients with long-standing RA, and secondly whether management in the shared care setting with annual review by a rheumatologist is in any way detrimental.
Methods
This multicentre, randomized, controlled, observer-blinded study was conducted in the five rheumatology centres of the British Rheumatoid Outcome Study Group (BROSG). Approval for the trial protocol was obtained from the research ethics committee of each centre.
Patients were recruited after giving informed consent. The inclusion and exclusion criteria were applied at the end of the clinic visit immediately preceding randomization (Table 1). Patients enrolled in the trial had had RA for at least 5 yr, were under long-term follow-up at that centre and, if on DMARD or steroid therapy, this had not been changed for at least 6 months. Patients were randomly allocated either to the symptom control/shared care (SCSC) or aggressive treatment/hospital (ATH) arm. No change in treatment was made at the baseline visit.
BROSG Trial: inclusion and exclusion criteria
| Inclusion criteria | Age ≥18 yr |
| Rheumatoid arthritis (1987 ACR criteria) [26] | |
| Current out-patient attendee for ≥12 months | |
| Disease duration ≥5 yr and <20 yra | |
| If on DMARD therapy or steroids, no change in drug or dosage for ≥6 months | |
| On no more than 7.5 mg prednisolone or equivalent daily | |
| Informed consent | |
| Exclusion criteria | Baseline HAQ score ≥2.5 |
| Pregnancy at the time of enrolment | |
| Major organ involvement from rheumatoid disease or rheumatoid vasculitis | |
| Current participation in another clinical trial | |
| Major co-morbidity—life expectancy of less than 5 yr due to other illness such as cancer or severe ischaemic heart disease |
aThe disease duration criterion was later amended so that all patients with a disease duration of 5 yr or more were eligible.
SCSC was managed predominantly in the primary care setting, thus evaluating a model of shared care that is being advocated in many parts of the UK [10]. The goal was to control joint pain, stiffness and related symptoms from the patient's perspective. The following treatment modalities were allowed: analgesics, non-steroidal anti-inflammatory drugs (NSAIDs), intra-articular steroid injections (maximum one per month), DMARDs (antimalarials, sulphasalazine, IM gold, penicillamine, azathioprine, methotrexate, leflunomide) and prednisolone up to 7.5 mg daily. Non-drug modalities, such as physiotherapy referral, were also allowed. DMARD therapy was monitored for safety using the current guidelines for each centre. Routine safety monitoring did not include measuring the erythrocyte sedimentation rate (ESR) or C-reactive protein (CRP). The patient was encouraged to visit the GP if (s)he developed new or deteriorating symptoms. The GP was provided with an algorithm (abbreviated form in Appendix 1) to guide treatment decisions and was asked to contact the rheumatologist if (s)he felt that a change in DMARD or steroid therapy was indicated. The patient had a contact telephone number for the research nurse. During 4-monthly visits to the patient's home, the nurse conducted a semi-structured interview. During this, the patient was asked whether they considered that the control of their pain and stiffness was satisfactory. Any problems identified were dealt with by the nurse, or referred to the GP or hospital at her discretion.
The ATH arm was managed predominantly in the hospital setting. The goal was to control joint pain, stiffness and related symptoms, and to suppress clinical and laboratory evidence of inflammation [i.e. to minimize the number of inflamed joints and to keep the CRP below twice the upper limit of normal (2ULN)]. Given the patients’ long-standing disease, it was felt unrealistic to get the CRP into the normal range. Any of the SCSC drugs plus ciclosporin, parenteral steroids, prednisolone up to 10 mg daily and cyclophosphamide (see abbreviated algorithm in Appendix 1) were allowed. Non-drug modalities and hospital admissions could also be used. Existing arrangements for safety monitoring of the DMARD therapy were continued. The patient attended the rheumatology clinic at least once every 4 months. At each clinic visit the ESR and CRP were measured and the number of inflamed joints assessed.
Outcome measures
The primary outcome measure was physical function measured using the Stanford Health Assessment Questionnaire (HAQ) [11] adapted for British use [12]. The study used the OMERACT set of core outcome measures [13]. Pain and global assessments were measured using a 10 cm visual analogue scale (VAS). The physician global assessment (PhyGA), ranged from 0 ‘very well’ to 100 ‘very unwell’. The patient global assessment (PtGA) scale ranged from 0 ‘worst imaginable state of health’ to 100 ‘best imaginable state of health’. A 28-tender joint and swollen joint count was performed and used to compute the DAS-28 score [14]. The Overall Status in Rheumatoid Arthritis (OSRA) score, an observer-administered instrument which assesses RA disease activity and damage, each on a 0–10 scale, was also measured [15]. The measurements performed at each assessment are listed in Table 2. Every patient was screened annually by a consultant rheumatologist for the systematic complications of RA by examining the skin, heart, lungs, abdomen and peripheral nerves, by routine urinalysis and by carrying out a full blood count and biochemical profile [16]. Further investigations were requested if necessary and treatment was modified if any systemic complications were found.
Summary of follow-up assessments
| SCSC Arm | ATH Arm | |
|---|---|---|
| 4 monthly | HAQ | HAQ, ESR, CRP, tender and swollen joint count |
| Annual | OMERACT core set, OSRA, DAS-28, assessment of extra articular features | OMERACT core set, OSRA, DAS-28, assessment of extra articular features |
| Beginning and end of study | X-rays of hands and feet | X-rays of hands and feet |
SCSC, symptom control/shared care arm; ATH, aggressive treatment/hospital arm.
Each centre nominated one or more ‘blinded assessors’ (rheumatologists or specialist nurses) who performed the annual joint examination and OSRA. They were not involved in the day-to-day care of the trial participants whom they assessed and were blind to treatment allocation. As far as possible, each patient was examined by the same blinded assessor throughout the trial. The blinded assessors attended training sessions before and twice during the trial. In 1999 (the third session), the intraclass correlation coefficient (ICC) for the tender 28-joint count was 0.93 and for the swollen 28-joint count was 0.78.
Sample size
Published data suggest a standard deviation (s.d.) of 0.76 for HAQ for RA patients with disease of more than 5 yr duration [17]. A change in HAQ >0.22 has been shown to be clinically relevant [18]. One hundred and ninety-nine patients per group would be needed in order to detect a difference in HAQ score of 0.25 between the groups with a power of 90% and significance of 5%. Allowing for 20% loss to follow-up, we aimed to recruit 480 patients.
Randomization
Randomization was carried out using a computerized minimization program with minimization on age (<35, 35–54, ≥55 yr), gender, treatment centre and disease duration (<10, 10–14, ≥15 yr).
Treatment success and compliance
Treatment success was judged at each 4-monthly visit. In the SCSC arm, treatment success was defined as adequate symptom control. In the ATH arm, treatment success was defined as symptom control plus no actively inflamed (i.e. tender and swollen) joints and CRP less than 2ULN. Failure to change treatment, if indicated, on two consecutive occasions was defined as ‘non-compliance with the protocol’. Patients who had been assessed on at least seven occasions and had symptom control (both arms) and no evidence of disease activity (ATH arm only) were defined as ‘overall treatment successes’.
X-ray reading
X-rays were read by Dr J. Saklatvala, Consultant Musculoskeletal Radiologist, Staffordshire Rheumatology Centre, blind to treatment allocation, using the Larsen method [19]. Each patient's X-rays were read as a set, with the order of the X-rays known. The metacarpophalangeal (MCP) 1–5, proximal interphalangeal (PIP) 1–5 and metatarsophalangeal (MTP) 2–5 joints were scored. The potential range of Larsen scores was 0 to 190. JS read 19 sets of X-rays on two occasions some months apart to assess intraobserver variability. The ICC coefficient for the Larsen score was 0.92 and for the eroded joint count was 0.97. For practical reasons, a second X-ray reader was not employed, but it is accepted that precision would have been further enhanced if one had been used.
Generalizability
Clinic review weeks were held in November 1997, 1998 and 1999 in order to determine the proportion of RA patients to whom the trial could be generalized. A questionnaire was placed on the front of each set of notes which listed the inclusion and exclusion criteria for the trial. All rheumatology clinics were included, as were patients who were already recruited to the BROSG trial.
Statistical methods
All data were analysed using STATA release 7 [20]. Patients were analysed according to the intention-to-treat principle, subject to the availability of follow-up data. Baseline predictors of loss to follow-up were identified for each outcome measure using logistic regression, and the analysis was then adjusted for these predictors. The statistical analysis also checked for interaction between treatment effect and treatment centre.
Primary outcome (HAQ)
Mean HAQ scores for the two treatment arms at 36 months were compared using analysis of co-variance (ANCOVA) including the patient's baseline HAQ score, age at randomization, gender, disease duration and treatment centre as co-variates. A linear mixed-effect model for longitudinal data [21] was fitted to the 4-monthly HAQ scores. Variance terms were included in the model to account for variation between patients in terms of average HAQ (intercept) and rate of change (gradient) of HAQ. This may be thought of as fitting an individual regression line to each patient but within a single statistical model. Models with and without terms for the mean gradient and intercept were compared using a likelihood ratio test. Normal probability plots were used to check the model's assumption of a normal distribution for the residuals for variation between patients and HAQ scores for each patient.
Secondary outcome measures
ANCOVA was used to compare the mean values of the secondary outcomes at 36 months adjusted for baseline values. There was a floor and ceiling effect for the VAS scales and skewness for joint counts. Confidence intervals were calculated using the non-parametric bootstrap [22]. These gave results that were very similar to parametric confidence intervals that assume normality.
Results
Four hundred and sixty-six patients were recruited to the study during 1997–1998, 233 to each arm. Due to a communication error, one patient allocated to the SCSC arm was recorded at the centre as being allocated to the ATH arm and managed accordingly. For the intention-to-treat analysis, this patient was analysed in the SCSC arm. As a result of an error in the minimization program, counts from Stoke and Macclesfield were pooled. Consequently, there were proportionately more patients in the ATH arm at Macclesfield (61%) and fewer in Stoke (47%). However, overall the treatment arms were well balanced with respect to age, gender, disease duration and number of previous DMARDs (Table 3).
Baseline demographic characteristics
| SCSC arm | ATH arm | Total | |
|---|---|---|---|
| Female | 159 (68.2%) | 158 (67.8%) | 317 (68.0%) |
| Age at randomization (yr), mean (s.d.) | 60.4 (11.1) | 60.8 (11.3) | 60.6 (11.2) |
| Disease duration (yr), mean (s.d.) | 12.6 (6.7) | 12.5 (6.8) | 12.5 (6.7) |
| Number of previous failed DMARDs, mean (s.d.) | 1.3 (0.7) | 1.4 (0.7) | 1.4 (0.7) |
Patient follow-up rates
Seventeen (3.6%) patients died during follow-up, seven from the SCSC and ten from the ATH arm (Fig. 1). In addition, 50 patients (10.7%) were either lost to follow-up or withdrew. Thus 399 patients (85.6%) completed the study. However, two patients did not complete a HAQ at their final assessment and seven patients who had withdrawn from the study completed a final HAQ by telephone. HAQ data at 3 yr were, therefore, available on 404 patients. Four hundred and forty patients (94.4%) attended for their first year follow-up, 412 (88.4%) for their first and second year follow-up, and 399 (85.6%) for their first, second and third year follow-up. Data on all the OMERACT core set outcome measures were available for 451 out of 466 patients at baseline and 380 out of 399 patients at final follow-up (Table 4).
Baseline and 36-month values for OMERACT core set variables plus the OSRA and DAS-28
| Group 1: SCSC | Group 2: ATH | ||||||||||||
|---|---|---|---|---|---|---|---|---|---|---|---|---|---|
| Mean | s.d. | n | Mean | s.d. | n | ANCOVA adjusted mean differencea (95% CIb) | P value | ||||||
| HAQ | Baseline | 1.25 | 0.68 | 233 | 1.31 | 0.72 | 233 | ||||||
| 36 months | 1.40 | 0.73 | 202 | 1.45 | 0.76 | 204 | 0.02 (−0.07, 0.11) | 0.71 | |||||
| Patient global (mm) | Baseline | 62.2 | 18.0 | 222 | 64.9 | 17.6 | 229 | ||||||
| 36 months | 59.0 | 20.5 | 195 | 59.7 | 19.7 | 194 | −0.23 (−4.02, 3.57) | 0.91 | |||||
| Physician global (mm) | Baseline | 23.5 | 18.6 | 229 | 25.2 | 18.0 | 231 | ||||||
| 36 months | 27.7 | 21.8 | 188 | 24.6 | 20.3 | 195 | −3.70 (−7.45, −0.05) | 0.05 | |||||
| Tender joint count | Baseline | 5.7 | 6.3 | 229 | 4.6 | 5.4 | 231 | ||||||
| 36 months | 5.0 | 5.9 | 197 | 4.4 | 5.7 | 200 | 0.08 (−0.85; 1.01) | 0.87 | |||||
| Swollen joint count | Baseline | 4.5 | 4.5 | 229 | 3.9 | 3.8 | 232 | ||||||
| 36 months | 3.2 | 3.8 | 197 | 2.7 | 2.9 | 199 | −0.34 (−0.96, 0.27) | 0.270 | |||||
| Pain (mm) | Baseline | 41.8 | 23.1 | 222 | 42.5 | 23.2 | 239 | ||||||
| 36 months | 46.1 | 23.1 | 195 | 44.3 | 23.6 | 194 | −1.54 (−5.86, 2.78) | 0.48 | |||||
| ESR (mm/h) | Baseline | 22.8 | 21.9 | 218 | 24.9 | 23.7 | 221 | ||||||
| 36 months | 23.1 | 17.6 | 182 | 24.5 | 21.9 | 188 | 0.80 (−2.78, 4.37) | 0.66 | |||||
| DAS-28 | Baseline | 4.12 | 1.28 | 210 | 3.96 | 1.24 | 219 | ||||||
| 36 months | 3.96 | 1.23 | 180 | 3.82 | 1.25 | 182 | −0.04 (−0.26, 0.18) | 0.69 | |||||
| Larsen score | Baseline | 70.6 | 38.5 | 197 | 70.6 | 41.34 | 209 | ||||||
| 36 months | 78.6 | 39.6 | 169 | 77.9 | 42.4 | 176 | −1.58 (−3.69, 0.52) | 0.14 | |||||
| Eroded joint count | Baseline | 11.8 | 7.7 | 197 | 12.1 | 8.2 | 209 | ||||||
| 36 months | 13.1 | 7.8 | 169 | 13.1 | 8.2 | 176 | −0.34 (−0.94, 0.26) | 0.27 | |||||
| OSRA disease activity score | Baseline | 2.27 | 1.79 | 229 | 2.27 | 1.75 | 231 | ||||||
| 36 months | 2.28 | 1.74 | 187 | 1.82 | 1.63 | 198 | −0.40 (−0.71, −0.10) | 0.01 | |||||
| OSRA damage score | Baseline | 2.23 | 1.57 | 2.29 | 2.24 | 1.55 | 231 | ||||||
| 36 months | 2.54 | 1.70 | 187 | 2.43 | 1.69 | 198 | −0.05 (−0.31, 0.21) | 0.70 | |||||
| % | n/N | % | n/N | ||||||||||
| CRP >twice upper limit | Baseline | 29.1 | 66/227 | 227 | 29.8 | 68/228 | 228 | ||||||
| 36 months | 26.3 | 49/186 | 186 | 28.4 | 55/194 | 194 | |||||||
aAdjusted for baseline value of variable, age, gender, treatment centre, disease duration and patient global assessment.
bConfidence interval based on the non-parametric bootstrap.
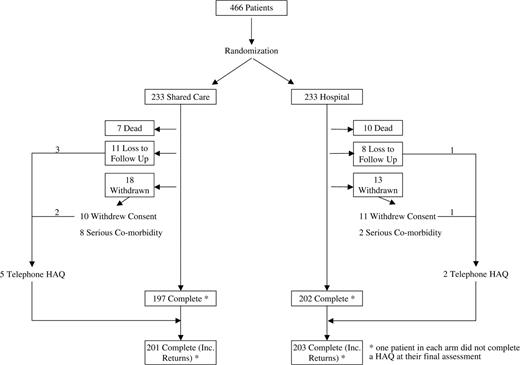
Trial flowsheet.
Primary outcome
The mean HAQ score deteriorated significantly in both treatment arms during the course of the trial (Fig. 2). The mean HAQ rose from 1.25 to 1.40 (P = 0.04) in the SCSC arm, and from 1.31 to 1.45 (P = 0.04) in the ATH arm. The adjusted mean difference between the two treatment arms was not significant (0.02; 95% CI −0.07, 0.11; P = 0.71).
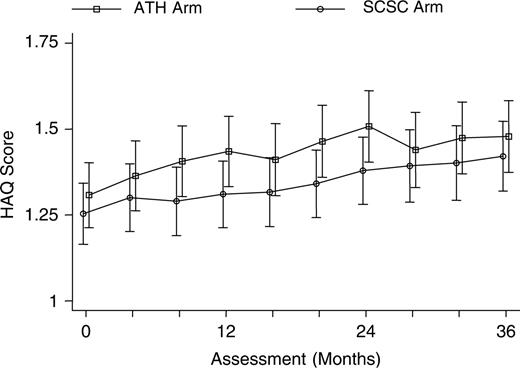
HAQ score by assessment and intervention group.
At least one follow-up assessment was obtained for 226 (97%) patients in the SCSC and 231 (99%) in the ATH arm. As expected, assessment number was a strong predictor of missing data (P = 0.0005). The longitudinal mixed-effect regression model showed a significant variation in the intercept, indicating variability between patients in their average HAQ score across time points [likelihood ratio (LR) χ12 = 2286.4, P<0.0001]. There was also significant variation between patients in the gradient for the rate of increase in HAQ score (LR χ12 = 1849.4, P<0.0001). Subsequent analyses, therefore, included a random intercept term and a random gradient term. Although there were slight differences in the gradients for each treatment arm (Fig. 2), there was no evidence of an interaction between time since randomization and treatment group (LR = χ12 1.06, P = 0.303). The difference in increase of HAQ over time for the ATH arm compared with the SCSC arm was −0.014 (95% CI −0.041, 0.013; P = 0.30) units per year after adjustment for baseline co-variates. Thus disease progression was the same in both groups. The estimated average increase in HAQ score was 0.051 (95% CI 0.037, 0.065) units per year.
There was a systematic difference of approximately 0.1 in the mean HAQ score between the treatment arms across all time points. Adjustment for baseline HAQ only halved the average difference, with the SCSC group having a persistently lower mean score [adjusted mean difference 0.054 (95% CI −0.003, 0.111)]. This difference was of borderline statistical significance (LR χ12 = 3.48, P = 0.06). The difference between the two treatment arms is equivalent to approximately 1 yr of disease, after adjustment for baseline. Baseline HAQ (P<0.0001) and baseline PtGA (P<0.0001) were strong predictors and disease duration (P = 0.05) was a weak predictor of HAQ score during follow-up.
Secondary outcomes
The total Larsen score deteriorated in both arms (Table 4). The deterioration was less in the ATH arm but this was not statistically significant. PhGA was the only OMERACT outcome measure which differed significantly between the treatment arms in favour of the ATH treatment arm [−3.70 mm (95% CI −7.45, −0.05)]. The DAS-28 fell in both arms but the adjusted mean difference (−0.04, 95% CI −0.26, 0.18) in favour of the ATH arm was not significant. The mean OSRA activity scores improved significantly in the ATH arm but did not change in the SCSC arm. The adjusted mean difference for the activity score was −0.40 (95%CI −0.71, −0.10) in favour of the ATH arm. The OSRA damage score increased significantly in the SCSC but not in the ATH arm. However, the adjusted mean difference was not significant (−0.05; 95% CI −0.31, 0.21). There was no evidence of any interaction between treatment group and treatment centre for any of the outcomes.
Patients in the ATH and SCSC arms were equally likely to have a raised CRP (above 2ULN for the centre) at the end of the trial [adjusted risk ratio (RR) = 1.09; 95% CI 0.79, 1.50] (Table 4).
Efficacy analysis
Although the two treatment arms had similar outcomes at 3 yr, there were trends in favour of the ATH arm for OSRA disease activity and PhGA (significant), and DAS-28 and X-ray changes (non-significant). There are five possible explanations for the observed results:
Patients in the ATH treatment arm did not have evidence of ongoing disease activity and so treatment changes were not indicated.
Patients in the ATH treatment arm had evidence of disease activity but the physician did not act on this (or the patient refused to take any additional treatment).
Patients in the ATH arm did have evidence of disease activity and their treatment was changed but this did not result in improved disease activity.
Patients in the ATH arm had evidence of disease activity, their treatment was changed and their condition improved—but this still had no effect on outcome. This would either mean that treatment is ineffective in this group or the goal should have been set higher (e.g. normalizing the CRP).
Patients in the SCSC arm had their treatment changed as often as the patients in the ATH arm.
For this analysis, the patient who was allocated to the SCSC but inadvertently managed as being in the ATH arm was analysed in the ATH arm.
Only 21 patients (10%) in the ATH arm who completed the trial had no indication for a change in treatment at any point in the follow-up period. Thus there was evidence of disease activity in the ATH arm patients. There is evidence that the physician did change treatment in patients in the ATH arm with active disease. The proportion of patients on methotrexate increased from 21 to 38%, and on combination therapy increased from 7 to 22% during the trial. The mean dose of methotrexate and steroids also rose (Table 5). Patients in the ATH arm were significantly more likely to start methotrexate [odds ratio (OR) 1.93; 95%CI 1.11, 3.37] and combination therapy (OR 2.10; 95% 1.13, 3.91) than the SCSC arm at the end of the trial.
Number of patients on DMARDs or steroids at the beginning and end of the trial
| SCSC arm | ATH Arm | |||||||||||||
|---|---|---|---|---|---|---|---|---|---|---|---|---|---|---|
| Number (%) | Mean dose (mg) | s.d. | Number (%) | Mean dose (mg) | s.d. | OR (adjusted for baselinea, centre and disease duration | 95% CI | P value | ||||||
| Any DMARD | Baseline | 170/219 (78) | – | – | 176/215 (82) | |||||||||
| 36 months | 148/184 (80) | – | – | 156/189 (83) | 1.12 | 0.61–2.05 | 0.716 | |||||||
| Methotrexate (mg/week) | Baseline | 44 (20) | 10.5 | 4.3 | 45 (21) | 11.4 | 4.7 | |||||||
| 36 months | 49 (27) | 11.7 | 4.6 | 71 (38) | 14.1 | 5.5 | 1.93 | 1.11–3.37 | 0.020 | |||||
| Sulphasalazine (mg/day) | Baseline | 77 (35) | 1230 | 739 | 73 (34) | 1500 | 799 | |||||||
| 36 months | 69 (38) | 2040 | 691 | 60 (32) | 2050 | 705 | 0.81 | 0.45–1.48 | 0.495 | |||||
| IM gold (Myocrisin) (mg/month) | Baseline | 23 (11) | 46.1 | 10.8 | 21 (10) | 45.7 | 10.8 | |||||||
| 36 months | 21 (11) | 43.8 | 13.2 | 20 (11) | 40.5 | 15.0 | 0.83 | 0.35–1.97 | 0.680 | |||||
| Penicillamine (mg/day) | Baseline | 20 (9) | 381.3 | 231.1 | 26 (12) | 370.2 | 233.1 | |||||||
| 36 months | 14 (8) | 437.5 | 168.1 | 14 (7) | 562.5 | 188.3 | 0.55 | 0.16–1.87 | 0.336 | |||||
| Prednisolone (mg/day) | Baseline | 18 (8) | 5.0 | 2.1 | 18 (8) | 5.2 | 2.4 | |||||||
| 36 months | 19 (10) | 5.4 | 2.0 | 19 (10) | 6.3 | 2.4 | 0.94 | 0.36–2.44 | 0.897 | |||||
| Combination therapy | Baseline | 10 (5) | – | – | 15 (7) | – | – | |||||||
| 36 months | 23 (13) | – | – | 41 (22) | – | – | 2.10 | 1.13–3.91 | 0.019 | |||||
aWhether or not the patient was on the drug being analysed at baseline.
However, during the trial there were 157 occasions in 47 patients (18% of the ATH patients) of ‘non-compliance’. For 50% of occasions no reason was given. On the remaining occasions, either the patient refused (25%) or the consultant did not feel the next step on the treatment algorithm could be clinically justified (25%). This was usually because there was another explanation for a high CRP or the patient had a high CRP and was well with no inflamed joints. There were only two patients who had both high CRP and inflamed joints on two (or more) consecutive occasions and in whom further changes were not thought to be justified. Intercurrent illness precluded an increase in DMARD therapy in three patients.
Forty-nine per cent of patients in the ATH arm were overall treatment successes (Table 6). This was approximately the same proportion that could be defined as treatment successes at each individual visit. Thus the changes in treatment were not producing lasting benefit to the patient. Patients had relatively inactive disease when enrolled in the trial. Nevertheless, it is possible to apply the EULAR response criteria [23] to the DAS-28 scores at the beginning and end of the trial. Based on this, 31% of the ATH and 33% of the SCSC arm were good or moderate responders. At the end of the trial, 23 patients in the SCSC (14%) and 34 patients in the ATH arm (20%) were in remission (DAS-28 score <2.6).
Treatment success at the final visit (patients who had been assessed on at least seven occasions during the trial)
| SCSC arm | ATH arm | |
|---|---|---|
| Symptom control | 123/192 = 64.1% | 133/189 = 70.4% |
| CRP less than twice upper limit of normal | – | 126/189 = 66.7% |
| No actively inflamed joints | – | 133/189 = 70.4% |
| All three of the above | – | 92/89 = 48.7% |
| SCSC arm | ATH arm | |
|---|---|---|
| Symptom control | 123/192 = 64.1% | 133/189 = 70.4% |
| CRP less than twice upper limit of normal | – | 126/189 = 66.7% |
| No actively inflamed joints | – | 133/189 = 70.4% |
| All three of the above | – | 92/89 = 48.7% |
Treatment was changed in SCSC arm patients more often (56% of patients) than might have been anticipated. The patients in this arm of the trial were obviously able to access specialist rheumatology care and to have their treatment changed when symptom control deteriorated.
External validity
One thousand eight hundred and ninety-nine patients attended rheumatology clinics at the five centres during the three clinic review weeks. Seven hundred and sixty-two (40%) were classified as having RA. A similar percentage of RA patients was eligible for the study in 1997 (30%) and 1998 (33%). In 1999, 42% of the RA patients were eligible. Thus, the BROSG Trial results will be generalizable to at least one-third of current rheumatology clinic attendees in the UK with RA.
Discussion
The results of this trial have important implications for clinical practice. It recruited from that substantial group of patients who have ‘grumbling’ low-grade disease activity and remain under regular follow-up. The clinic review weeks showed that this group constitute at least one-third of all clinic attendees with RA. Both treatment arms experienced a significant deterioration in the HAQ. The mean adjusted increase in HAQ score over the 3 yr was 0.05 units per year (95% CI 0.04, 0.07). In a 5-yr longitudinal study of 245 RA patients, Gardiner et al. [24] reported a mean increase in HAQ of 0.03 units/yr. Their study included both early and established RA. Wolfe [25] also reported a mean increase of 0.03 units/yr. Thus, patients in this trial showed a decline in physical function at a higher rate than that reported in the literature. This is perhaps surprising because the patients enrolled in the BROSG trial had stable RA with low disease activity. The mean number (s.d.) of swollen joints was 3 (4.2) at the beginning of the study and 2 (2.9) at the end of the study. These patients would not be eligible for entry into the great majority of RA clinical trials. Other authors have also drawn attention to the fact that the majority of patients attending clinics for treatment for RA have neither disease that is sufficiently active for enrolment in a clinical trial nor disease that is in remission [1, 2]. The results of the present trial indicate that these patients continue to deteriorate despite current therapy. The trial did achieve modest success in reducing disease activity but this was not sufficient to influence physical function. The conclusion must either be that management focusing on symptom control with annual review by a rheumatologist is the best that can be achieved or that much more aggressive therapy (perhaps including biological therapy) is needed to suppress the disease activity completely.
The final number of patients recruited to the trial (466) was less than the original target (480). However, the original sample size calculations had allowed for 20% loss to follow-up. A trial of 466 patients would still have sufficient power to detect a difference in HAQ of 0.25 providing follow-up did not fall below 18%. All centres felt, at the end of 17 months, that they had probably recruited all eligible (and consenting) patients. This adds to the external generalizability of the study.
This was a pragmatic trial and the only the blinded assessor was unaware of treatment allocation. The PhGA was completed by the unblinded physician so may have been subject to bias.
The management in the two treatment arms was more similar than anticipated. Fifty-six per cent of patients in the SCSC arm (vs 77% in the ATH arm) had at least one change in DMARD therapy. Some of these changes were simply an increase in dose of an existing DMARD. There was no evidence that these changes were being initiated because an ATH management policy was being followed—the GP, nurse and consultant did not have access to measurements of the ESR or CRP and (given what happened in the ATH arm) it is unlikely that they changed the treatment if they saw one or two swollen but asymptomatic joints. The fact that these treatment changes were made in the shared care setting is reassuring as it means that so long as stable RA patients are reviewed regularly by a rheumatology nurse and seen annually by a consultant, any need to change treatment is likely to be detected.
Another reason why the management in the two groups was similar was because treatment was not changed as often as it should have been in the ATH arm. Eighteen per cent of patients in the ATH arm showed ‘non-compliance with the protocol’. Both rheumatologists and patients found it hard to change treatment for only minor evidence of disease activity. A raised CRP in isolation was often attributed by the rheumatologist to causes other than active RA. Patients recruited to the study had stable disease and may have been on the same therapy for many years. It might be easier to test the hypothesis that complete suppression of disease activity improves outcome in RA by recruiting patients with active RA who have to change their DMARD therapy—and just continuing to add in new therapy until the disease is completely suppressed. A recent trial demonstrated the success of this strategy in patients with early (<5 yr duration) RA [3]. Finally, some patients in the ATH arm never had any indication to change their treatment. They clearly did not benefit from more frequent hospital assessment.
The fundamental hypothesis of the trial that aggressive treatment (i.e. complete suppression of all evidence of disease activity) in patients with established RA would slow disease progression could not be answered. The main reason for this was that disease activity could not be suppressed in a sustained way to a level with the CRP of 2ULN let alone to a normal level. If this could not be achieved in the context of a clinical trial, it could not be achieved in routine practice. The initial treatment options reflected practice in 1997 and more combination therapy was used as the trial progressed. Only 15 (3%) of patients in this trial would have satisfied the UK criteria for treatment with biological agents at any time point in the trial [9]. Nevertheless, these patients deteriorated despite conventional DMARD therapy. It is a challenging thought that biological agents might have prevented such deterioration. However, there is no evidence at present that biological drugs can completely suppress disease activity in patients with severe RA, nor as to their efficacy in patients with low-grade disease activity. It is important to emphasize that stable, long-standing RA is not a benign condition and that such patients need to remain under at least annual hospital review. Pending further evidence, the model of shared care is as good as 4-monthly hospital review.
Appendix 1
Choosing a second-line drug
For the purposes of this trial, DMARDs are considered in three categories:
Category 1: sulphasalazine, antimalarials
Category 2: IM gold, methotrexate
Category 3: penicillamine, azathioprine, leflunomide (new drug licensed during the study)
The clinician has a number of options which include:
| 0 | Do nothing |
| 1 | Category 1 drug |
| 2 | Category 2 drug |
| 3 | Category 3 drug |
| 4 | Increase steroids to max. 7.5 mg |
| 5 | Increase steroids to max. 10 mg |
| 6 | Start oral steroids |
| 7 | IM steroids |
| 8 | IV steroids |
| 9 | Ciclosporin |
| 10 | Cyclophosphamide |
| 0 | Do nothing |
| 1 | Category 1 drug |
| 2 | Category 2 drug |
| 3 | Category 3 drug |
| 4 | Increase steroids to max. 7.5 mg |
| 5 | Increase steroids to max. 10 mg |
| 6 | Start oral steroids |
| 7 | IM steroids |
| 8 | IV steroids |
| 9 | Ciclosporin |
| 10 | Cyclophosphamide |
| 0 | Do nothing |
| 1 | Category 1 drug |
| 2 | Category 2 drug |
| 3 | Category 3 drug |
| 4 | Increase steroids to max. 7.5 mg |
| 5 | Increase steroids to max. 10 mg |
| 6 | Start oral steroids |
| 7 | IM steroids |
| 8 | IV steroids |
| 9 | Ciclosporin |
| 10 | Cyclophosphamide |
| 0 | Do nothing |
| 1 | Category 1 drug |
| 2 | Category 2 drug |
| 3 | Category 3 drug |
| 4 | Increase steroids to max. 7.5 mg |
| 5 | Increase steroids to max. 10 mg |
| 6 | Start oral steroids |
| 7 | IM steroids |
| 8 | IV steroids |
| 9 | Ciclosporin |
| 10 | Cyclophosphamide |
Begin by deleting all those drugs to which the patient has previously failed to respond, developed serious adverse reactions to or which are contraindicated (e.g. methotrexate in patients with high alcohol consumption). If any drug remains, apart from the one(s) which the patient is currently taking, apply the appropriate algorithm.
Algorithm 1: treatment choices for patients in the shared-care arm
| Current 2nd line | Problem | Solutiona |
|---|---|---|
| None | 1 → 2 | |
| Category I | Adverse reaction | Stop drug → 0 → 1 → 2 → 3 → 4 → 6 |
| Inefficacy | Increase dose → stop drug → 2 → 3 → 4 → 6 → 1 | |
| Category 2 | Adverse reaction | Stop drug → 0 → 2 → 3 → 4 → 6 → 1 |
| Inefficacy | Increase dose → stop drug → 2 → 3 → 4 → 6 → 1 | |
| Category 3 | Adverse reaction | Stop drug → 2 → 4 → 6 → 1 → 3 |
| Inefficacy | Increase dose → stop drug → 2 → 4 → 6 → 1 → 3 | |
| Oral steroids | Inefficacy | 4 → 2 → add azathioprine |
aThe numbers refer to the options list above. Consider options in order. Record reasons for rejecting each solution, e.g. no drug available in category.
| Current 2nd line | Problem | Solutiona |
|---|---|---|
| None | 1 → 2 | |
| Category I | Adverse reaction | Stop drug → 0 → 1 → 2 → 3 → 4 → 6 |
| Inefficacy | Increase dose → stop drug → 2 → 3 → 4 → 6 → 1 | |
| Category 2 | Adverse reaction | Stop drug → 0 → 2 → 3 → 4 → 6 → 1 |
| Inefficacy | Increase dose → stop drug → 2 → 3 → 4 → 6 → 1 | |
| Category 3 | Adverse reaction | Stop drug → 2 → 4 → 6 → 1 → 3 |
| Inefficacy | Increase dose → stop drug → 2 → 4 → 6 → 1 → 3 | |
| Oral steroids | Inefficacy | 4 → 2 → add azathioprine |
aThe numbers refer to the options list above. Consider options in order. Record reasons for rejecting each solution, e.g. no drug available in category.
If no suitable solution can be found and the patient still has symptomatic disease, the patient will have to be brought back into the hospital system.
Algorithm 2: treatment choices for patients in the hospital arm
| Current 2nd line | Problem | Solutiona |
|---|---|---|
| None | 1 → 2 → 6 | |
| Category 1 | Adverse reaction | Stop drug → 1 → 2 → 3 → 5 → 6 |
| Inefficacyb | Partial response: increase dose → add in → l → 5 → stop drug | |
| No response: increase dose → stop drug → 2 → 3 → 5 → 6 → 9 | ||
| Category 2 | Adverse reaction | Stop drug → 2 → 3 → 5 → 6 → 9 |
| Inefficacyb | Partial response: increase dose → add in → 1 → 5 → 6 → stop drug | |
| No response: increase dose → stop drug → 2 → 3 → 5 → 6 → 9 | ||
| Category 3 | Adverse reaction | Stop drug → 2 → 3 → 5 → 6 |
| Inefficacyb | Partial response: increase dose → 5 → 6 → stop drug | |
| No response: increase dose → stop drug → 2 → 5 → 6 → 1 → 9 | ||
| Combination | Adverse reaction | Stop most likely drug and review |
| Inefficacyb | Partial response: increase dose of drug(s) → 5 → 6 → stop both drugs | |
| No response: increase dose of drug(s) → stop both drugs → 2 → 3 → 5 → 6 → 9 | ||
| Prednisolone | Inefficacyb | 5 → 2 → add azathioprine → 9 |
| Ciclosporin | Adverse reaction | Stop drug |
| Inefficacyb | 5 → 6 → add methotrexate → stop drug | |
| No available options | Active disease | Consider 10 |
aThe number refers to the options list above. Consider options in order. Record reasons for rejecting each solution, e.g. no drug available in category.
bConsider option 7 if symptomatic or raised CRP and therapy has been changed within last 6 months or if further change is considered premature. Consider option 8 if patient experiences an acute flare or to try and regain disease control while starting new therapy.
| Current 2nd line | Problem | Solutiona |
|---|---|---|
| None | 1 → 2 → 6 | |
| Category 1 | Adverse reaction | Stop drug → 1 → 2 → 3 → 5 → 6 |
| Inefficacyb | Partial response: increase dose → add in → l → 5 → stop drug | |
| No response: increase dose → stop drug → 2 → 3 → 5 → 6 → 9 | ||
| Category 2 | Adverse reaction | Stop drug → 2 → 3 → 5 → 6 → 9 |
| Inefficacyb | Partial response: increase dose → add in → 1 → 5 → 6 → stop drug | |
| No response: increase dose → stop drug → 2 → 3 → 5 → 6 → 9 | ||
| Category 3 | Adverse reaction | Stop drug → 2 → 3 → 5 → 6 |
| Inefficacyb | Partial response: increase dose → 5 → 6 → stop drug | |
| No response: increase dose → stop drug → 2 → 5 → 6 → 1 → 9 | ||
| Combination | Adverse reaction | Stop most likely drug and review |
| Inefficacyb | Partial response: increase dose of drug(s) → 5 → 6 → stop both drugs | |
| No response: increase dose of drug(s) → stop both drugs → 2 → 3 → 5 → 6 → 9 | ||
| Prednisolone | Inefficacyb | 5 → 2 → add azathioprine → 9 |
| Ciclosporin | Adverse reaction | Stop drug |
| Inefficacyb | 5 → 6 → add methotrexate → stop drug | |
| No available options | Active disease | Consider 10 |
aThe number refers to the options list above. Consider options in order. Record reasons for rejecting each solution, e.g. no drug available in category.
bConsider option 7 if symptomatic or raised CRP and therapy has been changed within last 6 months or if further change is considered premature. Consider option 8 if patient experiences an acute flare or to try and regain disease control while starting new therapy.
This project was funded by the NHS Executive, UK (NHS HTA project number 94/454/02). The views and opinions expressed within do not necessarily reflect those of the NHS Executive. The NHS Executive commissioned this work but played no part in the design, data collection, analysis, interpretation, report writing or decision to publish this paper.
We gratefully acknowledge the help of the rheumatologists and specialist rheumatology nurses in the BROSG centres. We are grateful to Dr C. Ehrhardt who referred some of the patients to the King's College recruitment centre. We are also grateful for help from Alex Clarke in the final analysis of the data. The Arc Epidemiology Unit is funded by a programme grant from the Arthritis Research Campaign, UK.
The authors have declared no conflicts of interest.
References
Sokka T, Pincus T. Most patients receiving routine care for rheumatoid arthritis in 2001 did not meet inclusion criteria for most recent clinical trials or American College of Rheumatology criteria for remission.
Kvien TK, Mikkelsen K, Nordvag BY. Results from controlled clinical trials: how relevant for clinical practice?
Grigor C, Capell H, Stirling A et al. Effect of a treatment strategy of tight control for rheumatoid arthritis (the TICORA study): a single-blind randomised controlled trial.
Anderson JJ, Wells G, Verhoeven AC, Felson DT. Factors predicting response to treatment in rheumatoid arthritis: the importance of disease duration.
Hider SL, Buckley C, Silman AJ, Symmons DP, Bruce IN. Factors influencing response to disease modifying antirheumatic drugs in patients with rheumatoid arthritis.
Lipsky PE, van der Heijde DM, St Clair EW et al. Infliximab and methotrexate in the treatment of rheumatoid arthritis. Anti-Tumor Necrosis Factor Trial in Rheumatoid Arthritis with Concomitant Therapy Study Group.
Moreland LW, Schiff MH, Baumgartner SW et al. Etanercept therapy in rheumatoid arthritis. A randomized, controlled trial.
Klareskog L, van der Heijde D, de Jager JP et al. Therapeutic effect of the combination of etanercept and methotrexate compared with each treatment alone in patients with rheumatoid arthritis: double-blind randomised controlled trial.
National Institute for Clinical Excellence.
Kirwan JR, Mitchell K, Hewlett S et al. Clinical and psychological outcome from a randomized controlled trial of patient-initiated direct-access hospital follow-up for rheumatoid arthritis extended to 4 years.
Fries JF, Spitz P, Kraines RG, Holman HR. Measurement of patient outcome in arthritis.
Kirwan JR, Reeback JS. Stanford Health Assessment questionnaire modified to assess disability in British patients with rheumatoid arthritis.
Tugwell P, Boers M. OMERACT conference on outcome measures in rheumatoid arthritis clinical trials: introduction.
Prevoo ML, ‘t Hof MA, Kuper HH, van Leeuwen MA, van de Putte LB, van Riel PL. Modified disease activity scores that include twenty-eight-joint counts. Development and validation in a prospective longitudinal study of patients with rheumatoid arthritis.
Symmons DP, Hassell AB, Gunatillaka KA, Jones PJ, Schollum J, Dawes PT. Development and preliminary assessment of a simple measure of overall status in rheumatoid arthritis (OSRA) for routine clinical use.
ACR Sub-Committee on Rheumatoid Arthritis. Guidelines for the management of rheumatoid arthritis: 2002 Update.
Wolfe F, Hawley DJ, Cathey MA. Clinical and health status measures over time: prognosis and outcome assessment in rheumatoid arthritis.
Redelmeier DA, Lorig K. Assessing the clinical importance of symptomatic improvements. An illustration in rheumatology.
Larsen A, Dale K, Eek M. Radiographic evaluation of rheumatoid arthritis and related conditions by standard reference films.
Diggle PJ, Heagerty P, Liang KY, Zeger SL.
van Gestel AM, Haagsma CJ, van Riel PL. Validation of rheumatoid arthritis improvement criteria that include simplified joint counts.
Gardiner PV, Sykes HR, Hassey GA, Walker DJ. An evaluation of the Health Assessment Questionnaire in long-term longitudinal follow-up of disability in rheumatoid arthritis.
Wolfe F. A reappraisal of HAQ disability in rheumatoid arthritis.
Author notes
Arc Epidemiology Unit and 1Biostatistics Group, University of Manchester, Manchester M13 9PT, 2Royal Cornwall NHS Trust, Truro, Cornwall TR1 3LJ, 3University Hospital of North Staffordshire NHS Trust, Stoke-on-Trent ST4 7LN, 4East Cheshire NHS Trust, Macclesfield, Cheshire SK10 3BL, 5Cannock Hospital, Cannock, Staffordshire WS11 1BG and 6Academic Rheumatology Unit, King's College Hospital, London WC2R 2LS, UK.

Comments