


Abstract
Background. Quality of life (QoL) as perceived by patients with end‐stage renal disease (ESRD) is an important measure of patient outcome. There is a high incidence of ESRD in the Indo‐Asian population in the UK and a lower rate of transplantation compared with white Europeans. The aim of this study was to determine whether perceived quality of life was influenced by treatment modality and ethnicity.
Methods. Sixty Indo‐Asians treated with either peritoneal dialysis (n=20), hospital haemodialysis (n=20) or with a renal transplant (n=20) for >3 months were compared with 60 age‐matched white Europeans closely matched for gender, diabetes and duration of renal replacement therapy. QoL was measured using the Kidney Disease and Quality of Life questionnaire (KDQOL‐SF). The KDQOL‐SF measures four QoL dimensions: physical health (PH), mental health (MH), kidney disease‐targeted issues (KDI) and patient satisfaction (PS). Adequacy of treatment was measured by biochemistry, 24 h urine collection and dialysis kinetics. The number of comorbid conditions was scored. Social deprivation was calculated from the patient's postal address using Townsend scoring.
Results. QoL was significantly lower in Indo‐Asians than white Europeans for PH, MH and KDI. This was not related to treatment adequacy, which was similar in both for each modality. Indo‐Asians had a worse index of social deprivation than white Europeans (P=0.008). PH and KDI were related to social deprivation (P=0.007 and P=0.005, respectively). QoL (except PS) was inversely correlated with comorbidity. Dialysis patients had higher comorbidity than transplant patients (P<0.02). Comparing only those dialysis patients considered fit for transplantation (n=51) with transplant patients, comorbidity was similar, but differences in QoL persisted.
Conclusion. This study demonstrates a lower perceived QoL in Asians compared with white Europeans with ESRD. Analysis of QoL indicates that Asian patients in particular perceive kidney disease as a social burden, even if successfully transplanted.
Introduction
Quality of Life (QoL) as perceived by patients with end‐stage renal disease (ESRD) is well recognized as an important measure of outcome of renal replacement therapy. A number of definitions of QoL exist, focussing on physical and psychological function, whilst others acknowledge that QoL also relates to the individual in the context of their culture, values, goals and expectations [1,2].
Previous studies on health‐related quality of life (HRQoL) and ESRD have identified that modality of treatment is a factor influencing QoL in ESRD. Patients on continuous ambulatory peritoneal dialysis (CAPD) have been shown to have a similar QoL to patients on hospital haemodialysis (HD). However, findings in the literature are unable to provide conclusive results on the differences in QoL between patients on CAPD and HD [3–6]. Recent studies have shown that QoL was lower in pre‐dialysis HD patients compared with pre‐dialysis PD patients, and small differences in QoL were found between the dialysis modalities after 3 months of therapy [7,8]. Patients on dialysis have a reduced QoL compared with transplant patients, who are shown as having a similar QoL to the general population [3,4,8,9]. The potential damaging impact of ESRD on a patient's psychosocial function, and the marital strain experienced by patients on dialysis is well documented [10–12]. QoL is clearly not solely dependent on physical function, nor can it be viewed irrespective of the patient's social circumstances.
Several studies in the USA have examined the effect of ethnicity on QoL comparing Afro/Black Americans and white Americans with ESRD [13–17]. A review of family support among African American ESRD patients found that many of these families are embedded in an extended family. Patients often experienced extremes, from over‐involvement to no support and social isolation from their family. Families as well as patients were at risk of high levels of stress [13].
In areas of the UK, there are large established Asian communities from the Indian subcontinent. There is a high incidence of renal disease in this ethnically Indian population in comparison with white Europeans [18]. However, no research has been published on QoL of Asians with ESRD in the UK. The aim of this study was to determine if treatment modality and ethnicity affect the QoL of our renal patients.
Subjects and methods
Patients
The Renal Unit at Walsgrave Hospital in Coventry provides a sub‐regional service for dialysis and transplantation, for a population of ∼1.2 million, with a take‐on rate for dialysis patients of >100 patients per year. There is an increased take‐on rate of Asian patients onto dialysis, and as the Asian population in Coventry ages this is expected to increase significantly. Following local research ethics approval, 60 Asian patients on renal replacement therapy (between February and May 1998) for >3 months were invited to take part in the study. All our Asian transplant patients (n=20), 80% of our Asian hospital haemodialysis patients (n=20), and 91% of our Asian peritoneal dialysis patients (n=20) enrolled in the study. They were then compared with 60 white European patients, closely matched for age, gender, diabetes and months on renal replacement therapy. Patients who had changed treatment modality in the 3‐month period prior to enrolment were excluded. Patients were also excluded if acutely unwell or hospitalized in the 4‐week period prior to enrolment.
Adequacy of treatment
Adequacy of treatment in transplant patients (Tx) was estimated by measurement of 24 h renal creatinine clearance (rCrcl), where glomerular filtration rate was calculated from the mean of creatinine and urea clearance [19] corrected to a body surface area of 1.73 m2. In PD patients, in addition to rCrcl, peritoneal creatinine clearance (pCrcl) was calculated from 24 h dialysate collection corrected to a body surface area of 1.73 m2. Dialysate creatinine concentration was corrected for glucose interference. Urea reduction ratio was calculated for HD patients [20]. Serum albumin was measured using the bromocresol purple method (normal range 34–48 g/l) using a Bayer Advia 1650 analyser.
Quality of life
QoL was measured using the self‐administered Kidney Disease and Quality of Life Short Form (KDQOL‐SF) Version 1.1 [21]. It is composed of measures of 79 items of health‐related QoL (HRQoL), and was developed from the 134‐item KDQOL, after concerns regarding how long it took to administer the original version. The 79 items rated by patients in the KDQOL‐SF measures 19 health‐related domains, categorized as four dimensions of HRQoL. Physical health (PH) comprises: physical functioning, work status, role limitations due to physical health, general health perception, pain, energy/fatigue and social function; mental health (MH): emotional well‐being, quality of social interactions, burden of kidney disease, social support, role limitations due to emotional problems; kidney disease‐targeted issues (KDI): cognitive function, symptoms/problems, effects of kidney disease, sexual function, sleep; and patient satisfaction (PS): patient satisfaction, perceptions of staff encouragement. The generic core (SF36) has been validated for use in UK populations [22]. The original KDQOL (long version) has been validated in the USA, in a sample including ethnic patients [23]. Internal consistency and reliability tests for the short version were also carried out [21]. The KDQOL‐SF was shown to be a powerful predictor of hospitalization rates and mortality risk in HD patients in a study of 6600 patients [24]. The questionnaire takes ∼25 min to complete. Patients who needed assistance to complete the questionnaire were identified, and were assisted by the research nurse or close family member instructed on how to administer it.
Comorbidity
Comorbidity was scored using the accepted method of Davies, where a score of 1 was given for each of the following: ischaemic heart disease, peripheral vascular disease, diabetes mellitus, systemic collagen vascular disease, malignancy and specified other conditions. A cumulative score of 3–4 indicates severe comorbidity [25].
Social deprivation
Townsend scoring was used as an index of social deprivation. Patients' postal addresses were classified according to the electoral ward they lived in, and assigned a Townsend score [26]. The variables used to calculate Townsend scores collected from the 1981 population census data include households that are not owner‐occupied, residents aged 16–59/64 (women/men) who are unemployed, households lacking a car, and households with more than one person per room. The Townsend scores in the West Midlands region range from −8.5 to +8.76, with a higher score indicating a higher level of social deprivation. A score of −4 or less=most privileged, −2 to −4=privileged, −1.99 to +1.99=average deprivation, +2 to +3.99=deprived, and ≥+4=most deprived.
Statistical analysis
Values are expressed as means±SD. The non‐parametric Mann–Whitney U‐test was used to test the difference between paired observations. Pearson's correlation coefficient was used to measure the degree of association between variables. Variables that correlated with the QoL dimension scores at the P<0.05 significance level were entered into a multiple regression model. Backward stepwise regression was used to eliminate the least important variables. Variables used in the regression model were tested for normality of distribution. The internal consistency of the QoL item scores was calculated by Cronbach's α [27]. It is generally accepted that Cronbach's α should be >0.70 [28]. Cronbach's α was >0.70, except for the items measuring the domain: sleep (0.50). Cronbach's α was similar in both Asian and white patients when separate analyses was performed. Analyses were performed using SPSS for Windows 9.0 (SPSS Inc., Chicago, IL, USA).
Results
Patient characteristics
The patient characteristics on enrolment according to ethnicity and treatment modality are shown in Table 1. The mean serum albumin and haemoglobin levels were significantly higher in the Tx patients than dialysis patients. There was no significant difference between adequacy of treatment in Indo‐Asian and white Europeans within each treatment modality. The urea reduction ratio was significantly lower in white than Asian patients on haemodialysis (P=0.016), but this significance disappeared when the six patients with residual renal function were removed (one Asian, five white). A higher haemoglobin level was associated with a significantly better QoL score for physical health, but this was not significant on multivariate analysis. A higher serum albumin was independently associated with a better QoL score for the QoL dimensions: PH and KDI.
Patient characteristics on enrolment for the three treatment modalities (values are means±SD)
| Peritoneal dialysis | Haemodialysis | Transplant | |||||||
| Asian | White | Asian | White | Asian | White | ||||
| Age (years) | 48±14 | 50±15 | 52±14 | 53±16 | 45±11 | 47±10 | |||
| Number of patients | 20 | 20 | 20 | 20 | 20 | 20 | |||
| Gender: | |||||||||
| male (n) | 14 | 14 | 13 | 13 | 14 | 14 | |||
| female | 6 | 6 | 7 | 7 | 6 | 6 | |||
| Months renal replacement | 28±32 | 33±36 | 45±24 | 42±54 | 110±66 | 108±70 | |||
| Diabetes (n) | 6 | 6 | 6 | 6 | 3 | 1 | |||
| Albumin | 32.1 | 31.2 | 34.6 | 34.4 | 38.9 | 40 | |||
| Haemoglobin | 11.1±2.0 | 10.4±1.3 | 10.6±1.3 | 10.6±1.7 | 12.7±1.5 | 12.9±1.5 | |||
| Creatinine clearance l/wk | 75±30 | 76±38 | – | – | 402±171 | 397±206 | |||
| Urea reduction ratio (%) in patients | – | – | 59±9.3 | 54±11 | – | – | |||
| with no renal function | |||||||||
| Creatinine clearance (ml/min) | – | – | – | – | 39.9±17 | 39.4±20 | |||
Quality of life and treatment modality
Patients on PD and HD had a similar QoL for the three dimensions of PH, KDI and MH. PS was higher in PD than HD patients (76±20%) vs (65±19%) P=0.007. Tx patients had a significantly higher QoL than patients on PD and HD with respect to PH, MH and KDI. Treatment modality was independently associated with MH.
Quality of life and ethnicity
Indo‐Asian and white European patients on HD had a similar QoL (Table 2). However, Asian patients on PD had a significantly lower QoL than white patients for three of the 4 QoL dimensions (Table 2), and a comparison of Asian and white Tx patients showed that Asians had a significantly lower QoL than whites (Table 2). KDI and MH measures were significantly lower in Asian than white Tx patients (Figure 1). QoL was also significantly lower for the PH domains (physical function and Pain) and the PS domain (PS). Ethnicity was a significant independent predictor of PH, MH and KDI.
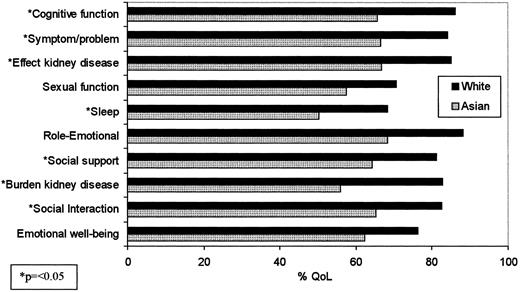
Kidney disease targeted issues and mental health scores for patients with a functioning transplant (Asian n=20. White n=20).
KDQOL‐SFTM dimension scores for the three treatment modalities (mean score in % ±SD)
| Peritoneal dialysis | Haemodialysis | Transplant | |||||||||||||
| Asian | White | P | Asian | White | P | Asian | White | P | |||||||
| Physical health | 34±17 | 45±18 | 0.045 | 39±24 | 40±22 | n.s. | 51±23 | 65±28 | 0.058 | ||||||
| Mental health | 45±23 | 65±20 | 0.008 | 51±25 | 53±24 | n.s. | 63±20 | 82±17 | 0.003 | ||||||
| Kidney disease targeted | 48±20 | 64±13 | 0.002 | 51±21 | 56±18 | n.s. | 58±20 | 79±18 | 0.002 | ||||||
| Patient satisfaction | 74±21 | 78±19 | n.s. | 65±21 | 66±18 | n.s. | 72±19 | 84±16 | 0.011 | ||||||
n.s., non‐significant.
Comorbidity
Comorbid scores were not significantly different between Asian and white patients for each modality (Table 3). Comorbidity was inversely correlated with PH (P=0.0002), MH (P=0.004) and KDI (P=<0.0001), with those patients with the highest comorbidity having the lowest QoL. Regression analysis showed comorbidity to be independently associated with KDI.
Comorbidity scores
| Asian | White | ||||||||
| Peritoneal dialysis | Haemodialysis | Transplant | Peritoneal dialysis | Haemodialysis | Transplant | ||||
| 0.95±1.1 | 1.15±1.0 | 0.55±0.76* | 0.85±0.81 | 1.45±1.2 | 0.50±0.76* | ||||
| Asian | White | ||||||||
| Peritoneal dialysis | Haemodialysis | Transplant | Peritoneal dialysis | Haemodialysis | Transplant | ||||
| 0.95±1.1 | 1.15±1.0 | 0.55±0.76* | 0.85±0.81 | 1.45±1.2 | 0.50±0.76* | ||||
*Significantly lower value than in the dialysis groups.
Quality of life and social deprivation
The mean index of social deprivation as measured by Townsend score was lower in Asians than whites (Table 4). This reached significance in the PD patients. Townsend score was independently associated with PH and KDI.
Townsend scores (an index of social deprivation)
| Asian | White | P | |
| All patients | 1.35±3.9 | 0.15±3.4 | 0.008 |
| Peritoneal dialysis | 3.09±2.8 | −0.33±3.2 | 0.001 |
| Haemodialysis | 0.08±4.5 | 0.39±3.6 | n.s. |
| Transplant | 0.91±3.9 | −0.50±3.4 | n.s. |
| Asian | White | P | |
| All patients | 1.35±3.9 | 0.15±3.4 | 0.008 |
| Peritoneal dialysis | 3.09±2.8 | −0.33±3.2 | 0.001 |
| Haemodialysis | 0.08±4.5 | 0.39±3.6 | n.s. |
| Transplant | 0.91±3.9 | −0.50±3.4 | n.s. |
n.s., non‐significant.
Quality of life of dialysis patients on the transplant waiting list
In view of the fact that the PD and HD patients in the study had higher comorbidity than Tx patients, only those patients on dialysis deemed medically fit for transplant were selected (n=51) for comparison with Tx patients. The mean age and comorbidity of the Tx patients and those on dialysis awaiting transplant (Dt) were similar. QoL of the Tx group was significantly higher than the Dt group (except for dimension of PS). Comparing Asian (n=30) and white patients (n=21) on the transplant list, comorbidity, age, albumin, haemoglobin, and number of patients on PD and HD were similar. QoL was significantly lower in Asian than white patients on dialysis and awaiting transplant for the following dimensions: MH (P=0.021), KDI (P=0.002) (Figure 2) and PH (P=0.003). Figure 3 shows the QoL dimension scores for Asian and white Dt and Tx patients.
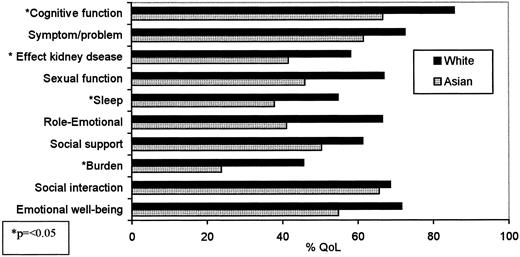
Kidney disease targeted and mental health scores of the patients on dialysis awaiting a renal transplant (Asian n=30, White n=21).
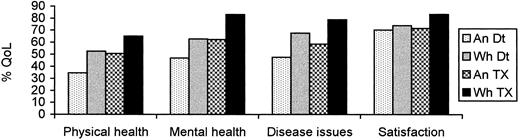
Quality of life dimension scores of patients on dialysis awaiting a transplant (Dt) (Asian n=30, White n=21), and transplant patients (Tx) (Asian n=20, White n=20).
Completion of the KDQOL‐SF
Ninety‐three of the 120 patients (78%) in the study completed the KDQOL‐SF without any assistance. Eighteen Asian patients (30%) were assisted completing the questionnaire (PD, n=9; HD, n=7; Tx, n=2). Twelve Asian patients were assisted by a family member and six by the researcher. Nine white patients (15%) were assisted (PD, n=3; HD, n=5; Tx, n=1). Three white patients were assisted by a family member and six by the researcher. Of the 18 Asian patients who were assisted, 11 had good verbal English skills, but did not read English or their native spoken language. Seven Asian patients did not read/speak English (all >55 years of age). Six white patients who needed assistance had poor vision. Comorbidity was significantly higher in patients assisted in completing their questionnaire compared with those who were not assisted (P=0.002). Comparing only those Asian (n=42) and white (n=51) patients who completed their own questionnaire, patient age, comorbidity, albumin and social deprivation were not significantly different; however, QoL was significantly lower in the Asian patients (except for the dimension of PS). The internal consistency of items measured by the KDQOL was similar in the 60 Asian and 60 white patients. A similar correlation between QoL items (Cronbach's α>0.70) for each domain (except sleep), in both ethnic groups, suggests that understanding of the questions being asked was similar in both patient groups.
Discussion
This study showed that Asian patients had a lower perceived QoL than whites with ESRD. The difference in QoL between Asian and white patients on dialysis reached significance in PD patients, and in those with a renal transplant. Social deprivation was higher in Asians than whites, and this difference reached significance in Asian patients on PD compared with whites. Social deprivation was measured by Townsend score [26], and has been used in one study to assess the link between social deprivation and hospital admissions [29]. One of the four variables used to calculate deprivation is the number of households with more than one person per room, which may be biased against Asians who are more likely to live in extended families. Patients on PD carry out several treatments each day and are therefore constantly reminded that they have renal disease. In Asian families, where there appears to be more of a stigma attached to chronic illness [30], it may be easier for patients and families to cope if the treatment is kept more separate from family life and treated at the hospital. Asians on PD may find this form of treatment less culturally acceptable than whites, and this difference may be related to social circumstances. The absence of a significant difference in QoL between Asians and whites on HD might be explained in part by the higher comorbidity in whites. Social deprivation does not appear to explain the greater burden of renal disease in Asians with a kidney transplant compared with whites.
There was no significant difference between QoL of patients on PD compared with HD patients closely matched for age, gender, ethnicity, months on renal replacement therapy and diabetes for the dimensions of PH, MH and KDI. Patients on PD had a higher score for PS. A small number of Asian and white patients in the PD group were only offered PD due to the limited HD resources available at the time they commenced treatment. Transplant patients had the best overall QoL even when compared with dialysis patients with similar comorbidity. The inverse negative correlation found between QoL and comorbidity is in keeping with the findings of studies looking at the impact of comorbid conditions such as diabetes on QoL [31]. Univariate analysis showed better haemoglobin levels were associated with better physical health, but albumin was the only clinical variable associated with PH on multivariate analysis. Correcting problems such as anaemia with erythropoeitin has been shown to improve patients' QoL [32], as well as the benefits of better nutritional status [33]. The absence of a correlation between adequacy of treatment and physical health has been found in other studies [6,34].
Ethnicity, which is sometimes used as a variable in health research, is difficult to measure [35]. In this study, ethnicity was independently associated with PH, MH and KDI on multivariate analysis. The effect of ethnicity on hospital admissions, morbidity and mortality is recognized, but difficulties in measuring ethnicity may explain why it is not used more frequently as a research variable. The Asian patients in this study originated from the Indian subcontinent and the majority have been established in Coventry since the late 1960s. It is acknowledged that although the majority of patients studied were from the Punjab region, the patients do not all share the same language, religion, social class or cultural factors such as family values. Comparing only those Asian (n=42) and white (n=51) patients who were able to complete their own questionnaire (to eliminate any bias in the findings caused by the researcher or relative administering the questionnaire), QoL remained significantly lower in Asians than whites for PH, MH and KDI. Although the number of ethnic patients in this study was greater than that used in the validation of the long version of the KDQOL, the researchers acknowledge that further studies need to be carried out to validate the KDQOL‐SF in ethnic patients. The researchers also acknowledge that the 42 Asian patients who completed their own questionnaire were relatively young (mean age 45 years) and spoke good English. This may not be entirely reflective of the Asians in other centres in the UK. Research looking at Asian patients with other chronic conditions, such as diabetes and asthma, has shown that Asians have a poor understanding of their illness compared with white patients [36,37]. Increasing Asian patients' and their families' understanding of kidney disease, and getting them more involved in support groups may go some way towards improving attitude towards and understanding of this chronic disease.
In recent years, the power of QoL measures such as the KDQOL and SF‐36 to predict outcomes such as hospitalization and survival has been addressed [24,37,39]. Both tools use scales that score QoL dimensions from 0–100, with a higher score indicating a better (perceived) QoL. The KDQOL measures of the three dimensions PH, MH and KDI have been shown to predict hospitalization and mortality independently of other measures. A five‐point higher score of the three dimensions was associated with a 4–8% reduction in risk of hospitalization and a 9–23% reduction in mortality [24]. The SF‐36 has also been shown to be a good screening tool for patients at high risk of death, hospitalization, poor attendance for treatment and depression [38,39]. In our cross‐sectional study, the association between QoL scores, and outcomes such as hospitalization rates and mortality, was not examined. Taking the findings of the aforementioned studies into account, it might seem reasonable to suggest that each five‐point difference in QoL dimension score is of clinical significance. In our study, there were differences of up to 20 points when scores for the treatment modalities were compared, and also between Asian and white Tx and PD patients, as shown in Table 2.
Conclusion
Measuring the impact of chronic illness and the effects of care is fundamental to good clinical practice. The experience of Asian patients in the UK with ESRD is not well documented, despite the increased take‐on rate and reduced likelihood of transplantation in comparison to whites [40]. Our data showed that Asians with ESRD had a lower QoL than whites, which has not been described previously in the literature. QoL was associated with Townsend score (an index of social deprivation), but treatment modality, adequacy of treatment or comorbidity did not explain the difference. Further research focusing on patient and family attitudes to illness and coping mechanisms is needed to explain the difference in perceived QoL in Asian and white patients with renal disease. Patient expectations regarding the benefits of treatment for ESRD may also need to be examined.
Correspondence and offprint requests to: A. B. Bakewell, Walsgrave NHS Trust Hospital, Clifford Bridge Road, Walsgrave, Coventry CV2 2DX, UK.
We thank Baxter Healthcare and Fresenius Medical Care, who funded the research nurse post, and nurses J. O'Toole and M. Savage who assisted in collecting patient data.
References
Kimmel PL. Just whose quality of life is it anyway? Controversies and consistencies in measurement of quality of life.
Bremer BA, McCauley CR, Wrona RW, Johnson JP. Quality of life in end‐stage renal disease: a re‐examination.
Koch U, Muthny FA. Quality of life in patients with end‐stage renal disease in relation to the method of treatment.
Jofre R, Lopez‐Gomez, Valderrabano F. Quality of life for patient groups.
Moreno F, Lopez‐Gomez JM, Sanz‐Guajardo D, Jofre R, Valderrabano F. Quality of life in dialysis patients. A Spanish multicentre study.
Korevaar JC, Jansen MAM, Merkus MP, Dekker FW, Boeschoten EW, Krediet RT. Quality of life in predialysis end‐stage renal disease patients at the initiation of dialysis therapy.
Merkus MP, Jager KJ, Dekker FW, Boeschoten EW, Stevens P, Krediet RT. Quality of life in patients on chronic dialysis: self assessment 3 months after the start of treatment.
Jofre R, Lopez‐Gomez JM, Moreno F, Sanz‐Guajardo D, Valderrabano F. Changes in quality of life after renal transplantation.
Binik YM, Chowanec GD, Devins GM. Marital role strain, illness intrusiveness and their impact on marital and individual adjustment in end‐stage renal disease.
Shidler NR, Peterson RA, Kimmel PL. Quality of life and psychosocial relationships in patients with chronic renal insufficiency.
Soskolne V, Kaplan De‐Nour A. Psychosocial adjustment of home haemodialysis, continuous ambulatory dialysis and hospital dialysis patients and their spouses.
Holder B. Family support and survival among African‐American end‐stage renal disease patients.
Somer E, Tucker CM. Spouse marital adjustment and patient dietary adherence in chronic haemodialysis: a comparison of Afro‐Americans and caucasians.
Raj DSC, Roscoe J, Manuel A, Abreo K, Dominic SS, Work J. Is peritoneal dialysis a good option for black patients.
Price DA, Owen WF. African‐Americans on maintenance dialysis: a review of racial differences in incidence, treatment and survival.
Welch JL, Austin JK. Quality of life in black haemodialysis patients.
Buck K, Feehally J. Diabetes and renal failure in Indo‐Asians in the UK—a paradigm for the study of disease susceptibility.
Lavender S, Hilton PJ, Jones NF. The measurement of glomerular filtration‐rate in renal disease.
Daugirdas JT. Chronic haemodialysis prescription: a urea kinetic approach. In Daugirdas JT, Ing T, eds
Hays RD, Kellich JD, Mapes DL, Coons SJ, Amin N, Carter WB.
Garratt AM, Rutta DA, Abdalla MI, Buckingham JK, Russell IT. The SF36 health survey questionnaire: and outcome measure suitable for routine use within the NHS?
Hays RD, Kallich JD, Mapes DL, Coons SJ, Carter WB. Development of the Kidney Disease Quality of Life (KDQOLTM) instrument.
Mapes DL, McCullough KP, Meredith D, Locatelli F, Valderrabano F, Held PJ. Quality of life predicts mortality and hospitalization for haemodialysis (HD) patients in the US and Europe. [Abstract].
Davies SJ, Russell L, Bryan J, Phillips L, Russell G. Comorbidity, urea kinetics, and appetite in continuous ambulatory peritoneal dialysis patients: their interrelationship and prediction of survival.
Cronbach LJ. Coefficient alpha and the internal structure of tests.
Campbell MJ, Machin D.
Spencer N, Logan S, Scholey S, Gentle S. Deprivation and bronchiolitis.
Bradley C, Kinmonth AL, Julious S. Quality of life in non‐insulin‐dependent diabetes: the effect of comorbidity. [Abstract].
Temple RM, Deary IJ, Winney RJ. Recombinant erythropoeitin improves cognitive function in patients maintained on chronic ambulatory peritoneal dialysis.
Jamieson CP, Norton B, Day T, Lakeman M, Powell‐Tuck J. The quantitative effect of nutrition support on quality of life in outpatients.
Merkus MP, Jager KJ, Dekker FW, de Hann RJ, Boeschoten EW, Krediet RT. Physical symptoms and quality of life in patients on chronic dialysis: results of the Netherlands Cooperative Study on Adequacy of Dialysis (NECOSAD).
Senior PA, Bhopal R. Ethnicity as a variable in epidemiological research.
Moudgil H, Honeybourne D. Differences in asthma management between white European and Indian subcontinent ethnic groups living in socioeconomically deprived areas in the Birmingham (UK) conurbation.
Wilson E, Wardle EV, Chandel P, Walford S. Diabetes education: an Asian perspective.
DeOreo PB. Haemodialysis patient‐assessed functional health status predicts continued survival, hospitalization and dialysis‐attendance compliance.
Merkus MP, Jager KJ, Dekker FW, de Haan RJ, Boeschoten EW, Krediet RT. Predictors of poor outcome in chronic dialysis patients; The Netherlands Cooperative Study on the Adequacy of Dialysis.


Comments