


Abstract
Background: Germline mutations in the CDKN2A gene have been linked to melanoma incidence in many families with multiple cases of the disease. Previous studies of multiple-case families have indicated that the lifetime risk (i.e., penetrance) of melanoma in CDKN2A mutation carriers is very high, ranging from 58% in Europe to 91% in Australia by age 80 years. In this study, we examined lifetime melanoma risk among CDKN2A mutation carriers using carriers who were identified in a population-based study of melanoma. Methods: Probands for the study were incident case patients with either first or subsequent melanoma who were identified in nine geographic regions in Australia, Canada, the United States, and Italy. A total of 3626 probands (53% participation rate) with adequate DNA for analysis were recruited and genotyped for CDKN2A mutations. From the 3550 probands whose DNA could be amplified by polymerase chain reaction of CDKN2A exons 1α, 2, and 3 and surrounding regions, 65 mutation carriers were identified. Melanoma histories in first-degree relatives of these probands were used to calculate the lifetime risk in CDKN2A mutation carriers using the kin–cohort method. Results: The risk of melanoma in CDKN2A mutation carriers was approximately 14% (95% CI = 8% to 22%) by age 50 years, 24% (95% CI = 15% to 34%) by age 70 years, and 28% (95% CI = 18% to 40%) by age 80 years. Eighteen probands had three or more first-degree relatives with melanoma, but only one was a carrier of a CDKN2A mutation. Conclusions: CDKN2A mutation carriers in the general population have a much lower risk of melanoma than that suggested by estimates obtained from multiple-case families. The preponderance of familial clustering of melanoma occurs in families without identifiable mutations in CDKN2A.
It has long been recognized that malignant melanoma frequently clusters in families. Linkage studies identified the chromosome 9p21 region as a candidate locus ( 1 ) . Subsequently CDKN2A was identified as the melanoma susceptibility gene ( 2 , 3 ) . The CDKN2A locus contains overlapping reading frames that code for p16 INK4A and p14 ARF ( 4 , 5 ) , two unrelated proteins that have important roles in cell cycle control. Family studies have also associated melanoma susceptibility with mutations in the CDK4 gene, located on chromosome 12q14 ( 6 , 7 ) . Cyclin-dependent kinase 4, the product of the CDK4 gene, and p16 INK4A function in the same retinoblastoma-regulated G1-to-S-phase transition with p16 INK4A inhibiting the kinase activity of CDK4 under normal conditions. However, only a few families with clusters of melanoma have so far been found to harbor CDK4 mutations, and so it is unlikely that CDK4 has a substantial impact on melanoma risk in the general population. Thus, most studies have focused on mutations in CDKN2A.
Several studies have reported the lifetime risk of melanoma (penetrance) in carriers of CDKN2A mutations using data ascertained from hereditary melanoma families. Cannon-Albright et al. ( 8 ) estimated that CDKN2A mutation carriers have a 53% risk of developing melanomas by age 80 years, based on three families with multiple cases of melanoma; Newton Bishop et al. ( 9 ) reported a penetrance estimate of 64% at age 85 years, based on three families. Box et al. ( 10 ) , using 15 Australian CDKN2A mutation–carrying pedigrees that were also assessed for variants in the melanocortin receptor gene (MC1R), obtained “raw” relative frequencies of melanoma of 50% in CDKN2A mutation carriers without MC1R variants and 84% in carriers with MC1R variants. By far the largest study to date was based on 80 families assembled from Europe, North America, and Australia by the Melanoma Genetics Consortium ( 11 ) . This study of 402 melanoma patients and 713 unaffected family members produced an aggregate penetrance estimate of 67% (95% CI = 31% to 96%) by age 80 years. The authors projected corresponding risks of 91% in Australia, 76% in North America, and 58% in Europe. The study was large enough to permit comparisons of the risks conferred by mutations that affect p16 INK4A only and those that affect p16 INK4A and p14 ARF , but no statistically significant difference in melanoma risk between the two mutation types was detected.
These penetrance estimates are exceptionally high for a disease that has a lifetime risk of approximately 2% in the populations from which these families were obtained (primarily Europe, North America, and Australia). Families identified because they exhibit multiple cases of melanoma, however, necessarily represent the high end of the risk spectrum among all mutation-carrying families in the general population ( 12 ) . To obtain risk estimates that may be more representative of carrier risks in the general population, we performed an international population-based study in which incident case patients with melanoma were ascertained from nine populations on three continents and all participating case patients were genotyped for CDKN2A mutations. In this report, we used the occurrence of melanoma in first-degree relatives of these probands to estimate directly the lifetime risk of melanoma in CDKN2A mutation carriers.
S UBJECTS AND M ETHODS
Data for this report were obtained from the Genes Environment and Melanoma (GEM) study. The GEM study is a population-based case–control study of risk of subsequent melanoma in people who have had a first invasive primary melanoma.
Subject Ascertainment
The GEM participants (probands for this study) either had first invasive melanoma or subsequent invasive or in situ primary melanoma. The probands were identified from population-based cancer registries in eight geographic regions: New South Wales (Australia), Tasmania (Australia), British Columbia, Ontario, Torino (Piemonte, Italy), California (Orange County and San Diego), New Jersey, North Carolina, and a large melanoma clinic in Michigan that diagnoses and treats a substantial fraction of all melanomas diagnosed in the state of Michigan. Patients with first primary melanoma were diagnosed from January 1, 2000, through June 30, 2000, in most centers but during all of 2000 in California, Michigan, and North Carolina; from January 1, 2000, through August 31, 2000, in Ontario; and from June 1, 2000, through May 31, 2001, in Torino, Italy. Patients with second or subsequent primary melanoma were diagnosed from January 1, 2000, through August 31, 2003, in all centers except those in British Columbia, California, New Jersey, and Tasmania, which had additional recruitment from January 1, 1998, through December 31, 1999. Central pathology review by a team of dermatopathologists with expertise in melanoma was conducted for all probands in the study from whom sections of the relevant lesions could be obtained.
Specimens and Data
Probands were identified by the relevant population-based cancer registry or clinic, and physician approval was obtained before attempting contact. Consenting subjects completed a brief self-administered questionnaire and had a subsequent telephone interview lasting for approximately 1 hour. Detailed information about relevant exposures and risk factors for melanoma was obtained, including family history of melanoma and of other cancers. Data obtained include the ages at diagnosis of melanoma in relatives who had a history of the disease and the current ages or ages at death of all relatives. Probands were asked specifically for these details for every first-degree relative, grandparent, grandchild, half-brother, and half-sister. To minimize the probability of errors in the reporting of melanoma occurrences in the family, we restricted our analysis in this study to first-degree relatives. We note that, of the 23 485 first-degree relatives who contributed data, ages were missing for 350. For relatives with missing ages, we used the median age of the relative type (e.g., parent, sibling, or child) at the times of the probands' interviews (or the relative's age at death or date of diagnosis of melanoma, if relevant). Participants also provided four to six buccal swabs for DNA analysis. Blood specimens were obtained instead of buccal swabs for some patients at three of the centers (128 of 388 patients in Michigan, 10 of 351 patients in New Jersey, and 75 of 315 patients in North Carolina, constituting 5.7% of the total sample). The study protocol was approved by the Institutional Review Board at Memorial Sloan–Kettering Cancer Center in New York, the study Coordinating Center, and those at each of the contributing centers. All participants provided written informed consent.
Genotyping
DNA was isolated within days of receipt of the sample. DNA obtained from buccal swabs was isolated using the method of Richards et al. ( 13 ) or using the Puregene DNA isolation kit (Gentra Systems Inc., Minneapolis, MN) ( 14 ) , replacing glycogen with tRNA (10 μg/mL) for the DNA precipitation step. DNA was isolated from blood using the Qiagen QIAamp DNA Blood Kit (Qiagen Inc., Valencia, CA) following the manufacturer's recommendations or using the Puregene DNA isolation kit (Gentra Systems Inc., Minneapolis, MN). The samples were maintained at 4 °C for daily use and at −80 °C for long-term storage.
Exons 1α, 2, and 3 of the CDKN2A gene and their splice junctions were analyzed by polymerase chain reaction (PCR) using primers described by Kamb et al. ( 3 ) and Hussussian et al. ( 2 ) with a few modifications to the protocol. DNA samples from a melanoma-derived cell line (SK-Mel21), from primary melanomas, and from bladder tumors with known CDKN2A status were included as internal controls ( 15 ) . Exon 1α was amplified using primers surrounding the entire exon ( 3 ) (Supplementary Fig. 1 available at http://jncicancerspectrum.oxfordjournals.org/jnci/content/vol97/issue20 ) in a 30-μL reaction containing 1–50 ng of genomic DNA, in the presence of 1.5 m M MgCl 2 , 200 m M dNTPs (Invitrogen, Carlsbad, CA), 1 m M betaine (Sigma-Aldrich, St. Louis, MO), 0.05 U/μL of Taq Polymerase (Applied Biosystems, Foster City, CA), a 0.4 μ M concentration of each forward and reverse primer, and PCR buffer (10 m M Tris HCl, pH 8.3, 50 m M KCl, 1.5 m M MgC1 2 , and 0.001% gelatin). The cycling conditions consisted of an initial denaturation step at 95 °C for 5 minutes followed by 35 cycles at 95 °C for 30 seconds, 60 °C for 30 seconds, and 72 °C for 30 seconds, with a final extension at 72 °C for 10 minutes. Samples that failed to amplify in two separate experiments were then amplified with two sets of primers that generated smaller and overlapping fragments (Supplementary Fig. 1 available at http://jncicancerspectrum.oxfordjournals.org/jnci/content/vol97/issue20 ). These reactions contained a 1 μ M concentration of each primer and were performed using the procedure described above, except with 57 °C as the annealing temperature. Exon 2 was amplified using one set of primers [2A-forward and 2C-reverse ( 2 ) , Supplementary Fig. 1 available at http://jncicancerspectrum.oxfordjournals.org/jnci/content/vol97/issue20 ] yielding a 411-bp fragment. The 30-μL reaction contained 1–50 ng of genomic DNA, a 0.5 μ M concentration of each forward and reverse primer, 220 μ M dNTPs, 0.05 U/μL of Optimase (Transgenomic, Omaha, Nebraska), PCR buffer, and 1 M betaine. Reaction mixtures were subjected to 95 °C for 2 minutes, 15 cycles at 95 °C for 30 seconds, 62.5 °C (−0.5 °C/cycle) for 30 seconds, and 72 °C for 50 seconds, 20 cycles at 95 °C for 30 seconds, 55.5 °C (−0.5 °C/cycle) for 20 seconds, 72 °C for 50 seconds, and extension at 72 °C for 5 minutes. Samples that failed to amplify in two separate experiments were then amplified with sets of primers that generated smaller and overlapping PCR fragments [ ( 2 ) , Supplementary Fig. 1 available at http://jncicancerspectrum.oxfordjournals.org/jnci/content/vol97/issue20 ]. Exon 3 was amplified using primers and conditions previously described [ ( 2 ) , Supplementary Fig. 1 available at http://jncicancerspectrum.oxfordjournals.org/jnci/content/vol97/issue20 ]. The first nucleotide of the forward primer corresponds to the position −90, located upstream of exon 3, and therefore did not allow us to identify the deep intronic mutation IVS2-105, which has recently been associated with melanoma in melanoma-prone families ( 16 ) . The sizes of all PCR products were verified by visualization after 1.5% agarose gel electrophoresis and ethidium bromide staining. All experiments included wild-type control and CDKN2A mutant specimens.
All PCR-amplified samples were initially screened for mutations using denatured high-performance liquid chromatography analysis, which has been shown to be sensitive and reliable ( 15 ) . To examine heteroduplexes, PCR products were denatured at 95 °C for 5 minutes, and strands were reannealed by cooling to room temperature for 20 minutes. Five to 10 μL of each PCR product was then loaded automatically onto a DNASep column and eluted with a linear 2% acetonitrile gradient in 0.1 M triethylamine acetate (TEAA, pH 7.0) at a constant flow rate of 0.9 mL/min at 66 °C and 68.5 °C (exon 1), 63.1 °C and 69 °C (exon 2), and 59 °C (exon 3) (Wave DNA Fragment Analysis System, Transgenomic, Inc., Omaha, NE). Eluted DNA fragments were detected by a UV detector (Transgenomic). The elution profiles or chromatograms were compared manually with profiles of wild-type controls and were reviewed at least twice by different laboratory technicians. Samples with an altered chromatographic profile that were suggestive of a mutation were reamplified and sequenced.
Before sequencing, an independent PCR was performed for all samples, and specific PCR products were purified with a gel purification kit (Qiagen) according to the manufacturer's recommendations. The amount of purified DNA varied according to the fragment size and sequencing instrument used, but approximately 8–25 ng of each purified sample was mixed with 3.2 pmols of specific primer, 4 μL of termination mix, and distilled water to a final volume of 10 μL. Samples were subjected to 25 cycles at 96 °C for 10 seconds, 50° C for 5 seconds, and 60 °C for 4 minutes. Samples were then purified by ethanol and sodium acetate precipitation and were sequenced using an ABI310 instrument (PE-Applied Biosystems, Foster City, CA) or in the Sequencing Core Facility of Memorial Sloan–Kettering Cancer Center on an ABI377 instrument (PE-Applied Biosystems). Sequencing electropherograms were read at least twice and reviewed manually and with the Vector NTI Suite v.6.0 (Informax, Inc., Bethesda, MD) and Mutation Surveyor software, version 2.41 (Softgenetics, State College, PA). In our statistical analyses, we considered identified mutations to be functional if they occurred in the coding region for either p16 INK4A or p14 ARF or both or if the mutation was outside the coding region but has been shown to inhibit transcription. Well-known polymorphic variants, i.e., those that do not alter transcription, affinity for Cdk4/6, or cell cycle arrest, were not considered to be functional mutations.
Statistical Analysis
The incidence rates of melanoma in the identified first-degree relatives of the probands (parents, full siblings, and children) were used in all analyses. These rates excluded the proband, except when analyses involved subgroups of family members who were defined by characteristics of the proband, such as mutational status. Person-years at risk of melanoma was determined for each relative, up until the age at diagnosis of melanoma, if diagnosed; age at death; or current age. The lifetime cumulative incidences of melanoma in relatives of CDKN2A mutation carriers and in relatives of noncarriers were calculated using the Kaplan–Meier method, and the penetrance, i.e., the cumulative risk in carriers, was calculated by the kin–cohort method proposed by Chatterjee and Wacholder ( 17 ) . This method involves maximum likelihood estimation, using the EM algorithm, of a nonparametric cumulative incidence function that has discontinuities at the observed event times. It thus retains the nonparametric flavor of the earlier nonparametric method proposed by Wacholder et al. ( 18 ) in that it does not assume a model for the incidence curve while ensuring that the cumulative incidence estimates are monotonic. The method also adjusts for the impact of clustering of events within families. Conceptually, the method calculates the penetrance as double the rate observed in the first-degree relatives of carriers (because approximately half of these will be carriers), with an adjustment for the baseline incidence rate. In effect, this method uses the incidence in relatives of noncarrier probands, rather than using general population rates, as the baseline, although the rates in our noncarrier probands are only modestly higher than are the general population rates. The method was applied separately for Australian families, for North American families, and for families of multiple primary melanoma probands and single primary melanoma probands.
We note that this method differs in important ways from the method used by Bishop et al. ( 11 ) in their study of high-risk melanoma families. Bishop et al. used a parametric model in which the relationship of the genotype to disease risk is characterized by a proportionality parameter within a logistic regression model, adjusted for other covariates. The influence of geographic region on risk was also modeled using a proportionality parameter. This method also requires prespecification of the mutation frequency in the population (a parameter that is estimated from the data in the method we used).
Since the probands for the study were selected because they were diagnosed with melanoma, our analysis will overestimate the penetrance if heterogeneity of risk exists among proband carriers ( 12 ) . To evaluate this issue, we also conducted a Poisson regression analysis of the incidences of melanoma in family members where a random effect was included for each family, in which the random effects were assumed to conform to a normal distribution. This analysis also included adjustments for age (in 10-year age intervals), sex, geographic region, and proband characteristics that are known to predict risk of melanoma, including mole count (0, 1–10, 11–30, 31–50, >50), hair color (red, light brown or blonde, dark brown or black), eye color (dark or light), propensity to tan (moderate or deep tan after repeated sun exposure, yes or no), propensity to burn (tendency to severe sunburn with blistering, yes or no), and CDKN2A mutational status. These cutpoints were selected a priori based on common conventions in this field and available sample sizes in the subgroups. The estimated variance of the random effects was then evaluated for departure from zero to test for the presence of unexplained risk heterogeneity. This analysis was performed on the entire GEM sample of families by using Stata software ( 19 ) . This analysis was also used to test the statistical significance of differences in risk between relatives of probands with multiple primary melanoma versus those with single primary melanoma.
As a benchmark for evaluating the estimated penetrance curves, a population cumulative incidence curve was constructed to reflect the underlying population incidence of melanoma in the geographic regions from which the GEM subjects were recruited. Because the average year of diagnosis of melanoma reported in the relatives was close to 1990 and because there have been substantial secular changes in melanoma incidence in the recent past, we used population rates of melanoma for the period 1990–1994 to construct the benchmark incidence curve. Because there are also large regional variations in incidence rates, the curve was constructed from population-based age-specific incidence rates that were obtained from cancer registries in each of the nine GEM regions; these rates were then weighted in proportion to the relative number of GEM probands that were obtained from each of the nine geographic regions. The incidence rates were also weighted by sex to reflect the proportions of males and females in the GEM sample. All statistical tests were two-sided, and P <.05 was considered statistically significant.
R ESULTS
A total of 6887 potentially eligible patients diagnosed with melanoma during the designated accrual periods were ascertained and approached. After physician and patient refusals and other exclusions, a total of 3626 probands (53% participation) with family history data and adequate specimens were available for analysis. The numbers of participants by geographic site are as follows (individual participation rates are in parentheses): New South Wales, 1282 (58%); Tasmania, 143 (82%); British Columbia, 160 (55%); Ontario, 541 (48%); Torino, 168 (77%); California, 308 (44%); New Jersey, 343 (41%); North Carolina, 296 (48%); and Michigan, 385 (48%). Women were slightly more likely to participate than men (56% participation rate versus 52%), and the mean ages were similar in both groups (participant mean age = 58 years versus refuser mean age = 59 years). Of the 3626 DNA samples from these probands, 92 did not amplify exon 1α, 121 did not amplify exon 2, and 10 patients did not report family history. Thus, a total of 3550 probands whose DNA was amplified for either exon 1α or exon 2 and reported family history contributed to this analysis.
Screening by denatured high-performance liquid chromatography analysis yielded 2037 potentially positive PCR fragments, although most of these were due to common polymorphisms (nt500 and/or nt540 in the 3′ untranslated region and Ala148Thr in exon 2). Sequencing confirmed 33 individual functional mutations in 65 subjects. The mutations included four insertions or deletions in 11 patients (17% of total) affecting p16 INK4A , 16 missense mutations affecting p16 INK4A alone in 22 patients (35%), 10 missense mutations affecting both p16 INK4A and p14 ARF in 19 patients (29%), two missense mutations affecting p14 ARF only in four patients (6%), and one mutation outside the coding region (−34G/T) that is known to inhibit transcription of wild-type p16 in nine patients (14%). Of the 65 CDKN2A mutation carriers, 48% were male and 52% were female; 40 (2.0%) were identified from among the 2015 North American participants, 22 (1.6%) from among the 1379 Australian participants, and three (1.8%) from among the 166 Italian participants. Further details are provided in Fig. 1 , along with the relative frequencies of occurrence of melanoma in the first-degree relatives.
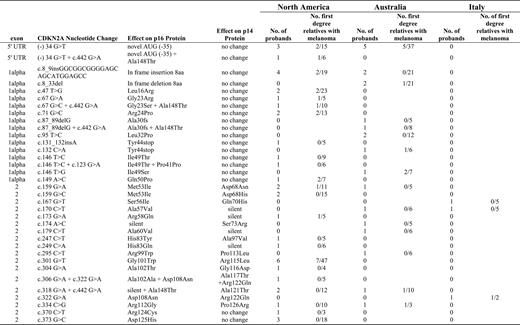
Mutations identified and melanoma frequencies in Genes Environment and Melanoma family members. Each row corresponds to one of the 33 detected mutations, two of which were also accompanied by a common polymorphism in some patients but not in others (as a result, the figure contains 35 rows). The resulting amino acid changes are shown for both p16 INK4A and p14 ARF , in addition to the frequencies in the probands and the relative frequencies of melanoma in family members. The description of sequence variations denotes nucleotide numbering considering position 1 as the first nucleotide of the start codon ( 49 ) .
Data were available for 429 first-degree relatives of the 65 CDKN2A mutation carriers. Of these, 34 (7.9%) had been diagnosed with melanoma. Among the 23 056 first-degree relatives of the 3485 probands who were not mutation carriers, 635 melanomas (2.8%) were reported. Key cumulative incidence rates are shown in Table 1 . The cumulative incidence in relatives of CDKN2A mutation carriers was 8.8% (95% CI = 5.5% to 12%) by age 50 years, 14% (95% CI = 9.3% to 19%) by age 70 years, and 16% (95% CI = 10% to 22%) by age 80 years. The corresponding cumulative incidence rates in relatives of noncarriers were 1.5% (95% CI = 1.3% to 1.7%) by age 50 years, 4.5% (95% CI = 4.1% to 4.9%) by age 70 years, and 6.2% (95% CI = 5.7% to 6.8%) by age 80 years. When the rates in both types of relatives were used to estimate the penetrance curves for CDKN2A mutation carriers, the estimates were 14% (95% CI = 8.0% to 22%) by age 50 years, 24% (95% CI = 15% to 34%) by age 70 years, and 28% (95% CI = 18% to 40%) by age 80 years. These risks were substantially higher than the population baseline risk of melanoma, which in this mixture of predominantly North American and Australian populations rises to 2.6% by age 80 years. When the penetrance in our study population was estimated separately for the Australian and North American CDKN2A mutation carriers, similar risks were observed (for example, the risk to age 80 was 28% [95% CI = 16% to 42%] in North America versus 32% [95% CI = 12% to 64%] in Australia, Table 1 ), although we caution that the number of events in the Australian sample is small and the confidence intervals are correspondingly wide, limiting the statistical power to detect differences.
Cumulative incidence of melanoma in Genes Environment and Melanoma participants *
| Age, y | |||||
|---|---|---|---|---|---|
| Population | 50 | 70 | 80 | ||
| Baseline population | 0.6% | 1.6% | 2.6% | ||
| Relatives of noncarriers † | 1.5% (1.3 to 1.7) | 4.5% (4.1 to 4.9) | 6.2% (5.7 to 6.8) | ||
| Relatives of carriers † | 8.8% (5.5 to 12) | 14% (9.3 to 19) | 16% (10 to 22) | ||
| Carriers (penetrance) ‡ | 14% (8.0 to 22) | 24% (15 to 34) | 28% (18 to 40) | ||
| Carriers/North America (penetrance) ‡ | 15% (6.9 to 23) | 28% (16 to 42) | 28% (16 to 42) | ||
| Carriers/Australia (penetrance) ‡ | 14% (3.9 to 27) | 20% (8.0 to 38) | 32% (12 to 64) | ||
| Carriers/SPM § (penetrance) ‡ | 14% (4.5 to 26) | 19% (7.0 to 37) | 19% (7.0 to 37) | ||
| Carriers/MPM ‖ (penetrance) ‡ | 16% (7.8 to 26) | 29% (19 to 42) | 35% (22 to 51) | ||
Estimate (95% confidence interval). Carriers = CDKN2A mutation carriers.
These rates are estimated by the Kaplan–Meier method.
These rates are imputed by the method of Chatterjee and Wacholder (15).
SPM = single primary melanoma.
MPM = multiple primary melanoma.
Although the number of participants with CDKN2A mutations was too small for definitive comparison of the risks conferred by the different types of mutations observed, we determined the relevant relative frequencies of occurrence of melanoma in the family members of probands with distinct mutational characteristics ( Table 2 ). Family members of probands with putative nonfunctional mutations exhibited a low frequency of melanoma, similar to the baseline population incidence. Among relatives of functional mutation carriers of the different types there was no statistically significant variation in the observed relative frequencies of melanoma ( P = .26), although this comparison has limited statistical power in our data set.
Relative frequencies of melanoma in relatives of Genes Environment and Melanoma participants by mutational characteristics
| Type of mutation | Melanoma in family members * |
|---|---|
| Insertion/deletion/missense (p16 only) | 15/226 (7%) |
| Missense (p16 and p14) | 10/118 (8%) |
| Missense (p14 only) | 1/27 (4%) |
| Noncoding transcription change | 8/58 (14%) |
| Nonfunctional | 3/343 (1%) |
| Type of mutation | Melanoma in family members * |
|---|---|
| Insertion/deletion/missense (p16 only) | 15/226 (7%) |
| Missense (p16 and p14) | 10/118 (8%) |
| Missense (p14 only) | 1/27 (4%) |
| Noncoding transcription change | 8/58 (14%) |
| Nonfunctional | 3/343 (1%) |
Number of first-degree family members with melanoma divided by total number of first-degree relatives.
We also compared the extent of familial aggregation in the CDKN2A carrier families with all 3550 GEM families by using a simple count of the number of first-degree relatives with melanoma as the defining characteristic ( Table 3 ). Sixty percent of mutation-carrying probands had no family history of melanoma in first-degree relatives, compared with 84% of the GEM subjects as a whole. Further, of the 18 (0.5%) probands in GEM with three or more first-degree relatives with melanoma, only one participant had an identified mutation in CDKN2A. These overall frequencies are similar in distribution in the 22 Australian CDKN2A mutation carriers and the 40 North American carriers, reflecting the similar penetrance estimates from Table 1 . The data also show the stronger familial aggregation in families of probands with multiple primary melanoma than in those with a single primary melanoma, leading to the higher penetrance estimate using multiple primary melanoma carrier probands ( P = .04, Table 1 ).
Aggregation of melanoma in Genes Environment and Melanoma (GEM) families
| No. of first-degree relatives with melanoma | |||||||
|---|---|---|---|---|---|---|---|
| Proband | 3+ | 2 | 1 | 0 | |||
| All probands | |||||||
| CDKN2A carrier families | 1 (1.5%) | 6 (9.2%) | 19 (29%) | 39 (60%) | |||
| All GEM families | 18 (0.5%) | 73 (2.1%) | 463 (13%) | 2996 (84%) | |||
| Australia probands | |||||||
| CDKN2A carrier families | 0 (0%) | 2 (9.1%) | 7 (32%) | 13 (59%) | |||
| All GEM families | 12 (0.9%) | 35 (2.5%) | 221 (16%) | 1109 (81%) | |||
| North American probands | |||||||
| CDKN2A carrier families | 1 (2.5%) | 4 (10%) | 11 (28%) | 24 (60%) | |||
| All GEM families | 6 (0.3%) | 38 (1.9%) | 236 (12%) | 1727 (86%) | |||
| Multiple primary melanoma probands | |||||||
| CDKN2A carrier families | 1 (2.8%) | 4 (11%) | 14 (39%) | 17 (47%) | |||
| All GEM families | 11 (0.9%) | 31 (2.6%) | 221 (18%) | 946 (78%) | |||
| Single primary melanoma probands * | |||||||
| CDKN2A carrier families | 0 (0%) | 3 (9.7%) | 5 (16%) | 23 (74%) | |||
| All GEM families | 8 (0.3%) | 43 (1.8%) | 255 (10%) | 2128 (87%) | |||
Sampling of probands was population-based during defined time periods. As a result, 93 probands were recruited to the single primary melanoma group of patients who subsequently were diagnosed with a second primary melanoma during our recruitment period. These probands are counted in both the SPM and MPM totals, in order that the SPM totals reflect the appropriate population-based sampling of single primary melanoma. SPM = single primary melanoma; MPM = multiple primary melanoma.
Finally, to evaluate residual risk heterogeneity between families, we performed a Poisson regression analysis of melanoma incidence in the relatives of all GEM families, grouping the relatives in 10-year age groups; adjusting for sex of the relative and for known phenotypic characteristics of the proband (mole count, hair color, eye color, propensity to tan, propensity to burn), multiple primary melanoma versus single primary melanoma proband, geographic region and mutation status; and including a separate random effect for each family. The variance of the random effect was shown to be different from zero with high statistical significance ( P <.001).
D ISCUSSION
In our study, using a population-based sample of case patients of melanoma, we calculated the estimated risk of melanoma in CDKN2A carriers to be 14% (95% CI = 8% to 22%) by age 50, 24% (95% CI = 15% to 34%) by age 70 years, and 28% (95% CI = 18% to 40%) by age 80 years. The risks were higher in relatives of mutation carriers with multiple primary melanoma than in relatives of mutation carriers with single primary melanoma. In the 18 case patients with three or more first-degree relatives with melanoma, only one was a CDKN2A mutation carrier.
The risk of melanoma in CDKN2A carriers has been reported consistently to be much higher than what we found ( 8 – 11 ) . The largest previous study, conducted by the Melanoma Genetics Consortium, reported risks of 30% (95% CI = 12% to 62%) to age 50 years and 67% (95% CI = 31% to 96%) to age 80 years ( 11 ) . This study was based on 80 families, of which 35% were from Australia, 19% from North America, and the remainder from Europe, as compared with the GEM frequencies of 34% from Australia, 62% from North America, and 5% from Europe. These risks are much higher than the ones we observed, and the differences are displayed graphically in Fig. 2 , along with the population baseline rates corresponding to the mixed geographic population in the GEM sample. The explanation for the differences in risk reflects the different ways in which the probands were sampled. Previous studies ( 8 – 11 ) have used data only from families already known to be predisposed to melanoma on the basis of the occurrence of at least two, or, in some cases, three or more family members diagnosed with melanoma. By contrast, our sample is “population-based,” whereby every family with a defining characteristic within a designated population is identified, although attainment of the population-based ideal is limited by the willingness of the subjects (probands) to agree to participate. In our study, the defining characteristic for inclusion of the family was the occurrence of a first or subsequent primary melanoma within the defined accrual periods, without regard to whether other family members had been diagnosed with melanoma in the past. Thus, our study pertains to people at risk of melanoma in general in the populations studied, rather than representing people with a strong family history of melanoma.
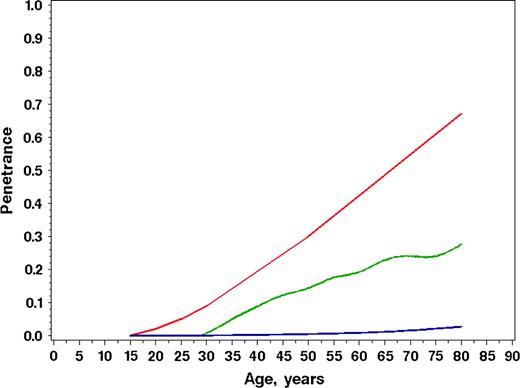
Comparison of age-specific penetrance estimates of melanoma for CDKN2A mutation carriers. Estimates from the Genes Environment and Melanoma study ( green line ), benchmark population cumulative incidence rates for melanoma (Population Incidence) ( blue line ), and the results published using 80 multiple-case melanoma families (Melanoma Genetics Consortium) ( red line ) are shown.
Why do mutation carriers identified in families at high risk for melanoma have, on average, a higher risk for melanoma than do the CDKN2A mutation carriers in our population-based sample? We suggest that there are other important unknown risk factors for melanoma and that these other factors are substantially more prevalent in the carriers who are identified through multiple-case families than in our population-based sample of patients with melanoma. Other aspects of our results also point strongly to the existence of additional, unknown genetic risk factors. We identified 18 families with three or more first-degree relatives with melanoma in addition to the proband from our total of 3550 families ( Table 3 ), and in only one of these was a mutation in CDKN2A found. The strong clustering of melanoma in the remaining families is likely to be due to other genetic risk factors. We also performed a heterogeneity analysis to test for the existence of wider variation in melanoma risk among families than is explicable by chance. This analysis demonstrated statistically significant heterogeneity, though we do not have sufficient data to perform this analysis solely in carrier families to establish whether there is risk heterogeneity among carriers. However, the concept of risk heterogeneity among carriers is supported by evidence from a previous study that other known risk factors increase risk of melanoma to a degree in CDKN2A carriers similar to that found in noncarriers ( 20 ) . This concept is further supported by the observation that the penetrance estimated from the families of carrier probands with multiple primary melanoma is higher than the estimated penetrance using families of carrier probands with single primary melanoma ( Table 1 ).
An alternative partial explanation for the higher observed risks in the study of multiple-case families may be ascertainment bias, the statistical artifact that occurs because, among families of equivalent true risk, those that exhibit more melanoma are more likely to be selected for study ( 21 ) . Although Bishop et al. ( 11 ) used a statistical technique to adjust for this phenomenon, it may not fully correct for the bias.
Our results suggest similar risks of melanoma among Australian and North American CDKN2A mutation carriers. However, these subgroup analyses, especially of the Australian cohort, are based on small numbers of events. In the study by Bishop et al. ( 11 ) , much higher risks were projected in the Australian carriers than in carriers from Europe and North America.
An important limitation of our study is that, by sampling probands who have themselves been diagnosed with melanoma, we are creating an upward bias in our estimate of penetrance. CDKN2A mutation carriers in the families in our study are probably at higher risk than all mutation carriers in the population because the probands were selected due to their diagnoses of melanoma ( 10 ) . Thus, the real average risk for CDKN2A carriers in the whole population at risk for melanoma is likely to be even lower than are the estimates obtained in this study. We used this design, similar to that of most previous population-based studies of rare, high-risk genes, for practical reasons, that is, because of the need to select participants enriched for this rare risk factor to permit adequate statistical power ( 22 ) .
Because of this design, our estimates could therefore be used to counsel individuals who learn that a first-degree relative has been diagnosed with melanoma and who test positive for a CDKN2A mutation but who have no knowledge of the disease history in their other relatives. Knowledge of such family history phenotypes is strongly predictive of risk, regardless of carrier status, for melanoma as well as for many other disorders ( 23 ) . In an earlier report from the GEM study, we showed that the risk in first-degree male relatives of probands who are diagnosed with melanoma before age 30 years is estimated to be 14% (95% CI = 6.2% to 32%) by age 80 years, a risk that is substantially elevated but not as high as our estimated risk in CDKN2A mutation carriers ( 24 ) . Thus, a strong family history of melanoma can be almost as important in risk counseling as the presence of a mutation.
There are additional important limitations to our study. First, the comparatively low participation rate of potentially eligible subjects allows for the possibility of greater participation by those with a family history of melanoma than by those without and vice versa. We have no data to evaluate this possibility. Second, the data on family occurrences of melanoma were obtained entirely from an interview with the proband, without any follow-up to verify the accuracy of reported diagnoses in relatives. This lack of follow-up reflects that our data are derived from a case–control study and that funds were not available, nor was informed consent sought, for detailed follow-up of relatives to confirm reported melanomas. However, one of the contributing centers (Orange County and San Diego, California) has conducted such follow-up (HA-C, unpublished data), and these data provide insight on the degree of possible misclassification. Verification of cancer in relatives was obtained by one or more of the following: pathology reports, linkage to the cancer registry, death certificate, or personal interview. Seventy-eight of 81 (96%) reported melanomas were confirmed, and a false-negative rate of 0.3% was observed, indicating relatively little misclassification. However, these results conflict with those from an earlier study in Australia, in which only 60% of reported melanomas could be confirmed ( 25 ) . The misclassification rate in that study may have been inflated by the increased awareness of melanoma at that time due to public health campaigns and confusion with non-melanoma skin cancer. The validity of reported family history data is considerably higher for first-degree relatives than for more distant relatives, which is why we restricted analyses to first-degree relatives, even though we collected information on grandparents, grandchildren, and half-siblings ( 26 , 27 ) . In summary, our results must be affected by some degree of misclassification, but the magnitude of any bias is likely to be modest.
A final limitation is that our genotyping strategy was directed solely at the portion of the gene believed to affect p16 INK4A . That is, we focused attention on exons 1α, 2, and 3 and adjacent intronic regions. As a result, we are likely to have missed large deletions and also deep intronic mutations that might influence melanoma risk, such as IVS2-105 ( 16 ) . Thus, our estimate of the prevalence of mutations in p16 INK4A is likely to be an underestimate of the prevalence of all mutations in CDKN2A that affect melanoma risk. Our penetrance results represent the aggregate risk of the mutations we identified, and so any mutations we failed to identify could either raise or lower our risk estimate depending on the relative strength of the effects of these missed mutations on melanoma risk. Our data provide only suggestive evidence that melanoma risk may vary depending on the specific mutation ( Fig. 1 and Table 2 ).
Much ongoing research is being devoted to finding new genetic risk factors for melanoma ( 28 ) . Our results suggest that this search is likely to be successful. Evidence from our study points to wide variation in risk of the disease, much of which cannot be explained by existing risk factors, including mutations in CDKN2A. Finding the genetic variants that contribute to this risk variation is challenging, and debate continues about the approaches most likely to be fruitful, including linkage analyses of multiple-case families, case–control studies of candidate genes, or genome-wide scans of polymorphic markers ( 29 , 30 ) . Our study suggests that CDKN2A mutations have a modest impact on the incidence of melanoma on a population basis and that genetic testing of families with a history of melanoma would be likely to identify relatively few with mutations in CDKN2A.
Our results are consistent with the much larger body of literature on the risks of breast cancer in carriers of BRCA1/BRCA2 mutations. Studies of high-risk, multiple-case families or studies involving ascertainment through genetic counseling clinics have led consistently to high estimates of penetrance ( 31 – 35 ) , while studies based on carrier families ascertained without regard to family history of breast cancer or in a population-based manner have generally led to considerably lower estimates of risk ( 36 – 43 ) . Clearly, a carrier identified serendipitously in the population is likely to have a much lower risk profile than do carriers identified in multiple-case families. This difference is probably due to the existence of genetic variants that affect risk ( 44 , 45 ) , some of which have recently been identified ( 46 – 49 ) and are possibly due to differences in risk conferred by different mutations within the same gene ( 43 ) . For both breast cancer and melanoma, much more data from additional, larger studies will be needed to further resolve these issues to facilitate more accurate risk prediction in individuals and families.
The study was conducted by the GEM Study Group: Coordinating Center, Memorial Sloan–Kettering Cancer Center, New York, NY: Marianne Berwick (PI, currently at the University of New Mexico), Colin B. Begg (Co-PI), Irene Orlow (Co-Investigator), Urvi Mujumdar (Project Coordinator), Amanda J. Hummer (Biostatistician), Nandita Mitra (Biostatistician), Klaus Busam (Dermatopathologist), Pampa Roy (Laboratory Technician), Rebecca Canchola (Laboratory Technician), Brian Clas (Laboratory Technician), Javier Cotignola (Laboratory Technician), and Yvette Monroe (Interviewer).
Study centers included the following: The University of Sydney and The Cancer Council New South Wales, Sydney, Australia: Bruce K. Armstrong (PI), Anne Kricker (Co-PI), Melisa Litchfield (Study Coordinator); Menzies Centre for Population Health Research, University of Tasmania, Hobart, Australia: Terence Dwyer (PI), Paul Tucker (Dermatopathologist), Nicola Stephens (Study Coordinator); British Columbia Cancer Agency, Vancouver, Canada: Richard P. Gallagher (PI), Teresa Switzer (Coordinator); Cancer Care Ontario, Toronto, Canada: Loraine D. Marrett (PI), Elizabeth Theis (Co-Investigator), Lynn From (Dermatopathologist), Noori Chowdhury (Coordinator), Louise Vanasse (Coordinator), Mark Purdue (Research Officer), David Northrup (Manager for CATI); Centro per la Prevenzione Oncologia Torino, Piemonte, Italy: Roberto Zanetti (PI), Stefano Rosso (Data Manager), Carlotta Sacerdote (Coordinator); University of California, Irvine: Hoda Anton-Culver (PI), Nancy Leighton (Coordinator), Maureen Gildea (Data Manager); University of Michigan, Ann Arbor: Stephen B. Gruber (PI), Joe Bonner (Data Manager), Joanne Jeter (Coordinator); New Jersey Department of Health and Senior Services, Trenton: Judith Klotz (PI), Homer Wilcox (Co-PI), Helen Weiss (Coordinator); University of North Carolina, Chapel Hill: Robert C. Millikan (PI), Nancy Thomas (Co-Investigator), Dianne Mattingly (Coordinator), Jon Player (Laboratory Technician), Chiu-Kit Tse (Data Analyst); University of Pennsylvania: Timothy R. Rebbeck (PI), Peter Kanetsky (Co-Investigator), Amy Walker (Laboratory Technician), Saarene Panossian (Laboratory Technician); Consultants: Harvey Mohrenweiser, University of California, Irvine; Richard Setlow, Brookhaven National Laboratory, Upton, NY.
Supported by the National Cancer Institute, Awards CA83180, CA098438, CA46592 and CA16086. Bruce K. Armstrong is also supported by a University of Sydney Medical Foundation Program Grant. Richard P. Gallagher is supported by a Michael Smith Foundation for Health Research Grant. Stephen B. Gruber is supported by the Becker Fund.
References
Cannon-Albright LA, Goldgar DE, Meyer LJ, Lewis CM, Anderson DE, Fountain JW, Hegi ME, Wiseman RW, Petty EM, Bale AE, et al. Assignment of a locus for familial melanoma, MLM, to chromosome 9p13-p22.
Hussussian CJ, Struewing JP, Goldstein AM, Higgins PA, Ally DS, Sheahan MD, et al. Germline p16 mutations in familial melanoma.
Kamb A, Shattuck-Eidens D, Eeles R, Liu Q, Gruis NA, Ding W, et al. Analysis of the p16 gene (CDKN2) as a candidate for the chromosome 9p melanoma susceptibility locus.
Quelle DE, Zindy F, Ashmun RA, Sherr CJ. Alternative reading frames of the INK4A tumor suppressor gene encode two unrelated proteins capable of inducing cell cycle arrest.
Stone S, Jian P, Dayananth P, Tavtigian SV, Katcher H, Parry D, Peters G, Kamb A. Complex structure and regulation of the p16 (MTS1) locus.
Zuo L, Weger J, Yang Q, Goldstein AM, Tucker MA, Walker GJ, et al. Germline mutations in the p16INK4a binding domain of CDK4 in familial melanoma.
Soufir N, Avril MF, Chompret A, Demenais F, Bombled J, Spatz A, Stoppa-Lyonnet D, Benard J, Bressac-de Paillerets B. Prevalence of p16 and CDK4 germline mutations in 48 melanoma-prone families in France. The French Familial Melanoma Study Group.
Cannon-Albright LA, Meyer LJ, Goldgar DE, Lewis CM, McWhorter WP, Jost M, Harrison D, Anderson DE, Zone JJ, Skolnick MH. Penetrance and expressivity of the chromosome 9p melanoma susceptibility locus (MLM).
Newton Bishop JA, Wachsmuth RC, Harland M, Batoille V, Pinney E, Mack P, Baglietto L, Cuzick J, Bishop DT. Genotype/phenotype and penetrance studies in melanoma families with germline CDKN2A mutations.
Box NF, Duffy DL, Chen W, Stark M, Martin NG, Sturm RA, Hayward NK. MC1R genotype modifies risk of melanoma in families segregating CDKN2A mutations.
Bishop DT, Demenais F, Goldstein AM, Bergman W, Newton Bishop J, Bressac-de Paillerets B, et al. Geographical variation in the penetrance of CDKN2A mutations for melanoma.
Begg CB. On the use of familial aggregation in population-based case probands for calculating penetrance.
Richards B, Skoletsky J, Shuber P, et al. Multiplex PCR amplification from the CFTR gene using DNA prepared from buccal swabs/brushes.
Heath EM, Morken NW, Campbell KA, Tkach D, Boyd EA, Strom D. Use of buccal cells collected in mouthwash as a source of DNA for clinical testing.
Orlow I, Roy P, Barz A, et al. Validation of a rapid detection method-denaturing high performance liquid chromatography (DHPLC) for the identification of human INK4A gene mutations.
Harland M, Taylor CF, Bass S, Churchman M, Randerson-Moor JA, Holland EA Mann GJ, Bishop DT, Newton Bishop JA. Intronic sequence variants of the CDKN2A gene in melanoma pedigrees.
Chatterjee N, Wacholder S. A marginal likelihood approach for estimating penetrance from kin–cohort designs.
Wacholder S, Hartge P, Struewing JP, Pee D, McAdams M, Brody L, et al. The kin–cohort study for estimating penetrance.
StataCorp. Stata statistical software: release 7.0. College Station (TX): Stata Corporation;
Goldstein AM, Falk RT, Fraser MC, Dracopoli NC, Sikorsky RS, Clark WH, Tucker MA. Sun-related risk factors for melanoma-prone families with CDKN2A mutations.
Elston RC. Twixt cup and lip: how intractable is the ascertainment problem?
Begg CB, Berwick M. A note on the estimation of relative risks of rare genetic susceptibility factors.
Guttmacher AE, Collins FS, Carmona RH. The family history: more important than ever.
Begg CB, Hummer A, Mujumdar U, Armstrong BK, Kricker A, Marrett LD, et al. Familial aggregation of melanoma risks in a large population-based sample of melanoma cases.
Aitken JF, Youl P, Green A, MacLennan R, Martin NG. Accuracy of case-reported family history of melanoma in Queensland, Australia.
Ziogas A, Anton-Culver H. Validation of family history data in cancer family registries.
Bondy ML, Strom SS, Colopy MW, Brown BW, Strong LC. Accuracy of family history of cancer obtained through interview with relatives of patients with childhood sarcoma.
Botstein D, Risch N. Discovering genotypes underlying human phenotypes: past successes for mendelian disease, future approaches for complex disease.
Risch N. Searching for genetic determinants in the new millennium.
Ford D, Easton DF, Bishop DT, Narod S, Goldgar DE. Risks of cancer in BRCA1 mutation carriers.
Easton DF, Ford D, Bishop DT. Breast and ovarian cancer incidence in BRCA1 mutation carriers. Breast Cancer Linkage Consortium.
Narod SA, Ford D, Devilee P, Barkadottir RB, Lynch HT, Smith SA, et al. An evaluation of genetic heterogeneity in 145 breast-ovarian cancer families.
Ford D, Easton DF, Stratton M, Narod S, Goldgar D, Devilee P, et al. Genetic heterogeneity and penetrance analysis of the BRCA1 and BRCA2 genes in breast cancer families.
King MC, Marks JH, Mandell JB. Breast and ovarian cancer risks due to inherited mutations in BRCA1 and BRCA2.
Struewing JP, Hartge P, Wacholder S, Baker SM, Berlin M, McAdams M, et al. The risk of cancer associated with specific mutations of BRCA1 and BRCA2 among Ashkenazi Jews.
Thorlacius S, Struewing JP, Hartge P, Olafsdottir GH, Sigvaldason H, Tryggvadottir L, et al. Population-based study of risk of brast cancer in carriers of BRCA2 mutation.
Hopper JL, Southey MC, Dite GS, Jolley DJ, Giles GG, McCredie MR, et al. Population-based estimate of the average age-specific cumulative risk of breast cancer for a defined set of protein-truncating mutations in BRCA1 and BRCA2.
Warner E, Foulkes W, Goodwin P, Meschino W, Blondal J, Paterson C, et al. Prevalence and penetrance of BRCA1 and BRCA2 gene mutations in unselected Ashkenazi Jewish women with breast cancer.
Anglian Breast Cancer Study Group. Prevalence and penetrance of BRCA1 and BRCA2 mutations in a population-based series of breast cancer cases.
Risch HA, McLaughlin JR, Cole DE, Rosen B, Bradley L, Kwan E, et al. Prevalence and penetrance of germline BRCA1 and BRCA2 mutations in a population series of 649 women with ovarian cancer.
Satagopan JM, Offit K, Foulkes W, Robson ME, Wacholder S, Eng GM, et al. The lifetime risk of breast cancer in Ashkenazi Jewish carriers of BRCA1 and BRCA2 mutations.
Antoniou A, Pharoah PD, Narod S, Risch HA, Eyfjord JE, Hopper JL, et al. Average risks of breast and ovarian cancer associated with BRCA1 or BRCA2 mutations detected in case series unselected for family history: a combined analysis of 22 studies.
Antoniou AC, Pharoah PD, McMullan G, Day NE, Ponder BAJ, Easton D. Evidence for further breast cancer susceptibility genes in addition to BRCA1 and BRCA2 in a population-based study.
Pharoah PDP, Antoniou A, Bobrow M, Zimmern RL, Easton DF, Ponder BAJ. Polygenic susceptibility to breast cancer and implications for prevention.
Matsuda M, Miyagawa K, Takahashi M, Fukuda T, Kataoka T, Asahar T, et al. Mutations in the RAD54 recombination gene in primary cancer.
Bhattacharyya A, Ear US, Koller BH, Weichselbaum RR, Bishop DK. The breast cancer susceptibility gene BRCA1 is required for subnuclear assembly of Rad51 and survival following treatment with the DNA cross-linking agent cisplatin.
Tutt A, Ashworth A. The relationship between the roles of BRCA genes in DNA repair and cancer predisposition.

