


Abstract
Background: The recall rate (i.e., the rate at which mammographically screened women are recalled for additional assessment) in the Dutch breast screening program (0.89% in 2000 for subsequent examinations) is the lowest worldwide, with possible consequences including higher rates of late-detected (i.e., “missed”) interval and screen-detected cancers. To estimate the effect of changes in recall rate on earlier detection of cancers, we carried out a blinded review of interval and screen-detected cancers in the Dutch screening program. Methods: A total of 495 sets of screen-negative mammograms (prediagnostic mammogram and the immediate previous mammogram) were collected from women participating in the biennial Dutch screening program. Of these, 250 were from control subjects, and 245 were from women who were subsequently diagnosed with breast cancer (123 interval and 122 screen-detected cancers). These mammograms were read by 15 radiologists who specialize in screening mammography and were blinded to outcome. Mean detection sensitivities for different false-positive rates were calculated using a linear mixed model. These results were used to calculate the effect of recall rate adjustment on earlier detection of cancers and numbers of false-positives. Results: Increasing the recall rate to 2.0% would increase the detection rate from 4.20‰ to 4.52‰ due to the earlier detection of interval cancers. Moreover, 0.54‰ of the screen-detected cancers would be detected 2 years earlier (late screen-detected cancers). At recall rates of 3.0% and 4.0% the detection rate would increase to 4.58‰ and 4.63‰, respectively, and 0.64‰ and 0.72‰, respectively, of the screen-detected cancers would be detected 2 years earlier. For each 1.0% incremental increase in recall rate above 5.0%, the detection rate would increase by approximately 0.03‰, with positive predictive values decreasing to below 10%. Conclusion: Breast cancer can be detected earlier by lowering the threshold for recall, especially for recall rates of 1%–4%. With further recall rate increases, cancer detection levels off with a disproportionate increase of false-positive rates.
The Annual Report of the National Evaluation Team for Breast Cancer Screening (NETB) in The Netherlands ( 1 ) showed that the outcomes of subsequent mammography screening examinations (i.e., biennial examinations subsequent to the first examination) of the population-based Dutch screening program fell short of expected performance values for the period 1990–1995. That is, the detection rate was lower than expected (observed rate = 3.4‰; expected rate = 4.3‰), the interval cancer rate was higher than expected (observed rate = 0.99‰; expected rate = 0.96‰), and the stage distribution of screen-detected cancers was less favorable than expected ( 1 – 3 ) . These results were suggested to be attributable to the very low recall rate (<1%) in the subsequent screening examinations of the Dutch program in comparison with that of screening programs in other countries, which have recall rates of 2%–5% ( 3 – 5 ) . It is anticipated that an increase in the recall rate should improve the breast cancer detection rate by reducing the number of both interval- and late screen-detected cancers (i.e., cancers that could be detected earlier, collectively referred to as “missed cancers”). However, an increase in the recall rate would also increase the false-positive rate, resulting in undesirable consequences such as excess further assessment, unnecessary surgery, patient anxiety, and additional financial costs. Recent studies ( 6 ) of different population-based screening programs have showed that the relationship(s) among recall rate, detection rate, and false-positive rate is not straightforward ( 7 ) . That is, a high recall rate will not necessarily result in a high detection rate. Moreover, it is not possible to define an optimal recall rate because desirable screening performance is influenced by several factors, including health policy issues, that differ from country to country.
Nevertheless, it should be possible to determine a range of recall rates and the concomitant breast cancer detection and false-positive rates. We report such an analysis in this article that is based on a review of a series of interval- and screen-detected breast cancers from the Dutch screening program. The low recall rate of the Dutch screening program (<1%) provides a unique opportunity for such a study because it allowed for the collection of a random selection of originally screen-negative, prediagnostic mammograms (from both non-recalled cancer case patients and noncancer case subjects [control subjects]) whose mammograms may have contained subtle signs of possible cancer. In other screening programs with lower thresholds for calling a mammogram suspicious, these women could have been recalled for additional testing.
By performing a blinded review of screening mammograms from the Dutch program, we aimed to determine the effect of changes in recall rate on earlier detection of cancers in women who were not recalled, in relation to false-positive rates. Our panel of 15 screening radiologists included 10 radiologists from The Netherlands and five radiologists who were from countries whose screening mammography programs had much higher average recall rates than the Dutch screening program. We anticipated that the five non-Dutch radiologists might pick up more suspicious lesions with subtle radiologic signs than the 10 Dutch radiologists. Hence, we used individual and panel-based review results to calculate detection sensitivity rates at various levels of false-positive recall rates. These data further allowed us to estimate the effect of different recall rates on earlier detection of both interval- and screen-detected cancers.
M ATERIALS AND M ETHODS
The Dutch Screening Program
In The Netherlands, women aged 50–75 years are invited biennially for mammography screening through the Dutch screening program ( 3 ) . This population-based nationwide program was started in 1989 and reached its full population capacity in 1997. At the first screening examination, mediolateral oblique and craniocaudal views are obtained. At subsequent examinations, only mediolateral oblique views are obtained routinely unless additional craniocaudal views are deemed to be useful in improving assessment, for instance, in women with dense breast tissue or in whom a suspicious lesion has been identified. Screening mammograms are developed on site so that the radiographer can make repeat mammograms immediately in the case of technical problems. Physical examination of the patient is not part of the screening program. Thus, recall rates are based on mammography interpretations alone and not on technical imperfection or the result of physical examination.
Follow-up of the participants in the Dutch screening program is of high quality, with fairly complete data collection based on a nationwide cancer registry and follow-up system. In 2000, more than 1 million women received an invitation to participate in the screening program, and approximately 800 000 women were screened (overall attendance rate of 78.5%). For 14% of those women, the screening examination was their first; the remaining 86% of the women were undergoing a subsequent screening examination. Approximately 9000 women were recalled (for an overall recall rate of 1.12%) to a general hospital for further assessment (i.e., diagnostic mammography, additional imaging, and, if necessary, biopsy), of whom 4500 were diagnosed with breast cancer (overall detection rate of 5‰). In a separate analysis of only those women undergoing subsequent screening examinations, the attendance rate was 79%, the recall rate was 0.89%, and the detection rate was 4.2‰ ( 8 ) . The breast cancer mortality rate in Dutch women aged 55–74 years in 1986–1988, before the Dutch screening program began, was 105.2 per 100 000; in 2001, after the screening program was in place, the mortality rate was 85.3 per 100 000 (difference = 19.9%; 95% confidence interval = 14.2% to 26.6%; P <.001) ( 9 ) .
Study Mammograms
All original screening mammograms reviewed in this study were obtained from the Dutch screening program. Women participating in this program were asked to give written informed consent for their data to be used for evaluative purposes. Institutional review board approval was not required.
Screening mammograms were collected from five of the nine Dutch regional screening organizations on the basis of their geographic spread. The administrative offices of each of the five organizations were asked to provide the screening mammograms of 30 consecutive women recently (i.e., 1997–1999) diagnosed with screen-detected cancer, of 30 consecutive women recently diagnosed with interval cancer, and of 60 consecutive control women without evidence of breast cancer. The women were included in this study only if screen-negative mammograms from at least two screening examinations preceding diagnosis were available. Thus, all women studied had had a negative screening examination between 1995 and 1997. This negative screening examination, the more recent of the two preceding negative examinations, is the examination we studied; it is denoted as the index examination. In addition, all women also had a previous negative screening examination before the index examination, i.e., between 1993 and 1995, which was denoted as the previous examination. Mammograms for each eligible woman were reviewed for technical quality without knowledge of patient outcome.
Of the 300 case patients and 300 control subjects, 105 subjects (55 case patients and 50 control subjects) were excluded from the study because of one of the following reasons: 1) the mammograms were of insufficient image quality, 2) the mammogram was poorly positioned, 3) the woman lacked a diagnostic mammogram, or 4) the woman had no histopathologic confirmation of breast cancer. Of the 245 case patients included in the study, two women had bilateral screen-detected breast cancer and one woman had two different sites of interval cancer (i.e., ipsilateral multicentric); each of these three women was considered to have two separate cancer sites. Altogether, therefore, a total of 245 cancer case patients (i.e., 248 cancer sites) and 250 control subjects were included in the study. The 248 cancer sites included 124 lesions that had been clinically diagnosed as primary interval breast cancer after a negative screening result in the index examination and before the patient's invitation to the next screening examination (average interval time = 14 months, range = 3–26 months). The other 124 cancer sites were detected at the screening examination that occurred 2 years after the negative index examination. The 250 control subjects were women who had no evidence of breast cancer in all three screening examinations (i.e., previous examination, index examination, and next examination 2 years later).
Blinded Radiologist Review
A panel of 15 screening radiologists (10 from The Netherlands and five from other countries) reviewed the 495 sets of mammograms from the index examination together with the mammograms from the previous examination for comparison in a random sequence. All of the Dutch radiologists had been trained at and certified by the National Expert and Training Center for Breast Cancer Screening (NETC) in Nijmegen, The Netherlands, and they represented all nine of the regional screening organizations of the Dutch screening program. These radiologists have been involved in mammographic screening for a median of 10 years (range = 4–13 years) and have been reading a median of 13 500 mammograms per year (range = 6000–55 000 per year). The five non-Dutch radiologists (one from Sweden, one from Italy, and three from the United Kingdom) have been involved in mammographic screening for over 10 years, and all of them have been reading at least 15 000 mammograms per year.
In the review process, which required 2 days, each radiologist studied 10 batches of about 50 series of mammograms in sessions of 60–90 minutes. Although the review was blinded, the radiologists were told that the prevalence of cancer in the study did not reflect a normal screening situation. Each radiologist independently assessed each index mammogram in conjunction with the previous mammograms to permit detection of possible temporal changes. The identification and localization of a suspicious lesion by one radiologist was called a finding. The radiologists drew the contours of each finding on a printed copy of the index mammogram. These findings were then subsequently transferred to a digital format.
For each set of mammographic films (both left and right side of the oblique view and craniocaudal view, if available), the radiologist recorded the characteristics (e.g., mass, microcalcifications, and architectorial distortion) of the findings for the index mammogram and the probability of malignancy for each finding using a 13-point scale ranging from less than 0.5% to more than 95%. The malignancy probability scale increased linearly, with steps of 10% from 10% to 90% and ended with the highest upper category of more than 95%. The radiologists were asked to report as many possible suspicious lesions as they deemed reasonable, including lesions that they would normally not consider for recall. To better spread the reporting of findings in the low probability range, the malignancy probability scale was subdivided into three regions at the lower end of the range (less than 0.5%, 1%–2%, and 5%).
Tumor Localization
The diagnostic mammograms and the radiology and pathology reports, which specified the location of the cancer site for each patient, were reviewed by one of the study authors (JHCLH, called the study radiologist, who had read more than 10 000 screening mammograms per year since 1975). For each patient, the study radiologist marked the site of the cancer on the print of the index mammogram by comparing the index mammograms with the diagnostic mammograms. A finding by the panel radiologists was categorized as a “hit” when the center of the annotation was within 2.5 cm of the center of the marked tumor area. When no sign of cancer was visible on the index mammogram, the corresponding region of the lesion was annotated by the study radiologist as tumor area by visually matching the index mammogram with the diagnostic mammogram. No localization of the cancer was drawn when the cancer was radiologically occult on the diagnostic mammogram (i.e., for 13 of the 248 cancers sites).
Statistical Methods
Each radiologist marked his or her findings on each mammogram and rated their findings with a malignancy probability score (see above). If an individual radiologist marked more than one finding, only the finding with the highest malignancy probability score was used in the analysis. This approach was applied to both women with and women without breast cancer. To analyze results on a case level, we defined true-positive and false-positive outcomes in the following way. Given a certain threshold value for malignancy probability, a true-positive outcome (i.e., a hit) was noted if the radiologist correctly localized the cancer and rated it with a malignancy probability score that exceeded this threshold value. A false-positive outcome was noted only if the radiologist rated a finding with a malignancy probability score that exceeded the given threshold value on a mammogram of a women without cancer. Using this approach, we could calculate the false-positive rate and the true-positive rate of each radiologist at any malignancy probability rating. A graph displaying the true-positive rate by the false-positive rate (for different threshold values of malignancy probability), including the correctness of the localization of the tumor, is known in the literature as the localization-response receiver operating characteristic (LROC) curve ( 10 ) ( Fig. 1 ).
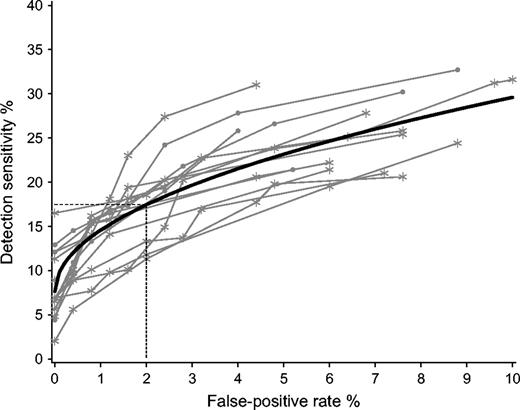
Localization-response receiver operating characteristic (LROC) curve of detection sensitivity versus false-positive rate. Each radiologist is represented by several points, resulting in the LROC curve ( gray lines ) of that specific radiologist. Black line = the average LROC curve for all 15 panel radiologists, using a linear mixed model. * = points displaying detection sensitivity at various false-positive rates from the 10 Dutch radiologists for the assigned probability of malignancy scores. • = points displaying detection sensitivity at various false-positive rates from the five non-Dutch radiologists for the assigned probability of malignancy scores. On average, the detection sensitivity rate at a 2.0% false-positive rate ( dotted lines ) is 17.4% (95% confidence interval = 15.5% to 19.4%).
The LROC curve of a specific radiologist measures the ability of that radiologist to localize a tumor. That is, it measures not only whether the radiologist detects breast cancer but also whether the location of the annotated tumor matches the location of the cancer. It has been argued that in most screening tests, false-positive rates above a given value are of minimal practical use. Also in our study, above a 10% false-positive rate, the data were sparse. We therefore put the maximum false-positive recall rate at 10%. The averages of the radiologists' LROC curves at false-positive rates ranging from 0% to 10% were estimated using a linear mixed model because this model fully accounts for the repeated measurements design. The dependent variable of the linear mixed model was the true-positive rate (i.e., detection sensitivity), the independent random variable was the radiologist (i.e., using an identification number), and the continuous independent variable was the square root of the false-positive rate. Random variations between radiologists regarding the levels (i.e., the intercept) and the shape (i.e., regression coefficient of the square root form) of the LROC curves were allowed because the addition of these random effects to the model improved the fit of the data.
To compare the performances of the Dutch radiologists with those of the non-Dutch radiologists, we included a class variable and its interaction term with the square root of the false-positive rate in the overall model. This approach allows for differences in the square root form of the average LROC curve between the Dutch and non-Dutch radiologists. The likelihood ratio test was used to test the overall statistical significance of differences between the Dutch and the non-Dutch radiologists. The overall model was also applied separately to the interval and the screen-detected cancers.
Calculation of the Number of Earlier Detected Cancers and False-Positive Findings
It is possible to extrapolate results found in an observer study to screening practices by making use of baseline figures of the screening program from which the case material was drawn. This methodology requires calculation of the effect of additional recalls on interval cancers, screen-detected cancers, and false-positive normal findings using the mean detectability of lesions provided by the LROC results. We used the observed figures of the Dutch screening program for recall, detection, and interval rates for subsequent screening examinations in the year 2000 ( 8 ) . The effect of additional recalls on each of the subgroups is as follows.
Interval cancers.
The proportion of interval cancers (at a given threshold of the false-positive rate) that were detected by the panel of radiologists on the index mammograms reflects the potential for a permanent increase in the cancer detection rate of the screening program from which the cancer cases were collected. Using the baseline interval rate of the Dutch screening program, we could calculate the effect of a range of recall values on the detection of additional cancers.
Screen-detected cancers.
The proportion of screen-detected cancers that were detected by the panel of radiologists on the index mammograms reflects the potential for an increase in earlier detection—that is, detection of a cancer at an earlier screening examination. This time shift in the detection of a cancer will lead to a once-only increase in the number of screen-detected cancers at the initiation of a higher recall rate. By maintaining the same level of diagnostic performance at each subsequent screening examination, the same proportion of tumors will be detected earlier. However, this time shift in earlier detection will not influence the total number of screen-detected cancers at subsequent screening examinations. Thus, at steady state, earlier detection of screen-detected cancers will lead to the usual detection rates, including the series cancer cases with a diagnosis advanced in time (i.e., earlier diagnosed cancers). We defined the total number of earlier detected cancers as the sum of the number of earlier detected interval cancers and of the number of earlier (by 2 years) detected screen-detected cancers.
False-positive normal findings.
Index mammograms of normal nonrecalled control subjects were randomly sampled from negative-screening subjects. Recalls that were found to be normal or benign at additional assessment were not included in the study material. Therefore, false-positive findings of control subjects in this study are additional to the baseline false-positive rate in current Dutch screening practice.
R ESULTS
At review by the study radiologist (JHCLH), 142 (57%) of the 248 cancer sites had a suspicious lesion that could be seen and marked by him on the index mammogram. At least one of the 15 radiologists noticed and marked the suspicious lesion for 135 of the 142 sites. For 50 of the cancer sites at least 12 of the 15 radiologists marked the lesion, and all 15 radiologists noticed and marked the suspicious lesion for 28 of the sites. For the other 106 (43%) cancer sites, cancer was not visible on the index mammogram and consequently none of the radiologists annotated a suspicious lesion corresponding with breast cancer. All together, the 15 radiologists recorded 3145 findings on the mammograms from case patients, 1436 of which were hits. They also recorded 2003 findings on 242 (97%) of the 250 mammograms from control subjects (none of the radiologists annotated any findings for eight [3%] of the control mammograms).
Detection Sensitivity
Mean detection sensitivity was estimated with the linear mixed model based on the sensitivity data at different false-positive threshold values for all 15 radiologists and for the 10 Dutch and five non-Dutch radiologists separately ( Table 1 ). Based on these data, LROC curves were constructed for each individual radiologist and for all radiologists together as an average ( Fig. 1 ). The mean detection sensitivity for all radiologists at a false-positive value of 0.5% (i.e., a recall of approximately 1 in 250 of the control subjects in this study set) was 12.5% (95% confidence interval [CI] = 10.7% to 14.4%). At this detection sensitivity, 31 of the 245 women with originally screen-negative breast cancer would have been recalled based on their index mammograms. At false-positive rates of 4% and 8%, the mean detection sensitivities increased to 21.5% (95% CI = 19.2% to 23.8%) and 27.3% (95% CI = 24.5% to 30.1%), respectively. According to the data in Table 1 and Fig. 1 , which depicts the detection sensitivities of the individual radiologists, the five non-Dutch radiologists performed somewhat better than the 10 Dutch radiologists. However, this difference in mean detection sensitivity was not statistically significant ( P = .29) using the likelihood ratio test, comparing the models with and without the Dutch/non-Dutch indicator variable.
Estimated detection sensitivity at different false-positive rates for subgroups of radiologists and cancer cases, using the linear mixed model
| False-positive rate | |||||||||||||||
|---|---|---|---|---|---|---|---|---|---|---|---|---|---|---|---|
| 0.5% | 1.0% | 1.5% | 2.0% * | 3.0% | 4.0% | 6.0% | 8.0% | ||||||||
| Type of radiologist | |||||||||||||||
| Dutch (95% CI † ) | 11.7% (9.7 to 13.8) | 13.7% (11.6 to 15.8) | 15.2% (13.1 to 17.4) | 16.5% (14.3 to 18.8) | 18.7% (16.3 to 21.1) | 20.5% (17.9 to 23.1) | 23.5% (20.6 to 26.4) | 26.1% (22.9 to 29.3) | |||||||
| Non-Dutch (95% CI) | 14.2% (11.3 to 17.0) | 16.3% (13.3 to 19.2) | 17.9% (14.9 to 21.0) | 19.3% (16.1 to 22.5) | 21.6% (18.2 to 25.0) | 23.6% (20.0 to 27.2) | 26.9% (22.8 to 30.9) | 29.6% (25.1 to 34.1) | |||||||
| Type of cancer detection | |||||||||||||||
| Interval (95% CI) | 14.2% (12.2 to 16.2) | 16.5% (14.4 to 18.6) | 18.3% (16.1 to 20.5) | 19.7% (17.4 to 22.1) | 22.2% (19.7 to 24.8) | 24.3% (21.6 to 27.1) | 27.9% (24.7 to 31.1) | 30.8% (27.3 to 34.4) | |||||||
| Screen-detected (95% CI) | 10.9% (8.9 to 12.8) | 12.6% (10.6 to 14.6) | 13.9% (11.9 to 16.0) | 15.1% (13.0 to 17.2) | 17.0% (17.8 to 19.2) | 18.6% (16.3 to 20.9) | 21.3% (18.8 to 23.7) | 23.5% (20.8 to 26.2) | |||||||
| All radiologists ‡ (95% CI) | 12.5% (10.7 to 14.4) | 14.6% (12.7 to 16.4) | 16.1% (14.2 to 18.1) | 17.4% * (15.5 to 19.4) | 19.7% (17.5 to 21.8) | 21.5% (19.2 to 23.8) | 24.6% (22.1 to 27.2) | 27.3% (24.5 to 30.1) | |||||||
Extrapolation of Study Results to Mammography Screening Programs
The mean detection sensitivity at different false-positive rates for both interval- and screen-detected cancers is shown in Table 1 . More interval cancers were found by the radiologists on the basis of the index mammograms than were screen-detected cancers. For both types of cancers, an increase in the false-positive rate resulted in an increase in the detection sensitivity. Breast cancer cases detected in this review study are in addition to the baseline figures of the actual Dutch screening practice. Cancers that were originally diagnosed as interval cancers would become extra screen-detected cancers, thereby increasing the screen detection rate and reducing the number of interval cancers by the same extent. Cancers that were originally late screen-detected cancers will remain screen-detected; however, they will have their diagnosis advanced in time. However, all of these changes in detection rate come at the expense of increasing the false-positive rate ( Table 2 and Fig. 2 ).
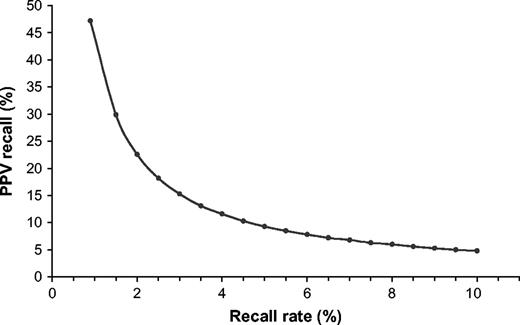
Positive predictive value for recall versus recall rates. PPV, positive predictive value for recall refers to the number of cancer cases detected among 100 positive screening tests (i.e., recalled women). Points represent the positive predictive values for recall rates shown in Table 2 and are joined by a line for ease of presentation.
Estimated gain in rates and numbers of earlier detected cancers at various recall rates in subsequent screening examinations *
| Outcomes measures calculated on the basis of the Dutch screening program | Outcome measures extrapolated to 500 000 subsequent screening examinations | ||||||||||||||
|---|---|---|---|---|---|---|---|---|---|---|---|---|---|---|---|
| Recall rate (%) | Detection rate (‰) | Interval cancer rate (‰) † | 2-years earlier screen-detected cancer (‰) ‡ | Positive predictive value of recall (‰) § | No. recalled | Total no. of cancers detected earlier ∥ | No. of recalled women per one earlier detected cancer ¶ | No. of earlier detected cancer per 1000 additional recalled women ¶ | |||||||
| 0.89 # | 4.2 # | 1.9 # | 47.2 # | 4450 # | |||||||||||
| 2.0 | 4.52 | 1.58 | 0.54 | 22.6 | 10 000 | 430 | 43 | 23.1 | |||||||
| 3.0 | 4.58 | 1.52 | 0.64 | 15.3 | 15 000 | 509 | 71 | 14.2 | |||||||
| 4.0 | 4.63 | 1.47 | 0.72 | 11.6 | 20 000 | 572 | 87 | 11.5 | |||||||
| 5.0 | 4.66 | 1.44 | 0.78 | 9.3 | 25 000 | 624 | 101 | 10.0 | |||||||
| 6.0 | 4.70 | 1.40 | 0.84 | 7.8 | 30 000 | 671 | 112 | 8.9 | |||||||
| 7.0 | 4.73 | 1.37 | 0.90 | 6.8 | 35 000 | 713 | 123 | 8.1 | |||||||
| 8.0 | 4.76 | 1.34 | 0.94 | 6.0 | 40 000 | 752 | 133 | 7.5 | |||||||
| 9.0 | 4.79 | 1.31 | 0.99 | 5.3 | 45 000 | 789 | 142 | 7.0 | |||||||
| 10.0 | 4.81 | 1.29 | 1.03 | 4.8 | 50 000 | 823 | 151 | 6.6 | |||||||
Using figures from the linear mixed model ( Table 1 ) and from the subsequent screening examinations of the Dutch screening program ( 8 ) , Figures are calculated for the steady-state situation.
Interval cancer rate at a 24-month screening interval period.
2-years earlier screen-detected cancer rates = rates of otherwise late screen-detected cancers that could have been detected 2-years earlier.
Positive predictive value of recall = the number of cancer cases detected among 100 positive screening tests (i.e., recalled women).
Total number of cancers detected earlier = the number of earlier screen-detected interval cancers plus the number of 2-years earlier screen-detected cancers (otherwise late screen-detected cancers).
Numbers at x % recall are calculated as midpoint estimates of the interval with a lower boundary at a ( x − 1)% recall rate and a upper boundary at a ( x + 1)% recall rate.
Starting point from the Dutch screening program ( 8 ) .
We used the observed Dutch screening program figures (i.e., recall, detection and interval cancer rates) for subsequent screening examinations in the year 2000 ( 8 ) to extrapolate our results to mammography screening programs in general. The baseline figures for our calculations were a recall rate of 0.89%, which is a composite of a detection rate of 4.2‰ and a false-positive rate of 4.7‰, a positive predictive value of recall of 47% and a 24-month interval cancer rate of 1.9‰ ( Table 2 ).
Increasing the recall rate to 2.0% would increase the detection rate from 4.2‰ to 4.52‰ and would decrease the interval cancer rate from 1.9‰ to 1.58‰, a difference in both rates of 0.32‰. A recall rate of 2.0% corresponds to a 23% positive predictive value of recall. In addition, 0.54‰ of otherwise late screen-detected cancers would be detected 2 years earlier. Increasing the recall rate to 3% and 4% would increase the detection rate to 4.58‰ and 4.63‰, respectively, and the proportion of otherwise late screen-detected cancers that would be detected 2 years earlier would increase to 0.64‰ and 0.72‰, respectively. At still higher recall rates, the amount of increase in the detection rate diminishes. Moreover, for each 1% incremental increase in recall rate above 5%, the detection rate would increase by approximately 0.03‰, the proportion of screen-detected cancers that would have been found 2 years earlier would increase by a maximum of 0.06‰, and the positive predictive values of recall would decrease to below 10%.
This law of diminishing returns is also illustrated in the results in the right side of Table 2 , which shows the results extrapolated to a screening population of 500 000 women. Lowering the threshold for recall will result in a higher number of recalled women for each additional earlier detected cancer. For example, if we increase the recall rate from 2.0% to 4.0% (i.e., a midpoint of 3.0%), 142 women (i.e., 572 − 430) with breast cancer would be detected earlier. This number is weighted against an excess number of 10 000 recalled women (i.e., 20 000 − 10 000), which results in 71 recalled women per each earlier detected breast cancer and equates to 14.2 earlier detected cancers per 1000 additionally recalled women. Similarly, at a recall rate of 4%, 87 additional women would be recalled per each earlier detected breast cancer that equates to 11.5 earlier detected cancers per 1000 additionally recalled women. With recall rates of 5.0% or more, the number of earlier detected cancers decreases to fewer than 10 per 1000 additional recalled women.
D ISCUSSION
The ultimate goal of any breast cancer screening program is to improve patient mortality and decrease morbidity by detecting a high number of early-stage cancers without substantially increasing the number of false-positive findings, i.e., women recalled for further assessment who do not have cancer. It is known that there is a relationship between recall rate and detection rate; however, the relationship is not straightforward. In general, it is likely that more cancers will be detected when higher numbers of women are recalled. However, Smith-Bindman et al. ( 7 ) reported recently that although recall rates are twice as high in the United States as they are in the United Kingdom, cancer detection rates are similar.
Several factors may influence recall rates in association with detection rates. One is undoubtedly the radiologist's skill at reading and interpreting mammograms. In addition, other factors, such as characteristics of the population screened and features of national health policy issues (e.g., malpractice concerns) may strongly influence recall rates in different screening programs ( 6 ) . Therefore, it is not possible to define a single optimal recall rate for all different screening programs. Nevertheless, it would assist both physicians and health-care policy makers to be able to refer to a certain range of reference values showing the relationship between recall rates and detection rates.
The aim of the present study was to define such a range of reference values by using as a baseline the data of the Dutch screening program, which has one of the lowest recall rates (<1%) worldwide ( 4 , 8 ) for subsequent examinations. One might expect that, in a screening program with a very low recall rate, some cancers would be detected late as either interval or late screen-detected cancers. Hence, in our study, we assessed the potential to detect these cancers earlier. The design of the study allowed us to calculate changes in the detection rate and false-positive rate at incrementally increasing recall rates. We found that neither of the two extremes of the recall rate range (<1.0% to >8%) would be optimal in a screening program. At the lower end of the range (i.e., <1.0% recall rate), the number of cancers that were missed and detected late would be relatively high. With a relatively small number of additional recalls of women with subtle, less obvious mammographic abnormalities, the detection rate could be increased. By contrast, at the upper end of the range (i.e., >8% recall rate), the trade off between changes in detection rate and recall rate is poor. That is, for a relatively small increase in detection rate, a high number of women without cancer would be recalled. For example, the extrapolation showed that, for the general population for each earlier detected cancer at such a recall rate, approximately 150 women with false-positive results would be recalled ( Table 2 ).
Yankaskas et al. ( 11 ) recently reported similar results: they showed that at recall rates above 4.8%, detection sensitivity increased very little. At a recall rate of 5.9%, positive predictive values began to decrease in a statistically significant fashion. By contrast, Gur et al. ( 12 ) reported a statistically significant correlation between recall rate and detection rate at recall rates between 8% and 17%. However, these authors did not assess the number of excess false-positive findings accompanying such a recall policy.
The results of a screening review study are highly dependent on the mammography reading skills of the review panel. On average, the 15 radiologists had a median of 10 years of experience in mammography screening and read more than 6000 mammograms per year. Nevertheless, the radiologists operated with different recall policies in their respective screening programs in their own countries. From the beginning of mammography screening in The Netherlands, the potential for a large number of false-positive findings was a major concern to the officials of the screening program because of the possible consequences of unnecessary surgery, patient anxiety, negative influence on participation, and costs. Therefore, in their daily practice, the 10 Dutch radiologists are currently operating at a relatively low recall rate (approximately 1%), whereas the five non-Dutch radiologists have been maintaining a recall level two to five times higher. In addition, there could have been a performance difference between the two groups of radiologists due to the longer mean screening experience of the non-Dutch radiologists. Although the average detection sensitivity of the non-Dutch radiologists was somewhat higher than that of the Dutch radiologists, the difference was not statistically significant ( P = .29; Table 1 ; Fig. 1 ). Therefore, we used the average performance level of all 15 radiologists for our calculations. One may consider this performance level as a desirable performance level (i.e., a level that is not too high and not too low) in most screening programs.
Two types of bias should be considered when one is evaluating review studies such as this one. One is test situation bias, in which the performance level is compared with that of clinical practice; the second is context bias, which results from the high number of cancer cases in the test set. Both types of bias may increase performance level—that is, bias may decrease the threshold value of recall in the study. However, use of a malignancy probability scale in our study rules out the effect of both biases on our results.
An additional question is whether false negative findings that are based on preceding mammograms in breast cancer screening can result from abnormalities that are overlooked (i.e., perception error) or misinterpreted (i.e., interpretation error). The earlier detection of interval and screen-detected cancers in the present study is based predominantly on improved interpretation. This assumption is supported by the fact that 50 of the 142 potentially visible lesions were annotated by at least 12 of the 15 panel radiologists, albeit with different interpretations, i.e., for rating of malignancy probability. Moreover, any benefit of lowering the threshold of recall must be based on the interpretation by the radiologist of already perceived lesions ( 13 ) .
The reviewed mammograms of the cancer cases in this study were from prior screening examinations, which were originally categorized as screen-negative. Thus, the observer performance we measured is related to nonrecalled cancer cases, which may explain the low detection sensitivity of 21%–27% in our study in comparison with detection sensitivity in routine screening practices (70%–80%) ( 14 ) . Similar detection sensitivity (27%) results were reported recently by Warren Burhenne et al. ( 15 ) in a multicenter US review study. The total increase in the number of earlier detected cancers consists of the number of interval cancers and the number of late screen-detected cancers recognized on the prediagnostic index mammogram. The major effect of earlier detection is the potential to detect these cancers at a less advanced and more curable stage.
In conclusion, a delicate balance exists between recall, detection, and false-positive rates. At a low recall rate (i.e., <1%), when only women with more or less obvious mammographic abnormalities are recalled, a number of cancer cases will surface as interval cancers or late screen-detected cancers at a more advanced tumor stage. By lowering the threshold for recall by focusing on more subtle mammographic abnormalities, a substantial number of cancers could be detected earlier. The effect of increasing the recall rate is most obvious between 1% and 4 %. At still higher recall rates, cancer detection rates level off, with very low positive predictive values of recall as an expression of gradually increasing numbers of false-positives per one single earlier detected cancer. To benefit most from a higher recall rate, radiologists should be able to identify the cancers with subtle mammographic features, which are often based on temporal changes.
Dr. Hendriks died before this manuscript was completed.
We gratefully acknowledge the participating radiologists for their review of the mammograms in the study. The non-Dutch radiologists were I. Andersson, Malmö, Sweden; A. E. Kirkpatrick, Edinburgh, UK; M. J. Michell, London, UK; M. Rosselli del Turco, Florence, Italy; and A. R. M. Wilson, Nottingham, UK. The Dutch radiologists were Y. T. van Aardenne, D. Beijerinck, C. Boetes, J. H. B. Boomsma, W. G. J. Bors, A. C. W. Borstlap, P. A. M. Bun, J. J. M. Deurenberg, H. A. J. Dijkstra, and F. H. Jansen. We are also grateful to P. van der Maas, MD, PhD, and R. Boer, PhD, for their valuable contribution to the set-up of the study. We also thank H. Rijken for her help with the realization of the study and J. C. M. Hendriks, PhD, for his statistical advice.
References
NETB (National Evaluation Team for Breast Cancer Screening). National evaluation of mass screening for breast cancer in the Netherlands. Evaluation report VII (in Dutch).
Boer R, de Koning H, van Oortmarssen G, Warmerdam P, van der Maas P. Stage distribution at first and repeat examinations in breast cancer screening.
Fracheboud J, deKoning HJ, Beemsterboer PMM, Boer R, Hendriks JHCL, Verbeek ALM et al. Nation-wide breast cancer screening in the Netherlands: Results of initial and subsequent screening 1990–1995.
Use of breast cancer screening. In: Vainio H, Bianchini F, editors. Breast Cancer Screening. Lyon (France): IARCPress;
Lynge E, Olsen AH, Fracheboud J, Patnick J. Reporting of performance indicators of mammography screening in Europe.
Elmore JG, Nakano CY, Koepsell TD, Desnick LM, D'Orsi CJ, Ransohoff DF. International variation in screening mammography interpretations in community-based programs.
Smith-Bindman R, Chu PW, Miglioretti DL, Sickles EA, Blanks R, Ballard-Barbash R, et al. Comparison of screening mammography in the United States and the United Kingdom.
NETB (National Evaluation Team for Breast Cancer Screening). National evaluation of mass screening for breast cancer in the Netherlands. Evaluation report X (in Dutch).
Otto SJ, Fracheboud J, Looman CWN, Broeders MJM, Boer R, Hendriks JHCL, et al. Initiation of population-based mammography screening in Dutch municipalities and effect on breast-cancer mortality: a systematic review.
Swensson RG. Unified measurement of observer performance in detecting and localizing target objects on images.
Yankaskas BC, Cleveland RJ, Schell MJ, Kozar R. Association of recall rates with sensitivity and positive predictive values of screening mammography.
Gur D, Sumkin JH, Hardesty LA, Clearfield RJ, Cohen CS, Ganott MA, et al. Recall and detection rates in screening mammography. A review of clinical experience—implications for practice guidelines.
Karssemeijer N, Otten JD, Verbeek AL, Groenewoud JH, de Koning HJ, Hendriks JH, et al. Computer-aided detection versus independent double reading of masses on mammograms.
Screening techniques. In: Vainio H, Bianchini F, editors. Breast Cancer Screening. Lyon (France): IARCPress;

