


Abstract
An important class of genetic variants that affect disease susceptibility may lie within regulatory elements that influence gene expression. Regulatory sequences are difficult to identify and may be distant from the genes they regulate, but many lie within evolutionarily conserved regions (ECRs). We used comparative genomics to identify 12 ECRs up to 75 kb 5′ to and within introns of IGF1. These were screened by high-resolution melting curve analysis, and 18 single-nucleotide polymorphisms (SNPs) were identified, including five novel variants. We analysed two large population-based series of healthy women to test the nine SNPs with minor allele frequency (MAF) >1% within ECRs. Three of the nine SNPs within ECRs (rs35455143, rs35765817 and rs3839984) were significantly associated with circulating IGF1 levels in a multivariate analysis (P ≤ 0.02 for each SNP, overall significance P < 0.001). All three are uncommon SNPs (MAF ≤ 10%) that lie >70 kb 5′ of IGF1. Two (rs35455143 and rs35765817) are in strong LD with each other and appear to have opposite effects on circulating IGF1. Our results on a subset of other SNPs in or near IGF1 were consistent with previously reported associations with IGF1 levels, although only one (rs35767: P = 0.05) was statistically significant. We believe that this is the first systematic study of an association between a phenotype and SNPs within ECRs extending over a large region adjacent to a gene. Targeting ECRs appears to be a useful strategy for identifying a subset of potentially functional non-coding regulatory SNPs.
INTRODUCTION
Detecting variants that confer differences in levels of gene expression remains a key challenge in human genetics (1). Regulatory elements are often ill defined and may occur at great distances from the genes that they regulate (2,3). The relative risk for disease incidence due to a single variant in such a sequence is likely to be small, and analysis of quantitative intermediate phenotypes may be more powerful than association studies of affected subjects and population controls for identifying disease-causing variants. Insulin-like growth factor one (IGF1) is a good model for testing strategies to identify regulatory variants. IGF1 is a peptide growth factor encoded by a single-copy gene on chromosome 12. Two functional promoters for IGF1 have been characterized (4–6) but little is known about potential distal regulatory elements. Circulating levels of IGF1 can be measured in blood plasma or serum and have been associated with breast and other site-specific cancers (7,8). Since regulatory elements often lie within evolutionarily conserved non-coding regions (ECRs) (9,10), we identified ECRs in a 234 kb region containing IGF1 and screened these sequences for single-nucleotide polymorphisms (SNPs).
Circulating IGF1 has previously been studied in relation to several genetic variants (7,11–15). Seventeen studies have analysed its association with a dinucleotide repeat sequence that lies 1 kb 5′ to the IGF1 transcriptional initiation site, but published results are inconsistent (7). At the time of selecting SNPs for genotyping, three studies (15–17) had published data on circulating IGF1 levels in women and SNPs within the IGF1 locus. SNPs analysed in relation to circulating levels include one (rs5742612) in LD with the dinucleotide repeat (15), nine that tag common variation in IGF1 (15–17) and five SNPs within exons, intron–exon boundaries or conserved elements within introns (17). Wong et al. (15) reported no association with circulating IGF1 for rs5742612 in 628 men and women from the Singapore Chinese Health study. A significant association (P < 0.05) with serum IGF1 levels was reported for three of the five SNPs genotyped by Canzian et al. (17) in 2395 European women from the EPIC study (rs35765, rs35767 and rs6220) and for five of the nine SNPs genotyped by Al-Zahrani et al. (16) in 420 British women (rs5742678, rs5742694, rs1520220, rs6220 and rs2946834).
We genotyped five SNPs for which an association with circulating IGF1 levels had been previously reported in two population-based series of healthy women and nine SNPs in ECRs in or 5′ to IGF1 with a minor allele frequency (MAF) >1%.
RESULTS
Conserved regions
Figure 1 shows sequence comparisons generated when 234 kb around the human IGF1 gene and five other vertebrate sequences available from National Centre for Biotechnology Information (NCBI) were submitted to mVISTA (18). There were eight conserved regions between 84 kb 5′ to IGF1 and the end of the fourth intron (regions 1, 3, 4, 5, 6, 7, 8 and 9) that shared >70% identity with three or more species and four (regions 2, 10, 11 and 12) sharing >75% identity with two or more species. The twelve conserved regions ranged in length from 97 bp to 1.2 kb. The most highly conserved was region 9, a 1.2 kb sequence immediately 5′ to the transcriptional start site of IGF1 that contains a 101 bp sequence with >85% identity between human and zebrafish. Using the unbiased SNP set described by the International SNP Map Working Group and Drake et al. (19,20), average SNP densities were 4.71 × 10⁻⁴ (95% CI 0.97 × 10⁻⁴ to 13.75 × 10⁻⁴) within these conserved sequences and 4.48 × 10⁻⁴ (95% CI 3.44 × 10⁻⁴ to 5.73 × 10⁻⁴) in non-conserved sequences, similar to those reported (19,20). Full details of the twelve conserved regions, including their chromosome positions and per cent identity across the five species compared, are provided in Supplementary Material, Table S1.
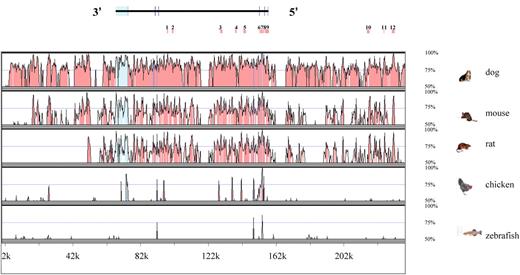
Sequence comparison of 234 kb of human DNA sequence centred on the IGF1 gene. Plots comparing identity between human and other vertebrate species were generated using mVISTA. Exonic regions are marked in blue, UTRs (untranslated regions) in turquoise and ECRs in pink. ECRs that were screened for polymorphisms are numbered 3′ to 5′ and are marked by vertical pink boxes above the plot.
SNP selection
We screened all twelve conserved regions in 95 randomly selected healthy women from the MOG study by high-resolution melting curve analysis (MCA) and identified 18 polymorphisms in six regions. The other six regions contained no detectable variants. MAFs ranged from 0.5 (1/190 chromosomes) to 21% (40/190 chromosomes). Five SNPs, all with low MAFs, are novel; they have been assigned ‘ss’ numbers prior to inclusion in the latest build of dbSNP (Build 129) (1/190 chromosomes: ss80694548, ss80694542, ss80694545; 2/190 chromosomes: ss80694551 and ss80694553). The remaining thirteen SNPs were already listed (rs35455143, rs35765817, rs34591039, rs35760, rs3839984, rs764702, rs1077817, rs11829707, rs11829693, rs5742612, rs2195239, rs2195240 and rs4764884). Figure 2 shows all the SNPs in ECRs with MAF > 1% (three or more in 190 screened chromosomes). The seven SNPs with MAF ≤ 1% in the ascertainment series of 95 women (one or two in 190 chromosomes analysed) were excluded. The remaining 11 SNPs in ECRs included two pairs (rs2195239 and rs2195240, rs10778177 and rs4764702) that are in perfect LD, so rs2195240 and rs4764702 were also excluded. The remaining nine SNPs were genotyped.
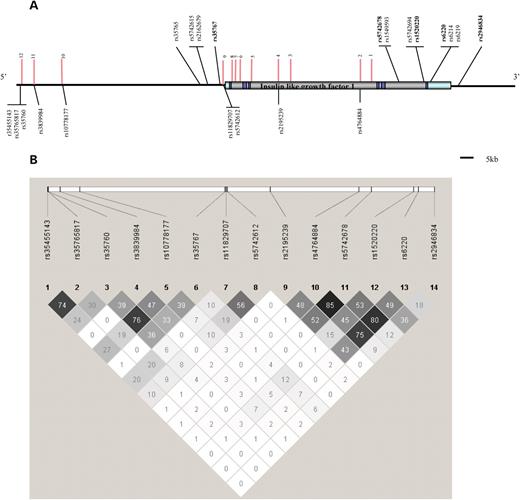
IGF1 SNPs that have been analysed in relation to circulating levels of IGF1. (A) The rs numbers of the SNPs within ECRs (vertical pink lines) that were analysed in relation to circulating IGF1 levels in the MOG and Guernsey studies are shown below the structure of the IGF1 gene. The rs numbers of SNPs analysed in other publications are shown above the structure of the IGF1 gene. Of those, ones in bold have been analysed in the MOG and Guernsey studies. (B) The LD structure of the SNPs genotyped in the MOG and Guernsey studies (r2 values are displayed and were calculated using Haploview using the MOG data). Additional SNPs present in ECRs but not displayed: Region 12: ss80694542, 80694545 (MAFs 0.005) and rs34591039 (MAF 0.05); Region 10: ss80694548 (MAF 0.005), Region 9: ss80694548, ss80694551, rs11829693 (MAFs 0.01) and Region 4: rs2195240 (MAF 0.22).
Circulating IGF1 levels were measured in samples from two studies of healthy women (MOG study: 508 women; Guernsey study: 509 women—see Materials and Methods). In addition to SNPs identified in ECRs, Figure 2 also shows all SNPs for which an association with circulating IGF1 in women had been previously reported, including seven for which the association was statistically significant. We genotyped five of these seven in both studies, excluding rs35765 and rs5742694, which are in strong LD with rs35767 and rs5742678, respectively.
SNP associations with circulating IGF1 levels
Supplementary Material, Table S2 summarises data for these five SNPs for which an association with circulating IGF1 had been previously reported (16,17). One SNP (rs35767) showed borderline evidence of higher levels of IGF1 in carriers [dominant model: mean difference 5.52 (95% CI 0.07–10.97), P = 0.05; co-dominant model: per allele difference 4.34 (−0.29 to 8.97, P = 0.07], consistent with the reported association (17). Results for the other four SNPs are also statistically consistent with previous findings, although none shows a significant association in our data.
All nine SNPs with MAF > 1% that we identified in ECRs were genotyped in the MOG study (508 women). Three common SNPs (MAF > 10%) that showed no evidence of an association with circulating IGF1 (P > 0.4) were not analysed further (data shown in Supplementary Material, Table S3). Table 1 shows results by genotype for the remaining six SNPs in ECRs that were genotyped in both studies. Mean circulating IGF1 levels and differences between carriers and non-carriers were adjusted for age, menopausal status and IGF1 measurement batch in separate analyses for each SNP (right-hand column in Table 1: difference D1, P-value P1) and in a multivariate regression analysis including all six SNPs (difference D2, P-value P2). Two SNPs showed borderline evidence of an association when analysed individually (rs35455143: mean difference –9.8 ng/ml, P1 = 0.02; rs3839984: mean difference 5.8 ng/ml, P1 = 0.07). In the multivariate analysis including all six SNPs in ECRs, the magnitude and statistical significance of these associations were increased (rs35455143: D2 = −25.1, P2 = 0.003; rs3839984: D2 = 8.5, P2 = 0.01). A further SNP was also significantly associated with IGF1 level in the multivariate analysis (rs35765817: D2 = 16.4, P2 = 0.02), although removal of the two most extreme points reduced its estimated effect (D2 = 12.1, P2 = 0.09).
Mean plasma IGF1 level (ng/ml) by IGF1 genotype for variants in ECRs analysed in the MOG and Guernsey study samples
| Region, SNP, MAF | Genotype | MOG n | Mean (95% CI) | P1 | Guernsey n | Mean (95% CI) | P1 | Pooled Diff1(95% CI), Diff2(95% CI) | P1, P2a |
|---|---|---|---|---|---|---|---|---|---|
| 12 | CC | 452 | 149.0 (145.3 to 152.8) | 0.13 | 444 | 149.5 (142.7 to 154.4) | 0.09 | −9.8 (−18.3 to −1.3) | 0.02 |
| rs35455143 | CT |  | 140.1 (129.2 to 151.0) |  | 137.6 (125.0 to 150.2) | −25.1 (−41.4 to −8.8) | 0.003 | ||
| 0.05 | TT | ||||||||
| 12 | CC | 435 | 149.1 (145.2 to 152.9) | 0.39 | 423 | 147.8 (142.0 to 153.7) | 0.77 | −3.1 (−10.7 to 4.4) | 0.41 |
| rs35765817 | CT |  | 144.4 (134.4 to 154.3) |  | 146.3 (135.5 to 157.2) | 16.4 (2.4 to 30.3) | 0.02 | ||
| 0.06 | TT | ||||||||
| 11 | −/− | 394 | 147.5 (143.5 to 151.6) | 0.42 | 412 | 146.7 (141.0 to 152.5) | 0.08 | 5.8 (−0.5 to 12.1) | 0.07 |
| rs3839984 | −/insA |  | 151.1 (143.3 to 158.9) |  | 155.1 (145.6 to 164.5) | 8.5 (1.7 to 15.3) | 0.01 | ||
| 0.10 | insA/insA | ||||||||
| 9 | GG | 456 | 149.2 (145.4 to 152.9) | 0.50 | 447 | 147.1 (141.4 to 152.7) | 0.88 | −2.5 (−14.8 to 9.8) | 0.69 |
| rs11829707 | GC |  | 143.3 (126.7 to 159.9) |  | 148.5 (130.5 to 166.4) | −2.9 (−23.0 to 17.1) | 0.78 | ||
| 0.02 | CC | ||||||||
| 9 | CC | 458 | 148.4 (144.7 to 152.1) | 0.87 | 472 | 147.3 (141.8 to 152.8) | 0.55 | 2.6 (−7.1 to 12.2) | 0.60 |
| rs5742612 | CT |  | 149.5 (136.6 to 162.5) |  | 151.6 (137.5 to 165.6) | 8.4 (−7.2 to 24.0) | 0.23 | ||
| 0.03 | TT | ||||||||
| 4 | CC | 309 | 146.3 (141.7 to 150.8) | 0.14 | 290 | 147.8 (141.4 to 154.2) | 0.99 | −0.4 (−6.1 to 6.0) | 0.99 |
| rs2195239 | CG | 170 | 150.3 (144.3 to 156.3) | 186 | 146.4 (139.6 to 153.2) | 2.0 (−2.7 to 6.7) | 0.40 | ||
| 0.22 | GG | 22 | 157.0 (140.3 to 173.6) | 18 | 152.7 (133.9 to 171.4) |
| Region, SNP, MAF | Genotype | MOG n | Mean (95% CI) | P1 | Guernsey n | Mean (95% CI) | P1 | Pooled Diff1(95% CI), Diff2(95% CI) | P1, P2a |
|---|---|---|---|---|---|---|---|---|---|
| 12 | CC | 452 | 149.0 (145.3 to 152.8) | 0.13 | 444 | 149.5 (142.7 to 154.4) | 0.09 | −9.8 (−18.3 to −1.3) | 0.02 |
| rs35455143 | CT | | 140.1 (129.2 to 151.0) | | 137.6 (125.0 to 150.2) | −25.1 (−41.4 to −8.8) | 0.003 | ||
| 0.05 | TT | ||||||||
| 12 | CC | 435 | 149.1 (145.2 to 152.9) | 0.39 | 423 | 147.8 (142.0 to 153.7) | 0.77 | −3.1 (−10.7 to 4.4) | 0.41 |
| rs35765817 | CT | | 144.4 (134.4 to 154.3) | | 146.3 (135.5 to 157.2) | 16.4 (2.4 to 30.3) | 0.02 | ||
| 0.06 | TT | ||||||||
| 11 | −/− | 394 | 147.5 (143.5 to 151.6) | 0.42 | 412 | 146.7 (141.0 to 152.5) | 0.08 | 5.8 (−0.5 to 12.1) | 0.07 |
| rs3839984 | −/insA | | 151.1 (143.3 to 158.9) | | 155.1 (145.6 to 164.5) | 8.5 (1.7 to 15.3) | 0.01 | ||
| 0.10 | insA/insA | ||||||||
| 9 | GG | 456 | 149.2 (145.4 to 152.9) | 0.50 | 447 | 147.1 (141.4 to 152.7) | 0.88 | −2.5 (−14.8 to 9.8) | 0.69 |
| rs11829707 | GC | | 143.3 (126.7 to 159.9) | | 148.5 (130.5 to 166.4) | −2.9 (−23.0 to 17.1) | 0.78 | ||
| 0.02 | CC | ||||||||
| 9 | CC | 458 | 148.4 (144.7 to 152.1) | 0.87 | 472 | 147.3 (141.8 to 152.8) | 0.55 | 2.6 (−7.1 to 12.2) | 0.60 |
| rs5742612 | CT | | 149.5 (136.6 to 162.5) | | 151.6 (137.5 to 165.6) | 8.4 (−7.2 to 24.0) | 0.23 | ||
| 0.03 | TT | ||||||||
| 4 | CC | 309 | 146.3 (141.7 to 150.8) | 0.14 | 290 | 147.8 (141.4 to 154.2) | 0.99 | −0.4 (−6.1 to 6.0) | 0.99 |
| rs2195239 | CG | 170 | 150.3 (144.3 to 156.3) | 186 | 146.4 (139.6 to 153.2) | 2.0 (−2.7 to 6.7) | 0.40 | ||
| 0.22 | GG | 22 | 157.0 (140.3 to 173.6) | 18 | 152.7 (133.9 to 171.4) |
MAF ≤ 10% coded dominant. MAF > 10% coded co-dominant. Diff1, difference between mean IGF1 levels in carriers and non-carriers (MAF ≤ 10%) or per allele (MAF > 10%) adjusted for age group, menopausal status and measurement batch, with pre-menopausal women aged 40–49 taken as the baseline group; Diff2, difference between mean IGFI levels in carriers and non-carriers (MAF ≤ 10%) or per allele (MAF > 10%), adjusted for age group, menopausal status and measurement batch and all five other SNPs, with pre-menopausal women aged 40–49 taken as the baseline group. P1, likelihood ratio test for model 1 (as above); P2, likelihood ratio test for model 2 (as above).
aCoding all SNPs as co-dominant did not alter the results significantly. P = 0.004, 0.03, 0.03, 0.77, 0.29 and 0.41 for rs35455143, rs35765817, rs3839984, rs11829707, rs5742612, rs2195239, respectively.
Mean plasma IGF1 level (ng/ml) by IGF1 genotype for variants in ECRs analysed in the MOG and Guernsey study samples
| Region, SNP, MAF | Genotype | MOG n | Mean (95% CI) | P1 | Guernsey n | Mean (95% CI) | P1 | Pooled Diff1(95% CI), Diff2(95% CI) | P1, P2a |
|---|---|---|---|---|---|---|---|---|---|
| 12 | CC | 452 | 149.0 (145.3 to 152.8) | 0.13 | 444 | 149.5 (142.7 to 154.4) | 0.09 | −9.8 (−18.3 to −1.3) | 0.02 |
| rs35455143 | CT | | 140.1 (129.2 to 151.0) | | 137.6 (125.0 to 150.2) | −25.1 (−41.4 to −8.8) | 0.003 | ||
| 0.05 | TT | ||||||||
| 12 | CC | 435 | 149.1 (145.2 to 152.9) | 0.39 | 423 | 147.8 (142.0 to 153.7) | 0.77 | −3.1 (−10.7 to 4.4) | 0.41 |
| rs35765817 | CT | | 144.4 (134.4 to 154.3) | | 146.3 (135.5 to 157.2) | 16.4 (2.4 to 30.3) | 0.02 | ||
| 0.06 | TT | ||||||||
| 11 | −/− | 394 | 147.5 (143.5 to 151.6) | 0.42 | 412 | 146.7 (141.0 to 152.5) | 0.08 | 5.8 (−0.5 to 12.1) | 0.07 |
| rs3839984 | −/insA | | 151.1 (143.3 to 158.9) | | 155.1 (145.6 to 164.5) | 8.5 (1.7 to 15.3) | 0.01 | ||
| 0.10 | insA/insA | ||||||||
| 9 | GG | 456 | 149.2 (145.4 to 152.9) | 0.50 | 447 | 147.1 (141.4 to 152.7) | 0.88 | −2.5 (−14.8 to 9.8) | 0.69 |
| rs11829707 | GC | | 143.3 (126.7 to 159.9) | | 148.5 (130.5 to 166.4) | −2.9 (−23.0 to 17.1) | 0.78 | ||
| 0.02 | CC | ||||||||
| 9 | CC | 458 | 148.4 (144.7 to 152.1) | 0.87 | 472 | 147.3 (141.8 to 152.8) | 0.55 | 2.6 (−7.1 to 12.2) | 0.60 |
| rs5742612 | CT | | 149.5 (136.6 to 162.5) | | 151.6 (137.5 to 165.6) | 8.4 (−7.2 to 24.0) | 0.23 | ||
| 0.03 | TT | ||||||||
| 4 | CC | 309 | 146.3 (141.7 to 150.8) | 0.14 | 290 | 147.8 (141.4 to 154.2) | 0.99 | −0.4 (−6.1 to 6.0) | 0.99 |
| rs2195239 | CG | 170 | 150.3 (144.3 to 156.3) | 186 | 146.4 (139.6 to 153.2) | 2.0 (−2.7 to 6.7) | 0.40 | ||
| 0.22 | GG | 22 | 157.0 (140.3 to 173.6) | 18 | 152.7 (133.9 to 171.4) |
MAF ≤ 10% coded dominant. MAF > 10% coded co-dominant. Diff1, difference between mean IGF1 levels in carriers and non-carriers (MAF ≤ 10%) or per allele (MAF > 10%) adjusted for age group, menopausal status and measurement batch, with pre-menopausal women aged 40–49 taken as the baseline group; Diff2, difference between mean IGFI levels in carriers and non-carriers (MAF ≤ 10%) or per allele (MAF > 10%), adjusted for age group, menopausal status and measurement batch and all five other SNPs, with pre-menopausal women aged 40–49 taken as the baseline group. P1, likelihood ratio test for model 1 (as above); P2, likelihood ratio test for model 2 (as above).
aCoding all SNPs as co-dominant did not alter the results significantly. P = 0.004, 0.03, 0.03, 0.77, 0.29 and 0.41 for rs35455143, rs35765817, rs3839984, rs11829707, rs5742612, rs2195239, respectively.
DISCUSSION
The contribution of inherited factors to circulating IGF1 levels is likely to be substantial. Estimates from twin studies of the proportion of variance in circulating IGF1 levels that is genetically determined vary between 38 and >80% (21–23). The genetic basis for this is not known, but IGF1 was one of 23 genes that showed reproducible allelic imbalance in a recent survey of human cis-acting variation (24). Previously reported associations with circulating IGF1 levels in women involved SNPs between 7 kb 5′ and 2 kb 3′ of IGF1 (15–17). We believe that this is the first systematic study of SNPs within ECRs extending over a large region adjacent to a gene. Our overall results provide quite strong evidence of an association with IGF1 levels for such SNPs. We tested nine SNPs within ECRs (six shown in Table 1, and the three common SNPs listed in Supplementary Material, Table S3, that showed no association in the MOG study), and three SNPs gave significance levels of P ≤ 0.02 in the multivariate analysis. The probability of three or more out of nine P-values being 0.02 or less is P < 0.001. Furthermore, one of the SNPs for which a significant association had previously been reported (rs35767) lies within a region that is conserved at >70% identity between human and three other species, narrowly failing to meet our ECR criterion. We also found some evidence (Supplementary Material, Table S2: PD = 0.05, Ptrend = 0.07) to support the significant association between this SNP and IGF1 levels reported by Canzian et al. (17).
Analysis of multiple SNPs within the region surrounding a gene may be complicated by the potential for individual SNPs to affect levels of expression positively or negatively and by the LD structure of the region. Five of the nine SNPs studied by Al Zahrani et al. (16) showed a significant association with IGF1 when analysed independently, but all five lie in a single LD block, and only one remained significant in a multivariate analysis. In contrast, the six SNPs within ECRs that we analysed lay within four LD blocks, and we observed a high overall significance level (P < 0.001) in our multivariate analysis of all six SNPs (Table 1) and larger effects for several SNPs than in separate analyses of individual SNPs. The main reason for this appears to be negative confounding between two strongly linked SNPs (rs35455143 and rs35765817: r2 = 0.74) with opposite effects on IGF1 levels (Table 1).
In silico sequence-based algorithms predict the likely functionality of non-synonymous coding SNPs (25–27), but such criteria have not been developed for putative regulatory sequences. We have attempted to identify potentially functional variants by selecting SNPs in ECRs, but the relevance of individual SNPs can be evaluated only by in vitro and in vivo assays. For example, there is consistent evidence of a modest association between rs6220 and circulating IGF1 levels (28) but it seems unlikely to have a causal role, as RT-PCR data from Pastinen et al. (24) showed that the allelic imbalance associated with this particular SNP was bi-directional.
The evidence from our data and from previous reports suggests that variants that affect circulating levels of IGF1 probably do exist but the proportion of variance explained by individual variants will be small. The estimated effects of the six SNPs in Table1 accounted for only 1.3% of overall variation in the multiple regression, although they may explain a greater proportion of the variation in the production of IGF1, as the steady-state levels that we measured will be influenced by clearance as well as production of IGF1.
The variants that we tested within region 12 (rs35455143 and rs35765817) lie close to, but not within, consensus-binding sites for STAT5, a transcription factor that mediates regulation of IGF1 gene expression via growth hormone (29,30). Our findings for rs35455143, rs35765817 and rs3839984 need to be replicated in additional studies but, if confirmed, they suggest that we have identified one (region 12), or possibly two (region 11), distal elements that regulate IGF1 expression and variants within these elements that are associated with circulating IGF1 levels. Both these regions lie >70 kb from IGF1, and comparison of a larger portion of sequence data that has subsequently become available through the ECR browser (31) suggests that cross-species conservation around IGF1 extends beyond the 234 kb region that we screened.
The three SNPs in ECRs that appear to affect IGF1 levels are all uncommon (MAF ≤ 10%), and we have recently reported a significant cumulative effect on breast cancer risk of potentially functional coding SNPs with MAF < 10% in candidate genes (32). LD mapping of risk alleles in genome-wide association studies has identified common susceptibility alleles for several complex diseases (33–36), but our data suggest that less common variants in candidate genes and within large adjacent regions may also make a substantial contribution to genetic susceptibility.
MATERIALS AND METHODS
Comparative genomics
Two hundred and thirty-four kilobase of human sequence (chr12: 101247584–101482486 NCBI Build 36.1) including IGF1 was aligned and compared with other vertebrate sequences using the mVISTA server http://genome.lbl.gov/vista/index.shtml (18). A region of 200–250 kb of sequence was chosen, as this was judged to be likely to include most of the proximal and distal regulatory elements for IGF1 and likely to contain several ECRs. Homologous sequences were available for the following species: chicken, rat, mouse and dog (234 kb of each), and zebrafish (78 kb). Data for pig, goat, sheep and cow were excluded, as <4 kb of sequence data were available for each of these. AVID was selected to perform pair-wise alignments; conservation parameters were set at 70% identity across a 100 bp window. Regions that showed >70% identity between human and four other species or >75% identity between human and three other species were screened for polymorphic variants. These criteria are similar to those used by other studies (37) although more recent studies have used slightly different thresholds (9,19).
Study subjects
The Mammography Oestrogens and Growth factors (MOG) study is an epidemiological study nested within the AGE trial [a trial of mammographic screening in younger women; (38)]. In total, 53 000 women aged 40–41 were randomized to the intervention arm of the AGE trial and were invited to have annual mammograms until the age of 48; 15 000 of these women were contacted via screening centres and invited to participate in the MOG study by completing a brief questionnaire including information on demographics, reproductive and lifestyle factors and by providing a blood sample. All women were aged 44–51 years (mean age 47.6) at the time of completing the questionnaire and providing a blood sample. From this study, 1154 white Caucasian women who, had never had cancer, were still having regular menstrual periods and were not using hormone replacement therapy (HRT) or oral contraceptives (OC) (9) were invited to participate in an additional component of the study investigating the relationship between pre-menopausal hormones and mammographic density. A total of 651 (56.4%) were willing to participate, and plasma for IGF1 measurements and genomic DNA were available for 508 (78%) of these. From these 508 women, a random sample of 95 women was selected for the identification of genetic variants using high-resolution MCA (see what follows). All 508 were then genotyped for variants with MAF > 1% (>2/190 chromosomes).
Full details of the Guernsey prospective studies have been published previously (39,40). Serum for IGF1 measurements and genomic DNA were available for 509 women. All women were white Caucasians who were resident on the island of Guernsey at the time of completing their questionnaire and providing a blood sample, their age range was 35–88 years (mean age 53.4). Two hundred and thirty-four (47.2%) were pre-menopausal and 262 (52.8%) post-menopausal; peri-menopausal women and those taking HRT or OC at GIV were excluded.
DNA extraction and measurement of circulating IGF1 levels
Genomic DNA was extracted from 200 μl of clotted blood [Guernsey study samples, details published previously (39)], and 200 μl of buffy coat from MOG study samples (QIAamp DNA Blood mini kit, Qiagen, Crawley West Sussex, UK, following manufacturers instructions). Plasma (MOG) and serum (Guernsey) IGF1 levels were measured using an ELISA assay (Diagnostic Systems Laboratories, Webster, TX, USA), as described previously (38,39). All MOG samples were measured in a single batch. Coefficients of variation in IGF1 (intra-assay and inter-assay combined) were 6.6% (38). Levels of IGF1 are known to be slightly higher in serum samples compared with plasma samples but there is good correlation between such samples taken from the same individual (41). A variable was included in the regression analysis to adjust for differences in IGF1 measurement due to the use of plasma samples in the MOG study and serum samples in the Guernsey study.
Screening variants in conserved regions
Genomic DNA samples from 95 women randomly selected from the MOG study were screened for variants in the 14 conserved regions using high-resolution MCA followed by bi-directional sequencing. Primers were designed using Primer3, http://primer3.sourceforge.net/ (42) (see Supplementary Material, Table S2). Large regions were divided into several smaller amplimers of <400 bp to maximize the sensitivity of scanning for variants. The predicted melting profile of the PCR products was determined using DHPLC Melt (http://insertion.stanford.edu/melt.html), and in some cases primers were re-designed so that each amplimer contained only one melting domain. PCR [10 μl reaction components: 1× LCGreen Plus+ (Idaho Technology), 2 pmol primers, 1× PCR buffer + 20 mm MgCl2 (Idaho Technology), 0.25 U Thermostart DNA polymerase (ABgene), 10 ng genomic DNA; overlaid with 15 μl of mineral oil (Sigma)] was performed in 96-well plates (BioRad) in a DNA Engine PCR machine (BioRad). MCA was carried out using an HR96 LightScanner (Idaho Technology). Data collection was performed using LightScanner software (Idaho Technology). Melting profiles were reviewed by two independent scorers. All samples with melting profiles that differed from wild-type samples were bi-directionally sequenced using an Applied Biosystems 3100 Genetic Analyser. Samples containing SNPs and 1–2 bp deletions were identifiable. The presence of a polymorphic CA repeat (16–27 CA repeats) ∼1 kb from the IGF1 transcription start site in one amplimer resulted in a complex variety of possible genotypes which confounded analysis by MCA.
Genotyping
Pre-designed or pre-validated Applied Biosystems Taqman SNP genotyping assays were available for rs35760, rs10778177, rs35767, rs5742612, rs2195239, rs4764884, rs1520220, rs6220 and rs2946834. Custom Taqman SNP genotyping assays (Applied Biosytems) were designed for rs35455143, rs35765817 and rs5742678 (see Supplementary Material, Table S3). Taqman genotyping was carried out according to the manufacturer’s instructions. Plate reads were performed using Sequence Detection Software (Applied Biosystems) on an ABI Prism 7900. Suitable Taqman assays could not be designed to genotype rs11829707 and rs3839984. PCR products were amplified (391 and 153 bp, respectively, Supplementary Material, Table S3) and then digested with 10 U of the restriction endonuclease (New England Biolabs) (Supplementary Material, Table S3). Digests were visualized on a 4% metasieve agarose (Flowgen) gel and genotypes called by two independent investigators. Positive and negative controls were included on every plate. A random 10% of samples were re-genotyped; concordance of genotype calls was 100%. Call rates for all SNPs were >95%.
Statistical methods
Analysis of each SNP within each study showed no significant deviations from Hardy–Weinberg equilibrium. We used linear regression to test for associations between genotype and plasma IGF1 levels. Cook’s distances were calculated to test for influential points. Plots of Cook’s distance versus fitted values indicated two outliers; analyses were repeated after excluding these measurements from the data. To generate pooled estimates of the genotype-specific IGF1 levels in the MOG and Guernsey studies, we used linear regression including ‘study’ as a covariate. All statistical analyses were carried out using Stata 9 (Stata Corporation, TX, USA).
SUPPLEMENTARY MATERIAL
Supplementary material is available at HMG Online.
FUNDING
This work was funded by Cancer Research UK and Breakthrough Breast Cancer.
Conflict of Interest statement. None declared.
