


Abstract
Frameworks concerning school health and well-being, like the Health Promoting School and the Coordinated School Health Programme, have been available for some time. However, the indicators of well-being studies and the comprehensive frameworks have not met. The main aim of the present study was to test the use of the theoretically based School Well-being Profile to clarify the aspects of well-being in schools and to test if the Profile could be used to identify differences in well-being between classes in school. The data were collected in connection with the Koulumiete Project in Finland; 1346 pupils and 69 classes from grades seven to nine were included in the present data. In the school conditions category, the physical conditions that most needed improvement were ventilation, toilet facilities and temperature. Time pressure was also reported widely. Concerning social relationships, teachers' interest in how pupils are doing and teachers' fair treatment were the aspects calling for attention. In the means for self-fulfilment category pupils' participation in school development was a key area for reform. The most prevalent psychosomatic symptoms in the health status category were headache and feeling tired or weak. The School Well-being Profile seemed to work well when evaluating well-being differences between classes. By utilizing the results locally, the school personnel can act to develop their own school. The Profile could be used as a tool when planning and evaluating well-being and mental health promotion interventions in schools.
INTRODUCTION
Past years have seen health-related school studies generally concentrating either on the WHO ‘Health Promoting School’ (HPS) (Parsons et al., 1996; WHO, 1998; St Leger, 1999) framework or on the ‘Coordinated School Health Program’ (CSHP) in the USA (Allensworth and Kolbe, 1987; Marx and Wooley, 1998). These concepts were developed in the late 1980s and early 1990s although the Coordinated School Health Programme (earlier Comprehensive SHP) could be traced back to the 1920s, the publishing time of a book ‘School Health Services’ followed by ‘Healthful School Environment’ (1953) and ‘Health Education’ (1957) (Davis and Allensworth, 1994). Allensworth and Kolbe expanded the concept (Allensworth and Kolbe, 1987); they proposed that a school health programme include eight components: health education, physical education, health services, nutrition services, counselling and psychological and social services, healthy school environment, health promotion for staff and parent/community involvement.
The WHO revised Global School Health Initiative (WHO, 1998) proposed four strategies for creating Health Promoting Schools: strengthening the ability to advocate for improved school health programmes, creating Networks and Alliances for the development of Health Promoting Schools, strengthening national capacities and research to improve school health programmes. The HPS idea can be traced back to 1950 when WHO established an Expert Committee on School Health Services. In 1966, WHO released a publication ‘Planning for Health Education in Schools’, which addressed pragmatically the planning and implementation of school health programmes (St Leger, 1999). In 1992, the European Region of WHO initiated a project, The European Network of Health Promoting School (ENHPS) and in 1997, 37 countries in Europe were participating in the network. The ENHPS conference resolution in Greece in May 1997 outlined 10 principles for the health promoting school: democracy, equity, empowerment and action competence, school environment, curriculum, teacher training, measuring success, collaboration, communities and sustainability (Burgher et al., 1999). In 1995, also The Western Pacific Region of WHO adopted the health promoting school framework, which consisted of six components: school health policies, the physical environment of the school, the school's social environment, community relationships, personal health skills and health services (St Leger, 1999).
School health and well-being have been looked from a broad perspective for years through large health promoting school frameworks, and linkages between educational and health promotion outcomes have been presented. Indicator development of the area has begun, but still more research needs to be undertaken of the concept and its implementation, as well as development of a comprehensive set of indicators (Nutbeam, 1998; Lister-Sharp et al., 1999; St Leger, 2000; St Leger and Nutbeam, 2000a; St Leger and Nutbeam, 2000b).
Rather surprisingly, the empirical studies of pupils' well-being in school have rarely used measures derived from the comprehensive school health promotion frameworks. Well-being has been measured using: one single question (Samdal, 1998); three questions (Savolainen et al., 1998); a well-being questionnaire (well-being at school, social integration in the class, relationships with teachers, interest in learning tasks, motivation towards learning tasks, attitude to homework, attentiveness in the classroom and academic self-concept) (Opdenakker and van Damme, 2000).
In Samdal's study, student support, adequate expectations and teacher support were the most important predictors of subjective well-being (Samdal, 1998). Savolainen and colleagues found that pupils' well-being was related to school climate, co-operation, encouragement, support with problems, school organization and physical working environment (Savolainen et al., 1998). The Opdenakker and van Damme study indicated some school characteristics (e.g. instruction and knowledge acquisition) to be effective for both achievement and well-being while other characteristics affected more prominently either achievement or well-being (Opdenakker and van Damme, 2000).
The results of various single measures of pupils' well-being give important information about the phenomena connected with it, but the entity of specific school well-being remains somewhat unclear. It is important to be able to evaluate schools as entities also to justify the health promotion work done in schools. In this paper we will propose the use of the School Well-being Profile as a tool for school development. The Profile is based on the conceptual School Well-being Model (Konu and Rimpelä, 2002). In the model, well-being is associated with teaching and education on the one hand, and with learning and achievements, on the other. Well-being is divided into four categories: school conditions (having), social relationships (loving), means for self-fulfilment (being) and health status. ‘Means for self-fulfilment’ encompasses possibilities for each pupil to study according to his/her own resources and capabilities. ‘Health status’ is seen through pupil's symptoms, diseases and illnesses. The School Well-being Model was theoretically developed after a review of appropriate sociological, educational, psychological and health promotion literature. The theoretical model has been discussed in more detail in a separate article (Konu and Rimpelä, 2002).
The questionnaire for the School Well-being Profile was developed on the basis of the researcher's theoretical work with the Health Promotion Survey in Finland (Konu and Rimpelä, 2002; Konu et al., 2002a; Konu et al., 2002b; Konu et al., 2002c) and of the two international school surveys: Health Behavior in School-aged Children (Currie et al., 2000) and School Environment 2000 Questionnaire (Savolainen, 2001).
The Well-being Profile was used in association with the Koulumiete Project, which was part of a larger project called the Pirkanmaa Mental Health (PMH) (www.pmh.info). The Koulumiete Project worked with seven schools (two elementary and five secondary schools) in the region. The Project's main aims were to support pupils' mental health, prevent marginalization and support the whole school so that it could promote positive development. There were two main strategies for achieving these aims:
making a well-being profile for each school and thus finding out the most important development areas from the well-being and mental health viewpoints;
keeping a special eye on school absences and developing a model for early recognition and prompt help for pupils with high absence rates.
The present paper tries to clarify the most important aspects of school well-being at the pupil level according to the Well-being Model. At the class level, the aim was also to test if the School Well-being Profile could be used to identify differences in well-being between classes within schools and grades.
METHODS
Data collection
The data for the Well-being Profiles were collected in connection with the Koulumiete Project during the school term 2002–2003. The schools had voluntarily participated in the project. The present data consisted of pupils' responses from three secondary schools where the Well-being Profile was produced for the whole school. The participants completed the questionnaires for the Well-being Profile during one school lesson in each school. To ensure confidentiality, the teacher in each school class sealed the forms in an envelope and brought it to the researcher, who was present at the school. The absence rate during the survey varied between 5 to 7%. A total of 69 classes and 1346 pupils were included; 51% were boys, 35% seventh, 37% eighth and 28% ninth graders. School 1 had seven classes of seventh and eighth grades and six classes of ninth grade. School 2 had eight classes in each grade and School 3 had eight classes of seventh grade, 10 classes of eighth grade and seven classes of ninth grade.
Measurement and analysis
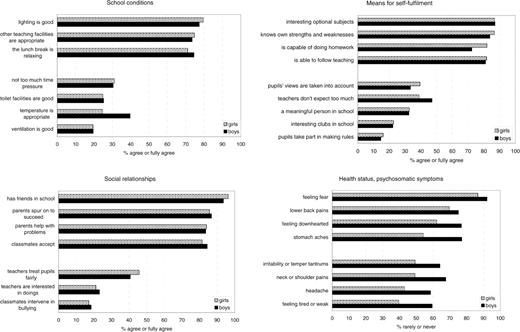
In the School Well-being Profile, the school conditions category consisted of 26 items, the social relationship 19 items, the means for self-fulfilment 24 items and health status 11 items. The proportion of missing responses within items varied between 0 and 1.6%. The percentage of agreement (fully agree or agree) was calculated for each variable. Bullying was indicated by the percentage of those being bullied/taking part in bullying at least once a week. In the health status category, the indicators presented the percentage experiencing symptoms rarely or never. The percentages at pupil level were presented separately by gender and grade with the χ2 test used to test for significant differences. The three items with highest percentages and the three items with lowest percentages by gender/grade from each category were chosen for presentation in Figures 1 and 2.
Statements with most and least agreement among boys and girls within categories according to the School Well-being Model.
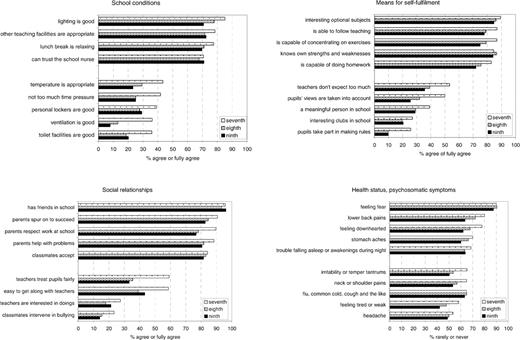
Statements with most and least agreement among pupils by grade level within categories according to the School Well-being Model.
Means for the four well-being categories were also calculated. On the class level, the significant differences of the categories were tested (t-test) in each school and each grade level. The internal consistency of each well-being category was calculated using Cronbach's Alpha. The correlations between categories were analysed using Pearson correlation. SPSS 11.0 for Windows was used for analysis.
RESULTS
The pupil level results have been presented in groups according to the School Well-being Model. In the school conditions category, lighting, other teaching facilities and school lunch as a relaxing break had the highest percentages of agreement among pupils (Figure 1). Over 70% of both girls and boys agreed that those conditions were good. At the other end, only 20–30% of pupils agreed that there was not too much time pressure, toilet facilities or ventilation were good or temperature was appropriate. Within these questions the only significant difference between genders was that 40% of boys (versus 25% of girls) agreed with the statement of appropriate temperature. Of the 26 items in school conditions category, gender differences were found in nine items (Table 1).
The questions with significant differences between genders
| Category | Higher rating | |||||||
|---|---|---|---|---|---|---|---|---|
| Question | χ2 | p | Gender | Proportion, % | ||||
| School conditions; agree or fully agree | ||||||||
| Recess facilities are appropriate | 7.66 | 0.006 | Girls | 62.5 | ||||
| Schoolyard is safe | 6.80 | 0.009 | Girls | 62.4 | ||||
| Classrooms are roomy enough | 4.72 | 0.030 | Girls | 62.2 | ||||
| School building is safe | 4.59 | 0.032 | Girls | 62.2 | ||||
| Easy to get to see a school nurse | 5.01 | 0.025 | Boys | 60.4 | ||||
| Rules and regulations are sensible | 20.53 | <0.001 | Girls | 51.1 | ||||
| Easy to get to see a school social worker | 9.60 | 0.002 | Boys | 49.5 | ||||
| Desks are appropriate | 11.52 | 0.001 | Girls | 48.6 | ||||
| Temperature is appropriate | 34.44 | <0.001 | Boys | 39.7 | ||||
| Social relationships; agree or fully agree | ||||||||
| Has friends in school | 4.52 | 0.033 | Girls | 96.2 | ||||
| Parents are willing to come to school | 7.03 | 0.008 | Girls | 71.6 | ||||
| Teamwork goes on well | 5.01 | 0.025 | Boys | 70.5 | ||||
| Classmates help in schoolwork | 5.50 | 0.019 | Girls | 68.6 | ||||
| Most teachers are friendly | 11.57 | 0.001 | Girls | 64.1 | ||||
| Has been bullied at least once a week | 5.51 | 0.019 | Boys | 7.7 | ||||
| Has bullied at least once a week | 13.60 | <0.001 | Boys | 4.9 | ||||
| Means for self-fulfilment; agree of fully agree | ||||||||
| Is capable of doing homework | 17.37 | <0.001 | Girls | 82.0 | ||||
| Gets help from teachers | 3.85 | 0.050 | Girls | 79.9 | ||||
| Acts responsibly | 34.86 | <0.001 | Girls | 73.7 | ||||
| Teachers do not expect too much | 9.33 | 0.002 | Boys | 47.1 | ||||
| Pupils' views are taken into account | 5.30 | 0.021 | Girls | 39.5 | ||||
| Health; rarely or never | ||||||||
| Feeling fear | 10.04 | 0.002 | Boys | 92.1 | ||||
| Stomach aches | 77.48 | <0.001 | Boys | 77.1 | ||||
| Feeling downhearted | 34.31 | <0.001 | Boys | 76.9 | ||||
| Lower back pains | 4.74 | 0.030 | Boys | 75.1 | ||||
| Trouble falling asleep or awakenings during night | 25.62 | <0.001 | Boys | 71.7 | ||||
| Flu, common cold, cough and the like | 8.38 | 0.004 | Boys | 68.1 | ||||
| Neck or shoulder pains | 46.94 | <0.001 | Boys | 67.6 | ||||
| Tension or nervousness | 12.46 | <0.001 | Boys | 65.5 | ||||
| Irritability or temper tantrums | 29.65 | <0.001 | Boys | 64.1 | ||||
| Feeling tired or weak | 52.63 | <0.001 | Boys | 59.5 | ||||
| Headache | 31.92 | <0.001 | Boys | 58.5 | ||||
In the social relationships category, over 80% of pupils agreed that they had friends, their parents spur them on to succeed, their parents helped them with problems and their classmates accepted them (Figure 1). Only 46% of girls and 41% of boys agreed that teachers treated them fairly. About 20% of pupils thought that teachers were interested in how they were doing and that their classmates intervened bullying. 4.6% of the girls and 7.7% of the boys were bullied at least once a week and 1.4% of the girls and 4.9% of the boys took part in bullying. There were seven questions from total of 19 with significant differences between genders in the social relationships category (Table 1). Generally, girls' reports on social relationships were more positive than boys'.
In the means for self-fulfilment category, over 80% of pupils agreed that there were interesting optional subjects, they knew their own strengths and weaknesses, they were capable of doing their homework (gender difference, p < 0.001) and they were able to follow teaching (Figure 1). The questions with least agreement in this category were: pupils' views are taken into account (gender difference, p = 0.021), teachers do not expect too much (gender difference, p = 0.002), people consider me a meaningful person in school, interesting school clubs and pupils take part in making rules (Table 1). The other questions with significant gender differences were ‘I act responsibly’ and ‘I get help from teachers’.
In the health status category, responses on all questions differed significantly between genders (Table 1); a greater number of girls had psychosomatic symptoms. The least prevalent were fear, lower back pains, downheartedness and stomach ache (Figure 1). Most often the pupils reported irritability or temper tantrums, neck or shoulder pains, headache and feeling tired or weak.
In Figure 2 and Table 2, the results have been presented by grade level. Pupils in the seventh grade experienced the school well-being to be better than pupils in other grades; this applies to all four well-being categories. The questions with no significant differences between seventh and eighth grade were listed in the note in Table 2; all other questions had significant differences between seventh and eighth grade. There were significant differences in 12 of the 80 questions between grades eight and nine; the questions with differences can be seen in Table 2.
The questions with significant differences between grades eight and nine
| Category | Higher rating | |||||||
|---|---|---|---|---|---|---|---|---|
| Question | χ2 | p | Grade | Proportion, % | ||||
| School conditions; agree or fully agree | ||||||||
| Lighting is good | 5.99 | 0.014 | Eight | 77.9 | ||||
| Classrooms are roomy enough | 4.16 | 0.041 | Eight | 58.7 | ||||
| Schedule is good | 6.23 | 0.013 | Ninth | 55.0 | ||||
| Punishments are fair | 3.92 | 0.048 | Eight | 42.7 | ||||
| Temperature is appropriate | 4.28 | 0.039 | Eight | 29.3 | ||||
| Ventilation is good | 6.07 | 0.014 | Eight | 13.1 | ||||
| Social relationships; agree or fully agree | ||||||||
| Teamwork goes on well | 7.68 | 0.006 | Ninth | 72.2 | ||||
| Pupils enjoy being together | 3.94 | 0.047 | Ninth | 65.1 | ||||
| Means for self-fulfilment; agree of fully agree | ||||||||
| Has found a way to study suited to self | 6.11 | 0.013 | Eight | 63.8 | ||||
| Pupil's work is valued in school | 4.57 | 0.033 | Eight | 50.3 | ||||
| Pupils' views are taken into account | 4.52 | 0.034 | Eight | 32.1 | ||||
| Health status; symptoms rarely or never | ||||||||
| Lower back pains | 7.42 | 0.006 | Eight | 72.3 | ||||
Note: On seventh grade, most percentages of those who agreed were higher (χ2, p < 0.05) than on eighth grade. No significant difference was observed in the following questions: ‘easy to get to see a school nurse’, ‘can trust the school nurse’, ‘can trust the school social worker’, ‘teamwork goes on well’, ‘classmates help in schoolwork’, ‘easy to get along with classmates’, ‘has friends in school’, ‘classmates accept’, ‘has been bullied’, ‘respects schoolwork’, ‘knows own strengths and weaknesses’, ‘is praised for work well done’, ‘there are interesting optional subjects’, ‘stomach aches’, ‘tension or nervousness’, ‘trouble falling asleep or awakenings during night’, ‘headache’, ‘feeling fear’, ‘flu, common cold, cough and the like’.
The internal consistencies of the four well-being categories were good. The Cronbach's Alpha was 0.91 for school conditions, 0.86 for social relationships, 0.91 for means for self-fulfilment and 0.87 for health status. The correlations between the categories varied between 0.33 and 0.70 (Table 3).
The correlations between well-being categories
| School conditions | Social relationships | Means for self-fulfilment | Health status | |
|---|---|---|---|---|
| School conditions | 1 | |||
| Social relationships | 0.63* | 1 | ||
| Means for self-fulfilment | 0.67* | 0.70* | 1 | |
| Health status | 0.35* | 0.33* | 0.37* | 1 |
| School conditions | Social relationships | Means for self-fulfilment | Health status | |
|---|---|---|---|---|
| School conditions | 1 | |||
| Social relationships | 0.63* | 1 | ||
| Means for self-fulfilment | 0.67* | 0.70* | 1 | |
| Health status | 0.35* | 0.33* | 0.37* | 1 |
Correlation is significant at the 0.01 level.
At the class level, the four well-being category means were compared between classes (marked from A to F, G, H, I or J in each grade in the Table 4) in each school and each grade level. In Schools 1 and 3 the most significant differences between classes occurred in the social relationships category whereas in School 2 they occurred in the school conditions category (Table 4). In School 2 there were no significant differences in the health status category. The maximum and minimum percentages of agreement (agree or fully agree or rarely or never symptoms in the health category) of the four well-being categories in each school and each grade are also presented in the Table 4. The lowest (the highest) of all in the school conditions category was 29.7% (82.1%), in the social relationships 42.5% (74.0%), in the means for self-fulfilment 40.4% (79.0%) and in the health category 47.7% (81.8%).
The significant differences between classes within schools and grade levels
| School conditions | Social relationships | Means for self-fulfilment | Health | |||||
|---|---|---|---|---|---|---|---|---|
| School 1 | ||||||||
| Seventh grade | B – A,C,E,F | C – G | C – B,D | C – D | ||||
| C – D | ||||||||
| Max; min % | 82.1 62.5 | 74.0 58.9 | 79.0 64.9 | 81.8 59.2 | ||||
| Eighth grade | B – E | B – D,E | D – F,G | B – D | ||||
| F – C,E | F – D,E | |||||||
| G – C,D,E | G – A,C,D,E | |||||||
| Max; min % | 69.5 41.1 | 72.2 46.9 | 66.9 45.2 | 73.3 50.6 | ||||
| Ninth grade | E – B,C,F | B – D | E – B,C | |||||
| F – A,D | ||||||||
| Max; min % | 63.3 51.5 | 67.7 55.2 | 70.8 51.1 | 73.1 54.0 | ||||
| School 2 | ||||||||
| Seventh grade | D – A,B,E,H | B – C,D,F | ||||||
| F – A,B,E,H | D – H | |||||||
| E – C,D,F | ||||||||
| Max; min % | 70.2 51.7 | 70.3 61.5 | 76.1 60.3 | 69.2 59.2 | ||||
| Eighth grade | C – A,D,E | A – C,D,F | A – F | |||||
| F – A,D,E | C – B,E,H | |||||||
| Max; min % | 52.2 31.0 | 65.6 47.8 | 67.0 53.4 | 70.7 56.2 | ||||
| Ninth grade | A – B,C,F,G | B – A,E,H | E – B,G,H | |||||
| E –B,C,F,G | E – F,G | |||||||
| G –H | ||||||||
| Max; min % | 53.6 29.7 | 64.0 46.7 | 60.5 40.4 | 63.7 47.7 | ||||
| School 3 | ||||||||
| Seventh grade | F – A,E,G | A – B,D,F | A – B,C,D,F | F – G | ||||
| D – G,F | ||||||||
| Max; min % | 52.2 35.4 | 67.9 48.2 | 67.8 47.9 | 78.5 56.1 | ||||
| Eighth grade | C – B,E,H | D – A,B,E,H | I – J | G – I,J | ||||
| G – H | F – A,E,H | H – I,J | ||||||
| H – B,C,G,J | ||||||||
| I – A,B,E,H | ||||||||
| Max; min % | 49.0 33.7 | 62.9 42.5 | 59.0 44.3 | 73.6 50.0 | ||||
| Ninth grade | B – E,F,G | |||||||
| C – E | ||||||||
| Max; min % | 47.5 35.3 | 59.3 50.1 | 56.7 49.0 | 64.5 51.1 | ||||
The maximum and minimum percentages of agreement are presented in the rows max; min %. Reading example: A-B, E, H means that there were significant differences between A and B, A and E, A and H.
DISCUSSION
Empirical studies concerning pupils' well-being in school have clarified some associated factors (Samdal, 1998; Savolainen et al., 1998; Opdenakker and van Damme, 2000). Frameworks concerning school health and well-being like Health Promoting School (Parsons et al., 1996; WHO, 1998; St Leger, 1999) and the Coordinated School Health Programme (Allensworth and Kolbe, 1987; Marx et al., 1998) have been available for some time. Still, the indicators used in well-being studies and the comprehensive frameworks had not found one another. The main aim of the present study was to test the use of the theoretically based School Well-being Profile in school well-being evaluation. The present study attempted to highlight the most important aspects of school well-being according to the School Well-being Model. Further, at the class level the aim was to test if the Profile could point out differences between classes in the four categories of the School Well-being Model. The results of the whole school evaluation have been utilized internally in the Koulumiete Project schools.
The data came from three normal, Finnish secondary schools (1346 pupils, 69 classes) that participated voluntarily in the Koulumiete Project. Although not representative of Finland in statistical sense, this data gave the chance to examine the most important aspects of school well-being. The number of participating classes was high enough to test the ability of the Profile to point out differences between classes. Between-school differences could not be tested due to the small number of schools in the present dataset. The methodical analysis showed that the categories based on the theoretical model had high internal consistencies.
From the school development and mental health promotion viewpoints, the main interest lay in the aspects that raised dissatisfaction among pupils. In the school conditions category, the physical conditions that most needed improvement were ventilation, toilet facilities and temperature. Time pressure is a more organizational aspect within conditions. Two-thirds of pupils thought that there is too much time pressure in school. It is possibly a stress factor that has a connection with pupils' psychosomatic symptoms and thus also negative effects on pupils' mental health and well-being (Natvig et al., 1999). In the present dataset, the correlation between time pressure and symptoms was significant (0.32).
In the social relationships category, an important aspect is fair treatment on behalf of the teachers. If more than half of the pupils thought that it was not fair, obviously something should be done. Only one-fifth of pupils thought that the teachers were interested in how they were doing. However, we cannot be sure that pupils want to be asked how they are doing. Anyway, it is likely that most pupils want to get attention from the teachers. Attachment theory proposes that secure emotional connections provide a base for psychological and social development (Koplow, 2002; Patton et al., 2003). Insecurity in relationships within the family, school and peer-group carries a risk of social, emotional, and behavioural problems. A noteworthy finding was that classmates did not intervene in bullying. Salmivalli and colleagues discussed bullying as a group phenomenon, where there are more players involved in bullying than just the one who bullies and the one who is being bullied (Salmivalli et al., 1996). Natvig found that increasing school alienation had connections with increased risk of bullying, whereas increasing support from teachers and peers decreased the risk (Natvig et al., 2001). Bullying should also be seen as a risk for mental disorders (Kaltiala-Heino et al., 2000).
In the means for self-fulfilment category, the low agreement rates with the statements ‘pupils' opinions are taken into account’, ‘pupils take part in making rules’ and ‘people consider me a meaningful person in school’ showed that there is still much to be done to attain real pupil participation in schools. Antonovsky has stressed the importance of meaningfulness in life in his sense of coherence-construct (Antonovsky, 1996). It is vital for each pupil to be regarded as a meaningful person in school. A greater number of girls than boys thought that teachers expected too much of them. On the other hand, more boys than girls reported that they were not capable of doing their homework. More attention needs to be paid to gender differences in learning. The means for self-fulfilment have shown their importance also to pupils' general subjective well-being (Konu et al., 2002a).
Psychosomatic symptoms represent the health status category. They have also been seen as an indicator of mental health status in adolescence (Aalberg and Siimes, 1999). A greater number of girls than boys had psychosomatic symptoms; this is in agreement with previous studies (Natvig et al., 1999; Härmä et al., 2002). Prevalence of depression has been found to be higher among adolescents with recurrent symptoms (Härmä et al., 2002). Also a connection between school distress and psychosomatic symptoms exists (Natvig et al., 1999). Symptoms have been found to play such an important role in adolescents' mental health, that they should prompt more action in school. One practical way to do this is to keep a more careful eye on pupils' absence rates. Prompt help and more co-operation between teachers and school nurses/school social workers is needed. The second aim of the Koulumiete Project was to create a model on how to help pupils with a lot of absence hours.
The comparisons between classes within schools and grade levels showed that most differences occurred in the school conditions and the social relationships categories. By utilizing these results, the school personnel can act to develop their own school. If the social relationships were the problem in class, more work is needed to get pupils to get along with each other and to get along better with personnel.
The School Well-being Profile seemed to be a useful tool for identifying well-being differences between classes. The Profile is theoretically based (Konu and Rimpelä, 2002) and the structure has been empirically confirmed (Konu et al., 2002a; Konu et al., 2002b; Konu et al., 2002c). Although the results for the whole schools have not been presented here, they have been utilized when developing the well-being in participating schools further. At this stage, the main interest was on the aspects of school life calling for change. Another way would be to search for good practices in schools with high well-being rates.
The Well-being Profile can also be used as a process evaluation tool to find out if mental health promotion work done in schools has been successful. The present study clarified the characteristics of well-being in school and tried to indicate differences between classes. Further studies are needed to test the use of the Well-being Profile as a process evaluation tool.
This study was financially supported by Medical Research Fund of Tampere University Hospital. The Koulumiete Project was funded by the Ministry of Social Affairs and Health.
REFERENCES
Aalberg, V. and Siimes, M. (
Antonovsky, A. (
Allensworth, D. D. and Kolbe, L. J. (
Burgher, M. S., Rasmussen, V. B. and Rivett, D. (
Currie, C., Hurrelman, K., Settertobulte, W., Smith, R. and Todd, J. (eds) (
Davis, T. M. and Allensworth, D. D. (
Härmä, A., Kaltiala-Heino, R., Rimpelä, M. and Rantanen, P. (
Kaltiala-Heino, R., Rimpelä, M., Rantanen, P. and Rimpelä, A. (
Konu, A. I. and Rimpelä, M. K. (
Konu, A. I., Rimpelä, M. K. and Lintonen, T. P. (
Konu, A. I., Lintonen, T. P. and Autio, V. J. (
Konu, A. I., Alanen, E., Lintonen, T. and Rimpelä, M. (
Koplow, L. (
Lister-Sharp, D., Chapman, S., Stewart-Brown, S. and Sowden, A. (
Marx, E. and Wooley, S. F. (eds) (
Natvig, G. K., Albrektsen, G., Anderssen, N. and Qvarnstrøm, U. (
Natvig, G. K., Albrektsen, G. and Qvarnstrøm, U. (
Nutbeam, D. (
Opdenakker, M.-C. and Van Damme, J. (
Parsons, C., Stears, D. and Thomas, C. (
Patton, G., Bond, L., Butler, H. and Glover, S. (
Pirkanmaa Mental Health. Available online at URL: <http://www.pmh.info> (last accessed 27 October
Salmivalli, C., Lagerspetz, K. M. J., Bjorkqvist, K., Osterman, K. and Kaukiainen, A. (
Samdal, O. (
Savolainen, A., Taskinen, H., Laippala, P. and Huhtala, H. (
St Leger, L. (
St Leger, L. (
St Leger, L. and Nutbeam, D. (
St Leger, L. and Nutbeam, D. (
World Health Organization (revised
Author notes
1Tampere University Hospital, Department of Psychiatry and 2University of Tampere Centre for Advanced Study and Tampere School of Public Health, Tampere, Finland