


Abstract
Sarcopenia, or the loss of muscle mass and strength, is known to increase the risk for falls and (hip) fractures in older people. The objective of this study was to assess the skeletal muscle fiber characteristics in elderly female hip fracture patients.
Percutaneous needle biopsies were collected from the vastus lateralis muscle in 15 healthy young women (20 ± 0.4 years), 15 healthy elderly women (79 ± 1.7 years), and 15 elderly women with a fall-related hip fracture (82 ± 1.5 years). Immunohistochemical analyses were performed to assess Type I and Type II muscle fiber size, and myonuclear and satellite cell content.
Type II muscle fiber size was significantly different between all groups (p < .05), with smaller Type II muscle fibers in the hip fracture patients (2,609 ± 185 µm2) compared with healthy elderly group (3,723 ± 322 µm2) and the largest Type II muscle fibers in the healthy young group (4,755 ± 335 µm2). Furthermore, Type I muscle fiber size was significantly lower in the hip fracture patients (4,684 ± 211 µm2) compared with the healthy elderly group (5,842 ± 316 µm2, p = .02). The number of myonuclei per Type II muscle fiber was significantly lower in the healthy elderly and hip fracture group compared with the healthy young group (p = .011 and p = .002, respectively). Muscle fiber satellite cell content did not differ between groups.
Elderly female hip fracture patients show extensive Type II muscle fiber atrophy when compared with healthy young or age-matched healthy elderly controls. Type II muscle fiber atrophy is an important hallmark of sarcopenia and may predispose to falls and (hip) fractures in the older population.
Aging is accompanied by a progressive decline in skeletal muscle mass and strength, also known as sarcopenia. The loss of muscle mass and strength puts elderly persons at a high risk for falls and fractures (1). It has been estimated that approximately 30% of community-dwelling elderly people aged 65 and older fall at least once a year, and half of them fall recurrently (2,3). The rate of falls increases to more than 40% in people aged 80 years and older (4–6). Furthermore, the risk of falling is generally higher for elderly people who have experienced an injurious fall or recurrent falls (4,7). Fall-related hospital admissions in elderly patients are generally due to hip (28%), wrist (20%), or upper arm (7%) fractures (8). Falls and fall-related injuries can lead to the loss of independence (8–11) and increase the risk of morbidity (12) and mortality (11,13,14). Due to their high frequency and the large impact on health and functional status, the annual estimated worldwide cost of hip fractures was U.S. $34.8 billion in 1990 and is expected to rise to U.S. $131 billion by 2050 (15).
The ability of skeletal muscle to generate an adequate amount of force is fundamental during normal daily activities such as climbing stairs, rising from a chair, or recovering posture to prevent a fall. Hence, skeletal muscle weakness in the lower extremities has been shown to be an independent risk factor for falls and fall-related injuries in the elderly people (16). The loss of skeletal muscle mass with aging can mainly be attributed to a reduced muscle fiber number and size (17) with specific Type II muscle fiber atrophy accounting for the majority of muscle loss (18). Type II muscle fibers are essential for rapid muscle force production during muscle contraction, thus essential in regaining posture to prevent a fall. In accordance, quadriceps muscle strength correlates positively with Type II muscle fiber size (19). As such, Type II muscle fiber atrophy represents an important contributing factor in the development of muscle weakness during aging. Therefore, we hypothesize that elderly people who are predisposed to falls and fractures suffer from extensive Type II muscle fiber atrophy.
Skeletal muscle fibers contain hundreds of myonuclei, and it is generally believed that each myonucleus controls the gene expression over a certain amount of cytoplasm. A close association has been observed between the number of myonuclei and muscle fiber size (19,20). It is generally acknowledged that the addition of new myonuclei to existing muscle fibers represents an essential step in the maintenance and repair processes of skeletal muscle tissue. Skeletal muscle stem cells, also known as satellite cells, are the sole source in the formation of new myonuclei. As such, satellite cells are required to provide the additional myonuclei to maintain skeletal muscle fiber size. In accordance, Type II muscle fiber atrophy with aging is associated with a substantial reduction in the number of satellite cells in Type II muscle fibers (21,22). Therefore, we also assessed whether severe Type II muscle fiber atrophy is associated with a lower myonuclear and/or satellite cell content.
In the present study, we obtained muscle biopsies from elderly women (65 years and older) admitted to the hospital with a hip fracture due to a fall and compared skeletal muscle fiber characteristics with muscle biopsy samples obtained from healthy young (18–25 years) and age-matched healthy elderly (65 years and older) controls. This is the first study to show that skeletal muscle tissue of elderly female hip fracture patients is characterized by extensive Type II muscle fiber atrophy.
Method
Participants
In this cross-sectional, observational study we recruited one group of healthy young women (18–25 years), one group of healthy elderly women (≥65 years), and one group of hospitalized elderly women (≥65 years) with a fractured neck of the femur or intertrochanteric fracture of the femur (together defined as hip fractures). Only female patients were selected because this is the main risk population for suffering hip fractures. All participants were Caucasian. Exclusion criteria included all comorbidities and use of medication interacting with muscle metabolism and mobility of the limbs, such as chronic obstructive pulmonary disease, peripheral arterial disease, neurological disorders, diabetes mellitus, and metastatic disease. For the hip fracture group specifically, patients with a time to surgery of more than 48 hours after hospital admission and patients with a hip fracture due to a high-energy trauma or a pathological fracture were excluded. The study was conducted at the Maastricht University Medical Centre+, Maastricht, the Netherlands. Hip fracture patients were recruited at the emergency department or general ward of the Surgery department, and all healthy female volunteers (young and old) were recruited through local advertisements. Participants were informed on the nature and possible risks of the experimental procedures before providing their written informed consent. All procedures were performed in compliance with the Declaration of Helsinki, and the study was approved by the Medical Ethics Committee of the Maastricht University Medical Centre+.
Muscle Biopsies
We obtained one muscle biopsy sample from the vastus lateralis muscle from each participant to compare muscle fiber size as primary outcome measure and myonuclear and satellite cell content as secondary outcome measures between study groups. Participants in the two healthy groups (young and old) arrived at the laboratory by car or public transport following an overnight fast. After local anesthesia, a percutaneous needle biopsy (50–100 mg) was taken from the vastus lateralis muscle ~15 cm above the patella (23). In the elderly women suffering from a hip fracture, the muscle biopsy was obtained from the vastus lateralis muscle in the operating room prior to the surgical procedure (either hemiarthroplasty or intramedullary nail stabilization) and after induction of anesthesia. The mean time between hospital admission and the biopsy procedure at the operating room was 29 ± 2 hours in this group. Any visible non-muscle tissue was removed from the muscle biopsy needle, after which muscle samples were embedded in tissue-tek, frozen in liquid nitrogen cooled isopentane (Sakura Finetek Europe BV, The Netherlands), and stored at −80°C until further analyses.
Immunohistochemistry
From all muscle biopsy samples, 5-µm-thick cross-sections were cut. Muscle cross-sections were stained to determine muscle fiber type distribution, that is, Type I and Type II muscle fibers, myonuclear and satellite cell content.
First antibodies used were directed against MHC-I, laminin, and CD56. CD56 has been extensively used to identify satellite cells (19,24). Appropriate secondary antibodies were applied. Nuclei were stained with 4-,6-diamidino-2-phenylindole. Fiber type staining resulted in laminin stained in red, nuclei in blue, and MHC-I green. In addition, satellite cell staining resulted in laminin stained in red, nuclei in blue, and CD56 in green (Supplementary Figure 1). For muscle fiber size, a mean total of 425 ± 48 (mean ± SE) muscle fibers were analyzed for each muscle biopsy sample collected from healthy young, healthy elderly, and hip fracture patients. Fiber typing was determined by matching Type I and Type II muscle fibers in the serial muscle fiber type slides (Supplementary Figure 1). The frequency distribution was calculated to acquire further insight into the distribution and variability of muscle fiber size. Intervals of 1,000 µm2 were defined, and the percentage of muscle fibers in each interval was determined for Type I and Type II muscle fibers separately. The number of satellite cells per muscle fiber was calculated for Type I and Type II muscle fibers separately. Moreover, the number of myonuclei and central myonuclei per muscle fiber, as well as the mean myonuclear domain (ie, Fiber cross sectional area (CSA) / Number of myonuclei per fiber) were assessed for Type I and Type II muscle fibers within each image. For complete details on the methodology of the immunohistochemistry analyses please see Supplementary Material.
Statistics
All values are expressed as means ± standard error. Power calculation was based on a difference in Type II muscle fiber size between healthy older adults and hip fracture patients. Relevant differences in Type II muscle fiber size were estimated using data from previous studies (17,25). The sample size was calculated with a power of 80% and a significance level of .017 (taking post hoc Bonferroni correction into account), yielding a minimum of 13 individuals for each group. For comparisons of descriptive outcome measures and fiber type–specific outcome measures (ie, fiber size, myonuclear content, and satellite cell content) between groups, a one-way analysis of variance was performed with Bonferroni post hoc tests to locate group differences. In addition, differences between Type I and Type II muscle fiber type–specific variables within groups were analyzed by paired sample t tests in the healthy young control, healthy elderly group, and hip fracture patient groups separately. Pearson correlation coefficients (r) were calculated between muscle fiber size and myonuclear content in both Type I and Type II muscle fibers separately. An alpha level of .05 was used to determine statistical significance. All analyses were performed using SPSS version 21 (Chicago, IL).
Results
Participants’ Characteristics
Fifteen healthy young women (age: 20.3 ± 0.4 years), 15 healthy elderly women (age: 78.8 ± 1.7 years), and 15 elderly women with a hip fracture (age: 82.3 ± 1.5 years) were included in the study between January 2010 and July 2014. Participants’ characteristics are displayed in Table 1. No significant differences were observed in body weight and body mass index between healthy young women, healthy elderly women, and elderly women suffering from a hip fracture. Both elderly groups had a significantly higher age than the healthy young women (p < .001), with no difference between the healthy and hip fractured elderly women (p = .2). Previous fall-related fractures were reported in 7 of the 15 hip fracture patients. In contrast, only two among the healthy elderly group and none among the healthy young had ever suffered from a fracture as the result of low-energy fall.
Participants’ Characteristics
| Healthy Young (n = 15) | Healthy Elderly (n = 15) | Hip Fracture Patients (n = 15) | |
|---|---|---|---|
| Age (y) | 20.3 ± 0.4 | 78.8 ± 1.7a | 82.3 ± 1.5a |
| Height (m) | 1.68 ± 0.01 | 1.61 ± 0.02 | 1.60 ± 0.02 |
| Weight (kg) | 64.3 ± 2.0 | 63.9 ± 2.3 | 59.9 ± 2.6 |
| BMI (kg/m2) | 22.7 ± 0.53 | 24.6 ± 0.8 | 23.2 ± 0.7 |
Notes: Data represent means ± SE. Age of the healthy elderly and hip fracture patients were comparable.
BMI = body mass index.
aAge was significantly different compared with healthy young participants (p < .05). No other differences were observed between groups.
Muscle Fiber Type Composition, Size, and Frequency Distribution
No significant differences were observed in muscle fiber type composition between the healthy young (61 ± 12% Type I fibers), healthy elderly people (62 ± 14% Type I fibers), and hip fracture patients (66 ± 12% Type I fibers; p > .5). Type II muscle fibers were significantly smaller when compared with Type I muscle fibers in all three groups (p < .01; Figure 1). Type I muscle fiber size was not different between the young and healthy elderly women, but was significantly smaller in the hip fracture group compared with the healthy elderly group (4,684 ± 211 vs 5,842 ± 316 µm2, respectively; p = .02). Type II muscle fiber size was significantly different between all groups (healthy young vs healthy elderly people p = .04; healthy young vs hip fracture patients p < .001; healthy elderly vs hip fracture patients p = .03), with the smallest Type II muscle fibers observed in the hip fracture group (2,609 ± 185 µm2; Figure 1).
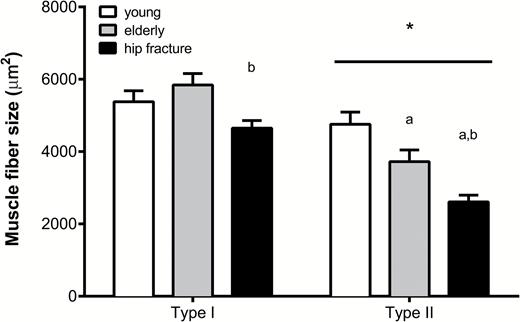
Muscle fiber size (in μm2) for both Type I and Type II muscle fibers in all groups. Data represent means ± SE. *Significantly different compared with Type I muscle fiber size (p < .05); aSignificantly different compared with healthy young (p < .05); bSignificantly different compared with healthy elderly group (p < .05). Bar indicates that the effect is present in all groups.
In line with the differences in muscle fiber size, substantial differences were observed in the frequency distribution of muscle fibers (Figure 2). The smallest Type I muscle fibers of less than 1,000 µm2 and from 1,000 to 2,000 µm2 were more prevalent in the hip fracture patients than in the healthy elderly and healthy young groups (p = .002 and p = .006, respectively; Figure 2A). A particular shift in muscle fiber size distribution was observed for Type II muscle fibers, with a higher percentage of small fibers in both elderly groups compared with the young women. In the healthy young people, less than 5% of the muscle fibers were smaller than 2,000 µm2, compared with ~25% in the healthy elderly and more than 45% in hip fracture patients (Figure 2B).
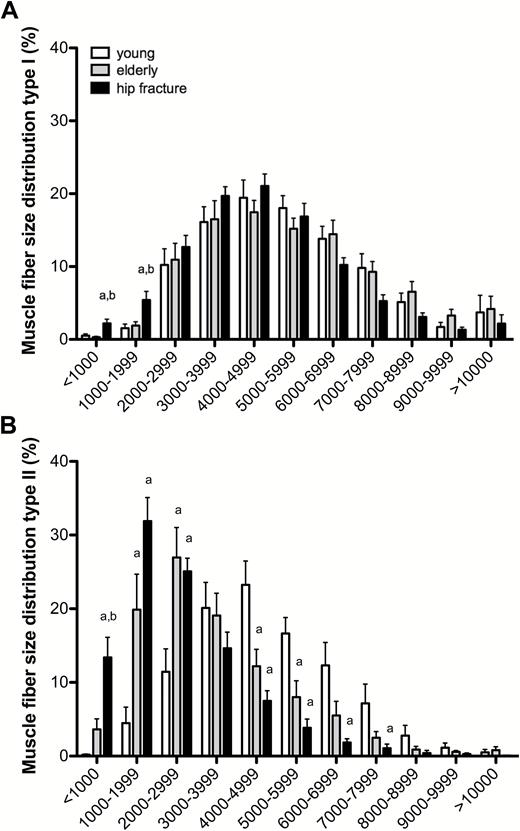
Muscle fiber size distribution (in percentage) for both (A) Type I and (B) Type II muscle fibers in all groups. Data represent means ± SE. aSignificantly different compared with healthy young participants (p < .05); bSignificantly different compared with healthy elderly participants (p < .05).
Myonuclear and Satellite Cell Content
The number of myonuclei per muscle fiber was significantly lower in Type II compared with Type I muscle fibers in all groups (p < .01; Table 2). No differences were observed in Type I muscle fiber myonuclear content between groups. In contrast, Type II muscle fiber myonuclear content was significantly lower in both the hip fracture patients and the healthy elderly group compared with healthy young controls (2.2 ± 0.1 and 2.3 ± 0.2 vs 3.0 ± 0.2 myonuclei per Type II muscle fiber, p = .002 and p = .01, respectively; Table 2). No significant difference in Type II muscle fiber myonuclear content was observed between the hip fracture patients and healthy elderly group. A significant correlation was observed between myonuclear content and muscle fiber size for both Type I and II muscle fibers in the healthy young (r = 0.65 and r = 0.67, respectively; p < .05) and healthy elderly participants (r = 0.58 and r = 0.71, respectively; p < .05; Supplementary Figure 2). In contrast, for the hip fracture patients, no significant correlation was observed between the number of myonuclei and muscle fiber size (r = 0.37; p = .18 and r = 0.08; p = .79, respectively; Supplementary Figure 2).
Myonuclear and Satellite Cell Content
| Fiber Type | Healthy Young (n = 15) | Healthy Elderly (n = 15) | Hip Fracture Patients (n = 15) | |
|---|---|---|---|---|
| Number of nuclei per fiber | I | 3.5 ± 0.2 | 3.0 ± 0.2 | 3.2 ± 0.2 |
| II | 3.0 ± 0.2* | 2.3 ± 0.2*a | 2.2 ± 0.1*a | |
| Fiber area per nucleus (µm2) | I | 1,562 ± 74 | 2,051 ± 104a | 1,581 ± 116b |
| II | 1,575 ± 88 | 1,679 ± 94* | 1,261 ± 130*b | |
| Number of central nuclei per fiber | I | 0.010 ± 0.003 | 0.022 ± 0.004 | 0.044 ± 0.014a |
| II | 0.027 ± 0.004* | 0.020 ± 0.003 | 0.038 ± 0.009 | |
| Central myonuclei % | I | 0.3 ± 0.1 | 0.8 ± 0.1 | 1.2 ± 0.3a |
| II | 0.9 ± 0.1* | 0.9 ± 0.2 | 1.8 ± 0.4 | |
| Number of satellite cells per fiber | I | 0.062 ± 0.006 | 0.078 ± 0.005 | 0.066 ± 0.009 |
| II | 0.039 ± 0.006* | 0.044 ± 0.006* | 0.030 ± 0.004* | |
| Number of satellite cells per mm2 | I | 11.8 ± 1.1 | 14.1 ± 1.3 | 14.2 ± 1.8 |
| II | 8.6 ± 1.5* | 12.3 ± 1.6 | 11.1 ± 1.3 |
Notes: Data represent means ± SE.
I = Type I muscle fibers; II = Type II muscle fibers; Fiber area per nucleus = myonuclear domain size in square millimeter; Central myonuclei % = number of myonuclei as a percentage of the total number of myonuclei (ie, Number of myonuclei + Number of central myonuclei).
aSignificantly different compared with healthy young participants (p < .05).
bSignificantly different compared with healthy elderly participants (p < .05).
Significantly different compared with Type I muscle fibers (p < .05).
A smaller Type I muscle fiber area per nucleus was observed in the healthy young and the hip fracture patients compared with the healthy elderly group (p = .003 and p = .005, respectively; Table 2). In Type II muscle fibers, the myonuclear domain was significantly different between the hip fracture patients and the healthy elderly group (p = .02). In addition, Type I myonuclear domain size was significantly smaller than Type II myonuclear domain size in the healthy elderly and hip fracture groups (Table 2). The percentage of central myonuclei per myonuclei was significantly greater in the hip fracture group compared with the healthy young controls in Type I muscle fibers (p = .01; Table 2). In Type II muscle fibers, the percentage of central myonuclei of the hip fracture patients tended to be greater compared with healthy elderly and healthy young groups (p = .076 and p = .076, respectively).
In all groups, the number of satellite cells per muscle fiber was significantly lower in Type II compared with Type I muscle fibers (p < .05; Table 2). No differences in the number of satellite cells per muscle fiber were observed between the groups for both Type I and Type II muscle fibers. Furthermore, the number of stem cells per squared millimeter of muscle fiber was not different between groups for both Type I and Type II fibers (Table 2).
Discussion
The present study shows that elderly women who experience a low-energy fall resulting in a hip fracture suffer from Type I and Type II muscle fiber atrophy, with an extensive decline in Type II muscle fiber size. Type II muscle fiber atrophy in these patients is accompanied by a reduction in Type II muscle fiber myonuclear content.
With global aging, falls and fall-related injuries among the elderly people have become a major public health burden (26,27). Falls are the leading cause of injuries in elderly adults and affect functional capacity, habitual physical activity, and cognition, eventually resulting in reduced quality of life and even death (8,28,29). Falls in later life can be attributed to a range of factors, including general health status, medication use, and environmental factors (2,3,28,30). However, the most important risk factor for falls in elderly individuals is low muscle strength, particularly of the lower extremities (1). A decline in muscle strength and physical performance impairs postural reflexes and increases the risk of falls and the likelihood of fractures. Because low skeletal muscle strength is generally associated with the loss of Type II muscle fiber size (19), we hypothesized that elderly women who are hospitalized for hip surgery following a fall suffer from extensive Type II muscle fiber atrophy. Indeed, we report that Type II muscle fibers were ~30% smaller in women with a hip fracture when compared with healthy age-matched controls (Figure 1) and observed a substantial shift in the frequency distribution of especially Type II muscle fibers with aging, with the highest percentage of very small Type II muscle fibers in the female hip fracture group (Figure 2B). Furthermore, we observed that the hip fracture patients even show the first signs of Type I muscle fiber atrophy (Figure 2A). We have previously shown that in a healthy elderly population, the age-related reduction in muscle mass is mainly attributed to specific atrophy of Type II muscle fibers (18). Based on the current findings, we speculate that in addition to the extensive Type II muscle fiber atrophy, a reduction in Type I muscle fiber size further attributes to the accelerated muscle loss as observed in clinically compromised and/or frail elderly individuals such as those suffering from a hip fracture. It remains to be determined which factors, such as disuse, sedentary lifestyle, and malnutrition (31), may play a primary role in the extensive atrophy as observed in the hip fracture patients. Importantly though, the observed smaller Type I and Type II muscle fiber size and greater percentage of (very) small fibers in muscle samples from the hip fracture patients could be associated with the reduced ability of these women to generate the force required to counteract unexpected perturbations in postural balance, explaining falls and hip fractures.
It has been suggested that changes in skeletal muscle fiber size are achieved by the regulation of three important factors: (i) the number of nuclei in a single muscle fiber; (ii) the rate of muscle protein synthesis per myonucleus; and (iii) the rate of muscle protein breakdown (32). In line with this, the myonuclear domain theory suggests that every myonucleus determines transcriptional processes in a certain amount of cytoplasm (33). Accordingly, changes in muscle fiber size (eg, hypertrophy or atrophy) are accompanied by changes in myonuclear content, myonuclear domain size, or both. However, a discrepancy exists in the reported changes in myonuclear content and/or domain size during aging in humans. Whereas some studies report that the age-related muscle fiber atrophy is accompanied by an increase in myonuclear content in human skeletal muscle (34), other human studies report no change (35,36). We recently reported that part of this discrepancy may be caused by the different age cohorts included in these studies, as a smaller myonuclear content was only observed in very old individuals (70–86 years) when compared with old (50–69 years) and young (18–49 years) individuals (25). Furthermore, a recent study by Karlsen and colleagues suggests that part of this discrepancy might also be due to determining a mean myonuclear content and domain size for each biopsy sample (37). By using a fiber size–dependent cluster analysis, they showed that smaller fibers have less myonuclei and a smaller myonuclear domain size, independent of the age of the individuals (37). In the present study, we report a significantly lower number of myonuclei in Type II muscle fibers in healthy elderly women and hip fracture patients compared with healthy young controls (Supplementary Figure 2). In addition, the healthy young and elderly women show a significant correlation between myonuclear content and muscle fiber size in Type I and Type II muscle fibers (Supplementary Figure 2), in agreement with the recent suggestions of Karlsen and colleagues (37). These observations suggest that during healthy aging, the loss of myonuclear content is proportional to the age-related decline in muscle fiber size. In contrast to the healthy young and healthy elderly women, no significant correlations were observed between Type I and Type II muscle fiber myonuclear content and muscle fiber size in the hip fracture patients (Supplementary Figure 2). The absence of any relation between myonuclear content and muscle fiber size in these patients might indicate that either the loss in myonuclear content or muscle fiber size is occurring at an accelerated pace when compared with healthy controls. In accordance with the latter suggestion, myonuclear domain size was lowest in Type II muscle fibers in the hip fracture patients, implying a disproportionate decline in fiber size versus myonuclear content (Table 2). It remains to be determined whether there is a causal relationship between fiber atrophy and the reduction in myonuclear content. Alternatively, there may be a preferential loss of large Type II muscle fibers, explaining the greater percentage of small muscle fibers in the elderly groups, resulting in both smaller muscle fiber size and lower myonuclear content (32).
In line with previous observations (38), we also observed a number of myonuclei located in a central position of the muscle fiber. The presence of central myonuclei may be indicative of repetitive muscle fiber damage and subsequent repair over an extensive period of time (39). Interestingly, in the hip fracture patients the percentage of centrally located myonuclei was significantly higher in Type I muscle fibers and tended to be higher in Type II muscle fibers when compared with the healthy young controls.
During the last decade, the role of skeletal muscle satellite cells in muscle fiber maintenance has gained much interest. Satellite cells are the sole source for providing new myonuclei to human skeletal muscle (40). These stem cells play an important role in muscle growth, repair, and regeneration, and, as such, have been implicated as a key regulator of muscle mass maintenance (19,41). It has been previously shown that Type II muscle fiber atrophy in healthy elderly men is associated with a lower number of Type II muscle fiber satellite cells (21,22). In contrast to this and to our hypothesis however, the present study shows that Type II muscle fiber satellite cell content is not reduced in healthy elderly women and elderly hip fracture patients when compared with the young controls (Table 2), despite a substantially smaller Type II muscle fiber size in both elderly groups. Previous reports on mixed muscle fiber satellite cell content in healthy young women show mixed results. Whereas Kadi and colleagues (34) reported an average of 0.17 satellite cells per muscle fiber, a more recent study found approximately 0.07 satellite cells per muscle fiber in healthy young women (42). When expressed the same way (ie, mixed muscle fiber satellite cell content), we observed 0.053 ± 0.005 satellite cells per muscle fiber in young women. As such, satellite cell content in our group of healthy young women appears to be particularly low. The fact that the decline in muscle fiber size was not accompanied by a reduction in satellite cell content appears to be (at least partly) explained by the low number of satellite cells observed in the young women in the present study.
In this study, we have focused on differences in Type I and Type II skeletal muscle fiber characteristics of female hip fracture patients and healthy young and age-matched controls, because the majority of hip fracture patients are known to be women (43). Though our findings provide a relevant first insight in differences of muscle quality at the muscle fiber level between women who suffer from a hip fracture and healthy women who do not, future work should establish whether similar differences are evident for men. Furthermore, apart from skeletal muscle fiber atrophy, sarcopenia is also defined by a loss in muscle mass and/or function. Unfortunately, we were not able to assess any measures of muscle mass and/or strength in our hip fracture patients. We have previously shown that smaller muscle fiber size is associated with smaller quadriceps muscle mass and strength (18). Nevertheless, whether muscle fiber atrophy in elderly hip fracture patients leads to reduced physical function, thereby increasing the risk of falls and fractures in these elderly people, still remains to be elucidated. Furthermore, it would be interesting to examine whether the extent of muscle atrophy, both on the muscle fiber and the whole-muscle level, could be predictive for postsurgery recovery in these hip fracture patients. Such information could prove relevant to better target intervention strategies aimed at preventing fall-related hip fractures, as well as speeding up recovery in case a hip fracture has taken place, thereby reducing the burden of illness resulting from hip fractures (9,11).
In conclusion, frail elders at risk for a fall-related hip fracture show Type I muscle fiber atrophy and extensive Type II muscle fiber atrophy and a decline in myonuclear content. The present findings indicate that extensive Type II muscle fiber atrophy may predispose to reduced muscle strength and functional capacity and to an increased risk of falls and fractures.
Supplementary Material
Supplementary data are available at The Journals of Gerontology, Series A: Biological Sciences and Medical Sciences online.
Funding
This work was not supported by specific funding; this study was financed through internal University budgets.
References
Author notes
These authors contributed equally to this work.
Decision Editor: Stephen Kritchevsky, PhD

