


Abstract
Totally subcutaneous implantable cardioverter defibrillator (S-ICD) delivers higher shock energy and can have longer time to therapy compared to transvenous implantable cardioverter defibrillator (T-ICD). Aim of the study was to compare time to therapy and to investigate cardiac, cerebral and systemic injuries of S-ICD and T-ICD shocks delivered after ventricular fibrillation (VF) induction.
Fourteen pigs were randomly implanted with a S-ICD (n = 7) or a T-ICD (n = 7). Five VF episodes were induced in each pig. For each VF episode, up to two shocks could be delivered by the T-ICD or the S-ICD to terminate the arrhythmia. Cardiac, systemic, and cerebral toxicity were monitored. Mean time to therapy was longer in the S-ICD group compared to the T-ICD group (19[18; 23] s vs. 9 [7; 10] s; P = 0.001, respectively). High-sensitivity troponin T levels were significantly higher in the T-ICD group from 1 to 24 h after the procedure (P ≤ 0.02). Creatine phosphokinase activity levels were significantly higher in the S-ICD group, at 3, 6, and 24 h after the procedure (P ≤ 0.05). Lactate levels were not significantly different between groups. S100 protein level was similar in both groups at 1 h after the procedure and then decreased in the T-ICD group compared to the S-ICD group (P = 0.04).
Time to therapy in S-ICD was twice as long as for T-ICD, but didn’t induce relevant brain injury. Conversely, S-ICD shocks were less cardiotoxic than T-ICD shocks.
What’s new?
In conditions which aimed to reproduce realistic settings of ventricular arrhythmia, T-ICD shocks were more cardiotoxic than S-ICD shocks.
S-ICD was more likely to defibrillate ventricular fibrillation after the first shock than T-ICD.
Time to therapy in S-ICD was twice as long as for T-ICD.
Introduction
The transvenous implantable cardioverter defibrillator (T-ICD) is established as an effective technology for prevention of sudden cardiac death due to ventricular arrhythmias, and the worldwide number of T-ICD implantation is increasing over time.1,2 Nevertheless, the Achilles heel of this device is the need for a transvenous lead, with complications such as infections or fracture. A totally subcutaneous implantable cardioverter defibrillator (S-ICD) was developed to prevent the endocardial lead related risks. However, little data are available yet about the shock toxicity and time to therapy.3 The amount of power delivered to defibrillate is much more important with S-ICD than with T-ICD, as the lead is subcutaneous.4 In standard settings, a S-ICD delivers an 80-joule shock in the thorax, whereas a T-ICD delivers up to 45 joules into the heart. The two systems deliver energy shocks in different locations and the increased energy of S-ICD might damage the heart and/or the surrounding tissues.5,6 In the same way, S-ICD time to therapy seems to be longer than T-ICD, due to longer detection, and this might have cerebral and systemic consequences.7–9
The aim of this study was to compare, in the most realistic setting of ventricular arrhythmia, time to therapy between S-ICD and T-ICD, and to investigate cardiac, cerebral and ischaemic injuries of S-ICD and T-ICD shocks delivered after ventricular fibrillation (VF) induction in a preclinical porcine model.
Methods
Study population
Fourteen domestic Large White swine (35 [32; 37] kg; 6 females) from MOPICT platform (Surgères, France) were used. The study was performed in accordance with the Guidelines for the Care and Use of Laboratory Animals and was approved by the French Ministry of Agriculture and the National Institute for Agronomic Research and ethic committee COMETHEA N° 84 with number: 201509100801625.
Animal preparation
Fasted pigs were premedicated with an intramuscular injection of tiletamine 100 mg/mL and zolazepam 100 mg/mL. Anaesthesia and analgesia were performed according to the protocol as follows: A catheter was placed in a peripheral ear vein to create an intravenous access. Anaesthesia induction was carried out by inhalation of sevoflurane 8% and intravascular injection of propofol (2–4 mg/kg), midazolam 5 mg, fentanyl 30µg, and rocuronium 50 mg. After tracheal intubation, 100 mg of ketamine, 40 mg of esomeprazol, 1 g of amoxicilline, and 125 mg of clavulanate were injected. General anaesthesia was maintained by inhalation of isoflurane 1.5% and continuous IV of propofol (100 mg/h) and fentanyl (50µg/h). The haemodynamic parameters were assessed during the procedure: heart rate by scope, and systolic and diastolic blood pressures with an arterial line pressure. Brain activity was monitored with electroencephalogram. After the surgical procedure, the pigs were followed up for 5 days and then euthanized.
Defibrillator implantation
Before the procedure, pigs were randomized between 2 groups: T-ICD group (n = 7) or S-ICD group (n = 7). Implantations were carried out with fluoroscopy. For T-ICD implantation, a single coil defibrillation lead (Volta CR65, Livanova) was inserted through the right external jugular vein. The distal tip of the lead was screwed in the right ventricular apex. Impedance of stimulation, detection, and stimulation threshold were tested. Then, the lead was connected to the generator (Paradym, Livanova), located at the right part of the neck. For S-ICD implantation, the lead (3010 Q-TRAK™, Cameron Health, Inc., San Clemente, CA, USA) was tunnelled subcutaneously on the right parasternal location. The generator (1010 SQ-RX™ Pulse Generator, Cameron Health, Inc., San Clemente, CA, USA) was located on the left side of the chest.
Procedure: ventricular fibrillation induction and defibrillator therapy
A quadripolar stimulation catheter (Supreme™ CRD St. Jude Medical) was placed into the right ventricle through a right venous femoral access. Ventricular fibrillation was induced by delivering 1000 Hz/100 mA alternating current stimulation burst during 3 s. Five VF inductions were carried out for each pig, with a 1 min break between the shock terminating VF and the next VF induction. For each VF induction, S-ICD, and T-ICD were programmed to deliver up to two shocks and then, if the VF was not terminated, a 360 joules external shock was delivered. For T-ICD group, the first shock was programmed at 24 joules and the following at 42 joules, which corresponds to 37 joules delivered energy. For S-ICD group, the first shock was delivered with a power of 80 joules, the polarity was inverted for the subsequent shock.
Cardiac, systemic, and cerebral toxicity
Cardiac injury was assessed comparing electrocardiogram (ECG), before the first VF induction, just after the procedure and before euthanasia. High-sensitivity troponin T level was measured from venous samples drawn before the first induction; 3, 6, 12, and 24 h after the procedure; 2, 3, 4, and 5 days after the procedure. After euthanasia large biopsies of the right ventricular apex, the ventricular septum, lateral free wall of the left ventricle, and the right atrial appendage were fixed with formalin. The whole samples were embedded in paraffin. Sections were stained with H&E. A cardiovascular pathologist assessed the sections looking for inflammation, necrosis, and haemorrhage.
Time to therapy for each shock was calculated on the device electrograms as the time between the start of VF until the shock. This duration included the time of sensing and charging. To assess systemic toxicity, systolic and diastolic blood pressure, and heart rate were monitored with an arterial line and ECG monitoring. Plasma creatinine, lactate, bicarbonates, transaminases levels as well as creatine phosphokinase activity were measured from venous blood samples at baseline; 3, 6, 12, 24 h and 2, 3, 4 and 5 days after the procedure, using an automatic analyzer (COBAS C701, Roche Diagnostic, Meylan, France). Brain injury was evaluated with total power and spectral edge frequency parameters of the per-procedure electroencephalogram, and the measurement of S100 protein blood level at baseline, 3 and 6 h after the procedure was performed using an automated electrochemiluminescence immunoassay (COBAS e601, Roche Diagnostic, Meylan, France).
Statistical analysis
Categorical variables were expressed as number and percentage and continuous variables as median, 1st and 3rd quartiles. Comparisons of groups were performed using chi-square for categorical variables and Mann–Whitney test for quantitative variables.
Correlation between the plasma high-sensitivity troponin T, creatine phosphokinase activity, S100 protein levels, and the total number of shocks, as well as total energy delivered and total time in VF was assessed by Spearman’s correlation test.
Analyses were performed using SPSS 22 (SPSS, Inc., Chicago, IL, USA). Two-sided P-values of less than 0.05 were considered statistically significant.
Results
Baseline characteristics
The 2 groups were not statistically different regarding weight (34 [30; 36] kg for T-ICD group and 35 [32; 37] kg for S-ICD group; P = 0.32). Two pigs out of 7 were female in the T-ICD group and 4 out of 7 in the S-ICD group.
Ventricular fibrillation inductions
There was a trend for more electrical shocks required to terminate the sequence of 5 induced VF in T-ICD group, but it didn’t reach statistical significance (8 [5; 11] shocks in the T-ICD group and 6 [5; 6] shocks in the S-ICD group; P = 0.2, respectively) (Table 1). The five induced VF episodes were all defibrillated after the first endocardial shock in two pigs in the T-ICD group, and in three pigs in the S-ICD group. Two pigs required external defibrillation in the T-ICD group, while none required it in the S-ICD group. Total energy delivered, which is the sum of energy delivered by the implanted ICD and the external ICD, tended to be higher in the S-ICD group (200 [120; 900] joules in T-ICD group and 480 [400; 480] joules in S-ICD group; P = 0.2). The mean time spent in VF during the procedure was longer in the S-ICD group (66 [56; 69] s in the T-ICD group and 113 [95; 149] s in the S-ICD group; P = 0.03). Mean time to therapy was doubled in the S-ICD group compared to the T-ICD group (19 [18; 23] s in the S-ICD group and 9 [7; 10] s in the T-ICD group; P = 0.001).
Comparison of shock number and time to therapy during the procedure (i.e. 5 VF inductions) between the T-ICD group and the S-ICD group
| T-ICD group n = 7 | S-ICD group n = 7 | P-value | |||||||||
|---|---|---|---|---|---|---|---|---|---|---|---|
| median | min | Q1 | Q3 | max | median | min | Q1 | Q3 | max | ||
| Electrical shocks | |||||||||||
| Implanted ICD shocks | |||||||||||
| Number of shocks (n) | 8 | 5 | 5 | 8 | 8 | 6 | 5 | 5 | 6 | 8 | 0.2 |
| Energy delivered (joules) | 200 | 120 | 120 | 222 | 240 | 480 | 400 | 400 | 480 | 640 | 0.001 |
| External ICD shocks | |||||||||||
| Number of shocks (n) | 0 | 0 | 0 | 3 | 4 | ||||||
| Energy delivered (joules) | 0 | 0 | 0 | 666 | 1020 | ||||||
| Total (implanted + external) ICD shocks | |||||||||||
| Number of shocks (n) | 8 | 5 | 5 | 11 | 12 | 6 | 5 | 5 | 6 | 8 | 0.2 |
| Energy delivered (joules) | 200 | 120 | 120 | 900 | 1242 | 480 | 400 | 400 | 480 | 640 | 0.2 |
| Total time spent in VF (s) | 66 | 31 | 56 | 69 | 126 | 113 | 83 | 95 | 149 | 153 | 0.03 |
| Mean time to therapy implanted ICD shocks (s) | 9 | 6 | 7 | 10 | 11 | 19 | 17 | 18 | 23 | 25 | 0.001 |
max, maximum; min, minimum; Q1, first quartile; Q3, third quartile; S-ICD, subcutaneous implantable cardioverter defibrillator T-ICD, transvenous implantable cardioverter defibrillator; VF, ventricular fibrillation.
Cardiac injury
Only two pigs showed ECG modifications. One pig from the T-ICD group showed larger amplitude of T wave in V1, V2, and 1 pig from the S-ICD group showed negative T wave in V1, V2, and V3 just after the procedure. These ECG abnormalities disappeared at the 5th day.
High-sensitivity troponin T levels were significantly higher in the T-ICD group from 1 to 24 h after the procedure compared to S-ICD group (P ≤ 0.02), and returned to basal levels after the 2nd day (Figure 1). Total number of shocks and total energy delivered were not correlated to high-sensitivity troponin T levels. Total time spent in VF was poorly correlated to high-sensitivity troponin T levels when measured at 1, 3, and 6 h after the procedure (rho = 0.54; P = 0.048; rho = 0.53; P = 0.05; rho = 0.56; P = 0.04 respectively).
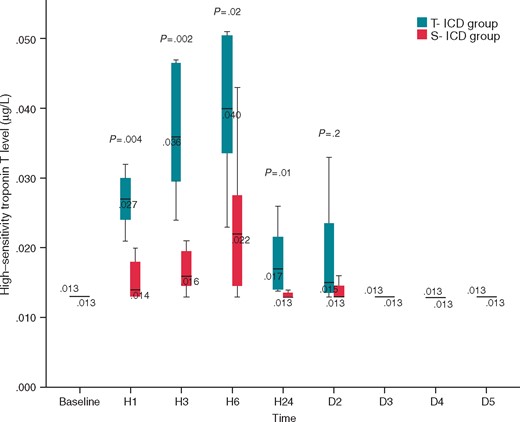
Comparison of high-sensitivity troponin T level between S-ICD group and T-ICD group. High-sensitivity troponin T level was measured before the first VF induction, 3, 6, 12, and 24 h after the procedure, 2, 3, 4, and 5 days after the procedure. D2, day 2; D3, day 3; D4, day 4; D5, day 5; H1, hour 1; H3, hour 3; H6, hour 6; S-ICD, subcutaneous implantable cardioverter defibrillator; T-ICD, transvenous implantable cardioverter defibrillator.
Pathology analysis demonstrated abnormalities in two swine from the T-ICD group. One had an endocardial inflammatory lesion (0.65 × 21 mm) located at the apex. The other, a transmural, healed necrotic damage with fibrosis, macrophages and calcified dead cardiac myocytes (1.38 × 1.8 mm), also at the apex. One pig in the S-ICD group had a large polymorphic inflammation lesion in a bundle of the intercostal muscle.
Systemic toxicity
There was no statistically significant difference regarding haemodynamic parameters between the two groups except for heart rate, which was lower in the S-ICD group (Table 2). Plasma creatinine, lactate, and bicarbonates, levels did not differ significantly between the two groups at every blood collection (see Supplementary material online). However, creatine phosphokinase activity levels were significantly higher in the S-ICD group, at 3, 6, and 24 h after the procedure, suggesting muscle injury in accordance with Plasma TGO levels at 3, 6, 24 h, and 2 days after the procedure (Figure 2). In addition, total number of shocks, total energy delivered and total time spent in VF was not correlated to total creatine phosphokinase activity levels.
Comparison of per-procedure haemodynamic parameters between the T-ICD group and the S-ICD group
| T-ICD group n = 7 | S-ICD group n = 7 | P-value | |||
|---|---|---|---|---|---|
| Systolic blood pressure (mmHg) | |||||
| Before 1st VF induction | 89 | [81; 97] | 100 | [90; 108] | 0.1 |
| After 1st VF induction | 89 | [80; 98] | 87 | [76; 98] | 0.6 |
| After 2nd VF induction | 92 | [83; 97] | 84 | [64; 93] | 0.6 |
| After 3rd VF induction | 87 | [80; 91] | 84 | [74; 104] | 0.6 |
| After 4th VF induction | 86 | [74; 94] | 81 | [72; 89] | 0.6 |
| After 5th VF induction | 85 | [81; 99] | 84 | [80; 99] | 0.5 |
| Mean blood pressure (mmHg) | |||||
| Before 1st VF induction | 71 | [64; 76] | 81 | [73; 96] | 0.2 |
| After 1st VF induction | 70 | [60; 70] | 54 | [48; 63] | 0.2 |
| After 2nd VF induction | 70 | [61; 78] | 59 | [51; 61] | 0.2 |
| After 3rd VF induction | 62 | [59; 71] | 64 | [55; 85] | 0.8 |
| After 4th VF induction | 64 | [52; 76] | 59 | [54; 69] | 0.9 |
| After 5th VF induction | 66 | [54; 70] | 68 | [61; 73] | 0.5 |
| Diastolic blood pressure (mmHg) | |||||
| Before 1st VF induction | 58 | [49; 71] | 65 | [59; 82] | 0.4 |
| After 1st VF induction | 55 | [47; 61] | 45 | [34; 51] | 0.2 |
| After 2nd VF induction | 62 | [45; 71] | 41 | [35; 48] | 0.4 |
| After 3rd VF induction | 53 | [45; 62] | 53 | [43; 72] | 0.8 |
| After 4th VF induction | 58 | [46; 62] | 43 | [40; 57] | 0.5 |
| After 5th VF induction | 48 | [40; 66] | 50 | [44; 61] | 0.7 |
| Heart rate (beats per minute) | |||||
| Before 1st VF induction | 95 | [91; 118] | 92 | [88; 94] | 0.07 |
| After 1st VF induction | 119 | [97; 144] | 111 | [95; 116] | 0.04 |
| After 2nd VF induction | 112 | [106; 131] | 95 | [91; 97] | 0.01 |
| After 3rd VF induction | 111 | [104; 138] | 108 | [97; 116] | 0.2 |
| After 4th VF induction | 107 | [102; 122] | 97 | [93; 104] | 0.07 |
| After 5th VF induction | 116 | [101; 121] | 99 | [93; 114] | 0.07 |
Data are expressed as median [1st quartile; 3rd quartile]. S-ICD, subcutaneous implantable cardioverter defibrillator; T-ICD, transvenous implantable cardioverter defibrillator; VF, ventricular fibrillation.
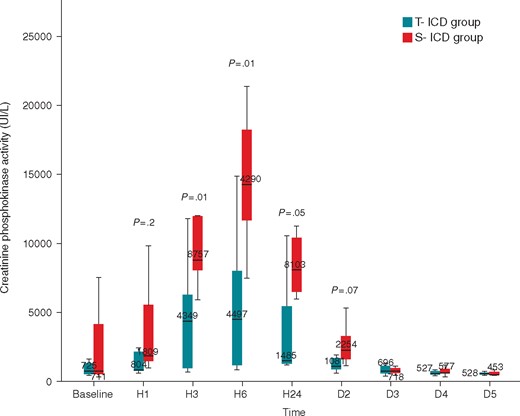
Comparison of creatine phosphokinase activity between S-ICD group and T-ICD group. Creatine phosphokinase activity was measured before the first VF induction, 3, 6, 12, and 24 h after the procedure, 2, 3, 4, and 5 days after the procedure. D2, day 2; D3, day 3; D4, day 4; D5, day 5; H1, hour 1; H3, hour 3; H6, hour 6; S-ICD, subcutaneous implantable cardioverter defibrillator; T-ICD, transvenous implantable cardioverter defibrillator.
Cerebral toxicity
Electroencephalogram total power and spectral edge frequency were not statistically different between groups during the surgical procedure (see Supplementary material online). Before and 1 h after the procedure, S100 protein levels were not different between the two groups. Six hours after the procedure, S100 protein level decreased significantly in the T-ICD group [0.22 (0.2; 0.4) µg/L in the T-ICD group and 0.48 (0.26; 0.55) µg/L in the S-ICD group; P = 0.04] (Figure 3). S100 protein levels were not correlated to the total number of shocks, total energy delivered and total time spent in VF.
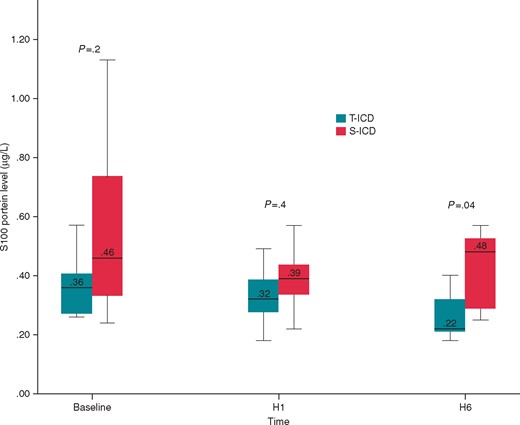
Comparison of S100 protein level between S-ICD group and T-ICD group. S100 protein level was measured before the first VF induction, 1 and 6 h after the procedure. H1, hour 1; H3, hour 3; H6, hour 6; S-ICD, subcutaneous implantable cardioverter defibrillator; T-ICD, transvenous implantable cardioverter defibrillator.
Discussion
With the lack of studies comparing damage induced by T-ICD and S-ICD shocks, the aim of this study was to use a pig preclinical approach to assess, in the most realistic setting, the efficiency and off-target effects of both therapeutic approaches. This work demonstrated that in simulated ‘real-life’ conditions, S-ICD was more likely to defibrillate VF after the first shock than T-ICD, even if time spent in VF was longer. Although plasma creatine phosphokinase activity levels were significantly higher in the S-ICD group at 3, 6, and 24 h after the procedure, the plasma high-sensitivity troponin T levels were significantly higher in the T-ICD group during the first 24 h, suggesting tissue cardiac necrosis.
T-ICD shock complications have been widely studied and myocardial toxicity of shocks may have different mechanisms. Electroporation can induce myocardial cell injury if the transmembrane potential is large, and radical formation may be produced after electrical shocks.10,11 Moreover, multiple shocks have a negative inotropic effect, especially if there is a previous systolic dysfunction.12,13
S-ICD has been a step forward in the prevention of sudden cardiac death, particularly in young patients who will be implanted for a long time, and for patients with history of endocarditis. Nevertheless, the potential cardiac injury resulting from S-ICD shocks has been less studied than the toxicity of T-ICD shocks. Scientific literature comparing transvenous and subcutaneous defibrillation is very sparse. Only one study on eight pigs compared these two techniques, but there were substantial differences compared to our work as there was no prior VF induction and no arrhythmia detection by the defibrillator.14 Killingsworth’s work found higher troponin levels in 35 joules transvenous shocks compared to 80 joules S-ICD shocks. The use of 35 joules for transvenous defibrillation in this study led us to program the first shock at 24 joules, to limit cardiac toxicity in the T-ICD group. In our study, the T-ICD group had higher high-sensitivity troponin T levels during the first 24 h. The result can be explained by the endocavitary shock itself inducing tissue necrosis. Indeed, one pig from the T-ICD group received 12 shocks and another one from the same group had 11 shocks. The high-sensitivity troponin T levels were high in these two pigs, and they didn’t have any histological lesions.
The time to therapy was twice as long in the S-ICD group compared to the T-ICD group. Significant S100 protein level differences were observed between the groups 6 h after the procedure. S100 protein, which is present in glia and Schwann’s cells, is implicated in neuronal differentiation and apoptosis. Several studies have shown that increased S100 protein level is a sensitive marker of brain injury.15 Initial observations suggested that additional time in VF had consequences for brain injury, but when we performed a more accurate analysis of the kinetics of S100 protein in our study, the difference between the groups was not the result of an increase in the S-ICD group. Instead a slight decrease in the S100 protein levels in the T-ICD group, which does not support cerebral toxicity caused by S-ICD. However, further analysis of cerebral lesion could be assessed with a cerebral MRI or CT scan.
Conversely, the benefit of a longer arrhythmia-detection window has already been demonstrated with T-ICD.16 It allows self-termination of non-sustained ventricular arrhythmias, which can be beneficial as even appropriate shocks have been demonstrated to increase mortality.17,18 Finally, a recent study demonstrated that aggressive programming, with short detection durations, was associated with an increase in electrical storms, suggesting that this programming could increase the risk of death.19
Several limitations of this study need to be underlined. Firstly, the number of pigs was limited because of ethical considerations. However, the well-controlled animal model and the surgical and preclinical conditions, allowed the collection of pertinent data that might be transferred to human experience. Secondly, the number of electrical shocks was different between groups, but the correlation analysis didn’t reveal significant difference between number of shocks and troponin levels. The last limitation is that animals were healthy pigs and didn’t have any cardiomyopathy.
The clinical perspective of this study would be the long-term comparison of cardiotoxicity and mortality in T-ICD and S-ICD patient populations.
Conclusions
In conclusion, in this study, which aimed to reproduce realistic settings of ventricular arrhythmia, T-ICD shocks were more cardiotoxic than S-ICD shocks in the short term after defibrillation. However, S-ICD shocks induced more skeletal muscle injuries than T-ICD shocks. Finally, time to therapy was twice as long in the S-ICD group compared to the T-ICD group, but it didn't induce relevant brain injury.
Supplementary material
Supplementary material is available at Europace online.
Acknowledgments
We thank Giorgio Corbucci, Jeffrey Arsham and Clare Brooke for rereading this manuscript.
Conflict of interest: none declared.
