


Hospital admissions are frequently preceded by increased pulmonary congestion in heart failure (HF) patients. This study evaluated whether early automated fluid status alert notification via telemedicine improves outcome in HF patients.
Patients recently implanted with an implantable cardioverter defibrillator (ICD) with or without cardiac resynchronization therapy were eligible if one of three conditions was met: prior HF hospitalization, recent diuretic treatment, or recent brain natriuretic peptide increase. Eligible patients were randomized (1:1) to have fluid status alerts automatically transmitted as inaudible text message alerts to the responsible physician or to receive standard care (no alerts). In the intervention arm, following a telemedicine alert, a protocol-specified algorithm with remote review of device data and telephone contact was prescribed to assess symptoms and initiate treatment. The primary endpoint was a composite of all-cause death and cardiovascular hospitalization. We followed 1002 patients for an average of 1.9 years. The primary endpoint occurred in 227 patients (45.0%) in the intervention arm and 239 patients (48.1%) in the control arm [hazard ratio, HR, 0.87; 95% confidence interval (CI), 0.72–1.04; P = 0.13]. There were 59 (11.7%) deaths in the intervention arm and 63 (12.7%) in the control arm (HR, 0.89; 95% CI, 0.62–1.28; P = 0.52). Twenty-four per cent of alerts were not transmitted and 30% were followed by a medical intervention.
Among ICD patients with advanced HF, fluid status telemedicine alerts did not significantly improve outcomes. Adherence to treatment protocols by physicians and patients might be challenge for further developments in the telemedicine field.
See page 3164 for the editorial comment on this article (doi:)
Our study is a randomized controlled trial showing no significant benefit of a specific telemonitoring approach using implant-based intrathoracic impedance measurements in patients with heart failure (HF). The alert technology, inaudible to patients, did not decrease hospitalizations. The observed rate of telemonitor-guided medical intervention was low despite intensive instruction of patients and physicians. This important finding may demonstrate the situation more close to real life and clinical practice, highlighting the challenges associated with such a disease management approach. Given the considerable, and largely unmitigated burden of HF, the potential for telemonitoring to improve the management of patients with HF is substantial, provided overcoming the obstacles identified in Optimization of Heart Failure Management using OptiVol™ Fluid Status Monitoring and CareLink™, which may be an even greater barrier in clinical practice than in the clinical trial conditions reported herein.
Introduction
Heart failure is a highly prevalent syndrome, affecting over 23 million people worldwide.1,2 Although improvements have been made in the treatment of chronic HF, morbidity, and mortality remain high.3 In ∼90% of cases, patients hospitalized for HF present with pulmonary congestion with increased filling pressures and volume overload4 often preceding the development of symptoms and hospitalization.5,6 A variety of strategies has been tested leveraging implantable technologies for the early detection of congestion, thus enabling intervention in an effort to avoid hospitalization.5–9 However, these attempts have had mixed results. In a previous study, intrathoracic impedance monitoring with audible patient alert did not reduce all-cause mortality or HF hospitalizations in the management of patients with HF.7 In fact, using this diagnostic information together with an alert audible for patients resulted in more hospitalizations and outpatient visits. A proportion of hospitalizations may well have been driven mainly by the audible alert itself and the need of patients (and also physicians) to resolve the situation even in the absence of signs and symptoms for HF deterioration. Recently, findings from the IN-TIME study10 showed a modest benefit in a clinical score consisting of all-cause death, overnight hospitalization for HF, change in New York Heart Association (NYHA) classification, and change in patient global self-assessment. However, a recent systematic meta-analysis of nine randomized controlled trials on remote monitoring of implantable cardioverter defibrillator (ICD) patients involving 6469 patients failed to show effects on all-cause mortality, cardiovascular mortality, and hospitalization.11
The OptiLink HF (Optimization of Heart Failure Management using OptiVol™ Fluid Status Monitoring and CareLink™) study was designed to investigate whether early detection of pulmonary congestion via telemedicine with a defined intervention algorithm reduces all-cause death and cardiovascular (CV) hospitalizations in chronic HF patients with an ICD compared with patients without telemedicine access.
Methods
Study design and participants
Optimization of Heart Failure Management using OptiVol™ Fluid Status Monitoring and CareLink™ was a prospective, multi-centre, randomized, and unblinded study conducted in Germany. Eligible patients were in stable NYHA class II or III HF, left ventricular ejection fraction (LVEF) ≤35%, and received a market-released ICD (newly implanted or replacement) with or without cardiac resynchronization therapy (CRT-D) within the preceding 3–21 days according to guideline recommended indications.12 Of note, CRT-D patients needed QRS ≥120 ms and left ventricular end diastolic diameter ≥55 mm. All patients received a Medtronic ICD or CRT-D with the capability of intrathoracic fluid status monitoring and telemedicine functionality. In addition, one of three conditions had to be met: either HF hospitalization within the last 12 months, intravenous/oral diuretic treatment within 30 days, or increased brain natriuretic peptide (BNP)/N-terminal-pro-BNP within 30 days. Cut-offs were >400 pg/mL for BNP and >450 pg/mL in patients <50 years, >900 pg/mL in patients 50–75 years, >1800 pg/mL in patients >75 years for N-terminal-pro-BNP. Patients with chronic renal failure requiring dialysis, severe chronic obstructive pulmonary disease, or with planned heart transplantation were ineligible.
The study design required follow-up visits every 6 months after randomization up to 18 months. In the first quarter of 2011, during the course of the trial, the protocol was revised to extend follow-up until all participants had reached the 18-month visit. The revision was at the request of the data safety monitoring board (DSMB) due to slower than anticipated enrolment.
The executive committee designed and oversaw the conduct of the trial and data analysis in collaboration with the sponsor, Medtronic. The trial was monitored by an independent DSMB. Data were collected and managed by the sponsor and analysed according to a pre-specified statistical analysis plan. The trial protocol was approved by the ethical committees of the individual centres and is available along with the statistical analysis plan at eurheartj.oxfordjournals.org. All patients provided written informed consent prior to enrolment into the trial.
Randomization
Patients were randomly assigned 1:1 to have their devices set to automatically transmit fluid index telemedicine alerts or to not transmit alerts. The randomization was done using a centralized, concealed process implemented by the sponsor, and stratified by NYHA class, history of atrial fibrillation (AF), history of ventricular arrhythmia (VT/VF), and ischaemic status. The random allocation sequence with random blocks of four was computer generated. Control patients were not set up in the telemonitoring system so that no accidental crossover could occur.
Intervention algorithm
As described previously,13 patients randomized to the intervention arm had telemedicine alerts enabled, triggered by intrathoracic fluid index threshold crossing (FTC), which was programmed at the investigator's discretion. The fluid status monitoring algorithm detects changes in thoracic impedance resulting from accumulation of intrathoracic fluid as an early sign of developing cardiac decompensation.
Alerts were automatically transmitted via text message to the responsible physician but were ‘silent’ (inaudible) to the patient. Following a telemedicine alert, a protocol-specified intervention algorithm, as previously shown in Figure 2 in the OptiLink HF design paper13 was followed with follow-up actions being documented on Telemedicine Alert Evaluation Forms (TAEFs). Briefly, the HF-specific device data were reviewed remotely, and the patient was contacted within 2 working days by phone to evaluate condition and HF status and to take appropriate measures. Up to 3 further telemedicine-guided remote contacts with review of device data and HF status were scheduled in the 2 weeks following the alert. When contacting patients on the basis of telemonitored data, the investigators used a standardized telephone interview to establish whether the patient's overall condition had worsened and whether the patient was regularly taking prescribed drugs. Patients randomized to the control group did not have access to telemonitoring, although device data could be accessed in the clinic.
Study outcomes
The primary outcome was a composite of all-cause death and CV hospitalization. Secondary outcomes were all-cause mortality, cardiovascular mortality, composite of all-cause death and HF hospitalization, CV hospitalizations, HF hospitalizations, and all-cause hospitalizations during follow-up.
An Event Adjudication Committee, blinded to the treatment arms, adjudicated all reported events and deaths. For all events and deaths, a final consensus classification was reached. Analyses used adjudication results.
Statistical analysis
Statistical analysis was pre-specified in the study protocol and a statistical analysis plan. Freedom from event is illustrated with Kaplan–Meier curves and compared between randomized arms with a stratified log-rank test. The stratifying variables are device type (ICD vs. CRT-D) and the variables used in the randomization process, i.e. NYHA class, ischaemic, or non-ischaemic HF aetiology, history of VT/VF, and history of AF. Hazard ratios (HRs) and associated 95% confidence intervals (CIs) are reported from stratified Cox proportional-hazards regression models. All HR estimates are for the intervention arm relative to the control arm. Subgroup analyses were performed with use of stratified cox proportional-hazards regression models, having treatment group and a baseline factor as covariates along with their interaction term. The rate of HF hospitalization per patient per year was analysed through a negative binomial regression with only treatment arm as covariate and log (follow-up time) as an offset variable to account for different follow-up time among the subjects.
As re-consent was optional, long-term follow-up data were included in analysis only after poolability assessment. Patients in the primary objective analysis cohort who re-consented and were followed beyond 18 months are compared against those who survived to 18 months but did not re-consent and exited at the 18-month visit with respect to gender and the above mentioned stratifying variables. Fisher's exact test was performed for each of these characteristics.
The study was designed to include 1000 patients to ensure 80% power when the event-free rate at 18 months would be 72% in the control arm and 80.4% in the intervention arm. Two interim analyses were scheduled when 33 and 67% of the 238 expected primary endpoints occurred, with α-levels of 0.0001 and 0.001, respectively. The final analysis was done with α = 0.0495 to compensate for the interim analyses, maintaining total type I error at 0.05.
Results
Study patients
From 28 October 2008 through 29 April 2013, a total of 1002 subjects were recruited from 65 centres in Germany. Patients had NYHA class II (19.4%) or III (80.6%) HF symptoms and were implanted with a single-chamber ICD (23.3%), dual-chamber ICD (14.2%), or CRT-D (62.6%) prior to enrolment. Mean age was 66.3 ± 10.4 years, 79.7% were male. Patients' demographics and clinical characteristics are shown in Table 1. Based upon observed imbalances in gender and history of HF hospitalization, formal statistical testing was done, which confirmed the imbalances. I.V. diuretics prior to randomization was slightly imbalanced.
Characteristics of the patients at baselinea
| Characteristic | Intervention (n = 505) | Control (n = 497) |
|---|---|---|
| Age (years) | 66.1 ± 10.1 | 66.4 ± 10.7 |
| Male sex, n (%) | 390 (77.2)a | 409 (82.3) |
| Body-mass index (kg/m2) | 28 ± 5 | 28 ± 5 |
| Ischaemic cardiomyopathy, n (%) | 274 (54.3) | 271 (54.5) |
| LVEF (%) | 26.7 ± 6.1 | 26.7 ± 6.1 |
| Ventricular tachyarrhythmia | 76 (15.0) | 71 (14.3) |
| HF history | ||
| HF hospitalization last 12 months, n (%) | 344 (68.1)a | 297 (59.8) |
| Intravenous diuretics last 30 days, n (%) | 130 (25.7) | 102 (20.5) |
| Increased BNP last 30 days, n (%) | 90 (17.8) | 68 (13.7) |
| Increased NT-pro-BNP last 30 days, n (%) | 274 (54.3) | 289 (58.1) |
| NYHA functional class, n (%)b | ||
| II | 99 (19.6) | 95 (19.1) |
| III | 406 (80.4) | 402 (80.9) |
| ICD type, n (%) | ||
| Single-chamber | 111 (22.0) | 122 (24.5) |
| Dual-chamber | 71 (14.1) | 71 (14.3) |
| Cardiac resynchronization therapy | 323 (64.0) | 304 (61.2) |
| Comorbidities, n (%) | ||
| Hypertension | 363 (71.9) | 355 (71.4) |
| Diabetes | 176 (34.9) | 173 (34.8) |
| Kidney failure | 171 (33.9) | 155 (31.2) |
| AF | 156 (30.9) | 148 (29.8) |
| Drugs, n (%) | ||
| β-Blocker | 477 (94.5) | 459 (92.4) |
| ACE inhibitor or ARB | 461 (91.3) | 467 (94.0) |
| Diuretic | 480 (95.0) | 472 (95.0) |
| Nitrate or vasodilator | 41 (8.1) | 38 (7.6) |
| Aldosterone antagonist | 348 (68.9) | 346 (69.6) |
aPlus–minus values are means ± standard deviation. There were no significant differences between the two groups except for HF hospitalization within the last 12 months (P = 0.0069) and gender (P = 0.0495).
bNew York Heart Association class reflects the status of patients prior to device implant.
![A total of 1002 patients were enrolled and randomized [505 patients to intervention (automated intrathoracic fluid index alert transmission) and 497 to control (standard care only)]. Follow-up occurred every 6 months until the original study end at 18 months or until study completion for patients that re-consented. Longer term follow-up was not required so no attrition is counted post 18 months.](https://oup.silverchair-cdn.com/oup/backfile/Content_public/Journal/eurheartj/37/41/10.1093_eurheartj_ehw099/1/m_ehw09901.jpeg?Expires=1716464619&Signature=FoSw~oRANAC-329fCDFDYKkqBqXW7aVSTXoqbh5pBamBQG0PeLdG43sHPWp3z35wt2n8w~FXm-LmlE2d65v5w69KfywxCpAiDVE2R3hyx3CR0UnsMcJkVSDccf3o47NwzVsqLzPAiA-8gxM7yd2xNivCvdOfhlemTu1EGVjMWBdFyiPAxIp0hjpfV0iV2vVPIDFAMC30tvRGQbMRoubxCrvpyF5dCeK3ZQmRmKEy9S0FyAq7vuRQ0y6~QesXBxCIO46Xtloaa8uCrrZ02a82XtnF~6LBfiLx6faE~o18r-eiD0OlReMULw~2bMft~d5z~LaJYda-33GoTFLxWddDfQ__&Key-Pair-Id=APKAIE5G5CRDK6RD3PGA)
A total of 1002 patients were enrolled and randomized [505 patients to intervention (automated intrathoracic fluid index alert transmission) and 497 to control (standard care only)]. Follow-up occurred every 6 months until the original study end at 18 months or until study completion for patients that re-consented. Longer term follow-up was not required so no attrition is counted post 18 months.
Endpoints
Primary and secondary outcomes
| Intervention (n = 505) | Control (n = 497) | Hazard ratio (95% CI) | P-value | Adjusted hazard ratioa (95% CI) | Adjusted P-valuea | |
|---|---|---|---|---|---|---|
| Primary composite endpoint, n (%) | ||||||
| Death from any cause or first CV hospitalization | 227 (45.0) | 239 (48.1) | 0.87 (0.72–1.04) | 0.13 | 0.84 (0.70–1.02) | 0.07 |
| Death from any cause | 59 (6.2) | 63 (8.5) | 0.89 (0.62–1.28) | 0.52 | 0.86 (0.59–1.24) | 0.41 |
| First CV hospitalization | 214 (42.4) | 221 (44.5) | 0.89 (0.73–1.08) | 0.22 | 0.86 (0.71–1.05) | 0.14 |
| Secondary endpoints | ||||||
| Death from any cause or first HF hospitalization, n (%) | 139 (27.5) | 155 (31.2) | 0.81 (0.64–1.03) | 0.09 | 0.77 (0.61–0.98) | 0.03 |
| First HF hospitalization, n (%) | 119 (23.6) | 128 (25.8) | 0.87 (0.67–1.12) | 0.28 | 0.82 (0.63–1.06) | 0.13 |
| Hospitalizations for HF, n (events per patient per year) | 220 (0.24) | 218 (0.30) | – | 0.20b | – | – |
| Death from cardiovascular causes, n (%) | 46 (9.1) | 48 (9.7) | 0.90 (0.59–1.35) | 0.60 | 0.89 (0.58–1.34) | 0.57 |
| Alive and out of the hospital, days per patient per year | 337.0 | 330.7 | – | 0.34b | – | – |
| First any cause hospitalization, n (%) | 286 (56.6) | 292 (58.8) | 0.94 (0.79–1.11) | 0.46 | 0.91 (0.77–1.07) | 0.26 |
aResults from a Cox proportional-hazards regression model with history of HF hospitalization (12 months), IV-Diuretics (30 days prior enrolment), and treatment arm as covariates. This model is stratified by device type, NYHA, history of AF, ischaemic status, and history of VT/VF.
bP-value based on a negative binomial model with treatment as covariate and log (follow-up time) as an offset variable.
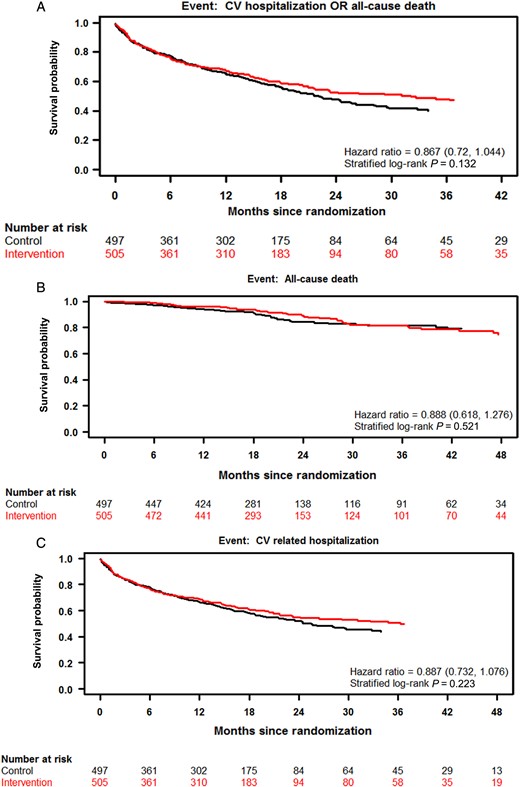
Kaplan–Meier curves are shown for the composite primary endpoint of all-cause death and cardiovascular hospitalization (A) and its components all-cause death (B) and cardiovascular hospitalization (C).
There were 59 deaths in the intervention arm and 63 in the control arm. All-cause death incidences at (18, 24) months were (6.3%, 11.0%) and (8.5%, 15.7%) respectively (HR, 0.89; 95% CI, 0.62–1.28; P = 0.52). Figure 2B displays the survival curves by treatment arm for all-cause death.
There were 435 patients who experienced a total of 928 CV hospitalizations post-randomization; 495 events in 214 patients in the intervention arm and 433 events in 221 patients in the control arm. Time to first CV hospitalization was not different between the treatment and control groups (HR, 0.89; 95% CI, 0.73–1.08; P = 0.22). Figure 2C displays the survival curves by treatment arm for the CV hospitalization endpoint.
Post-randomization HF hospitalizations were also similar between the treatment arms. More specifically, the survival probabilities from HF hospitalization at (18, 24) months were (79.2%, 75.4%) in the intervention arm, and (76.2%, 71.8%) in the control arm (HR, 0.87; 95% CI, 0.67–1.12; P = 0.28). Intervention vs. Control HR estimates for primary and secondary objectives are shown in Table 2. The number of HF hospitalizations per patient per year as estimated from a negative binomial regression model was 0.24 for the Intervention arm and 0.30 for the Control arm (P = 0.20).
Subgroup analysis
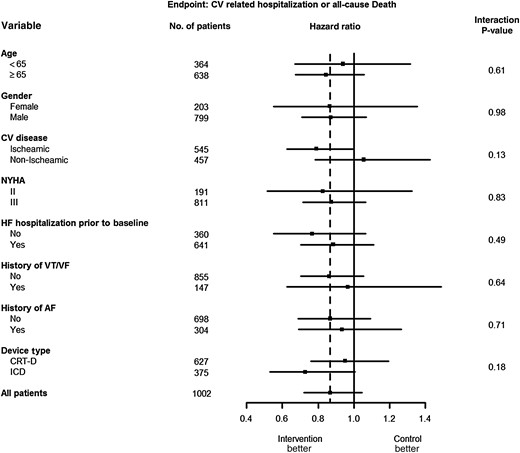
Hazard ratios and 95% confidence intervals are shown for the primary outcome in each pre-specified subgroup. With exception to cardiovascular disease and device type, the hazard ratios of the subgroups were similar. All baseline factors did not present statistically significant interactions. The dotted vertical line represents the hazard ratio using all patients (HR = 0.87). The horizontal lines indicate nominal 95% confidence intervals for the hazard ratio.
Post hoc analyses
As there was an imbalance between the two arms with respect to a history of HF hospitalization in the 12 months prior to randomization, the analysis was repeated adjusting for HF hospitalization and i.v.-diuretics prior to randomization (added as covariates to the stratified Cox regression models). None of the endpoints had a significant HR, except for the composite of HF hospitalization and all-cause death (HR, 0.77; 95% CI, 0.61–0.98; P = 0.03).
Alerts and compliance
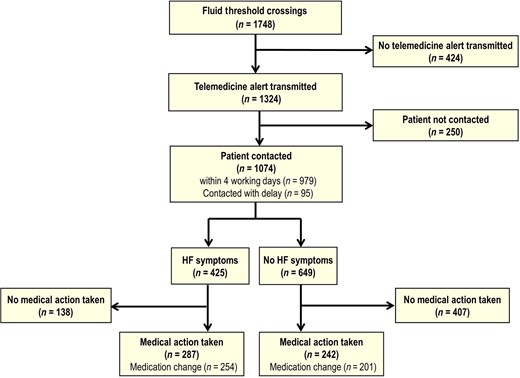
Flow diagram depicting interventions following a fluid threshold crossing in the treatment arm.
Patients reported worsening HF symptoms at any of the telephone contacts for 425 (37.7%) of the TAEFs. For 529 (46.9%) TAEFs, medical actions were taken, including medication changes for 455 (40.3%). Therefore, of the 1748 FTCs, 30.3% led to a medical action and 26.0% altered medication. Taking into account HF medication changes which occurred within 30 days after a TAEF, excluding changes on or after a CV hospitalization, equated to 0.37 HF medication changes per patient per 6 months as a result of TAEF algorithms.
TAEFs were followed by hospitalizations adjudicated as CV-related within 30 days of an FTC in 72 cases (6.4% of 1128 TAEFs). In total, there were 110 CV hospitalizations within 30 days of an FTC for the intervention arm. Thus 38 CV hospitalizations within 30 days of an FTC occurred which were not followed with a TAEF.
Device data from in-office visits were collected in both arms. In the intervention arm, data from remote telemedicine interrogations were also collected, which led to high completeness of device data in the intervention arm compared with moderate completeness in the control arm. Out of 554 CV hospitalizations or deaths in the intervention arm, 118 (21.3%) were preceded by a documented FTC in the preceding 30 days. In the control arm, this was the case for 56 of 496 events (11.3%). Restricting to events with complete device data in the 30 preceding days, 104 of 374 endpoints in the intervention arm (27.8%) had an FTC in the 30 preceding days; in the control arm, this occurred for 50 of 228 events (21.9%). These percentages were not statistically different (P = 0.12).
Further post hoc analyses were done to evaluate the prognostic importance of early fluid threshold crossings (FTC), similar to the analysis reported by Tang et al.14 Results are presented in Supplementary material online. In brief, early FTCs are associated with an increased incidence of primary endpoints >6 months after enrolment (P = 0.0019). The study intervention was associated with a lower late event incidence in those patients that remained free from endpoints and FTCs in the first 6 months (P = 0.035). Thus, the intervention does not appear to prevent repeat events in patients that have an early event, but only in patients that are event-free at 6 months.
Discussion
In the OptiLink HF study, use of a specific intrathoracic impedance and telemedicine-based HF disease management strategy in patients with moderate-to-severe HF, severe left ventricular dysfunction, and prior implantation of an ICD/CRT-D device did not significantly reduce the rate of all-cause death or CV hospitalization compared with standard clinical assessment. In addition, the secondary morbidity and mortality outcomes did not show a statistically significant benefit.
The effects of telemonitoring within OptiLink HF depended upon multiple factors including the performance of the device, successful transmission of FTCs, physician follow-up, subsequent intervention/medical action, and patient adherence. The intrathoracic impedance monitoring feature has been previously evaluated, demonstrating high correlation to pulmonary capillary wedge pressure and net fluid loss during hospitalization15 but with wide ranging sensitivity (20.7–76.9%) and positive prediction (4.7–60%) to HF hospitalization.15,16 Tang et al.14 reported an association of FTC with a 2-fold increase risk in mortality. The strategy to use implantable technology for the management of fluid congestion requires medical action to be taken, potentially in the absence of symptoms. Within OptiLink HF, the proportion of events with prior FTC is highest for HF-related hospitalizations, as expected. However, only one in three HF hospitalizations had a prior crossing. Consequently, assuming crossings >30 days before hospitalization are unrelated to the event, at best, one in three HF hospitalizations could have been prevented by the OptiLink HF intervention.
While the OptiLink HF study used a prescriptive intervention algorithm, medication changes, and medical actions were at the discretion of the investigator. We observed that 30% of FTCs led to medical action and 26% to medication change. More specifically, on average, patients in the intervention arm had 0.37 HF medication changes per 6 months as a result of TAEF algorithms. Conversely, Adamson et al.17 reported an average incremental rate of 5.8 device-driven medication changes per 6 months for reduced EF patients with daily ambulatory pulmonary artery pressure monitoring (9.5 changes in the treatment vs. 3.7 in the control subjects).
From the analyses performed it must be concluded that the rate of telemonitor-guided medical intervention was low. Intervention following an FTC was 30%, and there was no record of any intervention in 38 of the 110 CV hospitalizations which occurred within 30 days of an FTC. Since patients and investigators were carefully introduced to the use of the device and the application of the predefined treatment algorithm at entry and during follow-up of the study, the reported intervention rate may more closely reflect real life practice, highlighting challenges associated with reliable data transmission and confidence in fluid index algorithms.
The success of telemonitoring is dependent on both optimal physician reaction to alerts and optimal monitoring of patients. Centralized monitoring with an associated call centre could have led to an improvement of these conditions. However, OptiLink HF was designed to create conditions, which are practical and affordable in real life. Therefore, it was decided not to use a central monitoring unit but to rely on appropriate clinical response to telemonitoring. The low rate of telemonitor-guided medical intervention may reflect the need to invest additional effort into educational activities to train physicians to react to telemonitoring data, eventually also in patients before symtoms develop. In addition, efforts to improve the technology of data transmission for telemonitoring are warranted. Results from our trial highlighted these challenges in telemonitor-guided HF disease management.
A limitation of the study was the optional extended follow-up beyond 18 months. However, no differences in baseline characteristics were observed between patients with follow-up completed at 18 months compared with patients continued in the study. Another limitation is the potential heterogenous treatment of the intervention patients, with some physicians being more aggressive than others in responding to alerts. However, this phenomenon is inflicted in every trial where physicians must react according to their usual medical practice. Also, as the study was only conducted in Germany the results may not apply to several other regions. In addition, there was an inability to mask patients and investigators to the treatment allocation inherent with the technology used creating a potential bias.
In conclusion, OptiLink HF did not show a benefit of early detection of congestion using a remote fluid index alert system on the composite of all-cause death and cardiovascular hospitalizations. Physician and patient adherence to telemonitoring systems, which are practical and affordable, represents a major and underappreciated challenge.
Supplementary material
Supplementary material is available at European Heart Journal online.
Authors' contributions
B.G. and J.M. performed statistical analysis; M.B. and J.B. handled funding and supervision; D.B., M.B., R.B., J.B., C.B., B.G., B.H., C.I., S.K., G.K., J.M., H.O., and K.R. acquired the data; J.B., M.B., R.B., C.B., H.D., B.G., G.K., and K.R. conceived and designed the research; M.B. and B.G. drafted the manuscript; All made critical revision of the manuscript for key intellectual content.
Funding
The OptiLink HF Study was sponsored and funded by Medtronic PLC, (Minneapolis, MN, USA). The funder assisted in data analyses and preparing this report. The authors are responsible for the design and conduct of this study, data interpretation, and the drafting and editing of the paper and its final contents. Statistical support for the paper and for the study design was provided by the funder (B.G., J.M.). The corresponding author had full access to all study data and had final responsibility for the decision to submit the publication.
Conflict of interest: M.B., H.O., K.R., R.B., C.B., G.K., C.I., D.B., S.K., B.H., J.B. have all received grant support from the study sponsor. B.G. and J.M. are employees of Medtronic.
Acknowledgements
The authors thank Harrison Hudnall and Dedra Fagan (Medtronic, PLC) for their assistance in the preparation of this manuscript.
Appendix
Study committees
Executive committee
The Executive Board consisting of six physicians facilitating.
Members: M. Böhm, J. Brachmann, K. Rybak, G. Klein, R. Bosch, and C. Butter.
Event adjudication committee
The Event Adjudication Committee consisting of three independent physicians to adjudicate events for study objectives and document event classifications.
Members: M. Haass, W. Haverkamp, and S. Stoerk.
The event committee members did not otherwise participate in the study. Medtronic personnel did facilitate the EAC sessions (e.g. statistician, clinical trial leader), but they were not voting members. The EAC was not made aware of the randomization assignment of study subjects.
Data safety monitoring board
An independent Data Safety Monitoring Board has reviewed the interim data analyses as well as periodically reviewed the total incidence of AEs and deaths in this study. The DSMB for this study consisted of members with study-related backgrounds.
Members: S. Anker, K. Swedberg, H. Wellens, L. Tavazzi, and S. Pocock.
Medtronic personnel facilitated the DSMB sessions (e.g. clinical trial leader, statistician), but they were not voting members.
Participating German investigators (Centres)
H. Oswald (Medizinische Hochschule Hannover); J. Brachmann (Klinikum Coburg); K. Rybak (Kardiologische Praxis Dessau); C. Israel (Evangelisches Krankenhaus Bielefeld); S. Käab (Klinikum München-Grosshadern); Chr. Butter (Herzzentrum Bernau); D. Bimmel (St. Marien Hospital Bonn); B. Huegl (Marienhaus Neuwied); Th. Heitzer (Klinikum Dortmund); Y. Seivani (Klinikum Bad Segeberg); R. Bosch (Cardio Centrum Ludwigsburg); D. Puplat (Asklepios Klinik Schwalmstadt); M. Ringwald (Kardiologische Praxis Bruchsal); D. Bänsch (Universitätsklinikum Rostock); M. Böhm (Universitätsklinikum Homburg-Saar); K. Gutleben (Herz- und Diabetes Zentrum Bad Oeynhausen); K. Seidl (Klinikum Ingolstadt); U. Tebbe (Klinikum Lippe-Detmold); K. Mischke (Universitätsklinikum Aachen); Chr. Perings (St. Marien Hospital Lünen); M. Haude (Lukaskrankenhaus Neuss); A. Knapp (Kardiologische Praxis Parchim); B. Zrenner (Krankenhaus Landshut-Achdorf); V. Schächinger (Klinikum Fulda); J. Schmitt (Universitätsklinikum Giessen); S. Willems (Universitätsklinikum Hamburg-Eppendorf); Chr. Stellbrink (Städtisches Klinikum Bielefeld); M. Hinterseer (Klinik Füssen); R. Erbel (Universitätsklinikum Essen); E. Hoffmann (Städtisches Klinikum München-Bogenhausen); C. Felder (Kardiologische Praxis Köln); U. Sechtem (Robert-Bosch Krankenhaus Stuttgart); H. Killat (Kardiologische Praxis Hassloch); M. Sotiriou (Kardiologische Praxis Wiesbaden); J. Schwab (Universitätsklinikum Bonn); S. Kuster (DRK-Krankenhaus Ratzeburg); F. Nagel (Kardiologische Praxis Augsburg); U. Fossmeyer (Kardiologische Praxis Traben-Trabach); S. Ruppert (Kardiologische Praxis Nürtingen); W. Raut (Krankenhaus Buchholz); D. Jäger (Klinikum Friedrichshafen); G. Mentz (Kardiologische Praxis Mainz); J. Schlichting (Kardiologische Praxis Herne); H. Keller (Kardiologische Praxis Coburg); T. Markert (Kardiologische Praxis Gaggenau); R. Jochheim (Kardiologische Praxis Hattingen); K. Jocham (Kardiologische Praxis Memmingen); Th. Muenzel (Universitätsklinikum Mainz); K. Goehl (Klinikum Nürnberg-Süd); H.P. Schultheiss (Charite Berlin); B. Lemke (Märkische Kliniken Lüdenscheid); P. Mahr (Kardiologische Praxis Wiesbaden); Chr. Weiss (Städtisches Klinikum Lüneburg); Th. Wetzel (Kardiologische Praxis Dortmund); J. Stachowitz (St. Vincenz Krankenhaus Paderborn); M. Gawaz (Universitätsklinikum Tübingen); R. Gradaus (Klinikum Kassel); H. Fahlenbrach (Kardiologische Praxis Krefeld); S. Sack (Städtisches Klinikum München-Schwabing); B. Hammer (Kreiskrankenhaus St. Ingbert); J. Rieber (Kardiologische Praxis Leinfelden); G. Metzger (Kardiologische Praxis Bochum); Th. Lawo (Kliniken Bergmannsheil Bochum); S. Brune (Kardiologische Praxis Stade); A. Hummel (Universitätsklinikum Greifswald); R. Cierpka (Kardiologische Praxis Hannover); W. Hartung (Kardiologische Praxis Hannover); U. Gremmler (Kardiologische Praxis Peine); G. Bauer (Kardiologische Praxis Bad Mergentheim); S. Zieger (Kardiologische Praxis Esslingen); W. Haerer (Kardiologische Praxis Ulm); A. Hostert (Kardiologische Praxis Bad Neuenahr); M. Boitz (Kardiologische Praxis Berlin); G. Gola (Kardiologische Praxis Bernau); M. Henrichs (Kardiologische Praxis Rangsdorf); E. Liomin (Kardiologische Praxis Friedrichshafen); N. Schoen (Kardiologische Praxis Mühldorf); S. Helbig (Kardiologische Praxis Nürnberg); K. Droese (Kardiologische Praxis Dortmund); B. Lodde (Kardiologische Praxis Dortmund); W. Landgraf (Kardiologische Praxis Dortmund); Th. Fadgyas (Kardiologische Praxis Dortmund); Chr. Kirsch (St. Josef Krankenhaus Salzkotten).
References
Author notes
Deceased.

