


Abstract
Aims Although two-dimensional-dobutamine stress echocardiography (2D-DSE) is useful for the diagnosis of myocardial ischaemia, it requires the acquisition of multiple cross-sections at each stage. The introduction of new real-time three-dimensional echocardiography (RT3DE) offers rapid acquisition and 3D display of the entire left ventricle (LV). The purpose was to evaluate real-time three-dimensional-dobutamine stress echocardiography (RT3D-DSE) for the diagnosis of ischaemia using exercise 201Tl single-photon emission computed tomography (SPECT) as the reference standard, in comparison with 2D-DSE.
Methods and results We performed DSE in 56 consecutive patients who had undergone SPECT because of suspected ischaemia. 3D images by RT3DE were acquired from the apical window after the acquisition of cross-sectional images at every stage of 2D-DSE. Wall motion analysis in RT3DE was performed from anatomical images by cropping the acquired full volume data sets. Mean scanning time for adequate image acquisition at peak stress by RT3D-DSE was shorter than that by 2D-DSE (29±4 vs. 68±6 s, P<0.0001). RT3DE provided adequate images at success rate of 92% at rest and 89% at peak stress, whereas two-dimensional echocardiography did at 94 and 90%, respectively. The sensitivity, specificity, and accuracy of RT3D-DSE for the detection of coronary artery disease are 86, 80, and 82%, respectively. Those of 2D-DSE are 86, 83, and 84%, respectively. There were no significant differences in the sensitivity, specificity, and accuracy between these two methods (P=1.000).
Conclusion RT3D-DSE offers rapid and simple acquisition of the entire LV wall motion and provides feasible and accurate assessment of myocardial ischaemia.
Introduction
Dobutamine stress echocardiography (DSE) is useful for the diagnosis and prognostic stratification of patients with known or suspected coronary artery disease.1–8 However, conventional two-dimensional echocardiography (2DE) technique has several important practical difficulties involved in the procedure. Multiple cross-sections of the left ventricle (LV) must be obtained from more than one window to visualize all segments of the LV and these must be quickly and accurately obtained to be comparable between stages. If the acquisition of LV images is not completed within the critical time period, important diagnostic information may be lost, resulting in inaccurate interpretations. Consequently, even experienced examiners should be careful if accurate diagnostic DSE by the 2DE technique is to be achieved.9
The recent introduction of a real-time 3D echocardiography (RT3DE) system using a new matrix-array transducer with 3000 active elements has allowed the quick and simple acquisition of 3D data sets and 3D display of the entire LV with improved image quality using a standard ultrasound machine.10 Furthermore, RT3DE enables us to rapid display multiple images in any number of different planes simply by rotating and cropping the acquired 3D data sets. Compared with previous (first generation, prototype) RT3DE, new RT3DE offers comparatively high-quality images not only multiple images in many numbers of different planes but also realistic 3D anatomical images. The purpose of this study was to evaluate DSE using new RT3DE in comparison with DSE by 2DE for the diagnosis of myocardial ischaemia using exercise 201Tl single-photon emission computed tomography (SPECT) as the reference standard.
Methods
Patient population
The study population comprised 56 consecutive patients (46 men; age: 48–84 years; mean age: 69±8 years) who underwent exercise 201Tl SPECT because of suspected myocardial ischaemia. We did not select the patients for image quality. Exclusion criteria were as follows: congestive heart failure, unstable angina, congenital or valvular heart disease, cardiomyopathy, uncontrolled systemic hypertension, myocardial infarction within the preceding 6 months, and cardiac arrhythmia such as atrial fibrillation, second or third degree atrioventricular block, and bundle branch block. Patients' clinical characteristics are listed in Table 1. Informed written consent was obtained from all patients.
Dobutamine stress echocardiography
Patients were studied in the left lateral decubitus position after establishing an intravenous line for dobutamine infusion. Baseline haemodynamic and echocardiographic data were initially collected, and the optimal transducer locations were marked on the patient's chest. Under continuous electrocardiographic monitoring, a standard dobutamine stress protocol was followed with infusions of 5, 10, 20, 30, and 40 µg/kg body weight per minute, over a period of 3 min at each stage. Atropine was given when required. Heart rate and blood pressure were recorded at each stage. Endpoints for the study termination were extensive new wall motion abnormality, attainment of target heart rate (85% of the maximal heart rate predicted for age), or completion of the protocol. Other reasons for terminating the test include significant arrhythmia, such as ventricular tachycardia, hypertension (blood pressure >240/120 mmHg), a decrease in systolic blood pressure of >40 mmHg compared with at baseline, or intolerable symptoms such as chest pain, headache, and nausea.4 All image acquisitions were performed during the last minute of each stage. The acquisitions of 2DE and RT3DE were performed by the same sonographer at baseline and at peak stress.
Two-dimensional echocardiography
2DE images were obtained with a Sonos 5500 (Phillips Medical Systems) with a broad-band S4 transducer (2–4 MHz). A quad-screen format display was created by digitized four-standard imaging planes (parasternal long, short-axis, apical four- and two-chambers) at baseline, during low-dose, peak, and recovery stages of dobutamine stress. These four images were also recorded on digital cineloops at the end of each stage. A side-by-side comparison of wall motion in the digitized images was performed by two experienced investigators without any knowledge of the results from the other tests.
Real-time 3D echocardiography
RT3DE images were obtained with a Sonos 7500 (Phillips Medical Systems) attached with a matrix-array X4 transducer (2–4 MHz) using second harmonic imaging. RT3DE images were acquired from the apical window immediately after the acquisition of 2DE images at each stage by two-dimensional-dobutamine stress echocardiography (2D-DSE). Two reference 2D images were displayed on the screen, helping the operator to position the region of interest with all targets being covered by the imaging volume. After visualizing the reference images, such as apical four- and two-chamber views, full volume data sets of LV were acquired; four conical subvolumes of ∼20°×80° were scanned during seven consecutive heart beats without moving the transducer (Figure 1). Electrocardiographic gating was necessary and, triggered by every other R-wave on the electrocardiogram, the four subvolumes were acquired during the first, third, fifth, and seventh cardiac cycles. These four subvolumes were automatically integrated and entire pyramidal data sets of ∼80°×80° were obtained for the acquisition of the full LV volume. Regional wall motion of the LV was evaluated using cropped planes. First, the acquired pyramidal volumes (anatomical image) were cropped from apex to base along the long-axis of the LV, and short-axis views at various levels were produced (Figure 2A). Next, these volumes were cropped from the inferior wall and the apical four-chamber image (long-axis cut plane) was visualized as the reference. Then the apical two-chamber image and the apical long-axis image were visualized with an inclination of the image plane of ∼10–15°, (Figure 2B). Thus, the various LV anatomical images were obtained from the pyramidal volumetric data sets and using these anatomical images, regional wall motion of LV was assessed by comparing baseline and peak stress images. An example of the detection of ischaemia by real-time three-dimensional-dobutamine stress echocardiography (RT3D-DSE) is illustrated in Figures 3 and 4.
LV wall motion analysis
The success rates of adequate image acquisition by both RT3DE and 2DE were assessed in the following four regions: apical, anteroseptal, inferior, and posterolateral regions (Figure 5). Regions of the mid-base anterior wall and anteroseptum were classified as anteroseptal. Those of the mid-base inferior wall and inferoseptum were classified as inferior regions and those of the mid-base posterior and lateral walls were grouped with the posterolateral regions. The apex was analyzed separately.
In 2DE, the regional wall motion in each of the 16 segments of the LV was assessed. The segments were assigned to a vascular supply on the basis of a previously described model, as recommended by the American Society of Echocardiography.11 For diagnosing myocardial ischaemia, regional LV wall motion abnormalities were assessed in the three territories classified by the three major coronary arteries. Basal to mid-anterior, basal to mid-anteroseptal, mid-septal and apical wall motion abnormalities represented disease in the left anterior descending artery (LAD), basal to mid-inferior and basal septal wall motion abnormalities represented disease in the right coronary artery (RCA), and basal to mid-lateral and basal to mid-posterior wall motion abnormalities represented disease in the left circumflex artery (LCX) (Figure 6).5 In RT3DE, the assessment of regional wall motion abnormalities was based on these 16 segments of the LV similarly to 2DE. Normal or increased LV wall motion during stress was considered to be a normal response to stress. The development of new or worsening of baseline LV wall motion abnormalities in more than two segments during stress was considered to be a sign of ischaemia. The biphasic response was defined as positive for ischaemia in territories with wall motion abnormalities at rest. The development of hyperkinetic wall motion or preservation of wall motion at rest during infusion was defined as response without ischaemia.
Exercise 201Tl SPECT
Exercise 201Tl SPECT was performed as previously described.12,13 Each patient performed symptom-limited exercise on a bicycle ergometer in the sitting position. Before and during exercise, 12-lead electrocardiography and blood pressure were monitored. The workload was 25 or 50 W initially and was increased by 25 W for every 2 min until an endpoint was reached. The endpoints included excessive fatigue, dyspnoea, moderate to severe angina, hypotension, diagnostic ST depression (>1.5 mm horizontal or downsloping at the J point or >2.0 mm upsloping at 80 ms after the J point), or significant arrhythmia. At peak exercise, 201Tl (111 and 74 MBq for patients without and with previous myocardial infarction, respectively) was injected intravenously. Initial images were obtained immediately after the termination of exercise and delayed images were obtained 4 h later.
Patients with previous myocardial infarction were injected with an additional dose of 37 MBq 201Tl at rest immediately after the acquisition of delayed images and the reinjection images were obtained 20 min later. SPECT was performed with a two-detector gamma camera (Vertex, ADAC Laboratories, Milpitas, CA, USA) equipped with low-energy, general purpose collimators, with the detectors set to form a 90° angle. A total of 32 equidistant projections were acquired over 180° from the right anterior oblique to left posterior oblique view at 25 s per projection. A reversible perfusion defect was defined as the 201Tl uptake improvement in any segments in delayed images or reinjection images compared with the initial images. Reversible LV perfusion defects were classified according to the vascular territories of the three major coronary arteries; anterior, septal, and apical defects represented disease in the LAD; inferior defects represented disease in the RCA; and lateral defects represented disease in the LCX.
LV regional wall motion was analyzed visually on a 3D cine-mode endocardial display created with the automatic program that analyzes LV function. Regional wall motion in the initial images was compared with wall motion in the rest images (delayed images without previous myocardial infarction or reinjecton images with previous myocardial infarction) with side-by-side display of 3D cine-mode endocardial images. Worsening of wall motion was defined as worsening in any segments on initial images compared with rest images.
Two experienced observers interpreted both the tomographic images and the LV regional wall motion abnormalities visually without any knowledge of patient clinical information or DSE data. They diagnosed myocardial ischaemia from combined assessment of the perfusion data in exercise 201Tl SPECT and worsening of LV regional wall motion induced by exercise.12,14
Statistical methods
Continuous variables were expressed as the mean value±SD. Continuous variables were compared by use of paired Student's t-test. Sensitivity was defined as the number of true positive tests divided by the total number of patients or territories with myocardial ischaemia by exercise 201Tl SPECT. Specificity was defined as the number of true negative tests divided by the total number of patients or territories without myocardial ischaemia by exercise 201Tl SPECT. Accuracy was defined by the total number of true positive and true negative tests divided by the total number of patients or territories. McNemar test was used for the comparisons of sensitivity, specificity, accuracy, and success rates of adequate image acquisition. A value of P<0.05 was considered significant. All tests were two-sided test.
Results
All the patients completed DSE without serious complications. The clinical data from DSE are shown in Table 2. Nine patients had wall motion abnormalities. Two patients had anterior myocardial infarction, five had inferior myocardial infarction, and two had posterolateral myocardial infarction. All of them had wall motion abnormalities at rest.
Feasibility of 2D-DSE and RT3D-DSE in the diagnosis of myocardial ischaemia
In RT3DE, the frame rate of the acquisition image was 18 Hz in most of the case. A comparison of the acquisition of adequate images between RT3DE and 2DE was performed in each of four regions (apical, anteroseptal, inferior, and posterolateral). Considering all 224 regions among the 56 patients, RT3DE provided adequate images in 207 regions (92%) at baseline and 199 regions (89%) at peak stress. In comparison, 2DE provided adequate images in 211 regions (94%) at baseline and 202 regions (90%) at peak stress. Figure 7 demonstrates the success rate of adequate images at baseline and at peak stress acquired by RT3DE and 2DE in each of four regions. In each region, there were no significant differences in the success rate between RT3DE and 2DE both at baseline and at peak stress (Figure 7).
The mean scanning time at peak stress, measured in 20 randomly selected patients, was 29±4 s by RT3D-DSE compared with a mean scanning time of 68±6 s for a complete 2D-DSE acquisition. The mean scanning time at peak stress by RT3D-DSE was significantly shorter than that by 2D-DSE (P<0.0001).
Diagnosis of myocardial ischaemia by 2D-DSE and RT3D-DSE
Table 3 shows the data from 201Tl SPECT. Twenty-one patients were diagnosed with myocardial ischaemia and of these, 11 patients had single-vessel disease, 9 had double-vessel disease, and 1 had triple-vessel disease. The sensitivity, specificity, and accuracy of DSE for the detection of coronary artery disease are shown in Table 4. The sensitivity, specificity, and accuracy of RT3D-DSE are 86, 80, and 82%, respectively. Those of 2D-DSE are 86, 83, and 84%, respectively. There were no significant difference in the sensitivity, specificity, and accuracy between these two methods (Table 4). Of the 168 major vascular territories in all the patients, myocardial ischaemia was detected in 32 territories. The sensitivity and specificity of RT3D-DSE and 2D-DSE are shown in Table 5. 2D-DSE had a sensitivity of 75% and specificity of 89% for the detection of myocardial ischaemia. In comparison, RT3D-DSE had a sensitivity of 75% and specificity of 88%. There were no significant differences between RT3D-DSE and 2D-DSE in the accuracy of diagnosing myocardial ischaemia in each major vascular territory (Table 5).
Discussion
DSE for the detection of myocardial ischaemia
DSE is a useful method for the diagnosis and prognostic stratification of patients with known or suspected coronary artery disease.1–8 However, conventional 2DE technique requires acquisition of multiple cross-sections from more than one window for the evaluation of wall motion abnormalities in all segments of the LV at each stage during the examination. In addition, operators must acquire the images of the entire LV quickly and accurately to be comparable between stages during 2D-DSE. Thus, even experienced examiners should be careful for accurate diagnostic DSE by 2DE technique. RT3DE technique is relatively simple and easy to learn and can be mastered quickly by operators trained in routine 2DE.
DSE with previous RT3DE
The introduction of a real-time volumetric method, which requires only one cycle for 3D data acquisition, has overcome the problem of prolonged acquisition time.15–19 In previous RT3D-DSE study,20 the 3D imaging allowed more rapid acquisition of the echocardiographic images than 2D imaging. However, 3D data sets were sliced to view only the 2D images of the LV because this method could not visualize the 3D anatomical image immediately after scanning. In addition, the image qualities of first-generation RT3DE was comparatively poor because of relatively low spatial resolution.17,19,21 Consequently, 3D echocardiography has not been widely used for DSE in the clinical practice. Furthermore, in this previous study, the accuracy of RT3DE was not compared with functional myocardial perfusion by SPECT as the reference standard.
Advantages of new generation RT3D-DSE
The introduction of a new generation of RT3DE provides an easy process for both 3D data acquisiton and 3D LV volume analysis with good quality image using a standard ultrasound machine. Our study demonstrated that new RT3D-DSE enabled the acquisition of images of the entire LV from one echo-window without moving the transducer and permits more rapid image acquisition when compared with 2D-DSE. Additionally, the present study showed that new RT3D-DSE provided an equally feasible and accurate assessment of myocardial ischaemia as that provided by 2D-DSE. These results suggested that RT3DE enabled us to perform DSE more rapidly and simply than the usual methods by 2DE. In 2D-DSE, multiple views of the LV must be accurately obtained to be comparable between stages in order to diagnose myocardial ischaemia. In RT3D-DSE, once 3D volumetric data sets are acquired by RT3DE, matching views at baseline and peak stress can be visualized for a precise comparison of the same segments. In this study, there were no significant differences between RT3D-DSE and 2D-DSE in the success rate of adequate images acquisition and in the accuracy of diagnosing myocardial ischaemia. However, the success rate of adequate images acquisition in the apical region tended to higher by RT3DE than by 2DE and in the accuracy of diagnosing myocardial ischaemia in the LAD territory tended to higher by RT3D-DSE than by 2D-DSE. These results suggested that RT3DE could accurately visualize planes for a precise comparison of the same segments in the apical region. Moreover, RT3DE allows analysis of the same segments in details in different planes simply by cropping and rotating the 3D volumetric data sets. Thus, it is possible that myocardial ischaemia can be detected in small regions by RT3D-DSE.
Study limitations
There were several limitations in the study. First, we assessed myocardial ischaemia using exercise 201Tl SPECT as a reference standard. However, assessment of reversible perfusion defects in exercise 201Tl SPECT has low sensitivity and high specificity for the detection of multivessel coronary artery disease and there were some patients with multivessel coronary artery disease in this study. However, in the present study, myocardial ischaemia was diagnosed from the combined assessment of perfusion data in exercise 201Tl SPECT and worsening of LV regional wall motion induced by exercise.12,14 Thus, the sensitivity for diagnosis of myocardial ischaemia by the present SPECT method should be higher than a perfusion-only assessment by SPECT.
Secondly, new generation RT3DE needs four consecutive heartbeats for LV volume calculation because the sector angle is only 20°×80°, whereas the first-generation RT3DE requires only one cardiac cycle for 3D data acquisition. However, the mean scanning time at peak stress within 30 s by RT3DE compared with a mean scanning time >60 s for a complete multiple cross-sectional image acquisition in conventional 2DE. In addition, new generation RT3DE image quality has been improved when compared with previous generation system. We hope that future technical advances will allow real-time acquisition of a wider sector angle, while retaining image qualities.
Conclusions
RT3D-DSE offers more rapid and simpler acquisition of the entire LV wall motion and provides equally feasible and accurate assessment of myocardial ischaemia, compared with 2D-DSE. The shorter study time and simpler technique should allow increased efficiency in performing DSE studies. RT3DE is expected to contribute to the wide spread use of DSE in the clinical setting.
Acknowledgement
We thank Dr Mitsuru Fukui and Mr Nobuo Shirahashi for their considerable assistance with the statistical analysis.
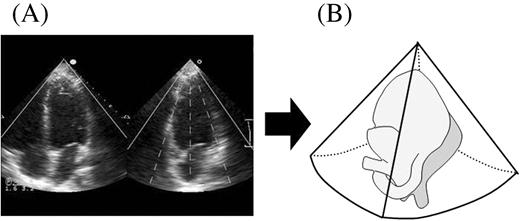
Figure 1 Acquisition of full volume volumetric data sets by new RT3DE. (A) After visualizing reference images, full volume data sets of LV were acquired; four conical subvolumes of ∼20°×80° were scanned during seven consecutive heart beats. (B) These four subvolumes were automatically integrated and entire pyramidal data sets of ∼80°×80° were obtained for acquisition of the full LV volume.
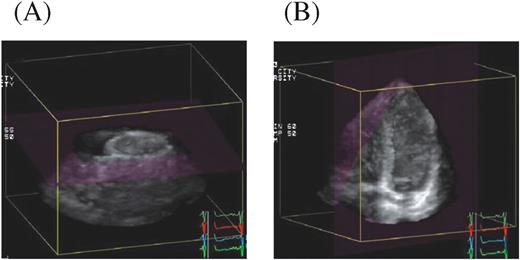
Figure 2 (A) The acquired pyramidal volumes were cropped from apex to the base along the long-axis of the LV, and short-axis views at various levels were produced. (B) These volumes were cropped from the inferior wall, and the apical four-chamber image was visualized as the reference. Then the apical two-chamber image and the apical long-axis image were visualized with an inclination of the image plane of ∼10–15°.
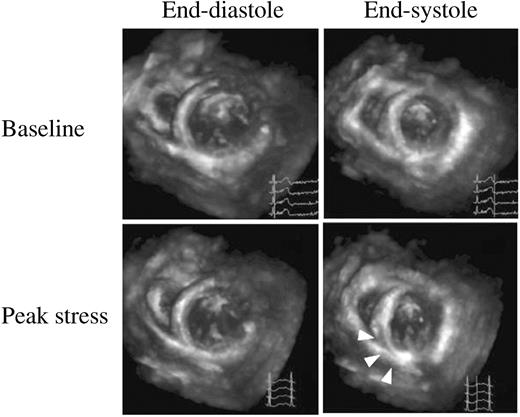
Figure 3 Mid-short-axis views by RT3DE in a patient with myocardial ischaemia; upper series of panels are images at baseline and lower series of panels are those at peak stress. At baseline, LV wall myocardium thickens normally from diastole (left side) to systole (right side). At peak stress, arrows point to the LV abnormality in the inferior wall.
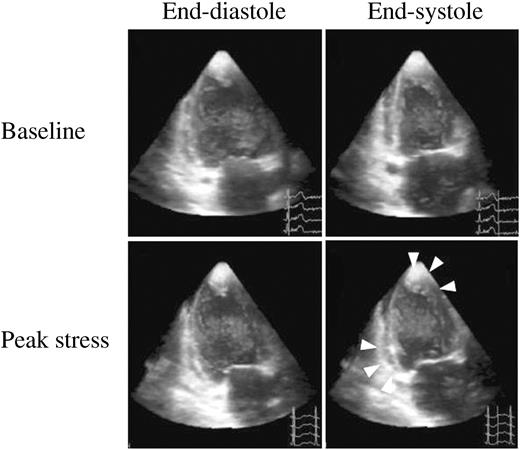
Figure 4 Two-chamber views by RT3DE in the same patient as one of Figure 3; arrows point to the LV abnormality in the inferior wall and in the apex at peak stress.
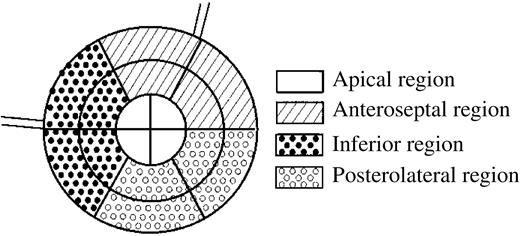
Figure 5 The success rates of adequate image acquisition by both RT3DE and 2DE were assessed in the four regions.
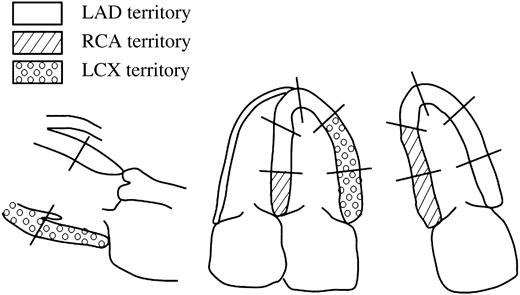
Figure 6 Diagrams show the 16 regional wall segments and distribution of coronary perfusion. Left, long-axis view; middle, apical four-chamber view; right, apical two-chamber view. White areas, LAD; slash areas, RCA; small circle areas, LCX.
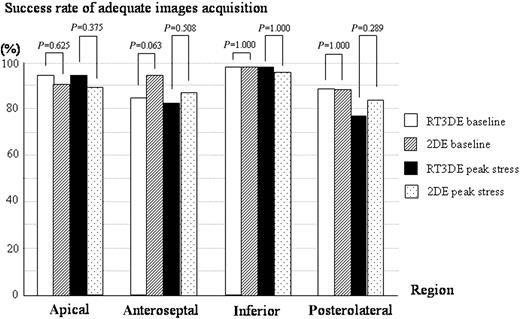
Figure 7 The success rate of adequate images at baseline and at peak stress acquired by RT3DE and 2DE in each of four regions; in each region, there were no significant differences in success rate between RT3DE and 2DE.
Clinical characteristics of 56 study patients
| Characteristics | Data |
|---|---|
| Age (years) | 69±8 |
| Men, n (%) | 46 (82) |
| Height (cm) | 160±8 |
| Weight (kg) | 62±10 |
| Clinical diagnosis, n (%) | |
| Suspected CAD | 38 (68) |
| Known CAD | 18 (32) |
| Previous percutaneous revascularization | 14 (25) |
| Previous coronary artery bypass grafts | 3 (5) |
| Previous myocardial infarction | 9 (16) |
| Location of myocardial infarction | |
| Anterior | 2 (4) |
| Inferior | 5 (9) |
| Posterolateral | 2 (4) |
| Medication, n (%) | |
| Beta-blockers | 17 (30) |
| Nitrates | 22 (39) |
| Calcium channel blockers | 24 (43) |
| Angiotensin-converting enzyme inhibitors | 6 (11) |
| Angiotensin receptor antagonists | 7 (13) |
| Coronary risk factor, n (%) | |
| Diabetes mellitus | 14 (25) |
| Systemic hypertension | 37 (66) |
| Hyperlipidemia | 28 (50) |
| Smoking | 19 (34) |
CAD, coronary artery disease.
DSE data of 56 study patients
| Data | |
|---|---|
| Maximum infusion rate of dobutamine, n (%) | |
| 10 µg/kg per min | 1 (2) |
| 20 µg/kg per min | 2 (4) |
| 30 µg/kg per min | 17 (30) |
| 40 µg/kg per min | 16 (29) |
| 40 µg/kg per min plus atropine | 20 (36) |
| Endpoint, n (%) | |
| New wall motion abnormalities | 8 (14) |
| Attainment of target heart rate | 30 (54) |
| Completion of stress protocol | 6 (11) |
| Intolerable symptoms | 11 (20) |
| Significant arrhythmia | 1 (2) |
| Baseline haemodynamic data | |
| Heart rate (bpm) | 63±11 |
| Systolic blood pressure (mmHg) | 142±24 |
| Pressure-rate product (×1000) | 8.9±2.2 |
| Peak stress haemodynamic data | |
| Heart rate (bpm) | 119±22a |
| Systolic blood pressure (mmHg) | 171±41a |
| Pressure-rate product (×1000) | 20.0±4.9a |
aP<0.0001 vs. baseline data.
Exercise 201Tl SPECT data
| Data, n (%) | |
|---|---|
| Negative for ischaemia | 35 (63) |
| Positive for ischaemia | 21 (38) |
| Single-vessel disease | 11 (20) |
| LAD | 3 |
| RCA | 5 |
| LCX | 3 |
| Double-vessel disease | 9 (16) |
| LAD+RCA | 5 |
| LAD+LCX | 1 |
| RCA+LCX | 3 |
| Triple-vessel disease | 1 (2) |
| Data, n (%) | |
|---|---|
| Negative for ischaemia | 35 (63) |
| Positive for ischaemia | 21 (38) |
| Single-vessel disease | 11 (20) |
| LAD | 3 |
| RCA | 5 |
| LCX | 3 |
| Double-vessel disease | 9 (16) |
| LAD+RCA | 5 |
| LAD+LCX | 1 |
| RCA+LCX | 3 |
| Triple-vessel disease | 1 (2) |
Diagnostic results of RT3D-DSE and 2D-DSE vs. exercise 201Tl SPECT (diagnosis of patient with coronary artery disease)
| 201Tl/SPECTa | 2D-DSE | |
| Positive | Negative | |
| Positive | 18 | 3 |
| Negative | 6 | 29 |
| 201Tl/SPECTb | RT3D-DSE | |
| Positive | Negative | |
| Positive | 18 | 3 |
| Negative | 7 | 28 |
| 2D-DSEc | RT3D-DSE | |
| Positive | Negative | |
| Positive | 18 | 0 |
| Negative | 0 | 3 |
| 2D-DSEd | RT3D-DSE | |
| Positive | Negative | |
| Positive | 4 | 2 |
| Negative | 3 | 26 |
| 2D-DSEe | RT3D-DSE | |
| Positive | Negative | |
| Positive | 22 | 2 |
| Negative | 3 | 29 |
a2D-DSE vs. 201Tl/SPECT: sensitivity, 86% (18/21); specificity, 83% (29/35); accuracy, 84% (47/56).
bRT3D-DSE vs. 201Tl/SPECT: sensitivity, 86% (18/21); specificity, 80% (28/35); accuracy, 82% (46/56).
c2D-DSE vs. RT3D-DSE (sensitivity): McNemar test P=1.000.
d2D-DSE vs. RT3D-DSE (specificity): McNemar test P=1.000.
e2D-DSE vs. RT3D-DSE (accuracy): McNemar test P=1.000.
Sensitivity and specificity of DSE (diagnosis of myocardial ischaemia in the major vascular territories)
| Sensitivity (%) | Specificity (%) | |||||
|---|---|---|---|---|---|---|
| RT3D-DSE | 2D-DSE | P-value | RT3D-DSE | 2D-DSE | P-value | |
| All territories (n=168) | 75 (24/32) | 75 (24/32) | 88 (119/136) | 89 (121/136) | ||
| LAD territory (n=56) | 80 (8/10) | 70 (7/10) | 1.000 | 93 (43/46) | 93 (43/46) | 1.000 |
| RCA territory (n=56) | 79 (11/14) | 79 (11/14) | 1.000 | 93 (39/42) | 90 (38/42) | 1.000 |
| LCX territory (n=56) | 63 (5/8) | 75 (6/8) | 1.000 | 77 (37/48) | 83 (40/48) | 0.508 |
References
Sawada SG, Segar DS, Ryan T, Brown SE, Dohan AM, Williams R, Fineberg NS, Armstrong WF, Feigenbaum H. Echocardiographic detection of coronary artery disease during dobutamine infusion.
Segar DS, Brown SE, Sawada SG, Ryan T, Feigenbaum H. Dobutamine stress echocardiography: correlation with coronary lesion severity as determined by quantitative angiography.
Mazeika PK, Nadazdin A, Oakley CM. Dobutamine stress echocardiography for detection and assessment of coronary artery disease.
Pellikka PA, Roger VL, Oh JK, Miller FA, Seward JB, Tajik AJ. Stress echocardiography. Part II. Dobutamine stress echocardiography: techniques, implementation, clinical applications, and correlations.
Geleijnse ML, Fioretti PM, Roelandt JR. Methodology, feasibility, safety and diagnostic accuracy of dobutamine stress echocardiography.
Sicari R, Picano E, Landi P, Pingitore A, Bigi R, Coletta C, Heyman J, Casazza F, Previtali M, Mathias W Jr, Dodi C, Minardi G, Lowenstein J, Garyfallidis X, Cortigiani L, Morales MA, Raciti M. Prognostic value of dobutamine-atropine stress echocardiography early after acute myocardial infarction. Echo Dobutamine International Cooperative (EDIC) Study.
Chuah SC, Pellikka PA, Roger VL, McCully RB, Seward JB. Role of dobutamine stress echocardiography in predicting outcome in 860 patients with known or suspected coronary artery disease.
Poldermans D, Fioretti PM, Boersma E, Bax JJ, Thomson IR, Roelandt JR, Simoons ML. Long-term prognostic value of dobutamine-atropine stress echocardiography in 1737 patients with known or suspected coronary artery disease: a single-center experience.
Popp R, Agatston A, Armstrong W, Nanda N, Pearlman A, Rakowski H, Seward J, Silverman N, Smith M, Stewart W, Taylor R, Thys D, Davis C. Recommendations for training in performance and interpretation of stress echocardiography. Committee on Physician Training and Education of the American Society of Echocardiography.
Sugeng L, Kirkpatrick J, Lang RM, Bednarz JE, Decara JM, Lammertin G, Spencer KT. Biplane stress echocardiography using a prototype matrix-array transducer.
Schiller NB, Shah PM, Crawford M, DeMaria A, Devereux R, Feigenbaum H, Gutgesell H, Reichek N, Sahn D, Schnittger I, Silverman NH, Tajik AJ. Recommendations for quantitation of the left ventricle by two-dimensional echocardiography. American Society of Echocardiography Committee on Standards, Subcommittee on Quantitation of Two-Dimensional Echocardiograms.
Shirai N, Yamagishi H, Yoshiyama M, Teragaki M, Akioka K, Takeuchi K, Yoshikawa J, Ochi H. Incremental value of assessment of regional wall motion for detection of multivessel coronary artery disease in exercise (201)Tl gated myocardial perfusion imaging.
Yamagishi H, Shirai N, Yoshiyama M, Teragaki M, Akioka K, Takeuchi K, Yoshikawa J, Ochi H. Incremental value of left ventricular ejection fraction for detection of multivessel coronary artery disease in exercise (201)Tl gated myocardial perfusion imaging.
Lima RS, Watson DD, Goode AR, Siadaty MS, Ragosta M, Beller GA, Samady H. Incremental value of combined perfusion and function over perfusion alone by gated SPECT myocardial perfusion imaging for detection of severe three-vessel coronary artery disease.
von Ramm OT, Smith SW. Real time volumetric ultrasound imaging system.
Shiota T, Jones M, Chikada M, Fleishman CE, Castellucci JB, Cotter B, DeMaria AN, von Ramm OT, Kisslo J, Ryan T, Sahn DJ. Real-time three-dimensional echocardiography for determining right ventricular stroke volume in an animal model of chronic right ventricular volume overload.
Kisslo J, Firek B, Ota T, Kang DH, Fleishman CE, Stetten G, Li J, Ohazama CJ, Adams D, Landolfo C, Ryan T, von Ramm O. Real-time volumetric echocardiography: the technology and the possibilities.
Qin JX, Jones M, Shiota T, Greenberg NL, Tsujino H, Firstenberg MS, Gupta PC, Zetts AD, Xu Y, Ping Sun J, Cardon LA, Odabashian JA, Flamm SD, White RD, Panza JA, Thomas JD. Validation of real-time three-dimensional echocardiography for quantifying left ventricular volumes in the presence of a left ventricular aneurysm: in vitro and in vivo studies.
Takuma S, Ota T, Muro T, Hozumi T, Sciacca R, Di Tullio MR, Blood DK, Yoshikawa J, Homma S. Assessment of left ventricular function by real-time 3-dimensional echocardiography compared with conventional noninvasive methods.
Ahmad M, Xie T, McCulloch M, Abreo G, Runge M. Real-time three-dimensional dobutamine stress echocardiography in assessment stress echocardiography in assessment of ischaemia: comparison with two-dimensional dobutamine stress echocardiography.

