


Abstract
Patients with significant tricuspid regurgitation (TR) addressed according the new classification in torrential TR may have different prognosis compared with just severe TR patients. We sought to determine distribution and mechanism of consecutive severe TR patients, in accordance with aetiology and severity by applying the new proposed classification scheme and their long-term outcomes.
Between January and December 2013, 249 patients with significant TR referred to the cardiac imaging unit (mean age 79.9 ± 10.2 years; 29.8% female) were included. Patients were divided according to aetiology in six groups, and TR severity was reclassified into severe, massive, and torrential TR. The follow-up period was of 313 ± 103 days. When considering cardiovascular mortality, patients in the massive/torrential group showed the highest number of events (P < 0.007). Patients with TR due to pulmonary diseases had the worst prognosis according to different aetiology. Noteworthy, the best predictors for the combined endpoint [cardiovascular mortality and readmission admission for heart failure (HF)] were TR severity according to the new classification [hazard ratio (HR) 2.48, 95% confidence interval (CI) 1.25–4.93] and clinical scores such as New York Heart Association classification and congestive status (HR 1.78, 95% CI 1.28–2.49; HR 2.08, 95% CI 1.06–4.06, respectively).
Patients with massive/torrential TR and patients with comorbidities, especially pulmonary disease, were identified as populations at higher risk of death and readmission for HF. New classification scheme and clinical assessment may establish who may benefit the most of intensive therapeutic treatments and intervention on the tricuspid valve.
Introduction
Tricuspid regurgitation (TR) is a frequent finding during echocardiographic examination. Nevertheless, studies addressing differences in grading and management according to aetiology are still lacking. One-year survival for patients with severe TR is reported to be up to 63.9% independently from concomitant condition such as reduced left ventricular ejection fraction (LVEF) or increment of pulmonary artery systolic pressure (PASP).1,2 However, data regarding prognosis significance according to aetiology and quantitative severity assessment are scarce. Surgical correction of isolated TR remains the procedure with the highest mortality among valve surgical procedures.3,4 Thus, data regarding prognosis of different types and grades of TR patients are mandatory in order to better stratify our patients and decide optimal timing for surgery.
Transthoracic echocardiography (TTE) is the main diagnostic tool to determine aetiology and severity of TR and right ventricular (RV) function.5 Quantitative, rather than qualitative, multi-parametric approaches are recommended in assessing the severity of TR, such as estimation of vena contracta (VC), effective regurgitant orifice area, and the area of the regurgitant jet. However, a recent trial on feasibility of transcatheter devices has demonstrated that the current classification of TR could fail in stratifying patients with TR of ‘torrential’ nature, that seem to have a different prognosis compared to just severe TR patients.6 Recently, a new classification by Hahn and Zamorano,7 based on quantitative multi-parametric echocardiographic assessment, has been proposed to better characterize the grading of more than severe TR, including very severe (or massive) as well as torrential.
Along with TR aetiology and severity estimation, TTE is useful to assess RV dimensions and function, helping both to stratify the prognosis and to evaluate the efficacy of repairing techniques.8 Indeed, dysfunction and remodelling of the right ventricle are a recognized hallmark that affects prognosis and severity of TR, especially in patients with functional aetiology.9
The purpose of our study was to evaluate the distribution of consecutive severe TR patients, in accordance with aetiology and severity by applying the new proposed classification (severe, massive, and torrential). Secondarily, we sought to investigate the prognostic implications of severity and aetiology on the with survival rates based on all-cause mortality, cardiovascular mortality, and on the combined endpoint for cardiovascular mortality and hospital admission for heart failure (HF).
Methods
Patient selection
Between January and December 2013, 13 071 consecutive patients underwent a complete TTE with TR evaluation based on qualitative and semi-quantitative parameters performed according to recent guidelines.5
Among them, 249 patients with more than moderate TR were retrospectively included in the study population. Clinical follow-up was performed until December 2014. Patients with atrial or ventricular septal defects, congenital left and/or right valve disease and carcinoid were excluded. Since several patients showed multiple comorbidity that could interfere with the TR mechanism, the identification of TR aetiology was conducted on a comprehensive analysis of clinical history records and echocardiographic findings performed by expert cardiologists, in order to detect the prevailing determinant of tricuspid insufficiency. Six different aetiology groups were determined (Table 1). Group 1 was made up of patients with primary anatomic disease of the tricuspid valve (e.g. prolapse, endocarditis, rheumatic fever). Group 2 collected all the patients with TR with concomitant pulmonary hypertension (PHT) caused by left side heart valve disease (moderate or higher native valve regurgitation/stenosis or prosthetic valve). Group 3 contained patients whose TR was concomitant with a ‘post-capillary PHT’ induced by high left ventricular (LV) filling pressures due to LV dysfunction (either systolic or diastolic). Systolic LV dysfunction was considered when LVEF <40% computed by Biplane Simpson’s formula, whilst diastolic LV dysfunction was defined according recent guidelines.11 Patients with TR associated with ‘pre-capillary PHT’ of groups either 1 or 3, according to the clinical classification of recent guidelines (pulmonary arterial hypertension, PHT due to lung disease, and/or hypoxia),12 were assigned to Group 4. To better discriminate, patients with post-capillary from those with pre-capillary PHT, we applied the algorithm proposed by the recent recommendation on LV diastolic function in patients with myocardial diseases. LV filling pressure were considered elevated (Group 3 ‘post-capillary PHT’) when more than half of the following parameters were abnormal: average E/e’ >14, TR velocity >2.8 m/s, left atrial volume index >34 mL/m2.11 Patients with TR and no PHT, mainly caused by tricuspid annulus dilation, due to either right atrial or ventricular dilation, were defined as Group 5. Lastly, Group 6 merged TR patients with clear leaflet movement restriction caused by lead device (iatrogenic/lead-related TR).
Classification of severe TR according to aetiology
| Aetiology group | Definition |
|---|---|
| Group 1 | Primary affection of the valve |
| Group 2 | Functional regurgitation due to PHT in the context of left valve heart disease (moderate or more left heart valve disease or prosthetic left heart valve) |
| Group 3 | Functional regurgitation due to PHT in the context of left ventricular filling pressure upraise linked to left ventricle dysfunction (LVEF <40% or diastolic dysfunction) |
| Group 4 | Functional regurgitation in the context of Group I or III PHT10 |
| Group 5 | Functional regurgitation due to tricuspid annulus dilatation without PHT |
| Group 6 | Lead-related TR after cardiac device implantation |
LVEF, left ventricular ejection fraction; PHT, pulmonary hypertension; TR, tricuspid regurgitation.
TR severity was evaluated according to recent guidelines and only patients with significant (more than moderate) TR were selected. This group of patients was then reclassified into severe (VC biplane 7–13 mm), massive (VC 14–20 mm), and torrential TR (VC ≥21 mm) (Figure 1).5,10
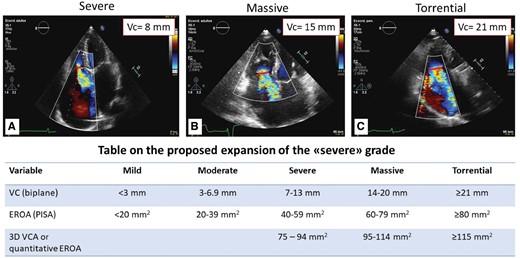
New classification scheme of significant TR. New classification scheme determined by 2D biplane echocardiographic assessment of vena contracta regurgitant volume. Upper panel: vena contracta measurements of (A) severe; (B) massive; (C) torrential TR. Lower panel: table on the proposed expansion of the ‘severe’ grade by Hahn and Zamorano. 3D VCA, three-dimensional vena contracta area; EROA, effective regurgitant orifice area; VC, vena cava. Reproduced with permission from Ref.7
Echocardiography
Comprehensive 2D and Doppler echocardiographic studies were performed on commercially available ultrasound equipment in accordance with the European Association and American Society of Echocardiography Guidelines.5,10,13
To avoid circular shape assumption of the TR jet section, the VC was computed by averaging the measurement of two orthogonal planes (parasternal off axis view for the right ventricle and apical four chamber view). This measurement was available in the 93.1% of the population. In the remaining cases (6.9%), maximal VC was used to assess TR severity.
Assessment of RV systolic function was based on both M-mode analysis of the tricuspid annulus systolic excursion (TAPSE) and fractional area change (FAC). Presence of RV dilation was also determined based on RV basal diameter >42 mm measured in apical four chamber view.
The maximal diameter of tricuspid annulus was measured at end-diastole at insertions of the leaflets, whereas minimal diameter was measured at the same point in end-systole. Tricuspid annulus diameter indexed for body surface area higher than 2.1 cm/m2 were considered dilated.
PASP was estimated by the combination of peak trans-tricuspid gradient on TR signal by continuous-wave Doppler and inferior vena cava size and respiratory variation as indirect measurement on right atrial pressure as previously described.12 Relevant pulmonary arterial hypertension was defined using the cut-off value of 50 mmHg. In case of severe tricuspid annulus dilation and torrential TR the peak of trans-tricuspid gradient of the TR signal were considered not reliable and were not taken into account.
LVEF was calculated using Simpson’s biplane method in the 71% of the population (n = 177). Teicholz’s method was used when biplane method was not available because of bad acoustic window. Left atrial volume was calculated using biplane-area length method. Peak early mitral inflow filling (E-wave) was calculated using pulsed-wave (PW) Doppler performed in the apical four chamber view. PW tissue Doppler imaging was performed in the apical views to acquire mitral annular septal and lateral velocities. Average e´ velocity obtained from the septal and lateral sides of the mitral annulus and was used for the prediction of LV filling pressures.11
Clinical outcomes
Clinical data were obtained from hospital medical and cardiac surgery records. Assessment of congestion was performed at hospital admission in the same day the echocardiography examination was completed. Qualitative score of congestion was recorded if at least one sign of congestion was present during patient examination (peripheral oedema, orthopnoea, and jugular venous distension).14 New York Heart Association (NYHA) functional classification was also assessed at the time of echocardiographic examination. Non-scheduled hospital admissions for HF that brought to treatment adjustment or to tricuspid valve replacement were recorded. Cardiovascular mortality was recorded when cardiovascular causes were found as the triggering cause of death, mainly pulmonary oedema, HF, and acute myocardial infarction. All-cause mortality was also reported.
Statistical analysis
Two separate analysis were performed: according to aetiology and to the new classification scheme. To search for differences among the diverse groups, we used one-way ANOVA comparisons with Bonferroni compensation for multiple analysis. Normally distributed variables are summarized with mean and standard deviation and were evaluated using the Student’s t-test (after undergoing Shapiro–Wilk testing for normality). Categorical variables are expressed as percentages and were analysed using the χ2 or Wilcoxon tests, whether conditions applied.
In the aetiology analysis, two separate log-rank tests were used to explore for differences among survival, comparing the hypothetical best and worst groups against all the others, respectively. In the severity analysis and, in order to empower the comparisons, torrential and massive TR patients where re-clustered as one group, using the log-rank test for survival. Estimates of the effect of different aetiologies and severity grades are expressed as hazard ratios (HRs) base on stratified Cox proportional-hazards models, including 95% confidence intervals (CIs). Time-to-event endpoints were described with Kaplan–Meier estimates.
Multivariate analysis was based on Cox proportional hazards regression. All P-values are two-sided. Analyses were performed using Stata version 14 (STATA Corp., TX, USA).
Results
Demographic and clinical characteristics of the 249 patients with severe TR divided by aetiology group are shown in Table 2. The mean age of our study population was 79.9 ± 10.2 years; 29.8% female gender. Notably, 79% (n = 205) had history of atrial fibrillation but only 37% showed atrial fibrillation at the time of the echocardiographic examination. Most severe TR patients showed to have TR in the context of LV valve disease (Group 2; n = 103) which represents 41.7% of our study population, while the group with lowest number of severe TR was the one with primary tricuspid valve disease. Notably, among patients included in Group 4, namely TR caused by primary PHT, no patients were to impute to Group I PHT. Table 3 shows echocardiographic findings of our study population, divided by aetiology group. The only statistical difference among echocardiographic parameters was the basal diameter of the right ventricle, which was higher in the Group 5 patients, whereas patients of Group 2 showed the smallest RV basal diameters (P < 0.001). Comparison of the echocardiographic examinations between severity groups are shown in Supplementary data online, Table S1.
Distribution and clinical findings in the overall population according to the aetiology group
| Overall population (n = 249) | Group 1 (13/5.2%) | Group 2 (103/41.4%) | Group 3 (40/16%) | Group 4 (43/17.3%) | Group 5 (27/10.8%) | Group 6 (15/6.02%) | |
|---|---|---|---|---|---|---|---|
| Age (years) | 79.9 ± 10.2 | 74.7 ± 9.5 | 80.1 ± 10.5 | 79.8 ± 9.9 | 81.7 ± 8.0 | 80.4 ± 9.9 | 82.5 ± 9.3 |
| Sex (F/M) | 74/174 | 13/_ | 17/86 | 16/24 | 16/27 | 13/14 | 7/8 |
| Patient with congestion (%) | 57.7 | 33.3 | 58.8 | 71.4 | 59.5 | 32 | 76.9 |
| NYHA Class III/IV (n/%) | 72/34 | 2/33 | 31/33 | 17/48 | 19/41 | 3/12 | 4/36 |
| Percentage of massive/torrential TR (n/%) | 27/12 | 3/25 | 11/13 | 3/7 | 3/7 | 2/7 | 4/31 |
NYHA, New York Health Association; TR, tricuspid regurgitation.
Basal echocardiographic parameters according to aetiology
| Overall population | Group 1 | Group 2 | Group 3 | Group 4 | Group 5 | Group 6 | |
|---|---|---|---|---|---|---|---|
| RV basal diameter (mm) | 4.38 ± 0.7 | 4.27 ± 0.7 | 4.24 ± 0.7 | 4.49 ± 0.8 | 4.53 ± 0.6 | 4.41 ± 0.6 | 4.41 ± 0.7 |
| RV middle diameter (mm) | 3.5 ± 0.7 | 3.3 ± 0.7 | 3.3 ± 0.7 | 3.4 ± 0.7 | 3.8 ± 0.6 | 3.6 ± 0.7 | 3.9 ± 0.7 |
| TAPSE (mm) | 1.8 ± 0.4 | 1.9 ± 0.4 | 1.8 ± 0.4 | 1.7 ± 0.4 | 1.7 ± 0.4 | 1.9 ± 0.4 | 1.8 ± 0.4 |
| RV TD area (cm2) | 21.7 ±7.3 | 18.5 ± 6.1 | 19.9 ± 6.1 | 21.1 ± 6.4 | 25.8 ± 7.5 | 20.1 ± 8.8 | 22.9 ± 8.8 |
| RV TS area (cm2) | 13.7 ± 5.1 | 11.2 ± 4.1 | 12.5 ± 4.1 | 13.7 ± 5.3 | 16.9 ± 6.2 | 12.1 ± 5.0 | 14.3 ± 4.1 |
| FAC (%) | 36.8 ± 8.6 | 39.0 ± 12.4 | 36.1 ± 7.4 | 35.6 ± 8.7 | 35.4 ± 9.5 | 39.01 ± 8.5 | 37.75 ± 8 |
| Vena contracta (mm) | 1.03 ± 0.3 | 1.04 ± 0.3 | 1.02 ± 0.3 | 0.99 ± 0.4 | 1.01 ± 0.3 | 1.01 ± 0.34 | 1.30 ± 0.6 |
| RA area (cm2) | 26.5 ± 8.2 | 24.9 ± 7.1 | 26.6 ± 9.4 | 25.6 ± 6.4 | 27.6 ± 8.1 | 26.8 ± 8.5 | 25.8 ± 7.0 |
| Tric annulus (mm) | 3.6 ± 0.6 | 3.4 ± 0.5 | 3.47 ± 0.6 | 3.61 ± 0.6 | 3.6 ± 0.5 | 3.75 ± 0.7 | 3.69 ± 0.5 |
| Tric annulus index (mm/m2) | 2.48 ± 0.39 | 2.48 ± 0.50 | 2.47 ± 0.41 | 2.53 ± 0.40 | 2.39 ± 0.34 | 2.54 ± 0.39 | 2.49 ± 0.36 |
| V max RT (cm/s) | 318.6 ± 58.1 | 290.2 ± 52.1 | 324.5 ± 56.3 | 307.1 ± 54.1 | 351.9 ± 60.4 | 279.9 ± 45.5 | 298.9 ± 40.5 |
| RVSP (mmHg) | 54.2 ±16.6 | 46.6 ± 15.8 | 56.0 ± 16 | 51.2 ± 14.1 | 63.5 ± 17.6 | 41.6 ± 10.1 | 47.7 ± 9.6 |
| LV EDV (mL) | 76.4 ± 31.6 | 61.02 ± 18.6 | 72.1 ± 28.1 | 99.9 ± 40 | 64.65 ± 22.8 | 73.3 ± 29.7 | 80.3 ± 23.7 |
| LV ESV (mL) | 37.7 ± 24.3 | 26.1 ± 9.1 | 32.5 ± 16.2 | 66.4 ± 35.3 | 27.8 ± 13.7 | 30.1 ± 14.6 | 36.1 ± 11.6 |
| LVEF biplane (%) | 53.46 ± 11.1 | 57.7 ± 8.2 | 56.4 ± 6.3 | 39.2 ± 14.4 | 57.8 ± 8.8 | 59.6 ± 6.3 | 54.0 ± 8.5 |
| E velocity (cm/s) | 106.1 ± 34.7 | 102.3 ± 18.1 | 120.5 ± 41.9 | 98.6 ± 28.9 | 99.4 ± 29.8 | 96.6 ± 30.9 | 104.4 ± 29.5 |
| A velocity (cm/s) | 80.2 ± 21.9 | 79.06 ± 15.1 | 81.4 ±18.1 | 82.1 ± 30.7 | 76.7 ± 23.1 | 74.6 ± 8.1 | |
| E/e’ ratio | 14.6 ± 8.4 | 13.0 ± 4.33 | 16.7 ± 11.8 | 17.1 ± 7.7 | 13.2 ± 5.9 | 10.2 ± 3.6 | 15.1 ± 7.5 |
ED, end-diastolic; EDV, end-diastolic volume; EF, ejection fraction; ES, end-systolic; ESV, end-systolic volume; FAC, fractional area change; LV, left ventricle; PASP, pulmonary artery systolic pressure; RA, right atrium; RV, right ventricle; TAPSE, tricuspid annular plane systolic excursion; TR, tricuspid regurgitation.
Due to a lower number of patients with massive and torrential TR vs. severe TR and to give power to the correlation performed, we grouped massive and torrential TR patients (n = 27/12%) and compared these to severe TR patients. Of interest, univariate analysis between severity of TR and parameters of RV systolic function, such as TAPSE and FAC, showed that the degree of RV overload expressed by TR severity was a good predictor of RV systolic dysfunction (P = 0.02 and P = 0.034, respectively). Univariate correlation between TR severity and RV geometry revealed that TR severity expressed by VC was directly related to RV basal diameter (P < 0.0001; r = 0.37) (data not showed).
Patients were followed-up to 1 year after first echocardiographic evaluation (mean follow-up 313 ± 103 days). During the follow-up period, 64 (25.8%) patients died, 28 (43.7%) for cardiovascular reasons, and 87 (35.1%) were readmitted for HF. Mortality for cardiovascular disease at 1 year according to severity of TR patients in the massive/torrential group showed the higher number of events (P = 0.007) (Figure 2A). Furthermore, patients with TR in the massive/torrential group showed worst event-free survival when considering the combined endpoint of cardiovascular mortality and hospital admission for HF (P = 0.012) (Figure 2B). Survival curve comparing massive and torrential TR showed no statistical differences between the two subgroups when considering both all-cause mortality and the combined endpoint cardiovascular mortality and admission for HF (P = 0.20 and P = 0.65, respectively).
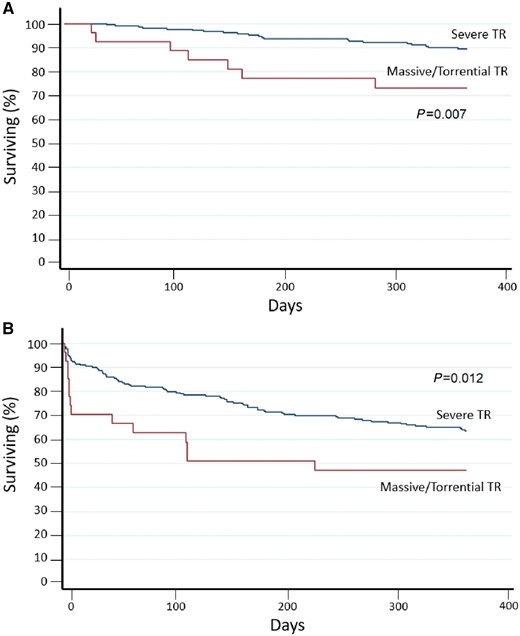
A 1-year follow-up survival curve according to the new classification scheme for TR severity. (A) Kaplan–Meier survival curves for cardiovascular mortality (P < 0.007 for log-rank) and (B) of the combined endpoint for cardiovascular mortality and re-hospitalization (P < 0.012 for log rank) according to new grading scheme for TR severity assessment.
Figure 3 shows the survival curves for cardiovascular mortality according to different etiologist. Patients with TR mainly caused by PHT due to lung disease or primary PHT (Group 4) had the highest number of events, while patients with TR due to annulus dilation without PHT and the one with TR due to device lead interference had the lowest event rate. This data is even more evident, when considering the cardiovascular mortality of all aetiology groups compared to Group 4 (P = 0.003) (Figure 4).
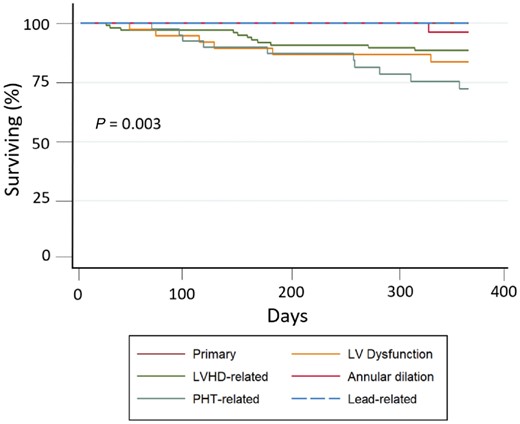
Cardiovascular mortality risk at 1-year follow-up according to TR aetiology. Kaplan–Meier survival curves for cardiovascular mortality according to TR aetiology group.
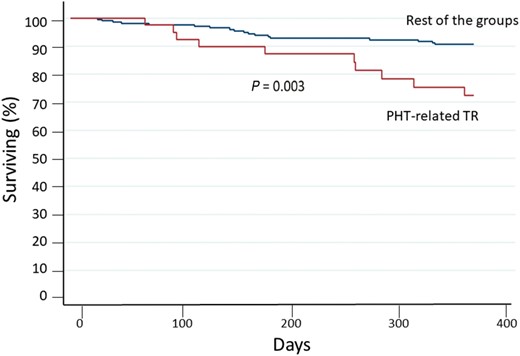
Cardiovascular mortality risk at 1-year follow-up. PHT related TR versus the rest of the groups. Survival curves for cardiovascular mortality of Group 4 compared with the remaining combined group survival.
Conversely, the Kaplan–Meier analysis of all-cause mortality at 1 year based on severity of TR demonstrated that patients in the massive/torrential group showed a non-significant trend (P = 0.068) to suffer more events.
In addition, by dividing for different TR aetiology, the Kaplan–Meier curve for all-cause mortality at 1 year showed that patients in Group 4 still exhibited the worst prognosis (Figure 5; P = 0.004).
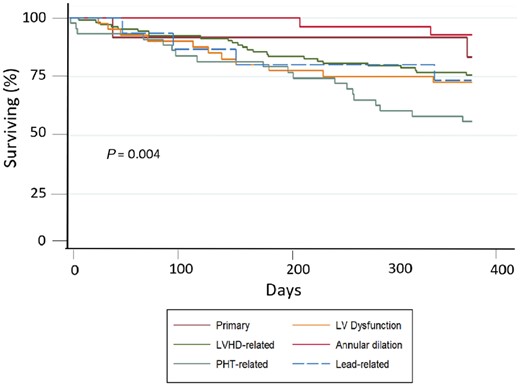
A 1 year follow-up survival curve according to TR aetiology. Kaplan–Meier survival curves for all-cause mortality according to TR aetiology group.
Noteworthy, in the Cox regression analysis the best predictors of the combined endpoint for cardiovascular mortality and hospitalization for HF were NYHA classification, congestive status (HR 1.78, 95% CI 1.28–2.49; HR 2.08, 95% CI 1.06–4.06, respectively), and TR severity according to the new classification (HR 2.48, 95% CI 1.25–4.93), after correction for age, gender, PASP, TAPSE, and LVEF (Table 3).
Discussion
In patients with significant TR, the current grading scheme fails to detect the massive and torrential degree of tricuspid insufficiency. The necessity of a new grading scheme is embedded in the evidence that not all the ‘severe’ grades showed the same outcome, especially in terms of quality of life.6 Nevertheless, the cut-off values proposed to grade significant TR have not been obtained from prognostic study and have been chosen somehow arbitrary. Accordingly, studies designed to identify the ideal cut-off are needed to better stratify the risk in TR patients.
Concerning the distribution of our cohort, we found that most patients with significant TR were male (174/68.9%). As expected, most of TR were identified in Group 2 as consequence of left heart valve diseases, while the group with the smallest number of patients was Group 1 (primary TR), reflecting the TR distribution often reported in literature.15,16 In our study, TR severity seem to correlate well with parameters of RV dysfunction and remodelling assessed with standard echocardiography as already demonstrated in patients with different degrees of isolated TR.17 Most likely, this relationship reflects the strict connection between rearrangement and overload of the RV. These results may have relevant clinical implications, considering that RV volume overload due to a significant TR eventually leads to RV enlargement and dysfunction worsening in turn TR severity. Assessment of progressive RV dilation and systolic dysfunction is crucial for the appropriate timing of surgical correction,15 thus a more reliable grading of TR may help, together with a comprehensive evaluation of RV systolic geometry and function, to better frame the evolution of this heart valve disease. To assess the appropriate timing for valve surgery is of paramount importance considering that the reported survival rate at 3 years is of only 40%.18
Exponential increment in terms of death and readmission were found assessing TR aetiology and severity through a more accurate classification. To the best of our knowledge, this is the first study to address distribution and mid-term prognosis of patients with significant TR according to severity and aetiology.
Previous studies described the relevant influence that TR may have on clinical outcome in valve heart disease, especially after mitral valve interventions6,19 and in isolated TR.17 Of note, Topilsky et al.17 demonstrated that in severe isolated TR survival rate was lower in both all-cause and cardiovascular mortality when compared with patients with less than severe TR.
Our results demonstrated that by re-classifying severe TR according to previously suggested grading,7 into severe, massive, and torrential, we were able to better predict their prognosis (Figure 6). Indeed, in the present study, we observed that patients with massive/torrential TR were at higher risk of readmission for HF and cardiovascular mortality. No differences were found between massive and torrential TR in term of survival. This result may be explained because of the small number of patients in the torrential TR group (n = 3/1.2%). Larger studies are needed to better assess differences in outcome for this two groups.
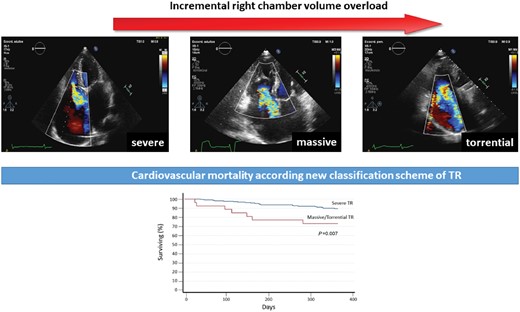
Clinical outcomes of massive/torrential regurgitation according to the new classification scheme in patients with significant TR.
Nevertheless, in clinical practice the relationship between increasing TR severity and important cardiac comorbidities, contributes to the current uncertainties regarding the clinical significance and surgical management of TR, especially in the presence of severe RV or LV dysfunction, or severe PHT.20
In a recent meta-analysis has been demonstrated that TR severity significantly affect prognosis independently from value of PASP. There were 13 studies that specifically adjusted for PASP. Among these 13 studies (n = 5158), moderate/severe TR was associated with a significant increase in risk of all-cause mortality (RR 1.85, 95% CI 1.44–2.39).21
In this study we managed to isolate different causes of TR by dividing aetiology in six different groups and underlined what is the prognostic impact of the mechanism producing the regurgitation.
Indeed, the survival curves for all-cause and cardiovascular mortalities demonstrated that patients with TR associated with PHT had the worst prognosis. Data in line with what was showed by Mutlak et al.22 in a group of 639 patients admitted for acute HF, where the combination of moderate/severe TR and PHT showed the higher risk of readmission or death (HR 1.78, 95% CI 1.34–2.36; P < 0.0001), more than the severity of TR alone (HR 1.17, 95% CI 0.78–1.75; P = 0.40). Of interest, in our study TR patients with pre-capillary PHT (Group 4) appeared to have worse prognosis than the ones with post-capillary PHT both in terms of all-cause mortality, cardiovascular mortality and re-admission for HF. On the contrary, even though patients in Groups 1 and 6 showed few cardiovascular events, given the small number of patients in this two groups, it may need further investigation to clarify their behaviour.
Finally, to seek predictors for combined endpoint of cardiovascular mortality and re-hospitalization for HF gave us some important insight about management and follow-up of this pathological condition. Clinical assessment to address myocardial dysfunction in this subset of patients, such as NYHA class along with congestive status, plays a pivotal role in prediction of long-term outcome. Surprisingly, new TR severity classification was the only echocardiographic finding able to predict cardiovascular mortality in this insidious valve heart disease, independently from age, PHT, and right and left systolic function.
Consequently, we can speculate that this new classification may help the clinician stratify the natural history of severe and more than severe TR, based on quantitative assessment of severity. These results may stimulate future long-term outcome trials, with the purpose of looking at the impact of surgical and non-surgical correction on any TR reduction and its prognostic effect.
Study limitations
There are some limitations in the study that need to be acknowledged. The study population were recruited among the patients referring to a tertiary level hospital and this may cause a bias since this cohort may not represent the overall population.
The retrospective nature of this study limited the grading of significative TR only on the single quantitative parameter that was present in all the echocardiographic exams, such as the VC in all patients and the two orthogonal-plane averaged VC when feasible.5,7 Assessment of valve disease may be limited by changes in load condition that can directly affect severity of regurgitation causing misclassification of the TR severity, especially in case of HF worsening. Furthermore, estimation of PASP based on TR peak velocity in patients with massive and torrential TR may have been unreliable.
Noteworthy, the classification according aetiology may be questionable do to multiple comorbidity. Three-dimensional echocardiography may be pivotal to determine TR mechanism and aetiology, due to the opportunity of the tricuspid apparatus reconstruction and its relationship with the regurgitant jets. Concerning the statistical analysis one-way ANOVA comparisons between the groups with Bonferroni compensation may reduce the Type I error, but the correction may not be sensitive to elude differences between the groups. Furthermore, giving the small number of patients with torrential TR in this cohort, the survival analysis according to severity of TR may be under-powered, for this reason multi-centric registry are needed to better assess differences in terms of outcome when comparing severe, massive and torrential TR.
Conclusion
New TR severity classification and aetiology may allow a better stratification of patients with severe TR. Presence of massive/torrential TR along with TR patients due to PHT show the worst outcomes. Both indicators may help to better stratify the risk of mortality and admission for HF, thus identifying those patients who need close follow-up and early medical or surgery treatments. Future researches are needed to further stratify the natural evolution of severe and more than severe TR. Through the analysis of quantitative echocardiographic parameters any reduction in TR can be accounted as well as its impact on the outcome.
Funding
C.S. is supported by a research grant from the international PhD programme in Cardiovascular Pathophysiology and Therapeutics CardioPath.
Conflict of interest: none declared.
