


Abstract
In hearing adolescents, emotions play important roles in the development of bullying and victimization. Yet, it is unclear whether this also applies to adolescents who are deaf or hard of hearing (DHH). The present study examines the longitudinal associations of anger, fear, guilt, and shame with bullying/victimization in DHH adolescents. Overall, 80 DHH and 227 hearing adolescents (Mage = 11.7; 103 males) completed self-reports on two occasions with a 9-month interval. Outcomes show that DHH adolescents reported fewer bullying behaviors, but more victimization compared to hearing adolescents. Longitudinal relations between emotions and bullying/victimization did not differ between DHH and hearing adolescents. More anger and less guilt predicted increased bullying, and more bullying predicted increased anger and decreased guilt. Higher levels of anger, fear, and shame predicted increased victimization, and more victimization predicted increased anger, fear, and shame. These findings emphasize that emotions are involved in both the emergence and maintenance of bullying and victimization. These outcomes have clinical implications for the prevention of bullying.
Being excluded from group activities, pushed around, or intimidated by classmates are examples of bullying behaviors that occur frequently within the peer context (Nansel et al., 2004). Bullying is defined as harmful and intentional behavior by which the same individual in a weaker position is targeted repeatedly (Olweus, 1997). Bullying rates range from 10% to 25% in school-aged youth and are associated with mental health problems in both the victim and the bully (Nansel et al., 2001; Wolke, Woods, Bloomfield, & Karstadt, 2001). It is therefore important to better understand the underlying emotional mechanisms and consequences of bullying behavior at an age in which bullying is most salient: in early adolescence (Björkqvist, Lagerspetz, & Kaukiainen, 1992).
Some adolescents are at higher risk for social problems such as bullying, and communication impairments especially pose a risk factor. Deaf or hard of hearing (DHH) adolescents are noted in the literature for feeling less socially accepted (van Gent, Goedhart, Knoors, Westenberg, & Treffers, 2012; Wolters, Knoors, Cillessen, & Verhoeven, 2011). There are only a few studies on bullying in DHH adolescents, and these confirm more bullying towards DHH adolescents (Pinquart & Pfeiffer, 2015; Sullivan, 2006; Weiner, Day, & Galvan, 2013). DHH adolescents also show impairments in their emotion regulation and communication (Rieffe, 2012; Zand & Pierce, 2011), which are factors known to be related to bullying and victimization in the hearing population (Garner & Hinton, 2010; Rosen, Milich, & Harris, 2012). Therefore, it is important to examine the extent to which emotional functioning is related to bullying in the DHH population. This will provide a better understanding of the emergence and consequences of bullying in this particular population, as compared to hearing peers.
Emotional Reactivity and Bullying/Victimization
Bullying is a form of aggression, and many children and adolescents who bully show higher levels of anger (Camodeca & Goossens, 2005; Rieffe, Camodeca, Pouw, Lange, & Stockmann, 2012). Some adolescents take out their anger on their peers in the form of bullying, regardless of the reason for their anger (Espelage, Bosworth, & Simon, 2001). Yet, adolescents may see bullying as essential for social survival, and intentionally evoke anger. In other words, higher levels of anger could also be the result of bullying. However, no empirical evidence is supporting this hypothesis yet.
Being bullied is a threatening experience, and causes victims to feel unsafe. Consequently, victims feel primarily anxious about being bullied—again—and about what the bullies may say or do the next time (Rieffe et al., 2012). However, many victims also have higher levels of anger because they consider the bullying to be unfair (Camodeca & Goossens, 2005; Kaynak, Lepore, Kliewer, & Jaggi, 2015; Schwartz, 2000). Some studies have shown that such an overtly reactive response style can be rewarding for the bully, thus encouraging their bullying behaviors (Hanish et al., 2004; Spence, De Young, Toon, & Bond, 2009). This means that adolescents with higher emotional reactivity face higher risk for victimization. In contrast, children who seem emotionally unaffected by bullying are victimized less often (Salmivalli, Karhunen, & Lagerspetz, 1996).
Despite associations between emotional expression and emotional reactivity with bullying and victimization, no studies have yet examined these relationships in DHH youth. Young children largely depend on input from their social environment for learning how to control emotions and in which situations it is better to express or conceal an emotion (Knoors & Marschark, 2015). DHH children with hearing parents (i.e, >90%; Marschark, 1993) are predominantly raised in a spoken language environment, which results in less effective and less frequent communication (Ambrose, Walker, Unflat-Berry, Oleson, & Moeller, 2015; DesJardin et al., 2014). Various studies indeed show that DHH children develop fewer and less efficient strategies for regulating their emotions, and that they show higher levels of emotional expression and emotional reactivity. Wiefferink, Rieffe, Ketelaar & Frijns (2012) examined the level of emotion regulation in a group of DHH children with a cochlear implant, ages 1–5 years old. In this study, hearing parents of DHH children indicated that their children expressed negative emotions more often and with greater intensity compared to their hearing peers. Furthermore, parents of DHH children reported more difficulties calming their DHH child. The same children were also less able to divert their attention to avoid frustration with a task, where the experimenter created a situation in which the children were obstructed from achieving a goal.
These difficulties in emotion regulation seem to persist into adolescence. For instance, DHH youth expressed anger more bluntly in a peer conflict situation than members of a hearing group (Rieffe & Terwogt, 2006). DHH adolescents were less able to think of strategies that could help them control their levels of negative emotions in such a situation, and the negative emotions lingered longer than in hearing adolescents (Rieffe, 2012) Combined, these findings suggest that DHH adolescents have more difficulties downregulating their negative emotions, and are more emotionally expressive in their social interactions. To date, it is yet unknown to what extent these elevated levels of emotional reactivity are related to bullying/victimization in the DHH group, nor do we know the extent to which victimization or bullying contributes to more emotional difficulties in this particular group.
Social Emotions and Bullying/Victimization
Besides the basic emotions of anger and fear, social emotions also play an important role in the emergence of bullying and victimization. Social emotions shape behavior so it fits with the dominant norms and values in a given population (Lewis, 2000; Tracy & Robins, 2004). Guilt usually arises after a morally wrong act that involves harm to another person (Bybee, 1998; Olthof, Schouten, Kuiper, Stegge, & Jennekens-Schinkel, 2000), and the negative feeling of guilt serves to prevent the actor from committing future similar antisocial and harmful actions (Menesini et al., 2003; Olthof, 2012; Thornberg, Pozzoli, Gini, & Jungert, 2015). Cross-sectional studies consistently claim a negative association between guilt and bullying (Mazzone, Camodeca, & Salmivalli, 2016; Menesini et al., 2003; Olthof, 2012), but longitudinal studies that attempt to unravel the direction of this relationship remain scarce. One longitudinal study in adolescents confirms that higher levels of guilt lead to less intentional aggressive behavior, such as bullying. Although it has been argued that bullies need to disengage from and suppress their feelings of guilt in order to justify and approve their actions (Thornberg et al., 2015), longitudinal studies have failed to confirm this (Sticca & Perren, 2015).
In contrast to guilt, shame is not necessarily related to specific harmful acts, but arises when a person feels worthless within the given norms and values of the group (Eisenberg, 2000; Lewis, 2000). This group can be the family or the peer group, and these different social contexts may proscribe different norms and values. In other words, different behaviors may or may not elicit shame, depending on the social context (Olthof et al., 2000). Victims of bullying report higher levels of shame than adolescents who are not being bullied (Menesini & Camodeca, 2008). Longitudinal studies show that shame increases as a consequence of victimization (Duarte, Pinto-Gouveia, & Rodrigues, 2015; Irwin, Li, Craig, & Hollenstein, 2016). Being victimized evidently indicates a lack of acceptance by the peer group, so being a victim may be a humiliating experience. Alternatively, adolescents with shame-proneness may be more vulnerable to victimization, as they appear more defenseless. However, this direction of the causal relationship has not yet been tested. Overall, shame could be an important emotion in the perpetuating of victimization, but empirical evidence to support this claim is as yet only partially available.
For DHH youth, it is more challenging to learn about social emotions (i.e., guilt and shame) than it is for their hearing peers. DHH adolescents often lack full access to communication in social situations, and this kind of access is essential for observing and internalizing social rules, including learning how one is evaluated by others in the light of these rules (Knoors & Marschark, 2015). Ample studies indicate that for DHH children, the ability to take someone else’s perspective (i.e., Theory of Mind development) is impaired (Courtin & Melot, 2005; Meristo et al., 2012; Peterson & Slaughter, 2006). Yet a person can only feel guilty for bullying if he or she is aware of having hurt another person. Similarly, a person can only feel ashamed if he or she fears a negative evaluation by others (Heerey, Keltner, & Capps, 2003).
To the best of our knowledge, only one study examined the actual expression of guilt and shame in a sample of DHH toddlers and preschool children (Ketelaar, Wiefferink, Frijns, Broekhof, & Rieffe, 2015). In this study, feelings of guilt/shame were evoked in three observation tasks. For example, children were led to believe that they failed an easy assignment in one task, and had broken the experimenter’s toy car in another task. DHH children in this experimental study displayed fewer guilt/shame related behaviors, as compared with their hearing peers, and a lower level of social emotions in DHH individuals was also confirmed in an older group. DHH adolescents anticipated lower levels of social emotions in eliciting situations, compared to their hearing peers (Broekhof, Kouwenberg, Oosterveld, Frijns, & Rieffe, 2017). However, it is yet unknown if and how social emotions are related to bullying/victimization in this specific group.
The Present Study
The central aim of this study was to examine the longitudinal associations of emotional experiences with bullying and victimization, in DHH adolescents as compared to their hearing peers. Self-report questionnaires were administered on two occasions with a 9-month interval in between, to two groups: DHH adolescents and hearing adolescents. Two types of emotions were investigated in this study: basic emotions (anger and fear) and social emotions (guilt and shame).
First, we expected more self-reported incidents of victimization in DHH adolescents, as compared to hearing adolescents (Pinquart & Pfeiffer, 2015; Sullivan, 2006; Weiner et al., 2013). However, based on the existing literature, we expected no differences between DHH and hearing adolescents regarding bullying (Bauman & Pero, 2011; Percy-Smith, Caye-Thomasen, Gudman, Jensen, & Thomsen, 2008; Pinquart & Pfeiffer, 2015).
Second, regarding basic emotions, we examined the longitudinal associations of anger and fear with bullying and victimization. We expected more anger to predict higher levels of bullying, and more bullying to predict higher levels of anger (Espelage et al., 2001). We expected both more anger and fear to contribute to the prediction of victimization and more victimization to contribute to more anger and fear (Hanish et al., 2004; Kaynak et al., 2015). These relations were expected to be stronger in DHH adolescents than in the hearing group due to lower levels of emotion regulation already noted in the DHH population (Figure 1A; Rieffe, 2012; Wiefferink et al., 2012).
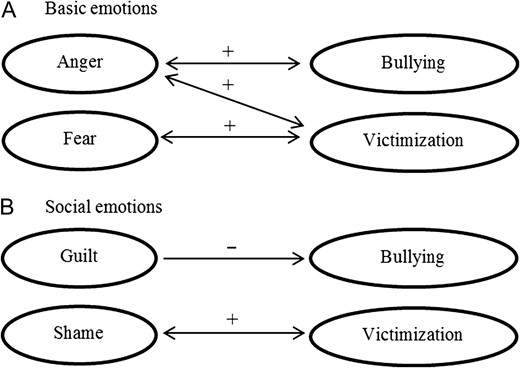
The hypothesized longitudinal relations of (A) basic emotions (i.e., anger and fear) with bullying/victimization and of (B) social emotions (i.e., shame and guilt) with bullying/victimization. The arrows represent either unidirectional or bidirectional relations between variables over time. Positive relations (e.g., an increase of shame will predict an increase in victimization) are indicated by plus signs and negative relations (e.g., an increase in guilt will predict a decrease in bullying) are indicated by minus signs.
Third, regarding social emotions, we expected lower levels of guilt to be associated with more bullying, but we did not expect higher levels of bullying to contribute to lower levels of guilt over time (Sticca & Perren, 2015). In addition, we expected a bidirectional relation of shame with victimization in both groups (Duarte et al., 2015; Irwin et al., 2016). However, due to the lower levels of social emotions that we expected in the DHH groups, we expected these relations to be less strong in the DHH group, as compared to the hearing group (Figure 1B; Ketelaar et al., 2015).
To account for individual differences within the groups, we considered factors that could affect adolescents’ involvement in bullying/victimization. Therefore, the role of personal characteristics, such as age, gender, parental education level, intelligence, language, type of hearing device, and type of school (mainstream or special) were also taken into account, in the above stated hypotheses.
Method
Participants
The current study was part of a large ongoing research project investigating the social–emotional development of typically developing children and children with less access to the social environment, including DHH adolescents and adolescents with an Autism Spectrum disorder (e.g., Kouwenberg, Rieffe, Theunissen, & Oosterveld, 2012; Rieffe, de Bruine, de Rooij, & Stockmann, 2014; Theunissen et al., 2015). For the purpose of the current study, we used the data of DHH and hearing adolescents for whom self-reports were available at least at one point in time. Part of the cross-sectional data (Time 1) on victimization in DHH adolescents was previously published by Kouwenberg and colleagues (2012).
A total of 307 adolescents between 9 and 15 years old (M = 11.71, SD = 1.45) participated in the present study. Overall, 80 DHH participants were recruited from Otorhinolaryngology departments of hospitals, speech and hearing centers, and special schools for DHH pupils in the Netherlands. In addition, advertisements were placed in magazines and on websites with caregivers of DHH adolescents as the target audience. DHH adolescents were included in the study if they had a hearing loss of >40 dB in the better ear that was present before language acquisition. More detailed information on the DHH group is presented in Table 1.
Characteristics of participants
| DHH | Hearing | |
|---|---|---|
| No. of participants | 80 | 227 |
| Mean age in years at Time 1 (SD) | 11.91 (1.62) | 11.63 (1.38) |
| Age range in years at Time 1 | 9.17–15.75 | 9.08–14.75 |
| Gender, n (%) | ||
| Male | 37 (46.3) | 96 (42.3) |
| Female | 43 (53.8) | 131 (57.7) |
| IQ scorea | 10.19 | 10.61 |
| Languagea | 10.29 | 10.32 |
| Parental education levelb | 3.21 | 3.17 |
| Type of education, n (%) | ||
| Mainstream education | 48 (60.0) | 227 |
| Special education | 32 (40.0) | 0 |
| Communication mode, n (%) | ||
| Dutch sign language/sign supported Dutch | 28 (35.0) | |
| Spoken language only | 52 (65.0) | |
| Type of hearing device, n (%) | ||
| Hearing aid | 53 (66.3) | |
| Cochlear implant | 27 (33.3) | |
| Hearing loss in better ear, n (%) | ||
| 40–60 dB | 20 (25.0) | |
| 61–90 dB | 18 (22.5) | |
| >90 dB | 36 (45.0) | |
| Unknown | 6 (7.5) | |
Note. DHH = deaf and hard of hearing.
aFor IQ and language, age-corrected norm scores are presented. The grand population mean is set to 10.
bBased on parental education: 1. no/primary education, 2. lower general secondary education, 3. higher general secondary education, and 4. college/university.
The hearing group consisted of 227 adolescents and was recruited via mainstream schools in the Netherlands. Hearing adolescents did not differ from DHH adolescents in age (Time 1: t(305) = −1.47, p = .142), gender distribution (χ2 (N = 307) = .37, p = .539), IQ score (t(274) = 1.13, p = .259), language (t(252) = .09, p = .932), and parental education level (t(231) = −.45, p = .656). Information on participant characteristics can be found per group in Table 1.
Materials
Personal Characteristics
IQ was assessed using two nonverbal subtests of the Wechsler Intelligence Scale for Children—Third edition (WISC III; Wechsler, 1991). In the block design subtest, participants rearranged red-and-white sided cubes to match a displayed geometrical pattern. In the picture arrangement subtest, participants sequenced cartoon pictures in chronological order. The obtained scores were converted into age-corrected norm scores. The grand population mean was set to 10. The IQ subtests were not administered in 3 DHH and 28 hearing participants due to time constraints. A mean IQ score was calculated based on the two norm scores.
Language abilitywas assessed using two subtests of the Clinical Evaluation of Language Fundamentals—Fourth edition (CELF; Kort, Schittekatte, & Compaan, 2008). In the first subtest on understanding spoken paragraphs, participants were presented with information orally, and asked to answer questions about the content. The second subtest, semantic relations, measured the ability to understand sentences involving comparisons, location, serial order, and time relations. In this subtest participants listened to a sentence (e.g., ‘A man is bigger than...’) and selected two correct answers from four presented alternatives. The obtained scores were converted into age-corrected norm scores (M = 10). Due to time constraints, the language subtests were not administered to 25 DHH and 28 hearing participants. A mean language score was calculated based on the two norm scores.
Parental education level was determined based on maternal and paternal education. Level: 1 = no/primary education, 2 = lower general secondary education, 3 = higher general secondary education, 4 = college/university. Parents were asked to mark the appropriate option and return it to the examiners by e-mail or post. Data were missing for 74 participants (12 DHH and 62 hearing participants) due to nonresponses. A mean of parental education level score was calculated based on the two indicators.
Self-report Questionnaires
The Bully/Victim Questionnaire (Rieffe et al., 2012) was used to measure the level of bullying behaviors in adolescents, and the extent to which adolescents were victimized by others. First, adolescents were presented with a definition of bullying stressing that it occurs repeatedly with the intention to hurt someone who cannot defend him or herself. The questionnaire consisted of nine items representing bullying behaviors (e.g., “Did you hit, push, or kick somebody?” or “Did you ignore a person?”). To assess victimization, adolescents were presented with the same nine items as in the bully questionnaire, but now the formulation of the items was reversed (e.g., “Have you been hit, pushed or kicked”? or “Have you been ignored?”). In addition, one reverse scored item was added: “Are you invited to birthday parties?”. Adolescents were asked to indicate their response on a 3-point scale (1 = [almost] never, 2 = sometimes, and 3 = often). A mean score was calculated and internal reliabilities for this questionnaire were good (Table 2).
Psychometric properties and mean scores of bullying roles and emotions at Time 1 and Time 2 per group
| No. of items | Cronbach’s α | Mean scores (SD) | |||
|---|---|---|---|---|---|
| DHH | H | DHH | H | ||
| Time 1 | |||||
| Bullying | 9 | .68 | .77 | 1.47 (.31) | 1.52 (.33) |
| Victimization | 10 | .82 | .76 | 1.53 (.39) | 1.40 (.31) |
| Anger | 4 | .80 | .81 | 1.40 (.39) | 1.42 (.45) |
| Fear | 4 | .72 | .78 | 1.33 (.40) | 1.32 (.42) |
| Guilt | 6 | .80 | .69 | 2.09 (.51) | 2.35 (.42) |
| Shame | 6 | .81 | .78 | 2.17 (.55) | 2.34 (.49) |
| Time 2 | |||||
| Bullying | 9 | .80 | .79 | 1.45 (.34) | 1.50 (.33) |
| Victimization | 10 | .79 | .75 | 1.44 (.33) | 1.37 (.29) |
| Anger | 4 | .75 | .85 | 1.42 (.39) | 1.45 (.47) |
| Fear | 4 | .74 | .74 | 1.32 (.40) | 1.39 (.43) |
| Guilt | 6 | .78 | .69 | 2.16 (.45) | 2.39 (.40) |
| Shame | 6 | .69 | .68 | 2.31 (.44) | 2.44 (.43) |
Note. H = hearing; DHH = deaf and hard of hearing. Cronbach’s alphas are based on the raw data, since missing scale means were imputed rather than item values.
We performed multigroup confirmatory factor analyses to examine measurement invariance across DHH and hearing adolescents on the Bully Questionnaire and Victim Questionnaire separately. We established configural, metric, and scalar invariance for both questionnaires. This means that we can reliably compare DHH and hearing children. Detailed information on these analyses is available upon request from the first author.
The Brief Shame and Guilt Questionnaire (Novin & Rieffe, 2015) measures guilt and shame proneness in adolescents. The questionnaire consists of twelve short vignettes: six of them were designed to primarily measure guilt (e.g., “There is one biscuit left in the biscuit tin. You quickly put it in your mouth. Now your friend does not have a biscuit”) and the other six to measure shame (e.g., “You get a very bad grade in school”). Adolescents were asked to imagine themselves in the given situation and indicate how guilty or ashamed they would feel on a 3-point-scale (1 = not at all, 2 = a little, and 3 = a lot). Mean scores were calculated per scale and internal reliabilities ranged from acceptable to good (Table 2).
The Mood List (Rieffe, Terwogt, & Bosch, 2004) consists of four mood scales: anger, sadness, fear, and happiness. The anger and fear scales were selected for the purpose of this study. Each scale consists of four emotion words (e.g., furious, mad, afraid, and scared). Adolescents were asked to rate how often they felt this emotion over the last 4 weeks on a 3-point scale (1 = [almost] never, 2 = sometimes, and 3 = often). Mean scores were calculated per scale and internal reliabilities were good (Table 2).
Procedure
The self-report questionnaires were completed by participants on two measurement occasions, Time 1 and Time 2, with 9 months in between. The adolescents were tested individually in a quiet room at home or at school. All questions were presented with a laptop one by one. For members of the DHH group, all written questions were accompanied by an optional video, which provided a translation in sign language. Tests for IQ and language ability were administered at Time 2. Parents were sent a background questionnaire by mail in order to determine parental education level. With parents’ consent, details about the amount of hearing loss and use of cochlear implants or hearing aid (HA) were obtained from medical records. Written parental consent was obtained for all participants. The study was approved by the Ethics Committee of Leiden University.
Statistical Analyses
Data were inspected for missing values, since these could substantially bias results (Graham, 2009). At Time 1, 27 participants had missing values on bullying due to a computer failure to administer the corresponding questionnaire. At Time 2, 31 participants dropped out (10.1%). The dropouts did not differ from the remaining participants in age, gender, and parental education level. The remaining missing values were nonresponses. See Table 1 in the Supplementary Appendix for an overview of the missing data.
The pattern of missing data was examined using Little MCar test (Little, 1988), which indicated that data were not missing completely at random (p < .001). There is no indication that the values are missing non at random, since the reason for a large portion of the missing values is known and not due to the outcome measures. For example, the missing values on the bullying questionnaire in the DHH population are caused by a computer error and the main reason mentioned for dropouts from Time 1 to Time 2 were time constraints. Therefore, we assumed that the missing data were missing at random. This type of missing data assumes that missing values are related to other factors that are measured within the dataset that can help to reconstruct actual values, and is best handled using multiple imputation (van Buuren, 2012). This technique aims to create good estimates of the missing data by entering them multiple times. In this study we made 10 imputation sets to fill in the missing mean scores. The imputations were based on all predictor and outcome variables in this study: bullying, victimization, guilt, shame, anger, fear and personal characteristics (i.e., age at Time 1 and Time 2, gender, group, IQ, language, and parental education level). All missing values reported in Table 1 of the Supplementary Appendix were imputed. All subsequent analyses were conducted on the imputed data and pooled results were reported.
First, two hierarchical regression analyses were performed to examine whether personal characteristics (i.e., age, gender, parental education level, IQ, language) were associated with bullying/victimization. Personal characteristics that were associated with bullying/victimization were subsequently entered in the longitudinal analyses to correct for their effect. For both bullying and victimization, an average of the score of Time 1 and Time 2 was calculated and inserted as a dependent variable. In the first model, group (hearing = 0; DHH = 1), age at Time 1, gender (boy = 0; girl = 1), IQ, language, and parental education level were included in the model. in the second model, the interactions with group were added. All independent variables were centered.
Second, to assess the predictive value of social emotions and basic emotions on bullying and victimization, generalized linear models (GLM) were performed in combination with the clustered bootstrap procedure. Given the longitudinal character of the data, the assumption of independence (required for regression analyses) is violated. The clustered bootstrap procedure accounts for this dependency through resampling, by drawing from all observations of a single person, rather than drawing from single observations (de Rooij, 2013). The GLM with clustered bootstrapping is comparable to a simple linear regression model and makes few distributional assumptions, such as normality of residuals or homoscedasticity. The number of used bootstrap samples was 10,000.
To study the influence of both between- and within-person effects we decomposed anger, fear, guilt, shame, bullying, and victimization into a mean score (M; between persons) and a change score (C; within persons). The mean score is represented by the overall mean score of the two measurement occasions per individual. The individual change score is the deviation around this mean score (i.e., mean score, based on Time 1 and 2, minus the Individual score at either Time 1 or Time 2). In addition, we controlled for three personal characteristics in the GLM analyses; age in months (centered on the youngest participant: 109 months) and a dummy for group (0 = hearing, 1 = DHH), gender (0 = boy, 1 = girl), and language.
To examine the unique contributions of emotions on bullying, we corrected for victimization in the basic model. Likewise, to examine the unique contribution of victimization, we corrected for bullying. In both models, emotions were included only when they were hypothesized to be associated with bullying or victimization (Figure 1).
Following the basic models, we added interaction terms of the mean and change score of each emotion with group (i.e., group × mean anger and group × change anger) to the previous model, one-by-one. Interaction terms were added to the final model, when the interaction with either the mean or the change score was found to be significant. To determine whether a variable contributes significantly to the model, we requested the nonparametric confidence intervals. When zero is not included in the interval, the effect is significant. Note that the GLM with clustered bootstrapping does not give model fit indices.
Subsequently, interactions terms of the mean and change score of bullying roles were added to the final model (i.e., group × mean bullying and group × change bullying and/or group × mean victimization and group × change victimization). The added interactions were only retained when either the interaction with the mean or change effect was significant.
Additionally, several ANOVAs were conducted to compare four groups (i.e., 1. hearing aid, mainstream education; 2. hearing aid, special education, 3. cochlear implant, mainstream education, and 4. cochlear implant, special education) to examine differences in bullying and victimization (i.e., mean score of Time 1 and Time 2). Initially, these comparisons were also performed for amount of hearing loss (mild vs. moderate vs. severe) and communication mode (Dutch sign language/sign supported Dutch vs. spoken language). However, the amount of hearing loss strongly overlaps with the type of hearing device, and type of education strongly overlaps with the communication mode (Table 2 in the Supplementary Appendix). Data on these two subgroups were therefore removed for reasons of clarity. However, Table 3 in the Supplementary Appendix displays detailed participant information on DHH subgroups based on amount of hearing loss and communication mode. Comparisons for these subgroups on bullying and victimization can be seen in Table 3 of the Supplementary Appendix. Additionally, GLMs were not performed separately for each DHH subgroup, due to small sample size.
Missing value analysis, multiple imputation, independent-tests and regression analyses were performed in SPSS version 24.0. For GLM analyses R version 3.3.0 was used in combination with the Clusbootglm function (de Rooij, 2013).
Results
Descriptives
The mean scores for bullying, victimization, anger, fear, guilt, and shame per group are shown in Table 2.
Personal Characteristics Related to Bullying and Victimization
Table 3 presents the hierarchical regression analyses with bullying and victimization as dependent variables. In the regression analysis with bullying (i.e., Mean score of T1 and T2) as dependent variable, gender (0 = boy, 1 = girl) was found to be a predictor, indicating that boys displayed more bullying behaviors than girls (b = −.16, p < .001). Bullying was found to increase with age (b = .03, p = .004). Group, IQ, language, and parental education level were not related to bullying. Adding group interactions in Step 2 did not result in an increase in explained variance (R2 < .01, p = .561).
Regression analyses for personal characteristics on bullying/victimization (average T1 and T2)
| Bullying | Victimization | |||||
|---|---|---|---|---|---|---|
| R2 | B | p | R2 | B | P | |
| Step 1 | .16*** | .11*** | ||||
| Group | −.07 | .067 | .10 | .010 | ||
| Gender | −.16 | <.001 | −.04 | .262 | ||
| Age | .03 | .004 | −.04 | .002 | ||
| IQ | −.01 | .244 | −.01 | .215 | ||
| Language | −.02 | .064 | −.02 | .013 | ||
| Parental education level | −.03 | .233 | .01 | .989 | ||
| Step 2 | ΔR2 < .01, p = .561 | ΔR2 = .02, p = .302 | ||||
Note. In Step 2, four interaction were added; group × age, group × IQ, group × language, and group × parental education level.
Group (hearing = 0; DHH = 1); gender (boy = 0; girl = 1); ns = not significant; *p < .05; **p < .01; ***p ≤ .001.
In the hierarchical regression analysis with victimization (i.e., mean score of T1 and T2) as dependent variable, DHH adolescents were victimized more often (b = .10, p = .010; group: hearing = 0, DHH = 1). In addition, age (b = −.04, p = .002) and language (b = −.02, p = .013) contributed negatively to victimization. Gender, IQ, and parental education level were not associated with victimization. Adding group interactions in Step 2 did not result in an increase in explained variance (R2 = .02, p = .302).
Since age, language, and gender were related to either bullying or victimization, these variables were also included in the subsequent longitudinal analyses.
The Influence of Emotions on Bullying and Victimization
Table 4 shows the regression coefficients of the performed GLM analyses concerning the predictive effect of emotions on bullying and victimization. For both bullying and victimization, the basic models were selected as the best fitting model, because no additional group interaction terms were significant.
Regression coefficients and nonparametric confidence intervals
| Bullying coefficients | CI [2.5–97.5%] | Victimization coefficients | CI [2.5–97.5%] | ||
|---|---|---|---|---|---|
| Intercept | 1.388* | [1.085, 1.684] | Intercept | 0.456* | [0.213, 0.693] |
| Age | 0.004* | [0.002, 0.005] | Age | −0.004* | [−0.006, −0.003] |
| Group | −0.140* | [−0.204, −0.072] | Group | 0.140* | [0.075, 0.210] |
| Gender | −0.101* | [−0.154, −0.047] | Gender | −0.030 | [−0.084, 0.026] |
| Language | −0.008 | [−0.021, 0.004] | Language | −0.012* | [−0.022, −0.002] |
| M Victimization | 0.368* | [0.264, 0.482] | M Bullying | 0.322* | [0.221, 0.424] |
| C Victimization | 0.161* | [0.014, 0.314] | C Bullying | 0.088 | [−0.039, 0.212] |
| M Anger | 0.094* | [0.021, 0.166] | M Anger | 0.083* | [0.005, 0.164] |
| C Anger | 0.123* | [0.027, 0.218] | C Anger | 0.010 | [−0.085, 0.100] |
| M Guilt | −0.161* | [−0.236, −0.088] | M Fear | 0.205* | [0.111, 0.295] |
| C Guilt | −0.040 | [−0.147, 0.070] | C Fear | 0.126* | [0.025, 0.227] |
| M Shame | 0.080* | [0.019, 0.140] | |||
| C Shame | 0.044 | [−0.032, 0.116] |
Note. Group (hearing = 0; DHH = 1); gender (boy = 0; girl = 1); *p < .05; M = mean score; C = change score.
Bullying increased with age (b = .004; 95% CI = .002, .005) and the hearing adolescents were more likely to bully compared to their DHH peers (b = −.140; 95% CI = −.204, −.072). In addition, boys were more likely to bully compared to girls (b = −.101; 95% CI = −.154, −.047). Both the mean and the change score of victimization had an increasing effect on bullying (b = .368; 95% CI = .264, .482; and b = .161; 95% CI = .014, .314, respectively). This indicates that individuals with high scores on bullying showed an increase in victimization (mean effects). The change score indicates that individuals whose bullying behaviors increased over time also showed an increase in victimization. For anger, both the mean and change score of anger had an increasing effect on bullying (b = .094; 95% CI = .021, .166; and b = .123; 95% CI = .027, .218, respectively). In addition, the mean score of guilt had a decreasing effect on bullying (b = −.161; 95% CI = −.236, −.088).
Victimization decreased with age (b = −.004; 95% CI = −.006, −.003), and individuals with lower scores on language were victimized more often (b = −.012; 95% CI = −.022, −.002). A significant effect for group was found (b = .140; 95% CI = .075, .210). DHH adolescents were more likely to be victimized than their hearing peers. The mean score of bullying had an increasing effect on victimization (b = .322; 95% CI = .221, .424). The mean scores of anger, fear, and shame were related to a higher score on victimization (b = .083; 95% CI = .005, .164, b = .205; 95% CI = .111, .295; and b = .080; 95% CI = .019, .140, respectively). In addition, an increase in fear predicted an increase in victimization (b = .126; 95% CI = .025, .227). This indicates that individuals who became more fearful over time reported an increase in victimization.
The Influence of Bullying and Victimization on Emotions
Table 5 shows the regression coefficients of the performed GLM analyses concerning the predictive effect of bullying and victimization on emotions. For the prediction of anger, fear, guilt, and shame the inclusion of interaction terms with group were nonsignificant, therefore, the basic models were selected.
Regression coefficients and nonparametric confidence intervals
| Anger | Fear | Guilt | Shame | |||||
|---|---|---|---|---|---|---|---|---|
| Coefficients | CI | CI | Coefficients | CI | Coefficients | CI | ||
| 2.5–97.5% | 2.5–97.5% | 2.5–97.5% | 2.5–97.5% | |||||
| Intercept | 0.686* | [0.032, 1.038] | [0.335, 0.891] | 2.673* | [2.325, 3.010] | 1.651* | [1.318, 1.965] | |
| Age | 0.001 | [−0.001, 0.003] | 0.001 | [−0.001, 0.003] | 0.002 | [−0.001, 0.004] | 0.005* | [0.002, 0.007] |
| Group | −0.052 | [−0.134, 0.033] | −0.079* | [−0.157, −0.001] | −0.244* | [−0.332, −0.155] | −0.172* | [−0.275, −0.069] |
| Gender | −0.021 | [−0.102, 0.058] | 0.199* | [0.133, 0.268] | 0.144* | [0.069, 0.220] | 0.168* | [0.087, 0.248] |
| Language | −0.003 | [−0.018, 0.012] | −0.005 | [−0.019, 0.008] | 0.025* | [0.009, 0.042] | 0.027* | [0.010, 0.045] |
| M Bullying | 0.213* | [0.047, 0.378] | X | −0.304* | [−0.443, −0.162] | X | ||
| C Bullying | 0.265* | [0.060, 0.472] | X | −0.045 | [−0.240, 0.158] | X | ||
| M Victimization | 0.356* | [0.210, 0.510] | 0.526* | [0.377, 0.686] | X | X | 0.265* | [0.117, 0.416] |
| C Victimization | 0.079 | [−0.134, 0.309] | 0.308* | [0.067, 0.552] | X | X | 0.116 | [−0.087, 0.333] |
Note. Group (hearing = 0; DHH = 1); gender (boy = 0; girl = 1); *p < .05. An X means that these relationships were not included in the model.
For anger, the GLM revealed a significant effect of mean and change score of bullying and mean score of victimization (b = .213; 95% CI = .047, .378; b = .265; 95% CI = .060, .472; and b = .356; 95% CI = .210, .510, respectively). Higher mean scores for bullying and victimization were related to an increase in anger. An increase in bullying was related to an increase in anger.
For fear, an effect for gender was found (b = .199; 95% CI = .133, .268), indicating that girls had higher levels of fear compared to boys. Additionally, DHH adolescents reported less fear than their hearing peers (b = −.079; 95% CI = −.157, −.001). Both significant mean and change effects for victimization were found (b = .526; 95% CI = .377, .686; and b = .308; 95% CI = .067, .552, respectively), indicating that higher levels of victimization lead to more fear, and that when victimization increased, the level of fear also increased.
Guilt and shame were found to increase with language (b = .025; 95% CI = −.009, .042; and b = .027′; 95% CI = .010, .045, respectively) and a significant effect was found for group (b = −.244; 95% CI = −.332, −.155; and b = −.172; 95% CI = −.275, −.069, respectively), indicating that DHH adolescents reported lower levels of these emotions. Both guilt and shame were more often reported by girls than boys (b = .144; 95% CI = .069, .220; and b = .168; 95% CI = .087, .248, respectively). In addition, shame was found to increase with age (b = .005; 95% CI = .002, .007). For guilt, a significant effect was found for the Mean score of bullying (b = −.304; 95% CI = −.443, −.162), indicating that bullying is related to a decrease in guilt. The mean score of victimization was related to an increase in shame (b = .265; 95% CI = .117, .416), indicating that victimization is related to an increase in shame.
Group differences within DHH subgroups
For a detailed overview of the DHH group, we examined whether different DHH subgroups (i.e., type of education by type of hearing device) differed in personal characteristics: age, gender distribution, IQ, language, and parental education level. See Table 2 in the Supplementary Appendix for detailed participant information per DHH subgroup.
A one-way ANOVA was conducted to compare four subgroups of DHH adolescents, depending on their hearing device (HA vs. cochlear implant) and type of education (mainstream vs. special education) for their scores on bullying and victimization (Table 6). The outcomes indicated that adolescents with a HA in special education reported more victimization than the HA group in mainstream education (Bonferroni correction applied). No other group differences were found.
Means (T1/T2) of bullying and victimization per DHH group by hearing device and type of education
| Hearing aid | Cochlear implant | |||
|---|---|---|---|---|
| Mainstream education | Special education | Mainstream education | Special education | |
| No. of participants | 32 | 21 | 16 | 11 |
| Bullying | 1.39 | 1.60 | 1.43 | 1.44 |
| Victimization | 1.38a | 1.69b | 1.48ab | 1.42ab |
| Hearing aid | Cochlear implant | |||
|---|---|---|---|---|
| Mainstream education | Special education | Mainstream education | Special education | |
| No. of participants | 32 | 21 | 16 | 11 |
| Bullying | 1.39 | 1.60 | 1.43 | 1.44 |
| Victimization | 1.38a | 1.69b | 1.48ab | 1.42ab |
Note. Letter superscripts indicate significant differences between the DHH subgroups for that variable, p < .05.
Discussion
This study assessed how emotional experience is related to bullying and victimization over time in DHH and hearing adolescents. Importantly, the relations that we found were irrespective of hearing status. As expected, higher levels of anger and lower levels of guilt contributed to more bullying nine months later. In turn, higher levels of bullying contributed to higher levels of anger and less guilt over time. Regarding victimization, adolescents who reported higher levels of fear, anger, and shame were also bullied more often when they were questioned again nine months later; also these relationships were reciprocal. Moreover, adolescents who bullied more over time, increased in anger; and, increased anger was related to more bullying. This kind of reciprocal relationship also appeared for fear and victimization. We will discuss the theoretical and practical implications of our findings below.
First, the fact that the relationships for emotional functioning and bullying/victimization did not differ between the DHH and hearing groups suggests that the developmental patterns for bullying and victimization are similar, although mean scores differed between adolescents with or without hearing loss. Hearing adolescents reported higher levels of bullying, versus higher levels of victimization in the DHH population. Yet, further inspection revealed that especially DHH adolescents with a HA in special education felt victimized more often. To date, there are only a few studies on bullying in DHH adolescents, but those studies confirm more victimization specifically for DHH children in special education (Pinquart & Pfeiffer, 2015; Sullivan, 2006; Weiner et al., 2013). Note that especially DHH adolescents with more emotional, behavioral and language problems go to special education, which could also explain higher levels of victimization. In addition, DHH children with a cochlear implant might have better auditory input in combination with a much more extended rehabilitation program for the child and the family, compared to DHH adolescents with a HA (McConkey-Robbins, 2000). But the subsamples in our study were relatively small and only give an indication of possible differences between these groups. Future studies should look into this issue more closely. Since higher language levels protected against victimization, differences in language levels between these subgroups might have also affected these outcomes. Specifically, DHH adolescents in special education displayed lower levels of language.
Second, the literature is scant on empirical evidence regarding reciprocal relationships between emotion experience and bullying/victimization. Interestingly, this study not only confirmed the importance of anger and fear, but also the social emotions of guilt and shame on the development of bullying and victimization. The outcomes showed that all relationships went both ways. Regarding victimization, these outcomes were, as expected, based on the existing literature: stronger emotional reactivity (fear and anger) and higher levels of shame could make an adolescent an easy and rewarding target for a bully. Conversely, being bullied can create feelings of shame for being judged and devaluated by peers, and for appearing with an unwanted identity; but it may also evoke fear of being harassed again and anger about the injustice (Duarte et al., 2015; Irwin et al., 2016). Regarding bullying, the literature to date has shown that higher levels of anger and lower levels of guilt result in more bullying behavior (Espelage et al., 2001; Sticca & Perren, 2015). More importantly, we identified opposite patterns: bullying seems to lead to higher levels of anger and lower levels of guilt over time. This supports the “desensitization theory,” which states that repeated exposure to or participation in aggressive behaviors can make the individual insensitive to aggression and to the harm it can cause the victim (Bushman & Anderson, 2009; Thomas, Horton, Lippincott, & Drabman, 1977). It is possible that higher levels of anger and lower levels of guilt make the aggressor feel more justified about his or her acts of aggression (Mazzone et al., 2016; Thornberg et al., 2015).
This study has several strengths: a large sample size of DHH adolescents, two measurement points, and statistical analyses that can account for challenges associated with longitudinal data, such as missing values and dependency between variables. Moreover, it provides evidence for the reciprocal, longitudinal effects of emotions on behavior, which is a novelty in research on the field of bullying. There are also some limitations that should be noted. First, this study included measurements for the general experience of basic and social emotions, as opposed to those aimed at bullying/victimization situations in particular. Second, the chosen age range was very appropriate because bullying behaviors are most prevalent in this period of life (Björkqvist et al., 1992; Solberg & Olweus, 2003). However, bully or victim roles may be established at an earlier age.
In conclusion, we did find that DHH adolescents are victims of bully behavior more often than their hearing peers, yet the development of bullying/victimization in relation to basic and social emotions occurred in the same way, regardless of hearing status. Emotions play an important role in the emergence and consequences of bullying/victimization, and this points to the importance of developing an adaptive and varied pattern of emotion regulation strategies for youth with and without hearing loss. A next step in this line of research would be to examine the extent to which intervention programs developed to tackle bullying will also work for the DHH population, or whether special adaptations would be necessary.
Teachers confronted with bullying and/or victimization in their classroom could pay more attention to an emotionally open climate in their classroom, in which children respect and allow each other’s emotions in various social situations. For example, the steps described in emotional coaching by Gottman and DeClaire (1997), although focused on the parent–child relationship, might also be effective in a classroom. These steps of emotional coaching emphasize the importance of giving space to another child’s feelings, but also appreciating these feelings, and responding adaptively to them. Appreciating the fact that different peers can have different perspectives and consequent feelings in the same (conflict) situation, will enhance adaptive emotion communication. This will prevent emotions rising too high, or prevent continuation of intense (negative) feelings. The positive effects from improved emotion regulation and communication in the classroom between peers on bullying/victimization should be considered in future studies.
Supplementary Data
Supplementary data is available at Journal of Deaf Studies and Deaf Education online.
Funding
The project was supported by the Innovational Research Incentives Scheme (a VIDI grant) by the Netherlands Organization for Scientific Research (NWO), no. 452-07-004 to Carolien Rieffe.
Conflicts of interest
No conflicts of interest were reported.
Acknowledgements
The authors thank all participating children, parents, and schools. In addition, we thank Jennifer Schoerke for correcting our English.
